Article

A Mathematical Methodology for the Detection of Rail Corrugation Based on Acoustic Analysis: Toward Autonomous Operation

by
César Ricardo Soto-Ocampo
1,*,
Juan David Cano-Moreno
2,
Joaquín Maroto
1 and
José Manuel Mera
1
1
Railway Technology Research Center (Centro de Investigación en Tecnología Ferroviaria-CITEF), Mechanical Engineering Department, Universidad Politécnica de Madrid, 2 José Gutiérrez Abascal Street, 28006 Madrid, Spain
2
Escuela Técnica Superior de Ingeniería y Diseño Industrial, Universidad Politécnica de Madrid, 28012 Madrid, Spain
*
Author to whom correspondence should be addressed.
Mathematics 2025, 13(17), 2815; https://doi.org/10.3390/math13172815
Submission received: 30 July 2025 / Revised: 20 August 2025 / Accepted: 29 August 2025 / Published: 1 September 2025

Abstract

In autonomous railway systems, where there is no driver acting as the primary fault detector, annoying interior noise caused by track defects can go unnoticed for long periods. One of the main contributors to this phenomenon is rail corrugation, a recurring defect that generates vibrations and acoustic emissions, directly affecting passenger comfort and accelerating infrastructure deterioration. This work presents a methodology for the automatic detection of corrugated track sections, based on the mathematical modeling of the spectral content of onboard-recorded acoustic signals. The hypothesis is that these defects produce characteristic peaks in the frequency domain, whose position depends on speed but whose wavelength remains constant. The novelty of the proposed approach lies in the formulation of two functional spectral indices—IIAPD (permissive) and EWISI (restrictive)—that combine power spectral density (PSD) and fast Fourier transform (FFT) analysis over spatial windows, incorporating adaptive frequency bands and dynamic prominence thresholds according to train speed. This enables robust detection without manual intervention or subjective interpretation. The methodology was validated under real operating conditions on a commercially operated metro line and compared with two reference techniques. The results show that the proposed approach achieved up to 19% higher diagnostic accuracy compared to the best-performing reference method, maintaining consistent detection performance across all evaluated speeds. These results demonstrate the robustness and applicability of the method for integration into autonomous trains as an onboard diagnostic system, enabling reliable, continuous monitoring of rail corrugation severity using reproducible mathematical metrics.

1. Introduction

The incorporation of autonomous trains into railway networks has transformed traditional operation and maintenance schemes. In conventional trains, the driver plays a key role as the first fault detector by perceiving abnormal noises or vibrations. However, in driverless trains, this sensory capability disappears, requiring the development of onboard systems capable of identifying and reporting irregularities automatically and in real time.
One of the most frequent and problematic defects in railway tracks is rail corrugation, a periodic irregularity that generates vibrations, accelerated wear, and annoying noise inside the train [1,2,3,4]. This wavy pattern presents wavelengths ranging from 20 to 1200 mm, with typical excitation frequencies between 30 and 2000 Hz [5,6]. The presence of this defect not only compromises operational safety and maintenance but also directly deteriorates the acoustic comfort perceived by passengers [7,8].
Several studies have addressed the impact of interior noise on user health and experience [9,10]. However, most research related to railway noise has focused on its external propagation [11,12,13,14,15], partly thanks to models such as TWINS [16,17,18]. In contrast to these approaches, internal acoustic perception—especially under real operating conditions—has received less attention. Recent reviews, such as “A Review of Acoustic Signal-Based Detection of Damage in Railway Tracks” [19], have highlighted the relevance of acoustic signal analysis for structural health monitoring in railways, summarizing existing methods, challenges, and technological trends. In parallel, Yao et al. [20] delved into how the non-uniform characteristics of the railway substructure influence the propagation of train vibrations using advanced numerical methods, highlighting the need for more realistic models to understand vibrational phenomena in modern railway systems.
Although standardized methods and commercial equipment for measuring rail roughness (such as profilometers or trolley systems) exist, they do not reliably predict which areas will generate annoying noise inside a train [21]. Moreover, short-wavelength defects, such as those of 25–30 mm, may go undetected or even be amplified after standard grinding processes [22].
To address these limitations, several approaches have proposed instrumented detection techniques. Mori et al. [23] used vehicles equipped with GPS sensors, accelerometers, gyroscopes, and microphones, applying wavelet transforms to locate defects. Xiao et al. [24] proposed an approach for heavy-haul railway corrugation diagnosis that combines wavelet packet decomposition and adaptive short-time Fourier transform with support vector machines, demonstrating the feasibility of hybrid time–frequency and AI-based analysis for corrugation detection under varying operating conditions. Jian et al. [25] studied the impact of short-wavelength corrugation on interior noise, proposing stricter limits than those established by ISO 3095 [26]. More recently, Shafique et al. [27] proposed an AI-based method for detecting railway track faults from onboard acoustic recordings, demonstrating high accuracy when sufficient labeled data are available. In addition, AI-driven acoustic monitoring has been integrated into IoT frameworks for real-time railway fault detection and localization using wireless communication technologies [28]. The potential of pattern recognition on acoustic data is also supported by evidence from other fields, such as healthcare, where deep learning architectures have achieved high diagnostic accuracy in respiratory disease detection using lung sound recordings [29]. De Rosa et al. [30], in turn, proposed a methodology based on vertical acceleration spectrograms represented as a function of wavelength, allowing the identification of critical areas through sustained energy patterns. However, their interpretation depends on the analyst’s experience and presents limitations under variable dynamic conditions.
Other studies have addressed correlations between dynamic parameters and roughness [21,31,32] or have relied on simulations to identify defects using spectral analysis of accelerations [33]. Along these lines, specific indices have been developed to quantify the severity of corrugation based on structural accelerations [34], as well as spectral methods to study the growth of corrugation by tracking energy in moving windows [35]. Particularly for short-pitch corrugation, indirect detection techniques based on onboard acoustic recordings have proven effective in field tests, confirming the viability of sound-based monitoring for this defect type [36]. However, operational challenges persist. Khan and Burdzikc [37] highlighted the lack of integration between data acquisition and analysis, limiting the usefulness of these techniques in driverless operations.
In this context, an automatic diagnostic methodology for rail corrugation is proposed, based on the spectral analysis of onboard-recorded acoustic signals. The central hypothesis suggests that defects induce localized peaks in the frequency domain, whose position depends on speed, but whose wavelength remains constant [21,31,32]. The methodology is structured around two indices, namely, a permissive one (IIAPD) and a restrictive one (EWISI), designed to detect both extended and localized severe defects.
The approach has been validated on a real track section with recordings under operational conditions at different speeds and has been compared against visual inspection and reference methodologies. Its structure is suitable for future integration into autonomous trains as an onboard monitoring system, forming a mobile sensor network capable of identifying critical areas without human intervention. This vision aligns with emerging strategies that advocate for comprehensive planning of railway services based on demand, sensors, and intelligent algorithms [38], aimed at optimizing both maintenance and operational management in automated environments. The objective of this work is to design and validate an automatic methodology capable of detecting corrugation defects at different operational speeds using onboard recorded acoustic data.
Although the methodology proposed in this work is deterministic and does not require prior model training, it is fully compatible with future AI-based approaches. In fact, recent works (e.g., Shafique et al. [27]) demonstrate the potential of pattern recognition on acoustic data. Building upon our reproducible spectral indices, future research will explore hybrid schemes that integrate deterministic and AI-based methods for enhanced corrugation detection.

2. Research Methodology

The development of the proposed methodology for automatic rail corrugation detection was carried out in three main phases: (1) data acquisition under controlled operational conditions, (2) preliminary characterization of acoustic patterns associated with corrugation, and (3) implementation of the detection algorithm using the proposed spectral indices. The collection of operational data was transversal to all phases, providing the necessary foundation for both the exploratory analysis and the automated implementation. Figure 1 summarizes the logical sequence from data capture to automated severity estimation.

2.1. Data Capture

2.1.1. Experimental Design

The experimental design was carried out on a railway section between Stations 1 and 2, covering kilometer points (Pk) 3.798 to 6.246. During the tests, runs were performed at different speeds, including the train’s nominal operating speed (75 km/h) and reduced speeds of 60, 50, and 40 km/h. The nominal operating speed corresponds to the normal commercial service conditions of the line, while the reduced speeds were intentionally selected to represent realistic scenarios where operational constraints—such as traffic density, temporary speed restrictions, maintenance activities, or specific scheduling requirements—may require trains to operate below nominal speed. This approach allowed for the evaluation of dynamic and acoustic signal behavior under different excitation levels, ensuring a detailed and representative analysis for the development of the automated methodology.
The tests were conducted in both directions along the same track section. The recordings at 75 and 50 km/h correspond to the Station 1–Station 2 route, while the runs at 60 and 40 km/h were performed in the opposite direction. Although the data were later aligned based on kilometer position (Pk) to ensure spatial comparability of the results, it is acknowledged that the direction of travel may introduce spectral variations, which will be discussed in detail in Section 3.

2.1.2. Instrumentation and Data Acquisition

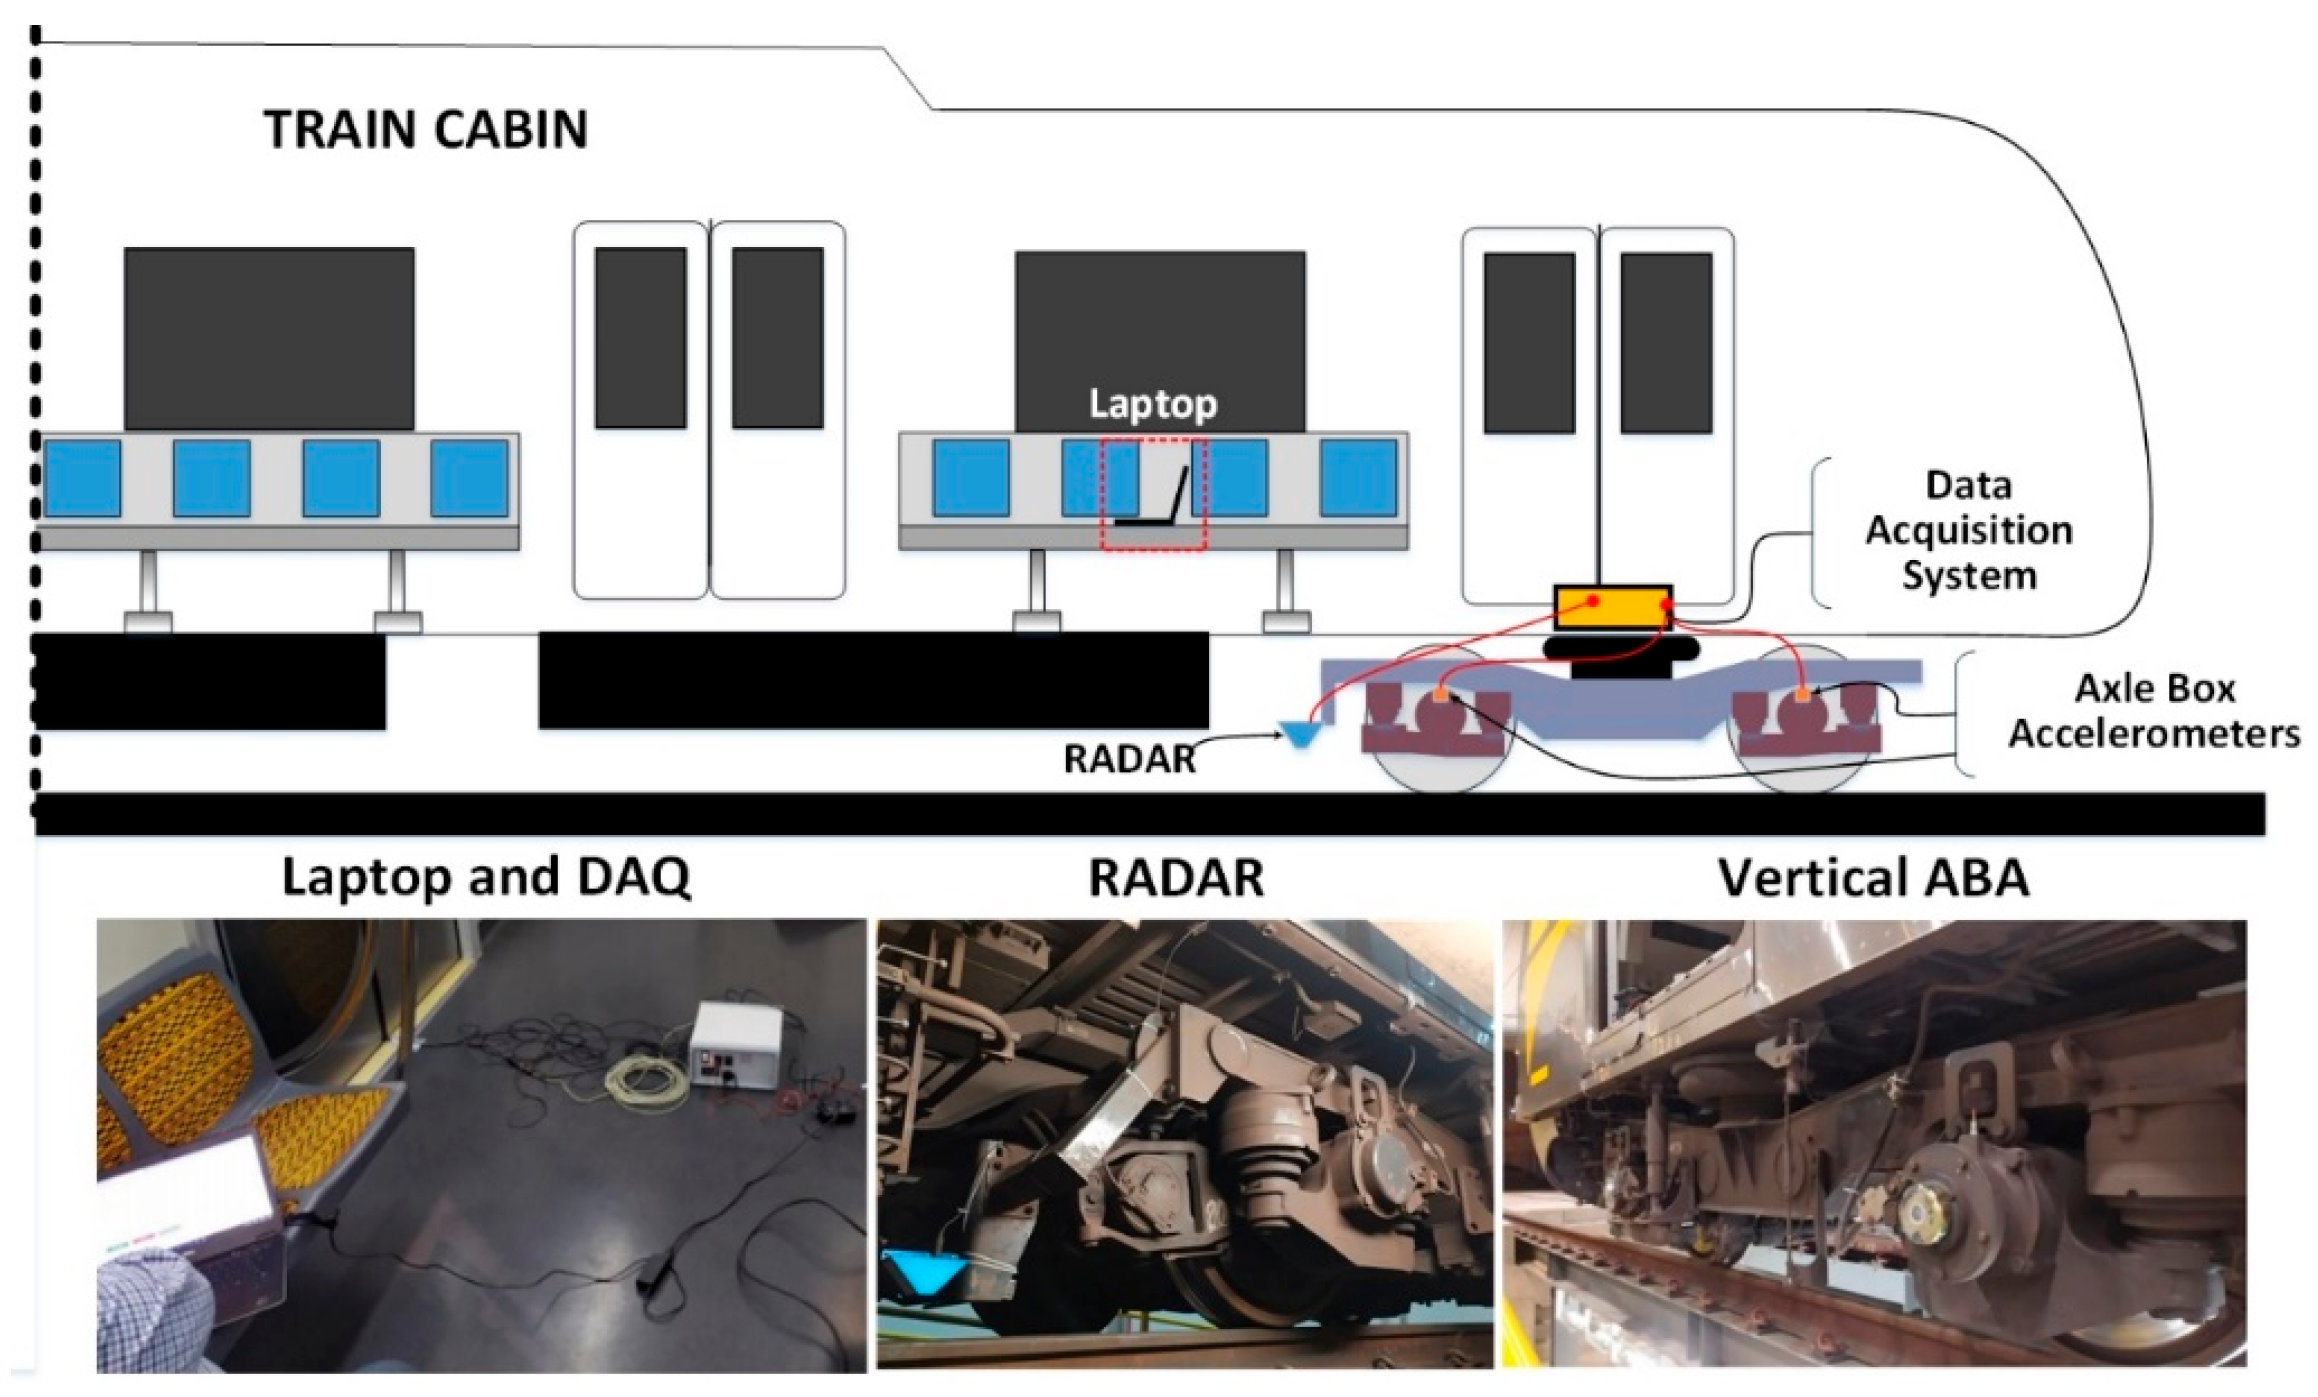
The train was instrumented with a data acquisition system (DAS) and a laptop computer. The DAS, based on the architecture proposed by Cano-Moreno et al. [39], was adapted by replacing the Odroid board with a Raspberry Pi 3B (Figure 2). This system recorded vertical acceleration at the axleboxes of the two axles of the front bogie, as well as the train’s linear speed, using a GSS15C Doppler sensor installed on the bogie frame.
The accelerometers we used were the piezoelectric type (KS-76C-100), with a sensitivity of 100 mV/g and a range of ±60 g. The signals were conditioned using IEPE modules (M33) and filtered with a 10 kHz low-pass filter (M29). System management was carried out through a web interface from the laptop. The full specifications of the sensors are summarized in Table 1.
The laptop was also used to record sound through its built-in microphone, with a sampling rate of 48 kHz and 32-bit resolution. The dynamic signals were acquired at 4 kHz and 16 bits. Figure 3 shows the sensor installation layout and the connection to the system.

2.1.3. Kilometer Position Estimation

The speed signal recorded by the data acquisition system (DAS) was integrated to determine the kilometer position associated with each moment in time. This procedure enabled a direct correlation between dynamic and acoustic signals and their location along the railway section, allowing for precise identification of specific areas with issues.
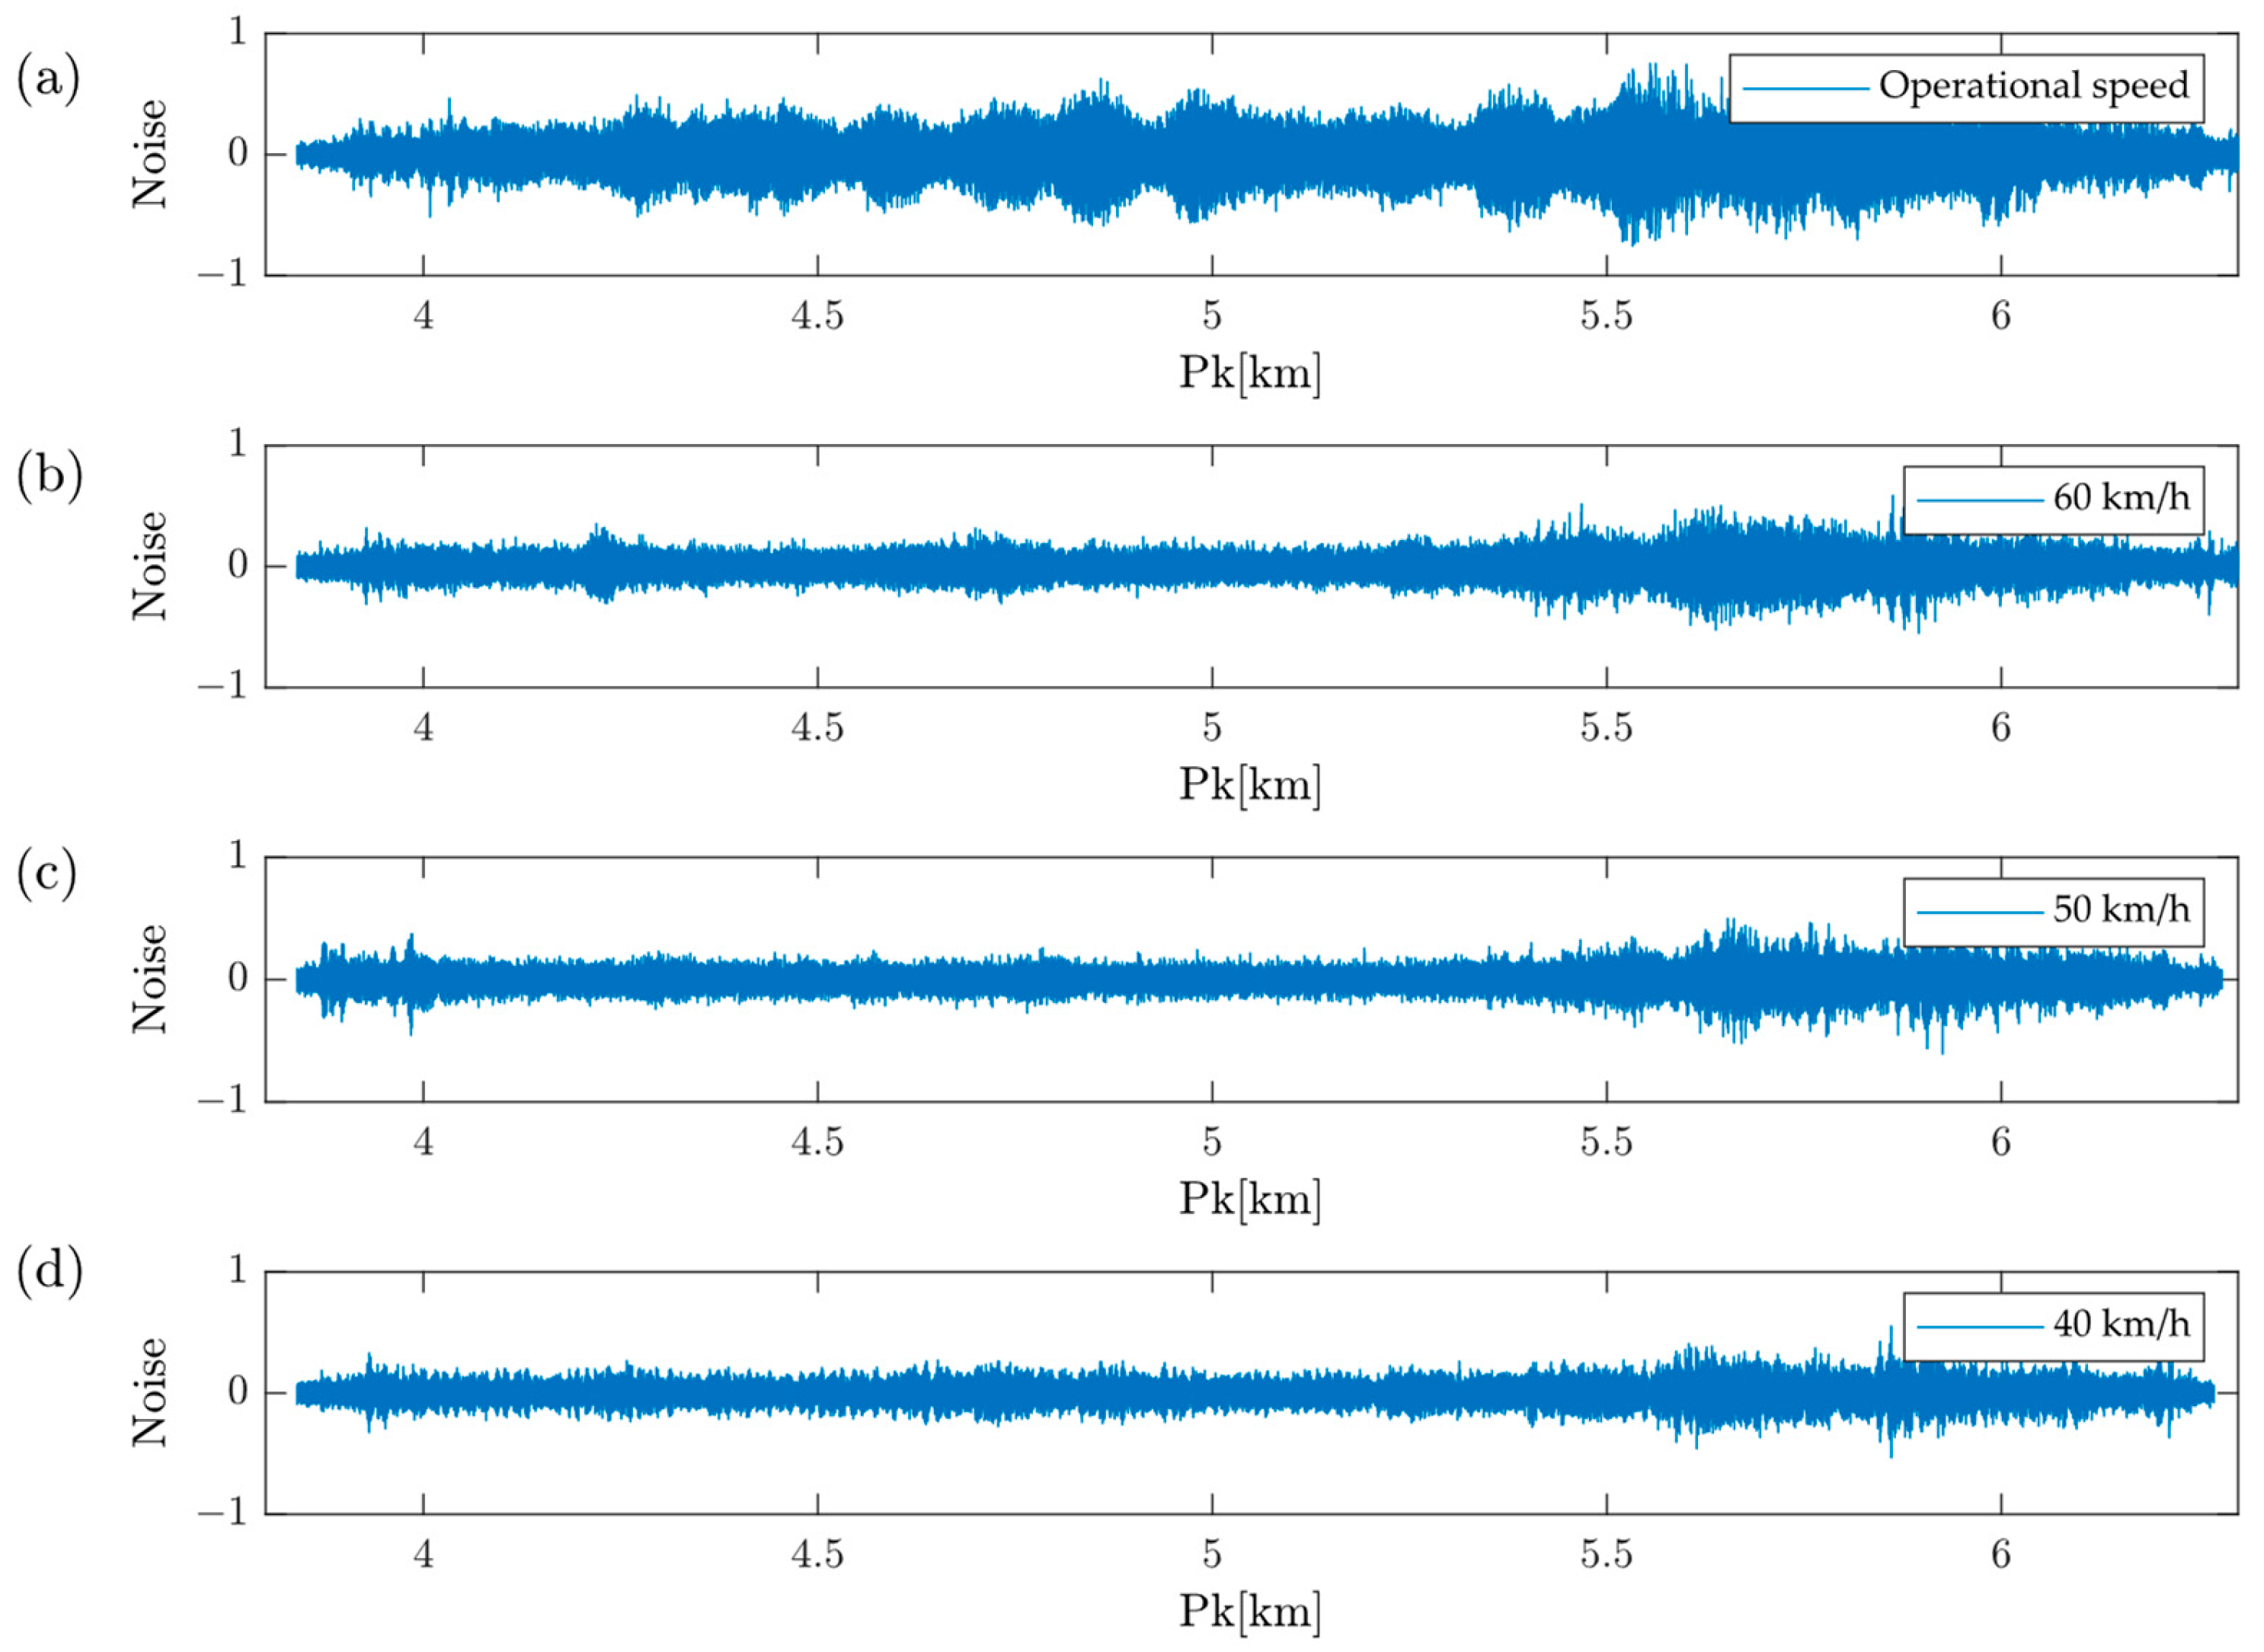
Figure 4 presents the relationship between acoustic signals and their kilometer position for the operating speed (75 km/h) and speeds of 60 km/h, 50 km/h, and 40 km/h. The signals show a progressive decrease in noise amplitude as the train speed is reduced, reflecting a decrease in the dynamic excitations generated by the wheel–rail interaction at lower speeds.

2.2. Preliminary Pattern Identification

Prior to the development of the automated methodology, an exploratory analysis was conducted with the aim of identifying characteristic patterns in acoustic signals associated with the presence of rail corrugation. This analysis provided the foundation for designing a robust detection system, structured in three stages.

2.2.1. Physical Inspection and Fault Location

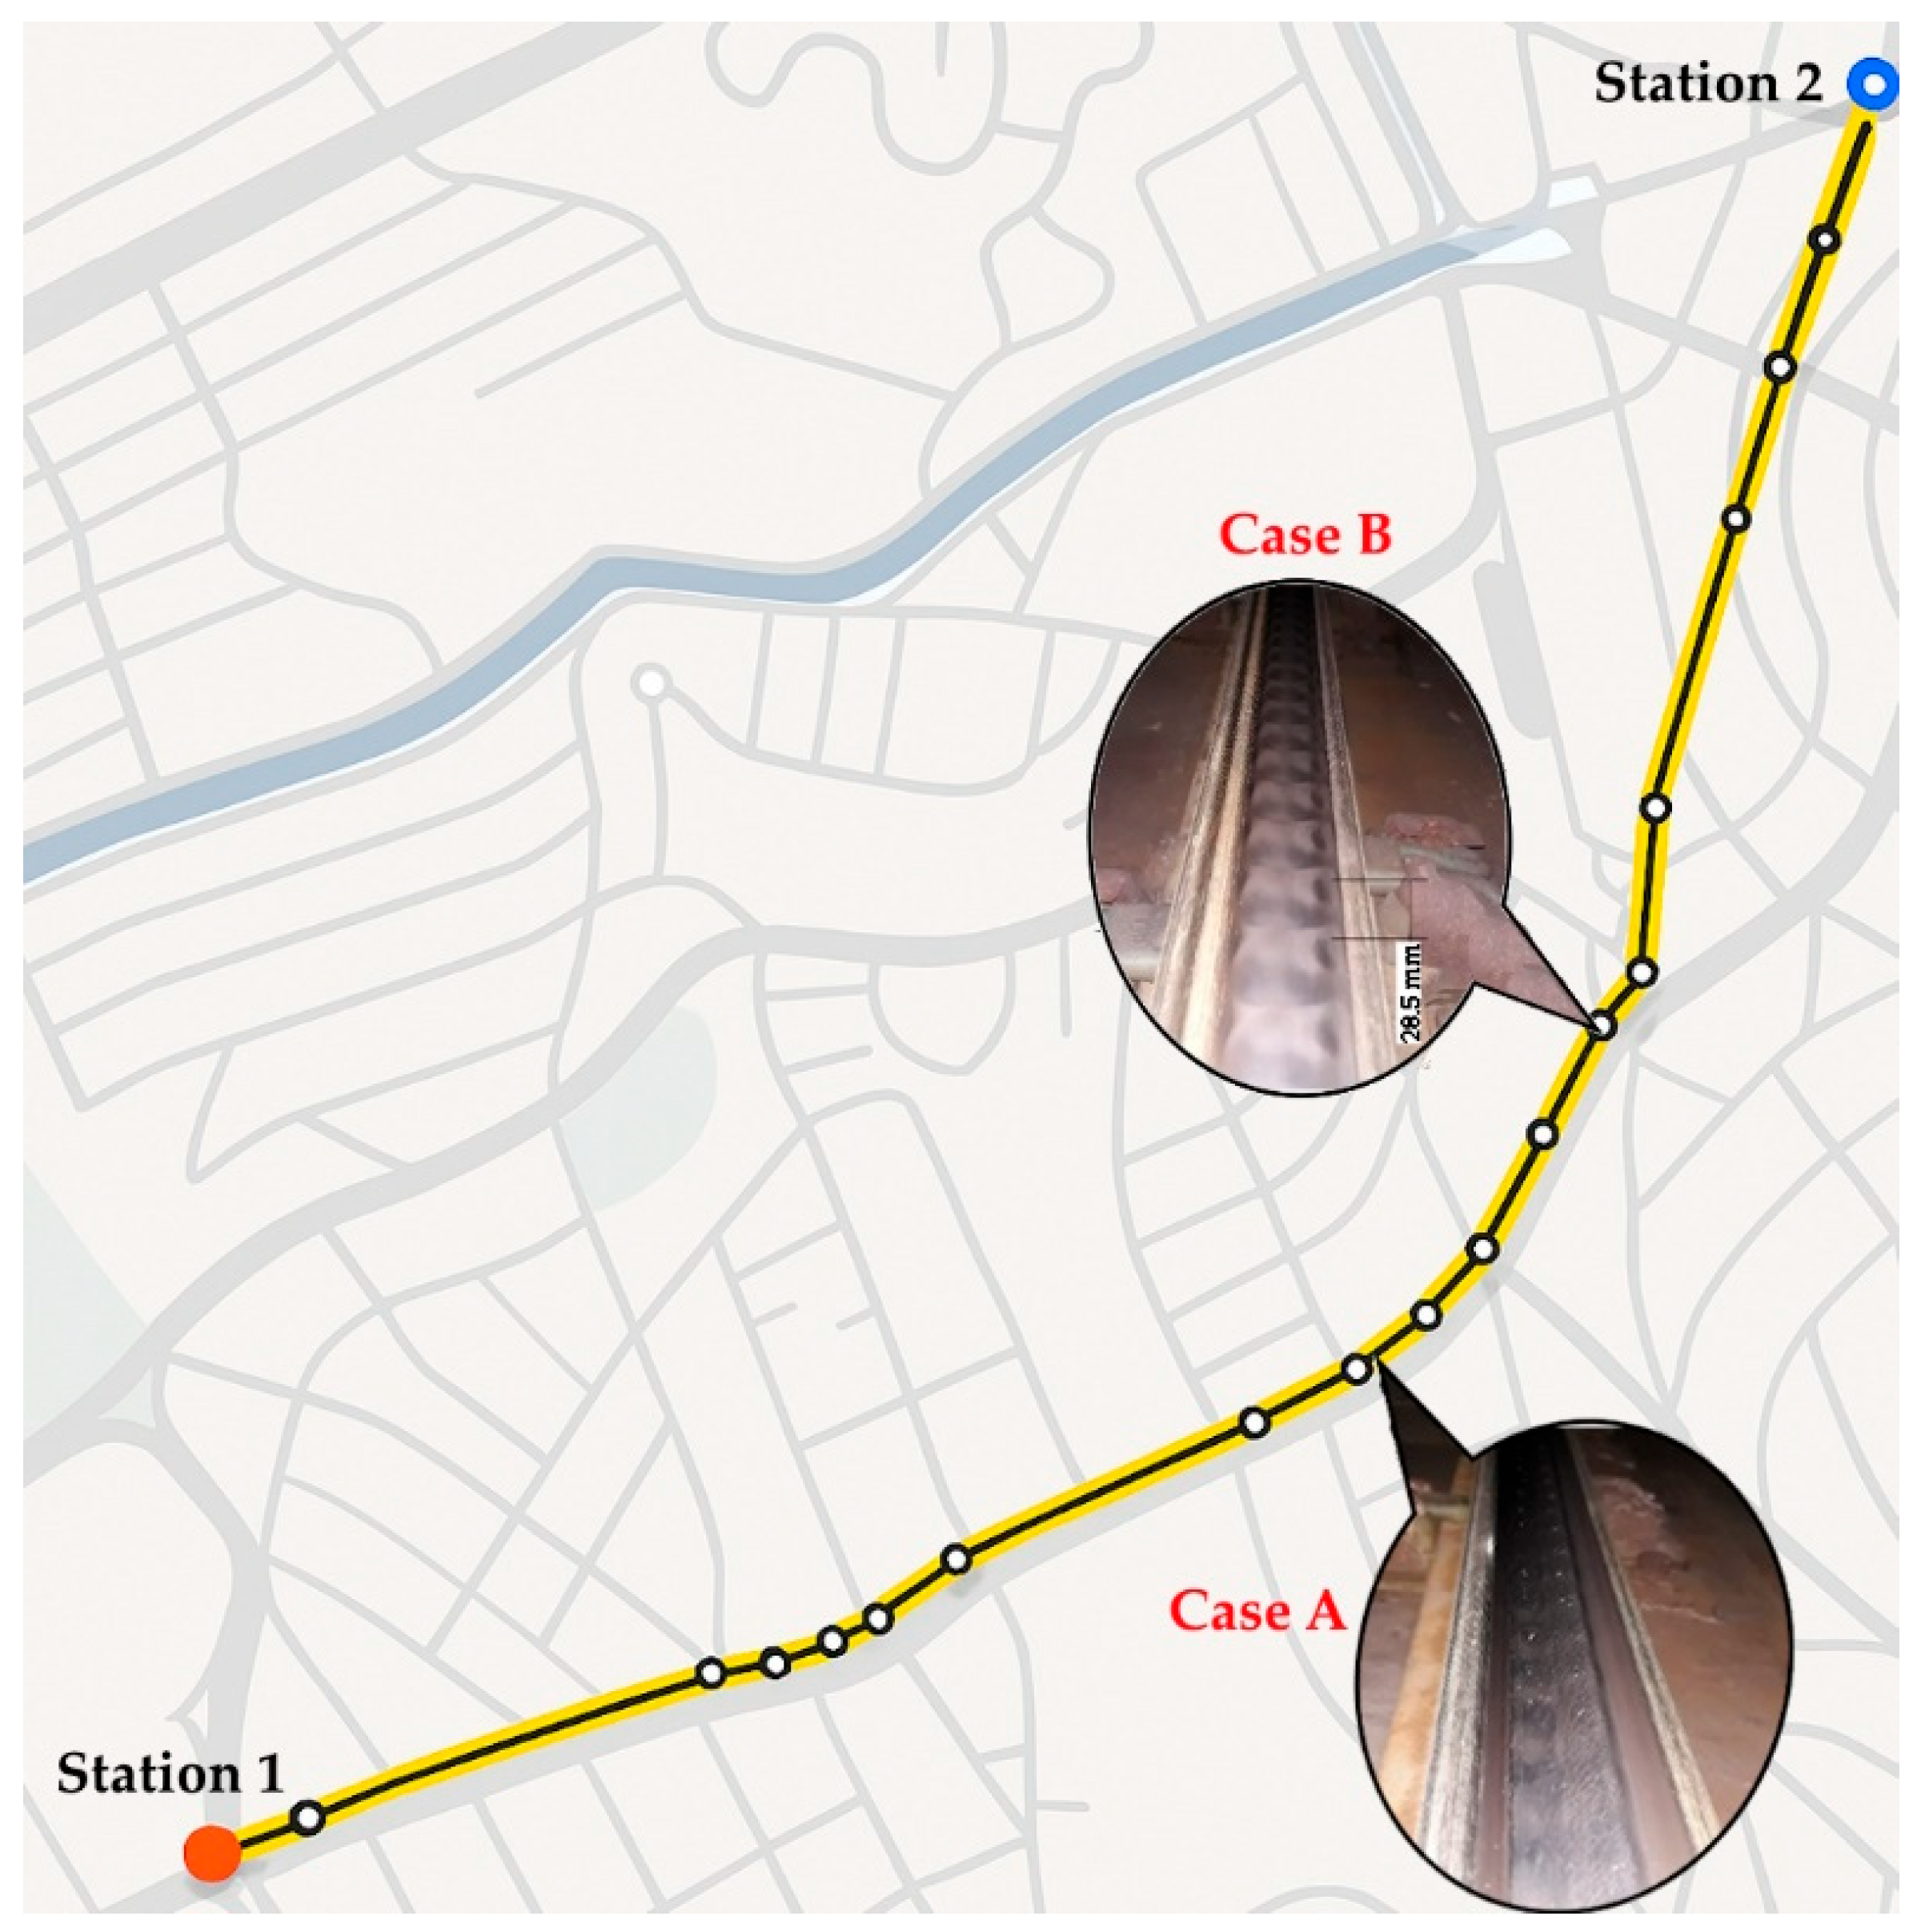
A visual inspection was carried out on two track sections where the most noticeable and annoying noise inside the train was perceived during the test runs. These correspond to the sections between Pk 4.855–4.914 and Pk 5.239–5.326, which were documented through photographic records (Figure 5).
Since direct wavelength measurement was not carried out on site, the quantification was performed afterwards using the photographic records. The estimation was based on image analysis, taking the UIC-60 rail geometry and the adjacent nut as a fixed dimensional reference, measuring 9 mm across flats (70 pixels). The nut was used to calculate its apothem according to Equation (1) [40].
a = l 2 l 2 2 = 7.8
The distance between opposite faces, 2a = 15.6 mm, corresponded to 108 pixels, resulting in a scale of 0.144 mm/pixel. The distance between consecutive defects was 197 pixels, equivalent to a wavelength of 28.5 mm. This procedure was repeated on another curve, verifying the consistency of the estimated wavelength.

2.2.2. Detection of Annoying Noise

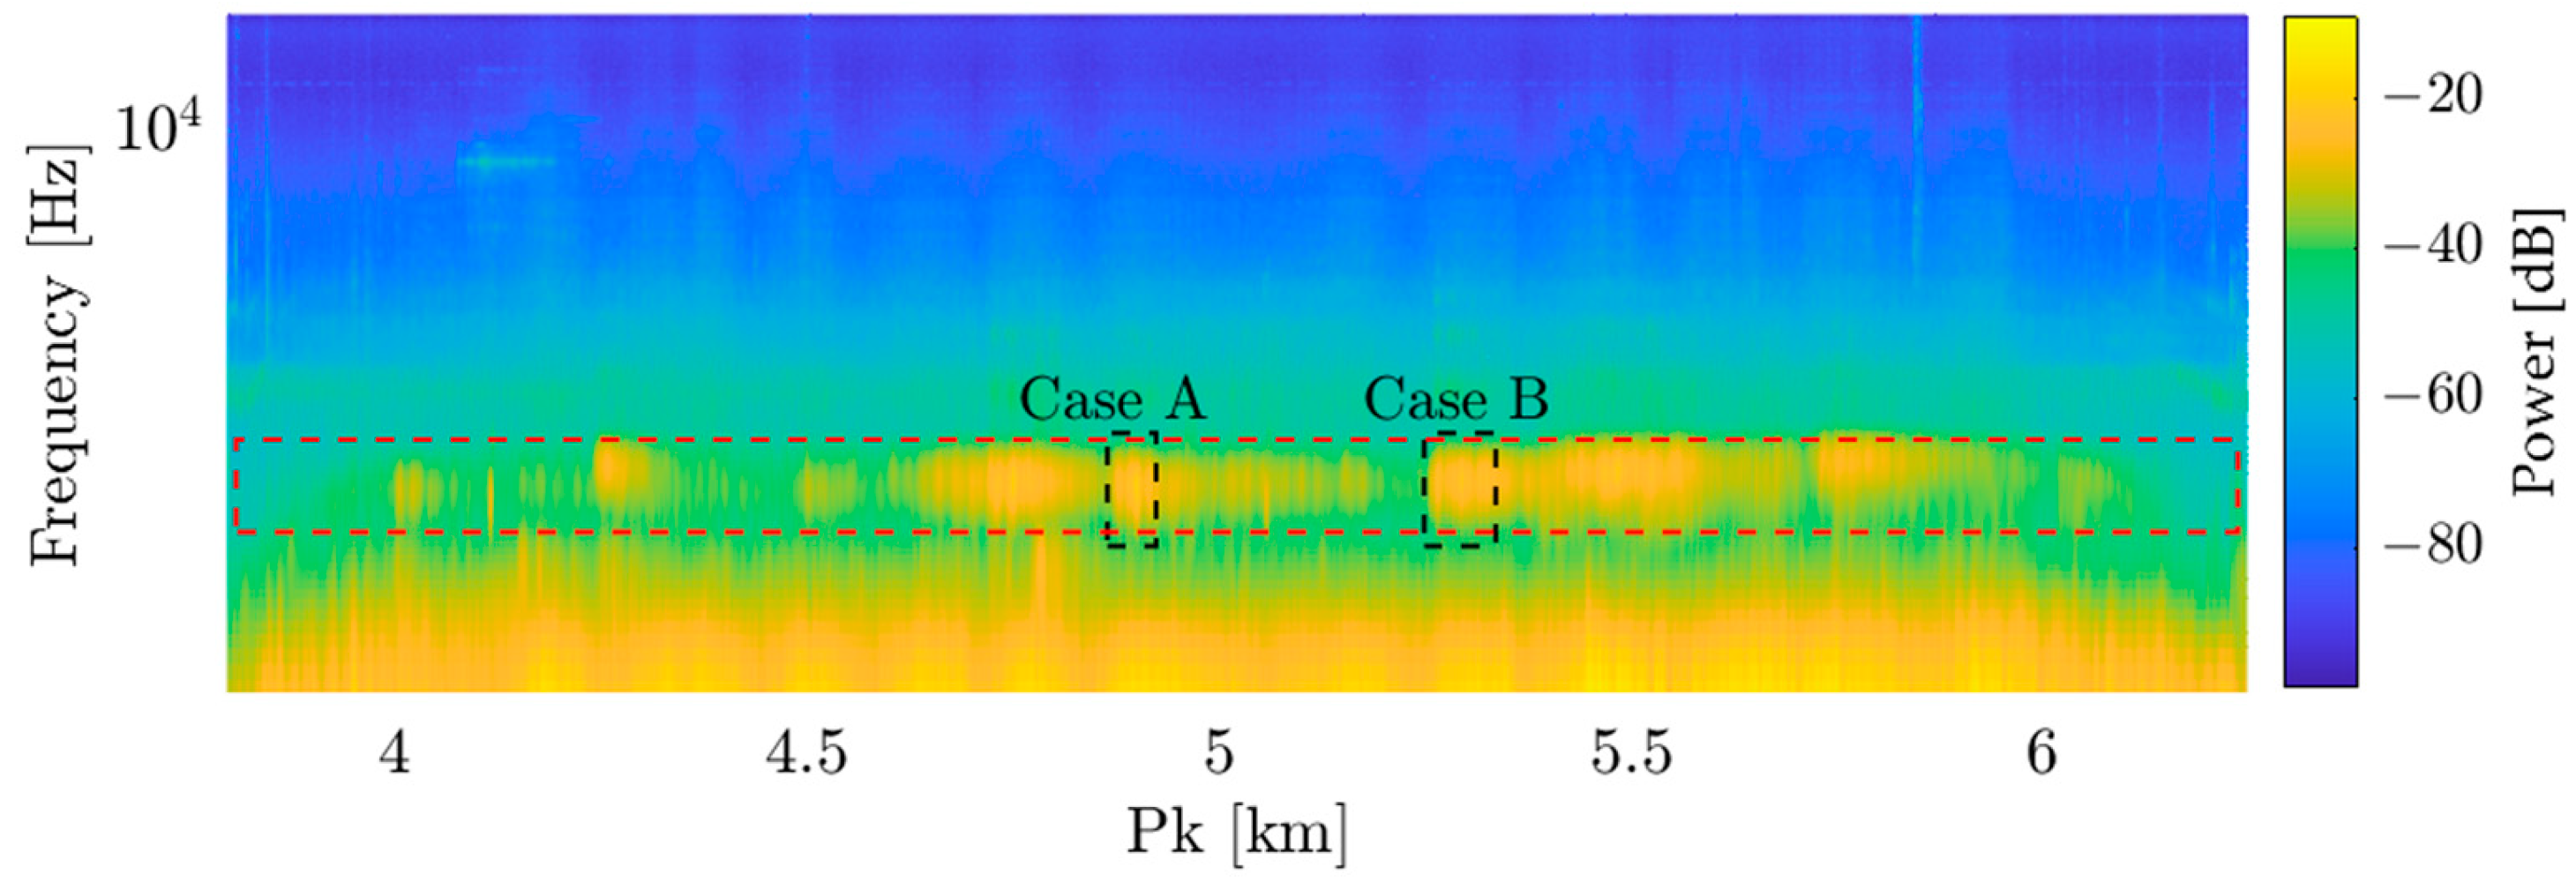
The acoustic recordings were analyzed in the frequency–space domain using spectrograms to locate high-energy bands associated with areas of annoying noise (red box in Figure 6). These areas coincided with positions previously identified through visual inspection (black boxes) and were confirmed by directly listening to the audio files. The color scale (colorbar) in the spectrogram represents the power spectral density (dB), ranging from −80 dB (blue, low energy) to −20 dB (yellow, high energy), enabling direct quantitative interpretation of the acoustic intensity along the track.
According to the UNE-EN 15610:2020 standard [21], periodic track defects induce spectral components whose frequency depends on the train speed (V) and the wavelength of the defect (λ), as expressed in Equation (2).
λ = V   f
Based on this criterion, by knowing the speed and defining the wavelength band of interest, the frequency band to be evaluated can be determined. In this study, the analysis focused on the wavelength range between 10 and 100 mm, associated with short-pitch corrugation [30,41,42]. As an example, the corresponding frequencies for each speed are presented in Table 2.
Figure 7 shows the spectrograms generated from the sound recordings at the operating speed (75 km/h), 60 km/h, 50 km/h, and 40 km/h. Each spectrogram reveals an increase in energy within bands centered around frequencies of 844.16 Hz, 691.74 Hz, 562.77 Hz, and 445.53 Hz, corresponding to the respective travel speeds. This energy increase correlates with the kilometer positions previously identified by physical inspection (Cases A and B) and preliminary analysis, suggesting the presence of track sections with potential corrugation issues. As the speed increases, the energy rise becomes more evident, indicating greater sensitivity to shallower defects. At lower speeds, the increases are mainly restricted to areas with more severe defects, suggesting a direct relationship between the intensity of the acoustic effect and the operating speed. This behavior observed in the spectrograms validates their use as an effective tool for the preliminary identification of track sections with geometric irregularities.
Table 3 details some of the sections identified with potential corrugation issues (due to higher energy levels), specifying the corresponding kilometer position. These sections were primarily determined from the recording at the highest speed.

2.2.3. Spectral Processing—PSD

The identified sections were individually processed in the frequency domain using power spectral density (PSD). Figure 8 shows the spectrum of the fourth segment under analysis (S4), recorded at the operating speed (75.8 km/h). This segment corresponds to Case B identified during visual inspection (Figure 5). The spectral analysis revealed a local maximum at 726.9 Hz, equivalent to a wavelength of 28.96 mm, which is consistent with the estimate obtained by visual inspection.
This same procedure was applied to each of the segments identified in the acoustic recordings as potentially affected by corrugation. The results are presented in Table 4.
The data show that in each section identified with problems, the wavelength of the corrugation remains practically constant, regardless of the operating speed, confirming the geometric nature of the defect as a fixed wave pattern on the track.
The frequencies associated with the local maxima in the spectrum, on the other hand, increase as the operating speed increases, in accordance with the inverse relationship between frequency and wavelength described by Equation (2). This behavior reinforces the theoretical connection between speed and detected frequency, providing robust experimental evidence of the wheel–rail interaction dynamics.
On the other hand, the sound pressure levels (dB) recorded at the local maximum tend to decrease as the operating speed decreases. However, in some cases, the lowest values are recorded at an intermediate speed of 50 km/h, suggesting the presence of additional dynamic factors affecting the acoustic response within this speed range. These results highlight the complexity of the wheel–rail interaction and underscore the need for a more detailed dynamic analysis.

2.2.4. Spectral Processing—FFT

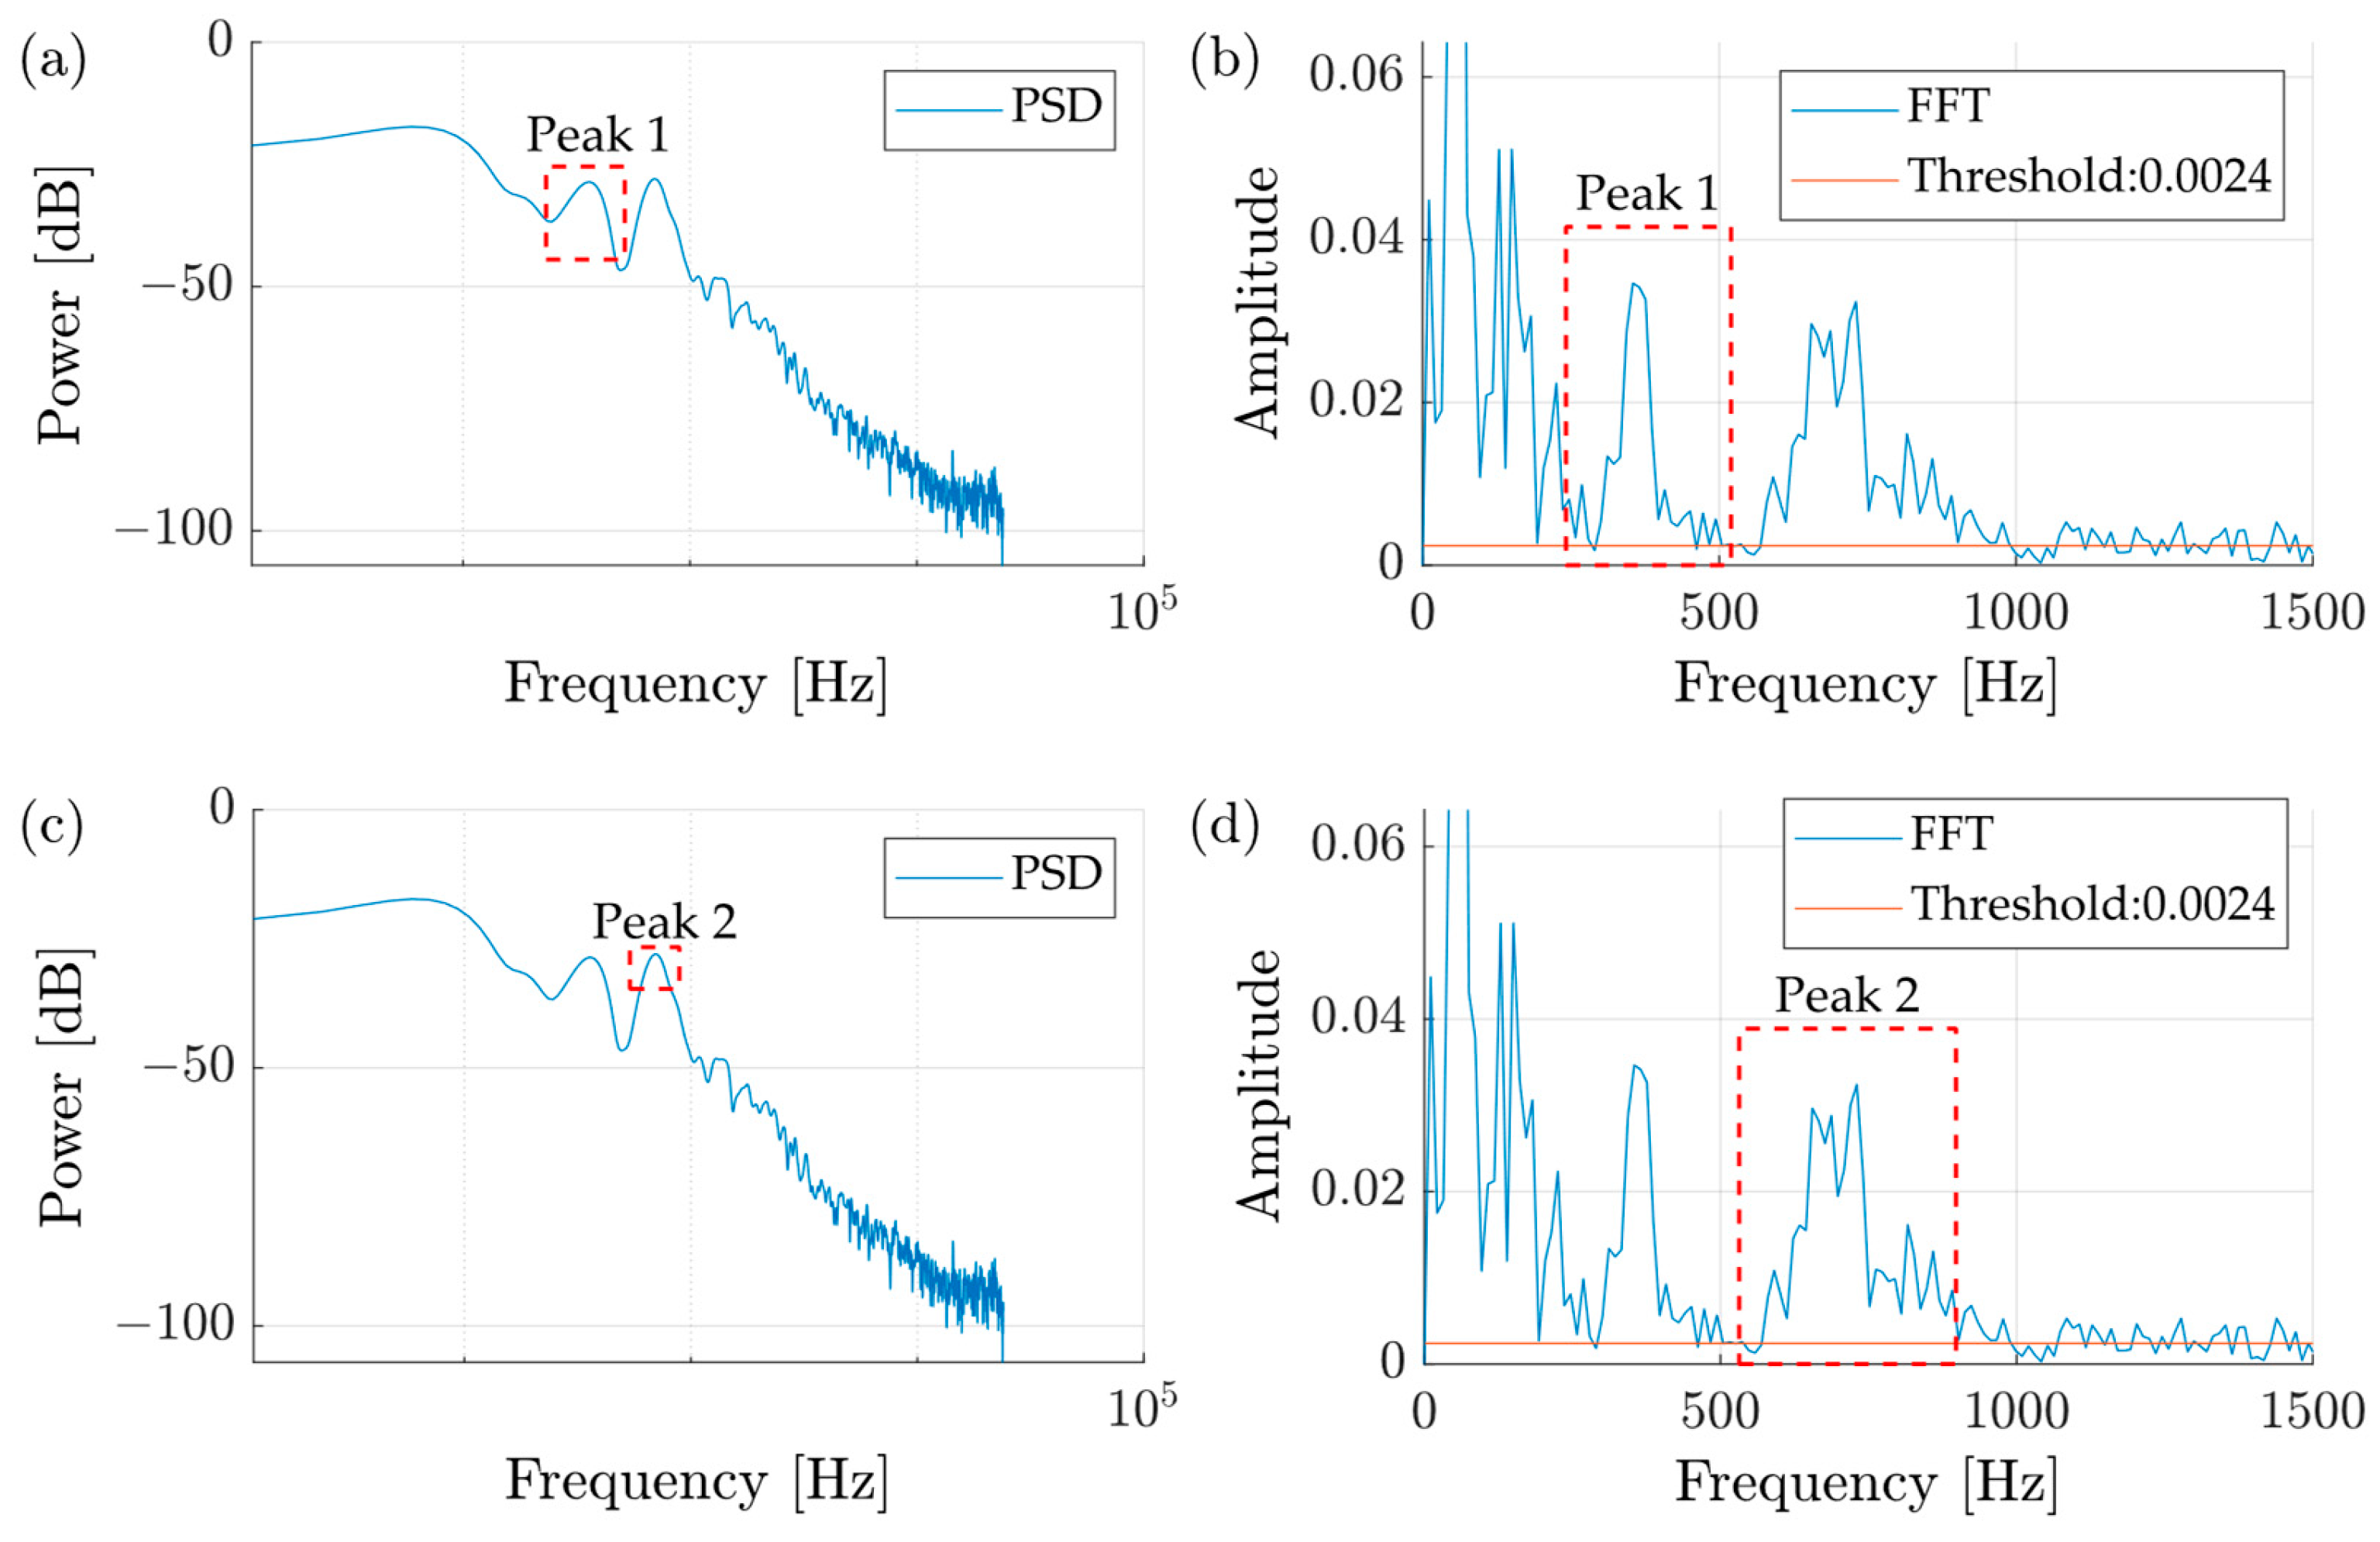
To characterize the spectral energy around the detected peaks, FFT was applied to each segment. The results revealed that, in the track sections affected by corrugation, the FFT spectrum exhibited a pattern of impulsive behavior, evidenced by multiple secondary peaks of significant amplitude distributed symmetrically around the dominant frequency.
This can be observed in Figure 9, which shows, for the same track section, the PSD spectrum (Figure 9a) and its corresponding FFT spectrum (Figure 9b). In both cases, the representative frequency associated with the corrugation defect identified as Case B is marked. While PSD (Figure 9a) displays an isolated local maximum, the FFT spectrum (Figure 9b) reveals a cluster of high-energy transient components concentrated in a narrow band around this frequency, a signature typically generated by periodic mechanical excitations, such as rail corrugation.
This pattern was recurrently identified in all six analyzed segments, suggesting that the presence of impulsive spectral content near the representative frequencies constitutes a distinctive feature of corrugation defects. This behavior is consistent with the periodic and irregular nature of the mechanical excitations generated by the wheel–rail interaction in the presence of corrugation, which induce high-energy transient responses in the frequency domain.
Based on this finding, the objective detection and quantification of this impulsive content in the FFT spectrum is hypothesized to serve as an effective tool for the automatic identification of corrugation problems. Consequently, a diagnostic methodology based on the spectral analysis of impulsive content was developed, the description of which is presented in the following section.

2.3. Proposed Index for Automatic Corrugation Detection

Based on the results obtained in the previous sections and the proposed hypothesis, it is established that, in the FFT spectrum, the presence of impulsive spectral content near the frequencies identified through PSD analysis constitutes a characteristic pattern of rail corrugation defects. Under this premise, a structured diagnostic methodology was designed, aimed at characterizing this impulsive behavior and estimating, automatically and relatively, the severity of the defect.

2.3.1. Signal Fragmentation

To ensure speed independence and preserve spatial resolution, each acoustic recording x(t) was segmented into consecutive windows of 1 m in length [32]. The distance vector d(t), estimated from the integration of the velocity profile, was used to assign each portion of the signal to a spatial window x w t , as described in Equation (3):
x w t = x t d t w 1 , w ,                       w = 1,2 , , N
where N indicates the total number of windows, and each segment represents the signal acquired during one meter of train movement. This level of granularity allows for the localization of discrete defects, avoiding the information loss that would result from fixed-time segmentation.

2.3.2. Definition of the Corrugation Frequency Band

Based on the average speed of each window x w , the corrugation frequency band corresponding to wavelengths between 10 and 100 mm is determined by applying Equation (2). As an example, Figure 10 illustrates the frequency band of interest within the P S D x w spectrum for a speed of 77.5 km/h, equivalent to a range from 215 to 2154 Hz.

2.3.3. Preliminary Identification of Peaks in the PSD Spectrum

Within the corrugation frequency band defined for each window x w , local peaks in the P S D x w spectrum are identified as potential corrugation indicators. A peak is considered a valid candidate if it simultaneously meets two conditions:
  • A minimum height greater than –40 dB (–50 dB is allowed if no valid peaks are found).
  • A minimum prominence dynamically adjusted according to the average speed, as expressed in Equation (4)
    P r o m i n e n c e = 0.14 · K s p e e d 3.21
    where Kspeed is the average speed in km/h of the segment under analysis. This adaptive criterion compensates for spectral energy level variations caused by speed.
The study peaks shown in Figure 11 fall within the corrugation frequency band (red box), calculated for each segment from its average speed and target wavelength range (10–100 mm) using λ = V/f. These peaks meet the selection criteria described above and are considered potential corrugation indicators. In this example, the first peak (363.5, −28.6) and the second peak (703.46, −27.96) will be evaluated in the subsequent impulsiveness analysis using FFT to determine whether either is associated with a corrugation defect in the analyzed track segment.

2.3.4. Dynamic Impulsivity Threshold

For each window x w , a dynamic impulsiveness threshold is calculated based on the statistical distribution of amplitudes in the full F F T x w spectrum [43]. Let A denote the full spectral amplitude vector of the segment (i.e., the entire FFT spectrum, not limited to the corrugation study band). First, the median of A is computed and used as a robust baseline to mitigate outliers and define candidate local peaks. Next, the mean amplitude of the local peaks whose values exceed the median is taken as the dynamic impulsiveness threshold Timp. In the example shown in Figure 12, this procedure yields a threshold value of 0.0024, which corresponds to the mean amplitude of the peaks exceeding the median in the analyzed segment.
This staged thresholding strategy ensures adaptability to the specific spectral conditions of each sample and its operating speed.

2.3.5. Definition of Impulsivity Bands

For each peak identified in P S D x w , a symmetric sideband (impulsiveness band) centered at its frequency f 0 is defined, calculated according to Equation (5).
B L a t = f 0 6
The evaluated band is then [ f 0 B L a t , f 0 + B L a t ]. Within this region, the impulsive content in F F T x w is examined. Impulsiveness is present when at least three peaks exceed the calculated dynamic threshold Timp (Figure 13). Otherwise, the peak is discarded as a corrugation indicator.

2.3.6. Definition of Associated Spectral Metrics

Once impulsiveness around the central peak f0 is validated, four metrics are extracted to characterize the severity of the defect:
  • Total impulsive area (AT): area under the curve of the F F T x w spectrum within the impulsiveness band [ f 0 B L a t , f 0 + B L a t ], considering only amplitude values that exceed the dynamic impulsiveness threshold Timp.
  • Proportion of impulsive peaks (PPeak): ratio between the number of spectral peaks in F F T x w , within the impulsiveness band [ f 0 B L a t , f 0 + B L a t ], that exceed the threshold Timp, and the total number of spectral points contained in that band.
  • Energy dispersion factor (1 − DP): penalization coefficient that evaluates the distribution of spectral energy in F F T x w , within the impulsiveness band, calculated according to Equation (6).
D p = m a x ( F F T x w ) F F T x w
  • Central peak linear amplitude (AL): linear-scale value of the amplitude at the central frequency previously identified in P S D x w , obtained by converting it from decibels.

2.3.7. Calculation of Spectral Indices

Both indices can be interpreted as functional operators that assign spectral energy distributions to scalar severity metrics. This formulation enables a quantitative assessment of the spectral severity of the signal, based on the impulsiveness and energy localization of the spectral content.

 Impulsivity Index Based on Area and Peak Distribution (IIAPD) 

The IIAPD quantifies defect severity using Equation (7).
I I A P D = A T · P P e a k · ( 1 D P )
where AT is the total impulsive area, PPeak is the proportion of impulsive peaks, and (1 − DP) is the energy dispersion factor previously defined in Section 2.3.6.
This index is more responsive to extended or moderate defects, where the impulsive spectral content is distributed across several lower-magnitude peaks. It is useful for detecting consistent corrugation patterns over long track sections, even when the individual severity of each peak is not high.

 Energy-Weighted Impulsivity Severity Index (EWISI) 

The EWISI incorporates the absolute amplitude of the central peak identified in the PSD analysis (AL), assigning greater weight to the total spectral magnitude; see Equation (8).
E W I S I = A T · A L · ( 1 D P )  
where AT is the total impulsive area, AL is the central peak linear amplitude, and (1 − DP) is the energy dispersion factor previously defined in Section 2.3.6.
Unlike the IIAPD, this index is more stringent and is aimed at detecting localized and severe defects, characterized by high energy at the central frequency accompanied by significant impulsive content in its surroundings.

 Conceptual Comparison of the IIAPD and EWISI 

Figure 14 shows the spatial evolution of both indices along the railway track for the four tested speeds. Both indices allow for an objective quantification of the spectral severity associated with corrugation defects, although with complementary approaches:
  • The IIAPD is more sensitive to the distribution of impulsive content. It is ideal for identifying recurring or distributed defects, even when the individual amplitude is not high.
  • The EWISI, on the other hand, prioritizes defects with high amplitude at the central frequency. This index is suitable for areas with severe and localized corrugation, where the spectral energy is significant.
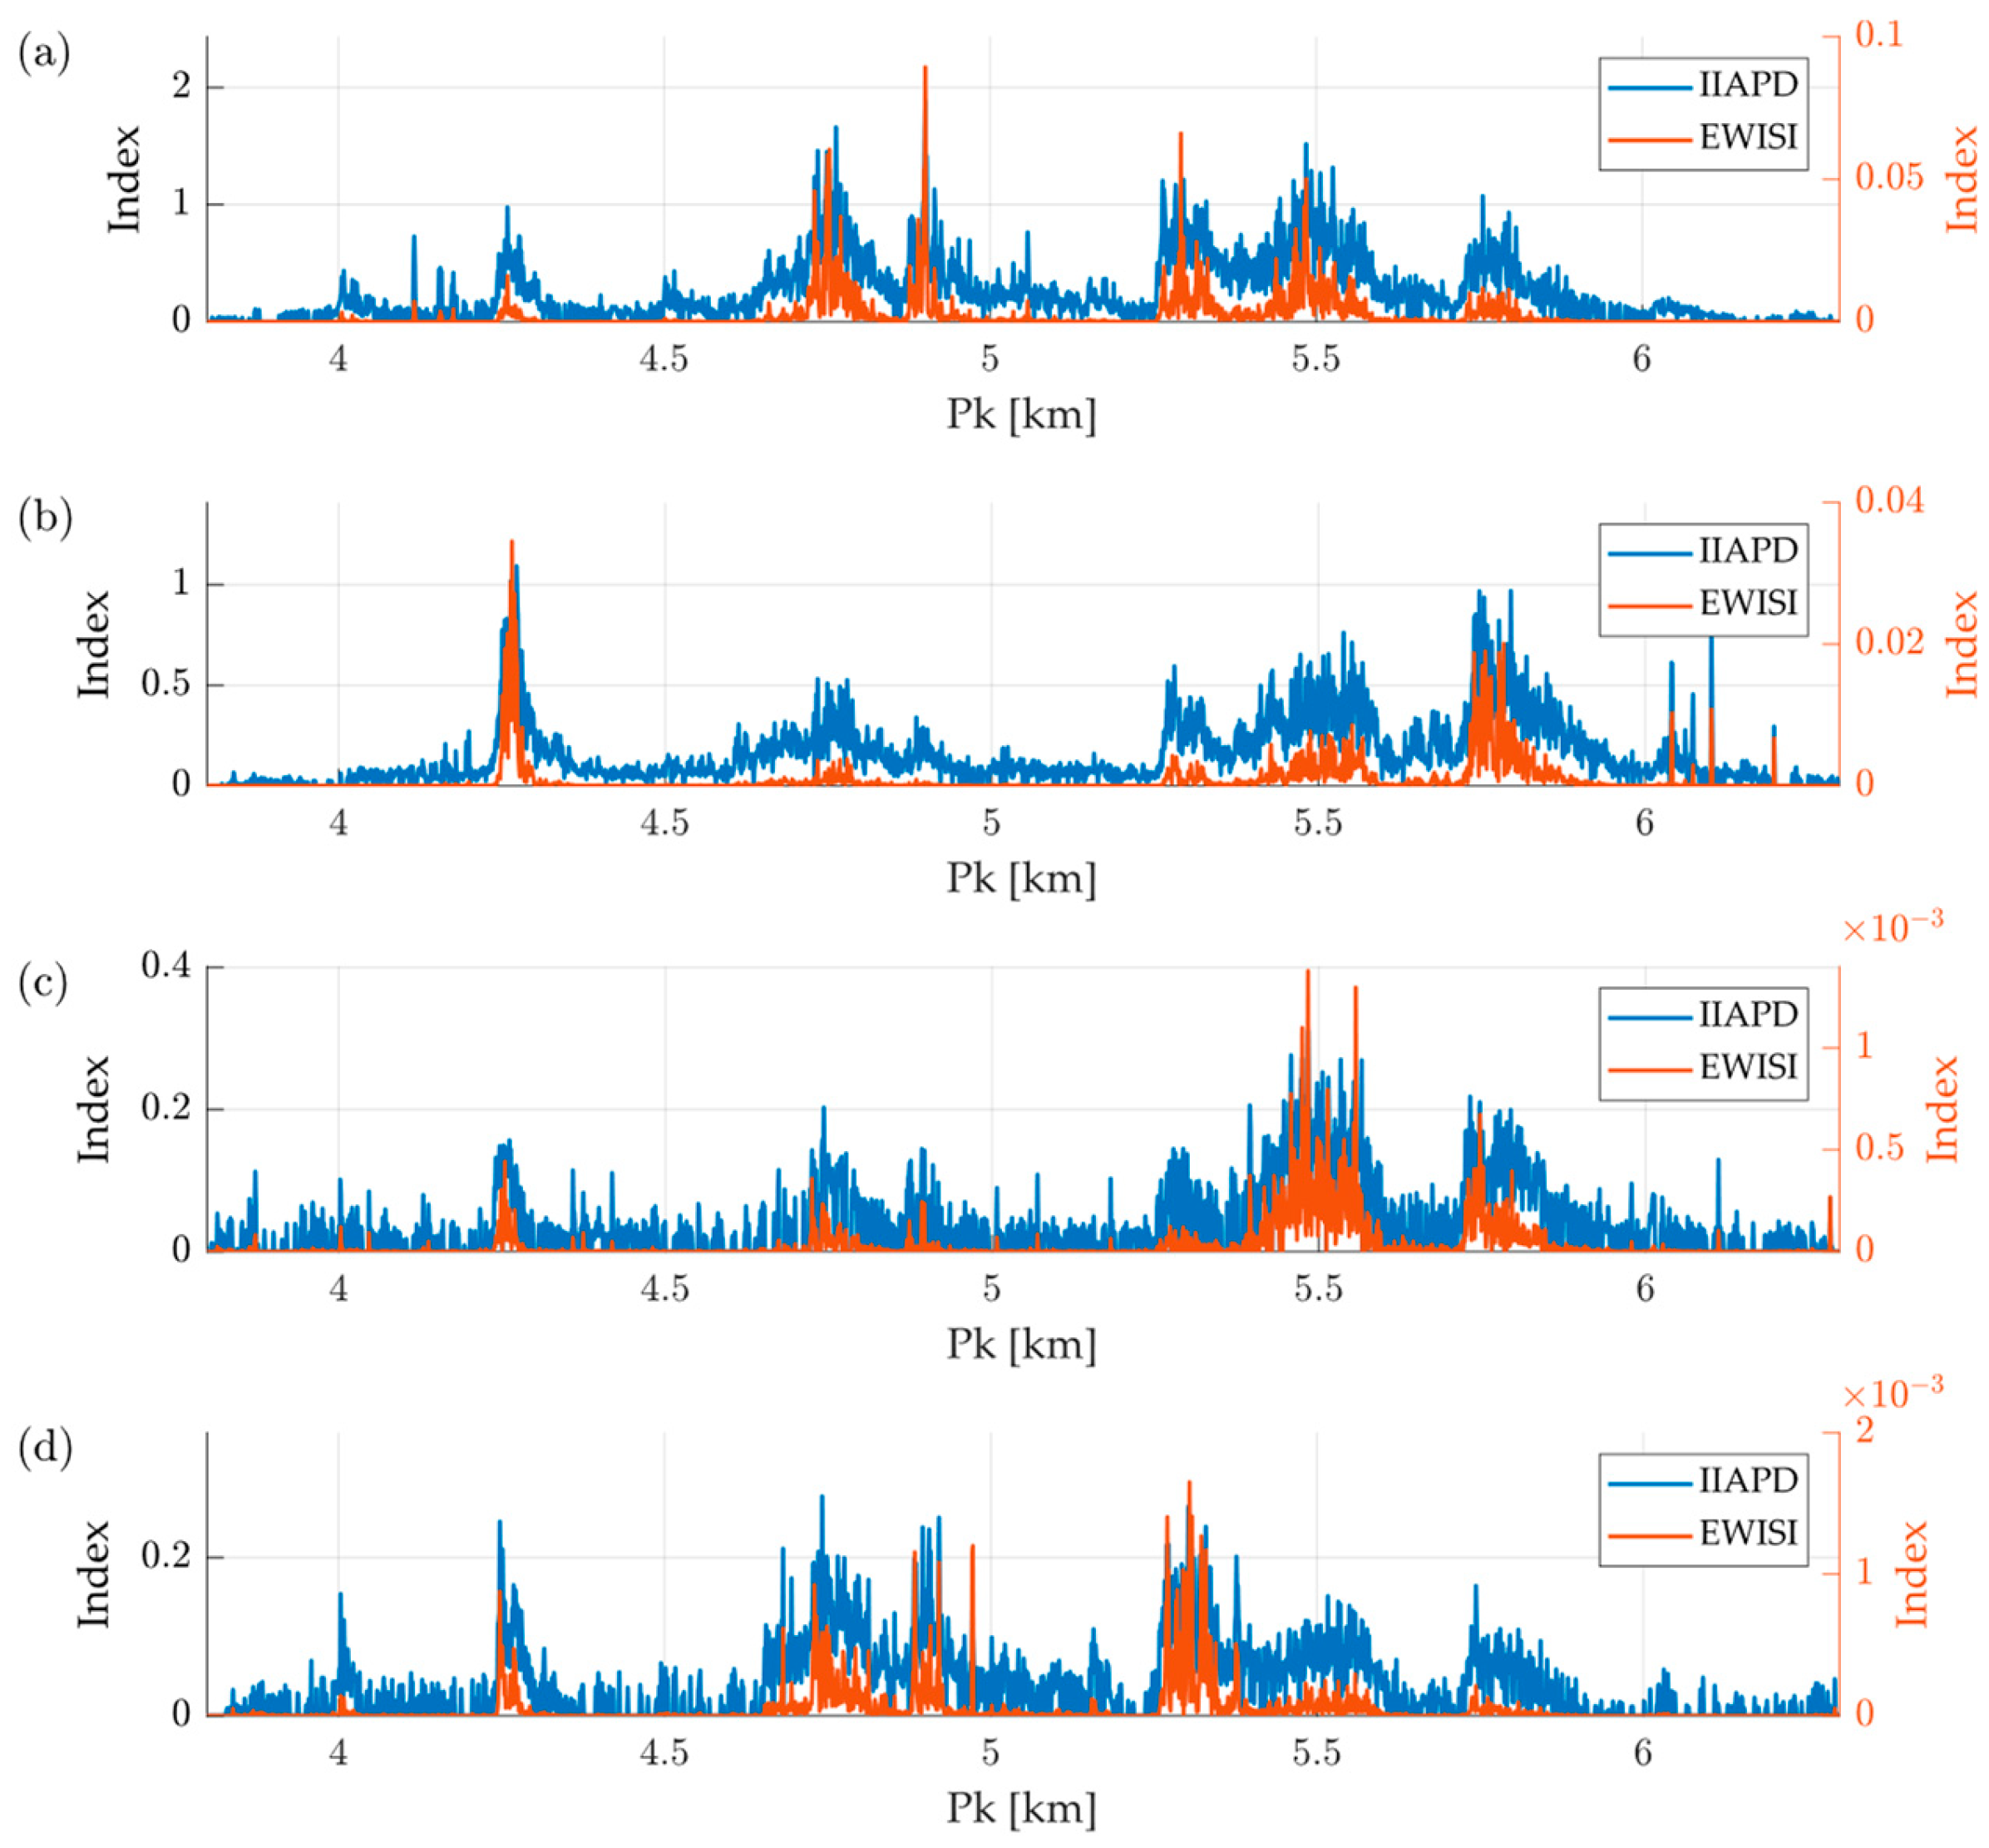
Figure 14. Spatial evolution of the IIAPD and EWISI along the analyzed track section at different operational speeds: (a) 75 km/h, (b) 60 km/h, (c) 50 km/h, and (d) 40 km/h.
Mathematics 13 02815 g014
Together, they form a robust and versatile tool for the automatic diagnosis of corrugation, enabling discrimination between different levels of defect severity and extent.

3. Results

The experimental validation of the methodology was carried out on the previously described railway section, analyzing recordings at four travel speeds: operating speed (75 km/h), 60, 50, and 40 km/h. In each case, the IIAPD and EWISI were calculated along the entire route and compared with the results obtained using two reference methodologies: Bocciolone et al. [32] and De Rosa et al. [30].
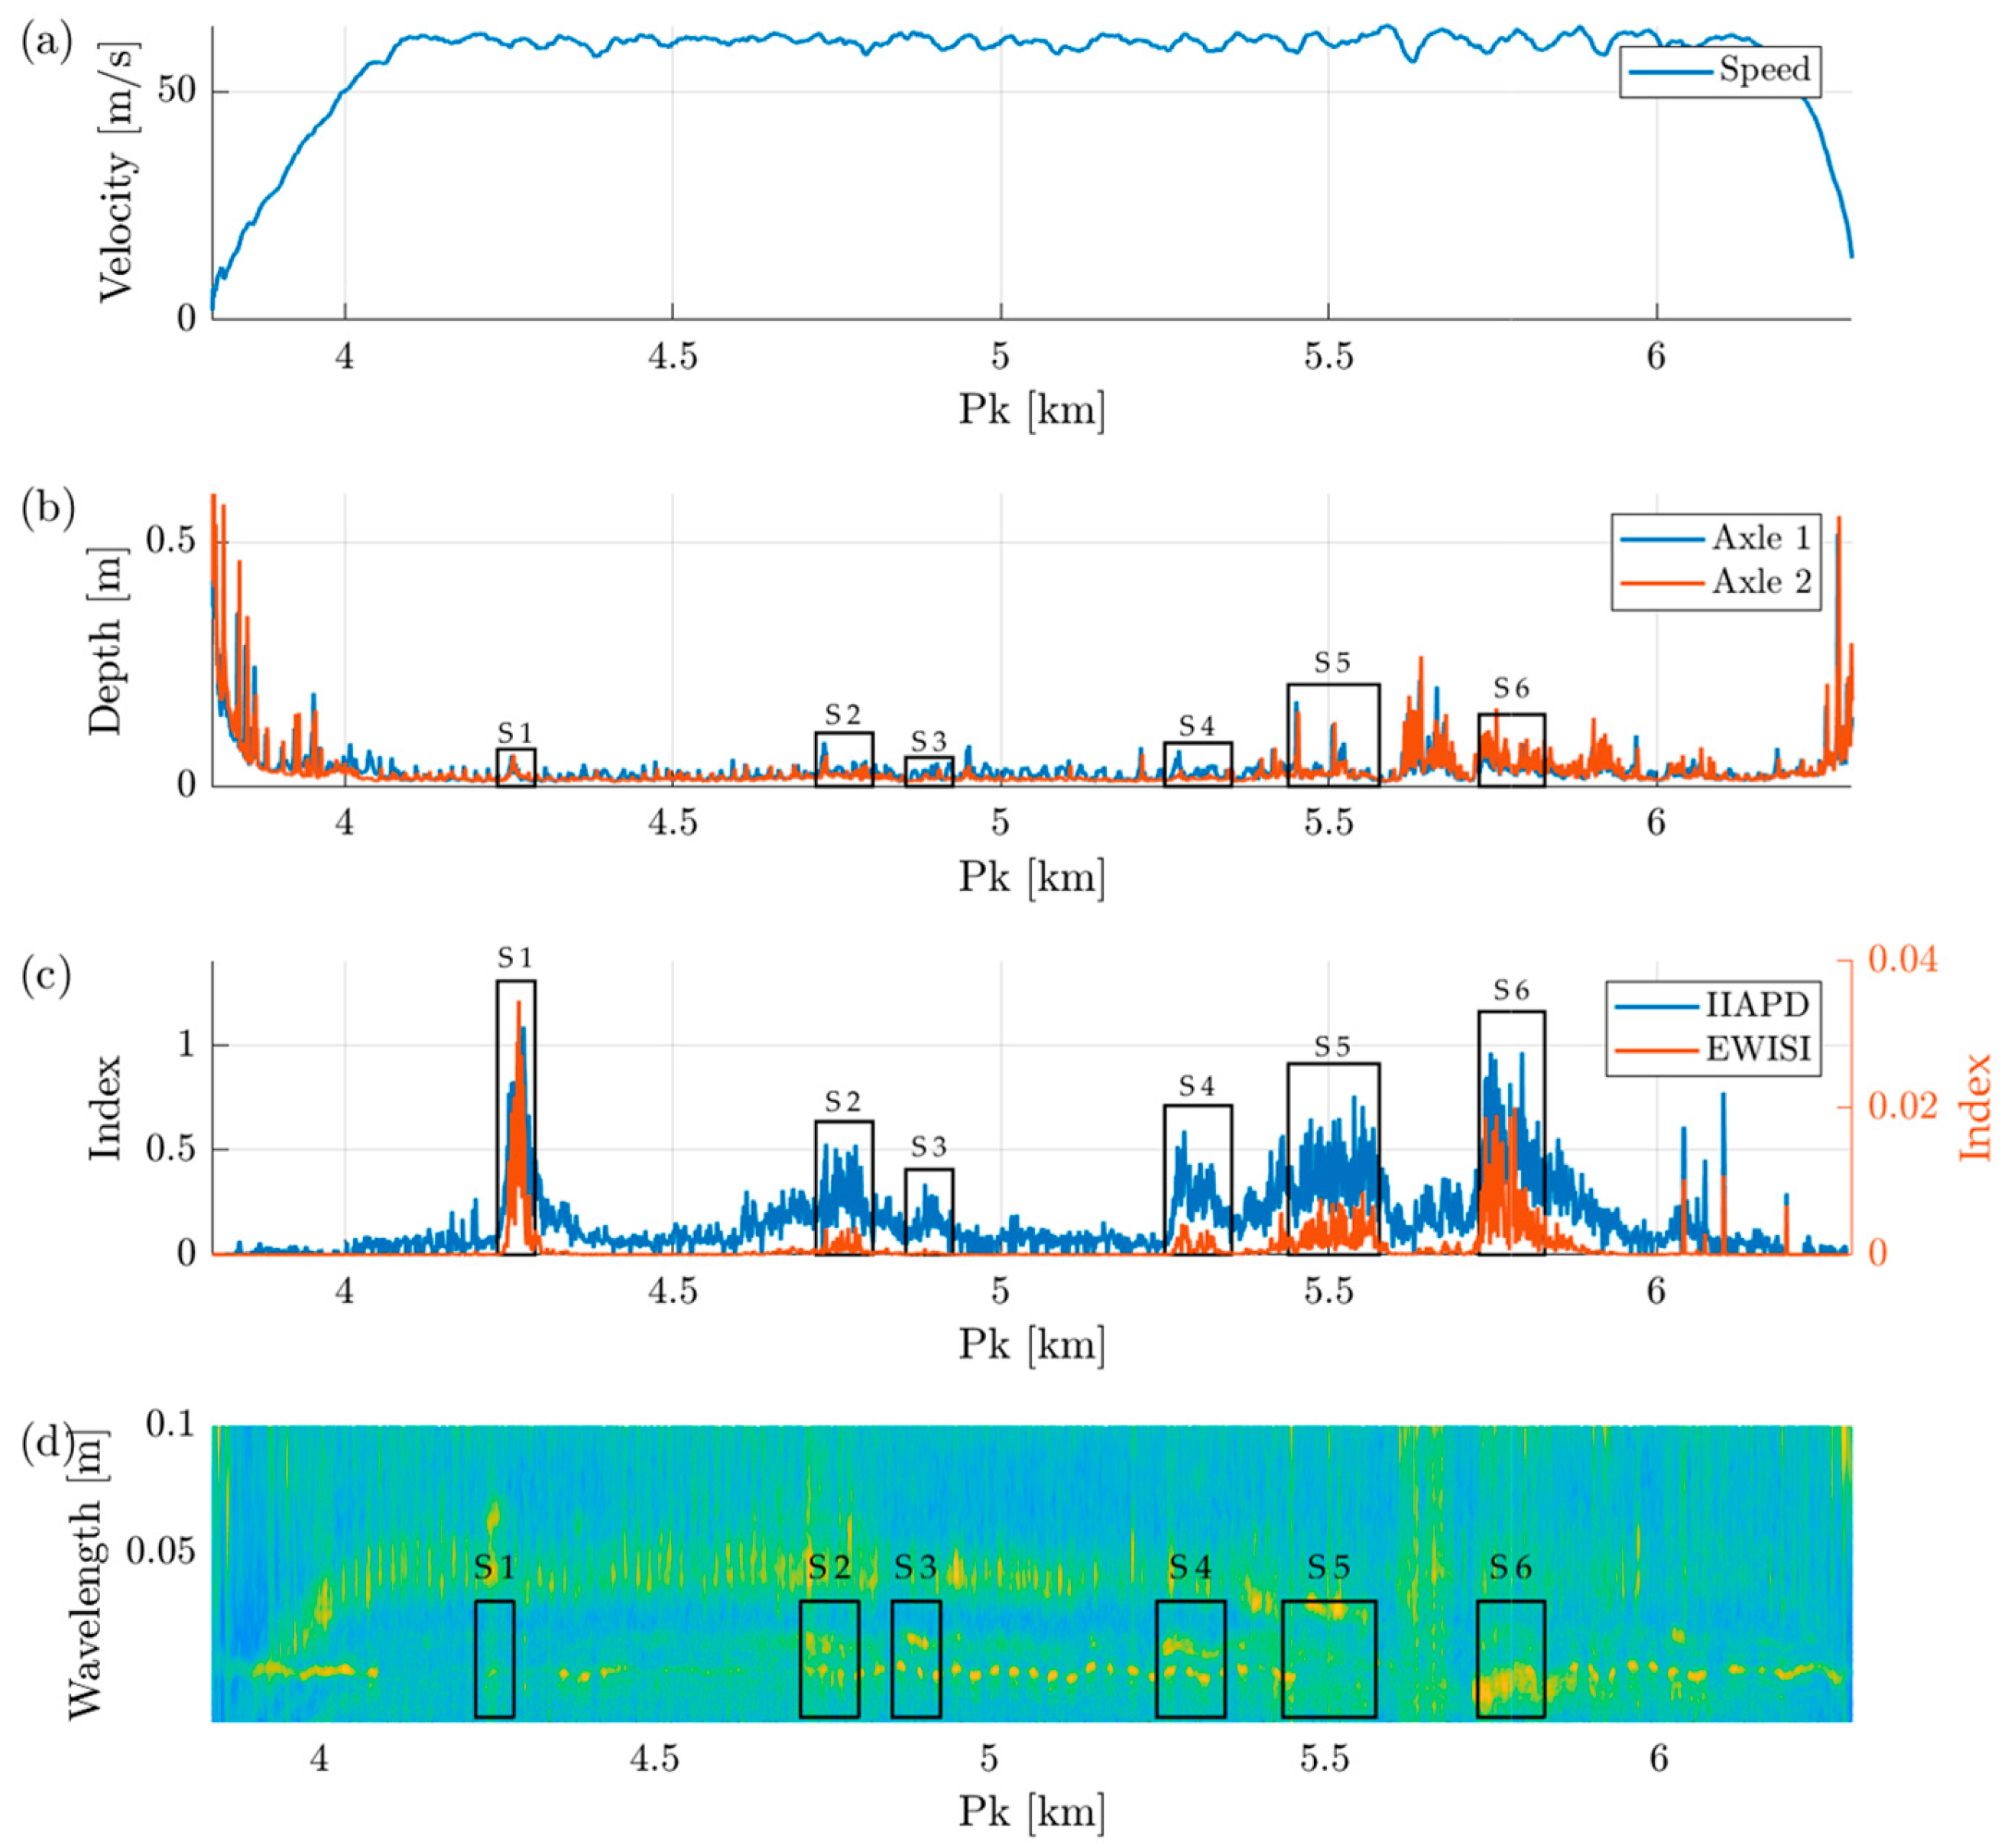
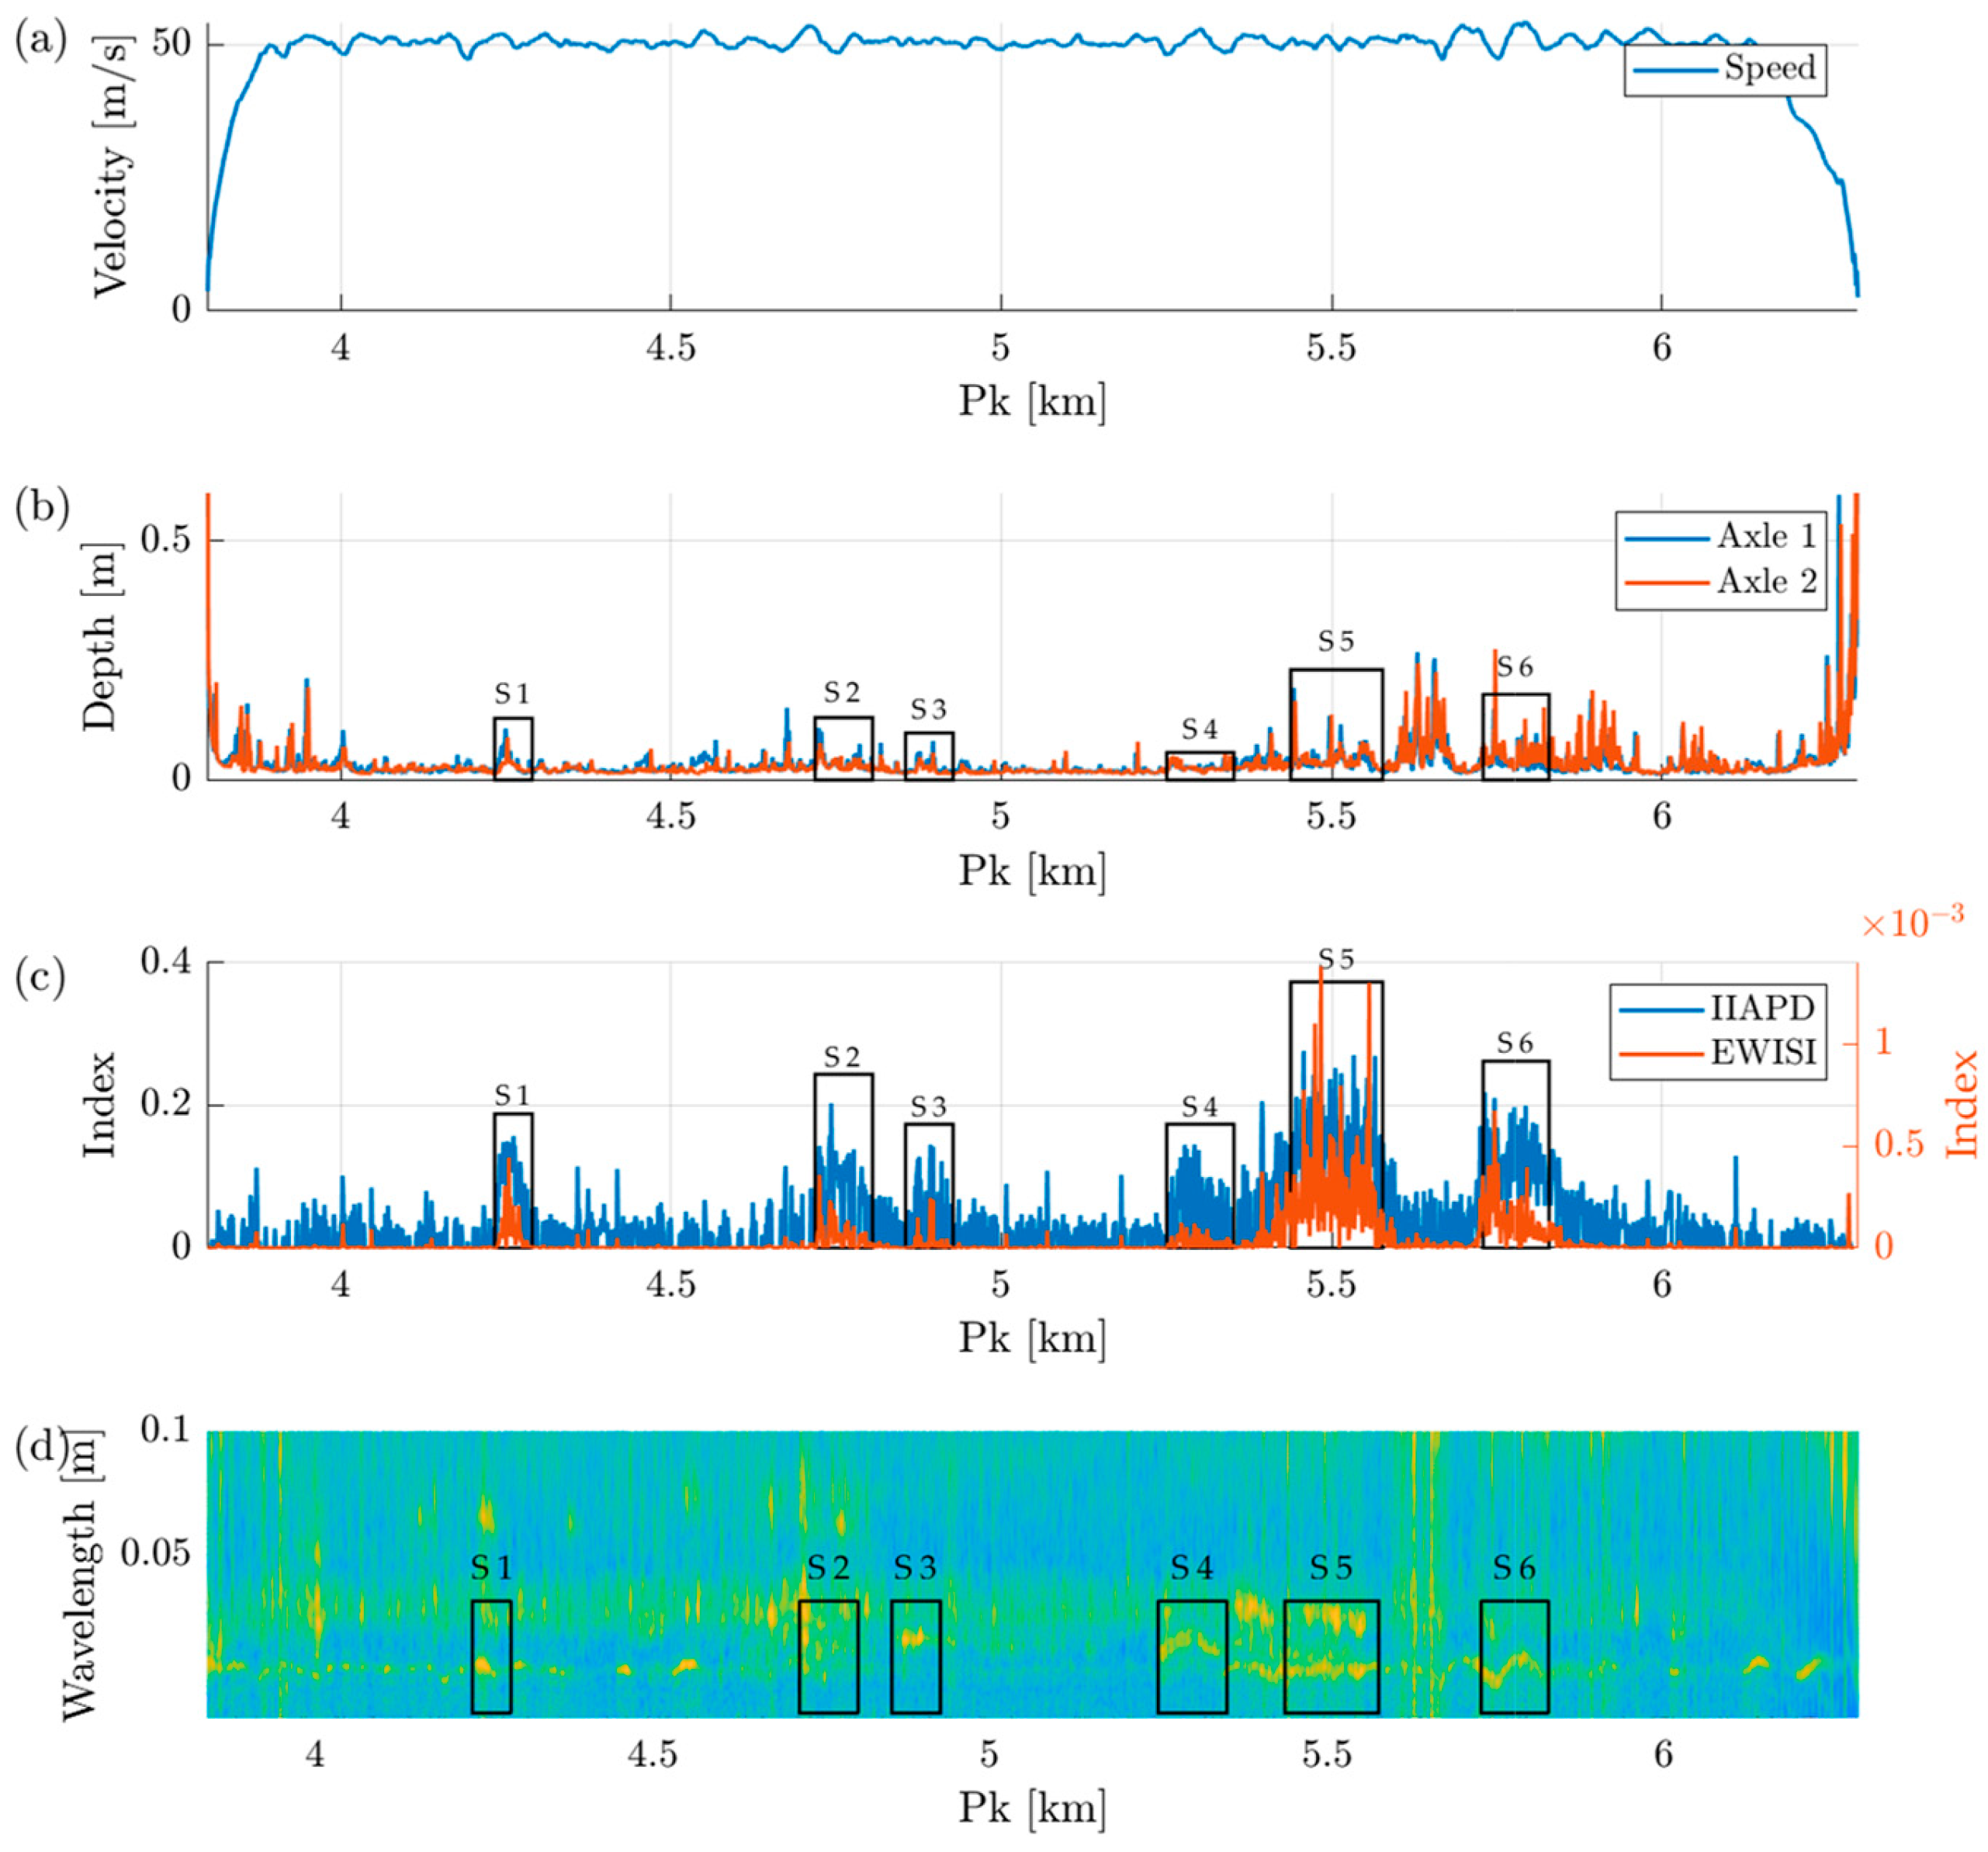
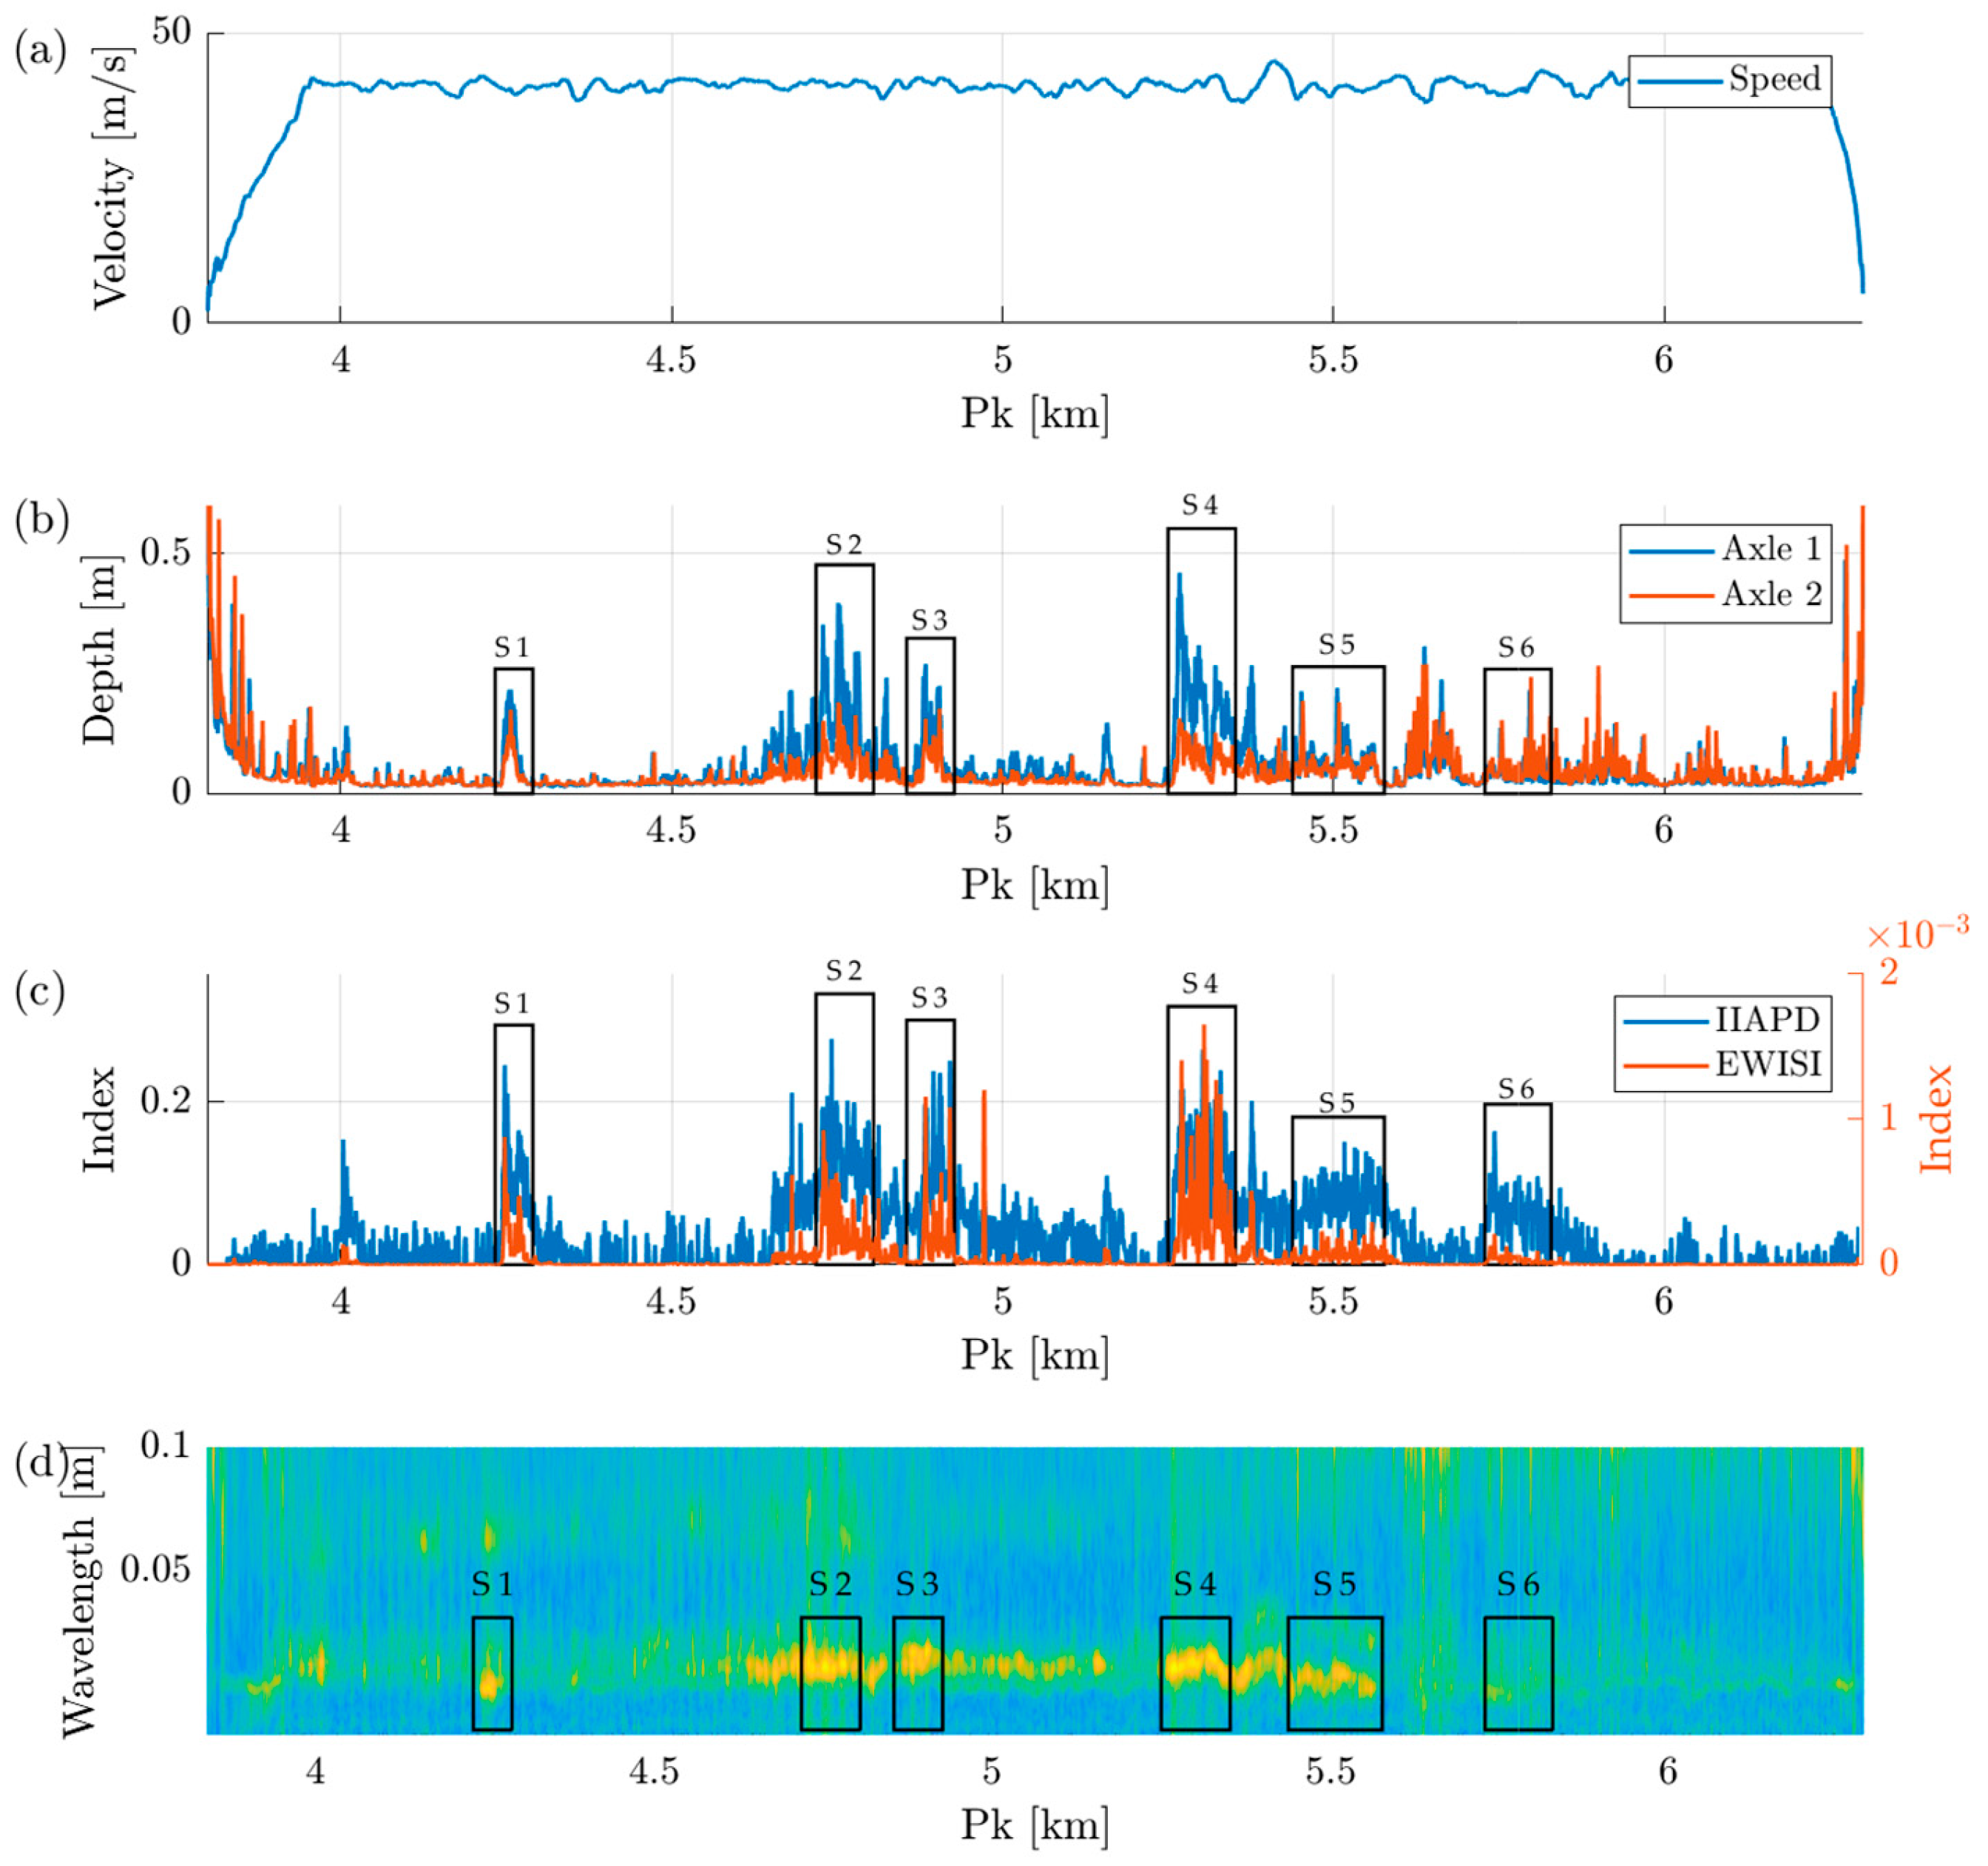
In addition, six sections of the route with confirmed presence of corrugation were delineated, previously identified through visual inspection, spectral analysis, and direct listening. These zones were used as a reference to evaluate the diagnostic capability of each approach. Figure 15, Figure 16, Figure 17 and Figure 18 present the results obtained for each speed. Each figure shows the following:
(a)
Speed profile;
(b)
Severity estimation according to the methodology of Bocciolone;
(c)
Results of the proposed indices, the IIAPD and EWISI;
(d)
Spectrogram according to the methodology of De Rosa.
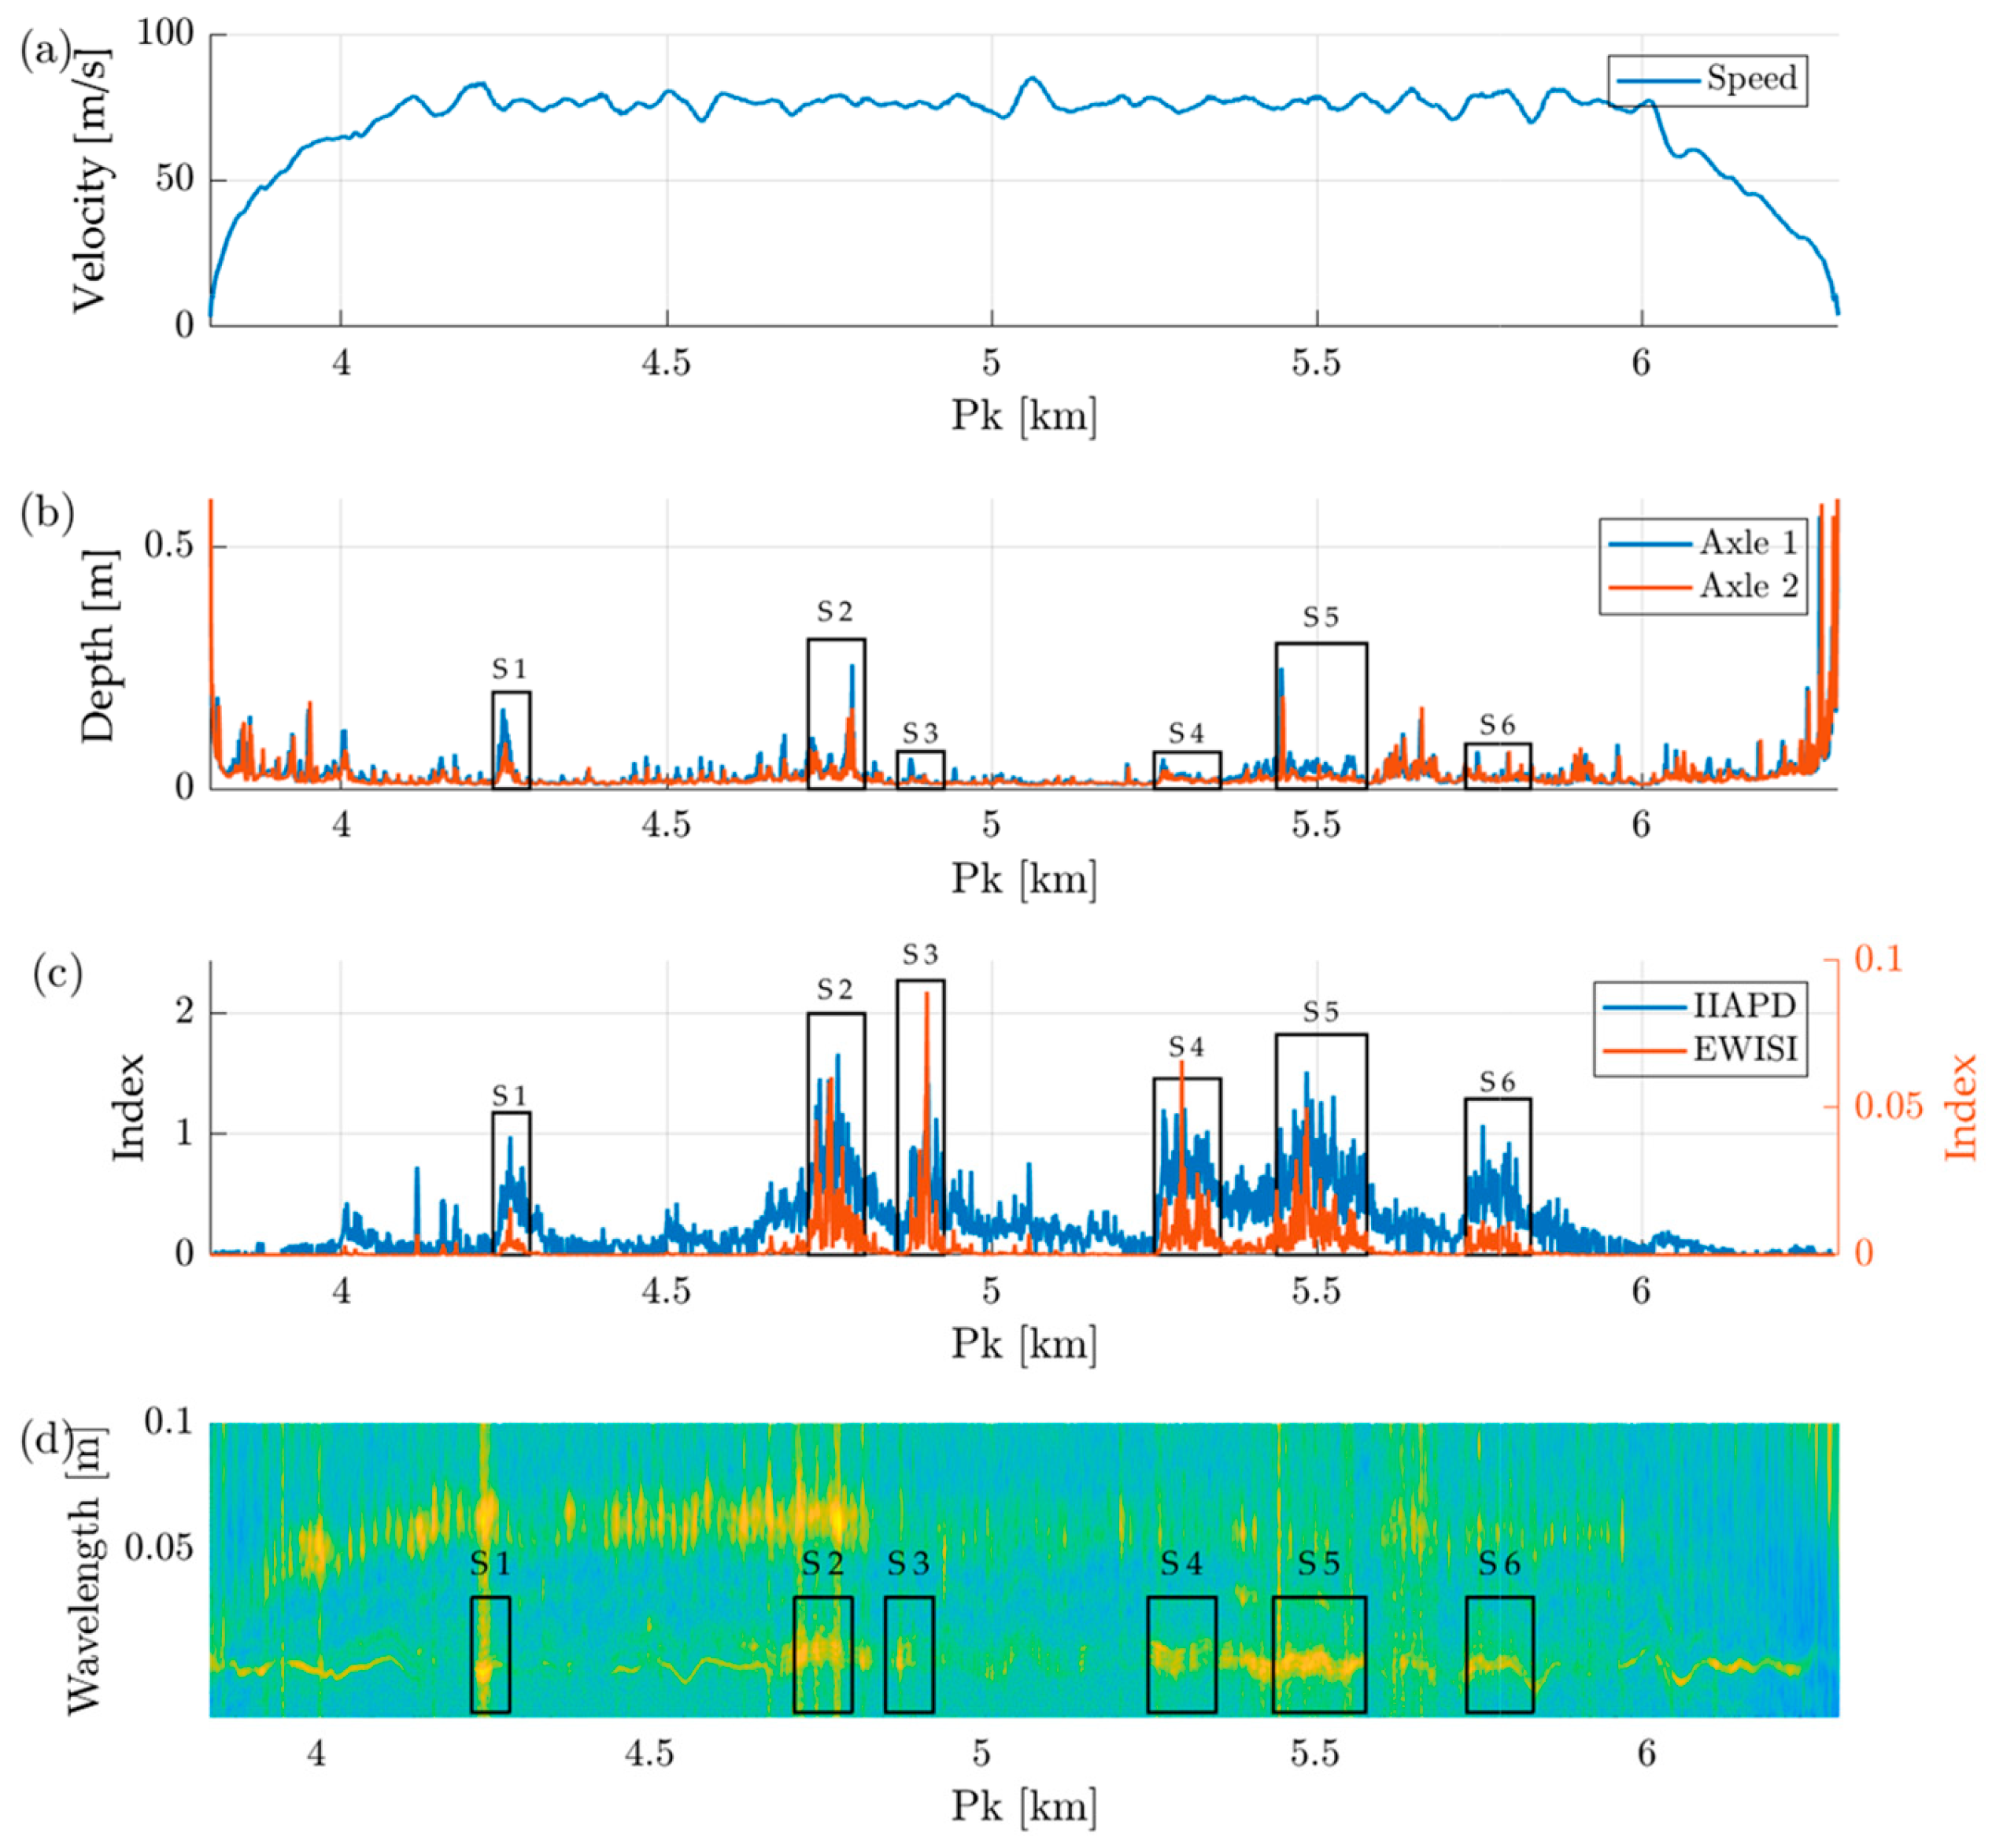
Figure 15. Comparison of methodologies at operating speed of 75 km/h. (a) Speed profile. (b) Bocciolone. (c) Proposed indices, IIAPD and EWISI. (d) De Rosa.
Mathematics 13 02815 g015
Figure 16. Comparison of methodologies at 60 km/h. (a) Speed profile. (b) Bocciolone. (c) Proposed indices, IIAPD and EWISI. (d) De Rosa.
Mathematics 13 02815 g016
Figure 17. Comparison of methodologies at 50 km/h. (a) Speed profile. (b) Bocciolone. (c) Proposed indices, IIAPD and EWISI. (d) De Rosa.
Mathematics 13 02815 g017
Figure 18. Comparison of methodologies at 40 km/h. (a) Speed profile. (b) Bocciolone. (c) Proposed indices, IIAPD and EWISI. (d) De Rosa.
Mathematics 13 02815 g018
The six affected sections are highlighted with black boxes to facilitate their identification and comparison.

3.1. Results at the Operating Speed (75 km/h)

At the operating speed of 75 km/h (see Figure 15), a clear correspondence is observed between the previously identified zones and the response of the proposed indices. Both the IIAPD and EWISI show peaks well aligned with the affected sections. The IIAPD displays a more extended response, while the EWISI highlights specific zones with higher energy concentration.
The Bocciolone methodology shows wide fluctuations along the route, with detections outside the critical zones, whereas De Rosa’s spectrogram allows for the identification of some characteristic horizontal bands, although its interpretation requires greater expert judgment and sufficient data availability.

3.2. Results at 60 km/h

At an intermediate speed (see Figure 16), the response of the proposed indices remains consistent. The IIAPD retains its ability to detect all six sections, although with lower intensity. The EWISI continues to highlight the most severe defects, with less dispersion.
The Bocciolone methodology loses discriminative power, showing erratic responses. Meanwhile, De Rosa’s method detects some sections but fails to identify sections S1 and S5, which had previously been confirmed as critical.

3.3. Results at 50 km/h

In this case (see Figure 17), a general attenuation in the spectral response is observed. However, the proposed indices maintain their detection capability: the IIAPD continues to respond in all sections, while the EWISI more clearly highlights the segments with higher energy.
The Bocciolone methodology shows isolated peaks unrelated to defects, whereas De Rosa’s method displays weak signals, especially in the central sections of the route (S3 and S4).

3.4. Results at 40 km/h

At this speed (see Figure 18), with lower dynamic excitation, the robustness of the IIAPD is confirmed, as it continues to identify all sections, although with lower amplitude. The EWISI mainly responds in the most severe zones (such as S2 and S4), which is consistent with its more restrictive logic.
On the other hand, the methodologies compared show notable limitations. Bocciolone is affected by speed variations and generates false positives, while De Rosa loses detection capability in S6.

3.5. Comparative Accuracy with Reference Methodologies

To quantify the diagnostic effectiveness of the proposed indices, their detection results were compared against the confirmed defective sections (S1–S6) and benchmarked with the reference methodologies of Bocciolone et al. [32] and De Rosa et al. [30]. Table 5 summarizes the number of correctly identified defective sections and the corresponding detection accuracy (%) for each speed.
The results confirm that the proposed methodology provides the highest and most consistent performance across all speeds, correctly identifying all defective sections in most cases and maintaining robustness even under reduced dynamic excitation. In particular, at 60 km/h, the IIAPD ensured coverage of all defective sections, while the EWISI responded only to the most severe defects, yielding a combined detection rate of 91.6%. In contrast, De Rosa’s spectrogram-based approach reached 66.6% accuracy at this speed, and Bocciolone’s index dropped to 33.3% due to sensitivity to speed variations and ambiguity caused by nearby non-defective components of similar amplitude.
When the results are aggregated across all recordings, the superiority of the proposed methodology becomes even more evident. The combined indices (IIAPD + EWISI) achieved a global diagnostic precision of nearly 98%, compared to 79% for De Rosa and only 58% for Bocciolone. This substantial improvement demonstrates the reliability of the proposed approach and its advantage in automatically detecting both moderate and severe corrugation under real operating conditions.

3.6. Validation Through Trolley-Based Measurement

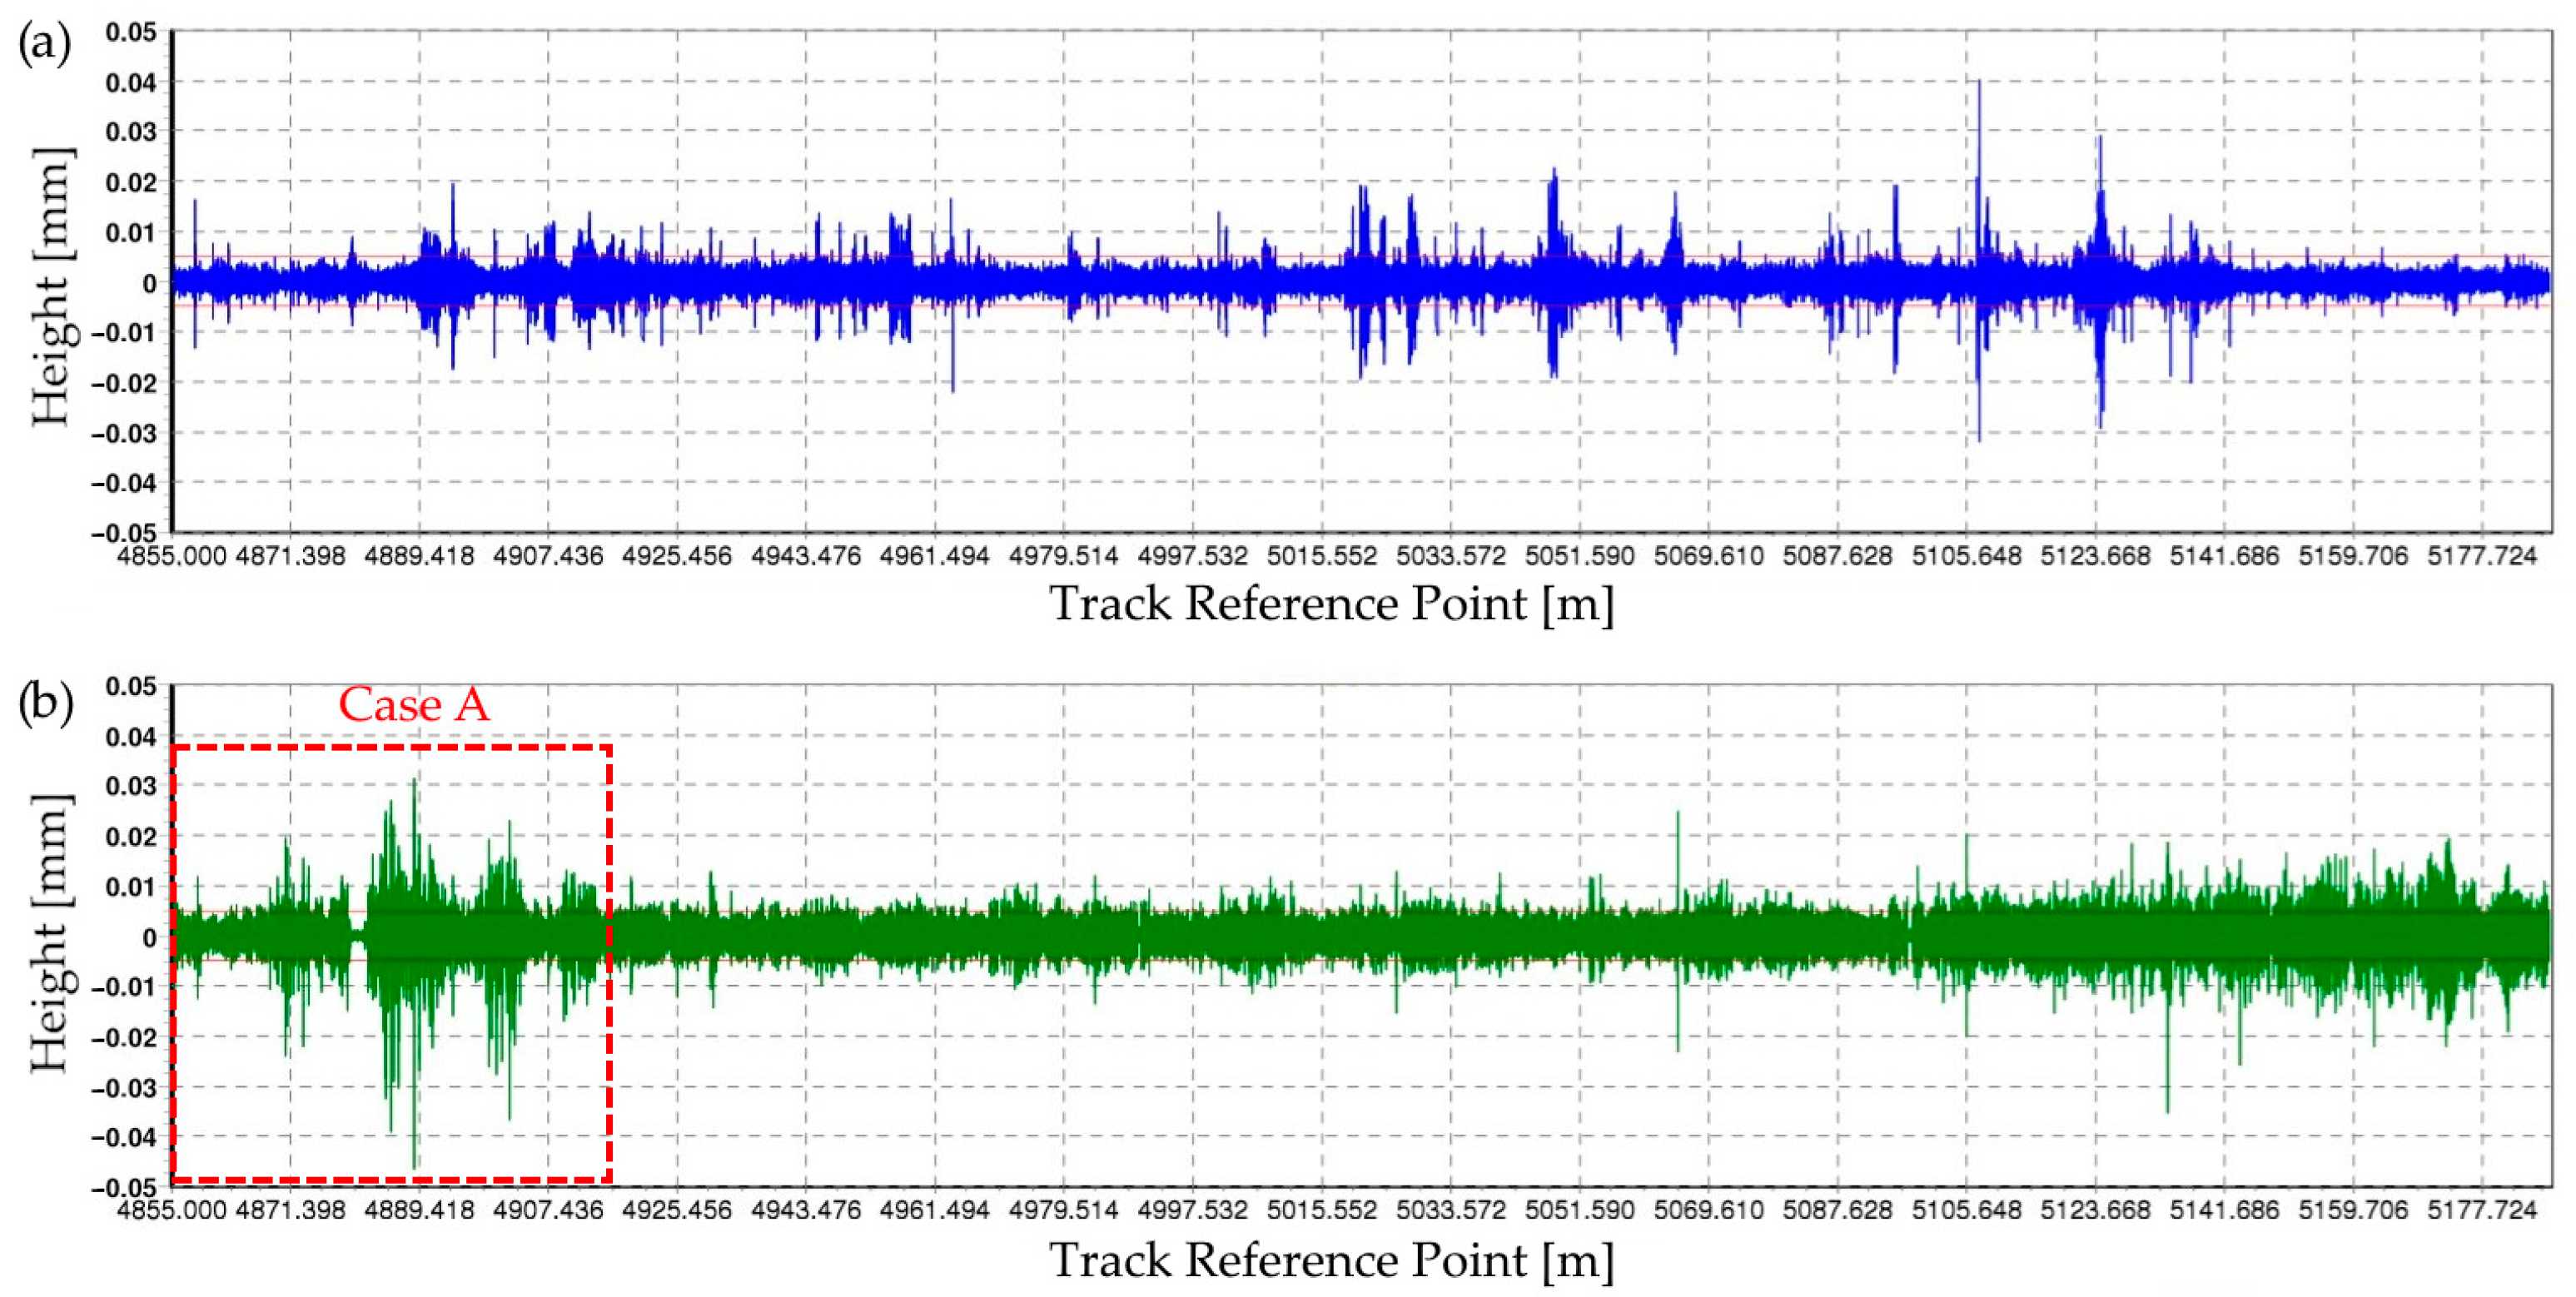
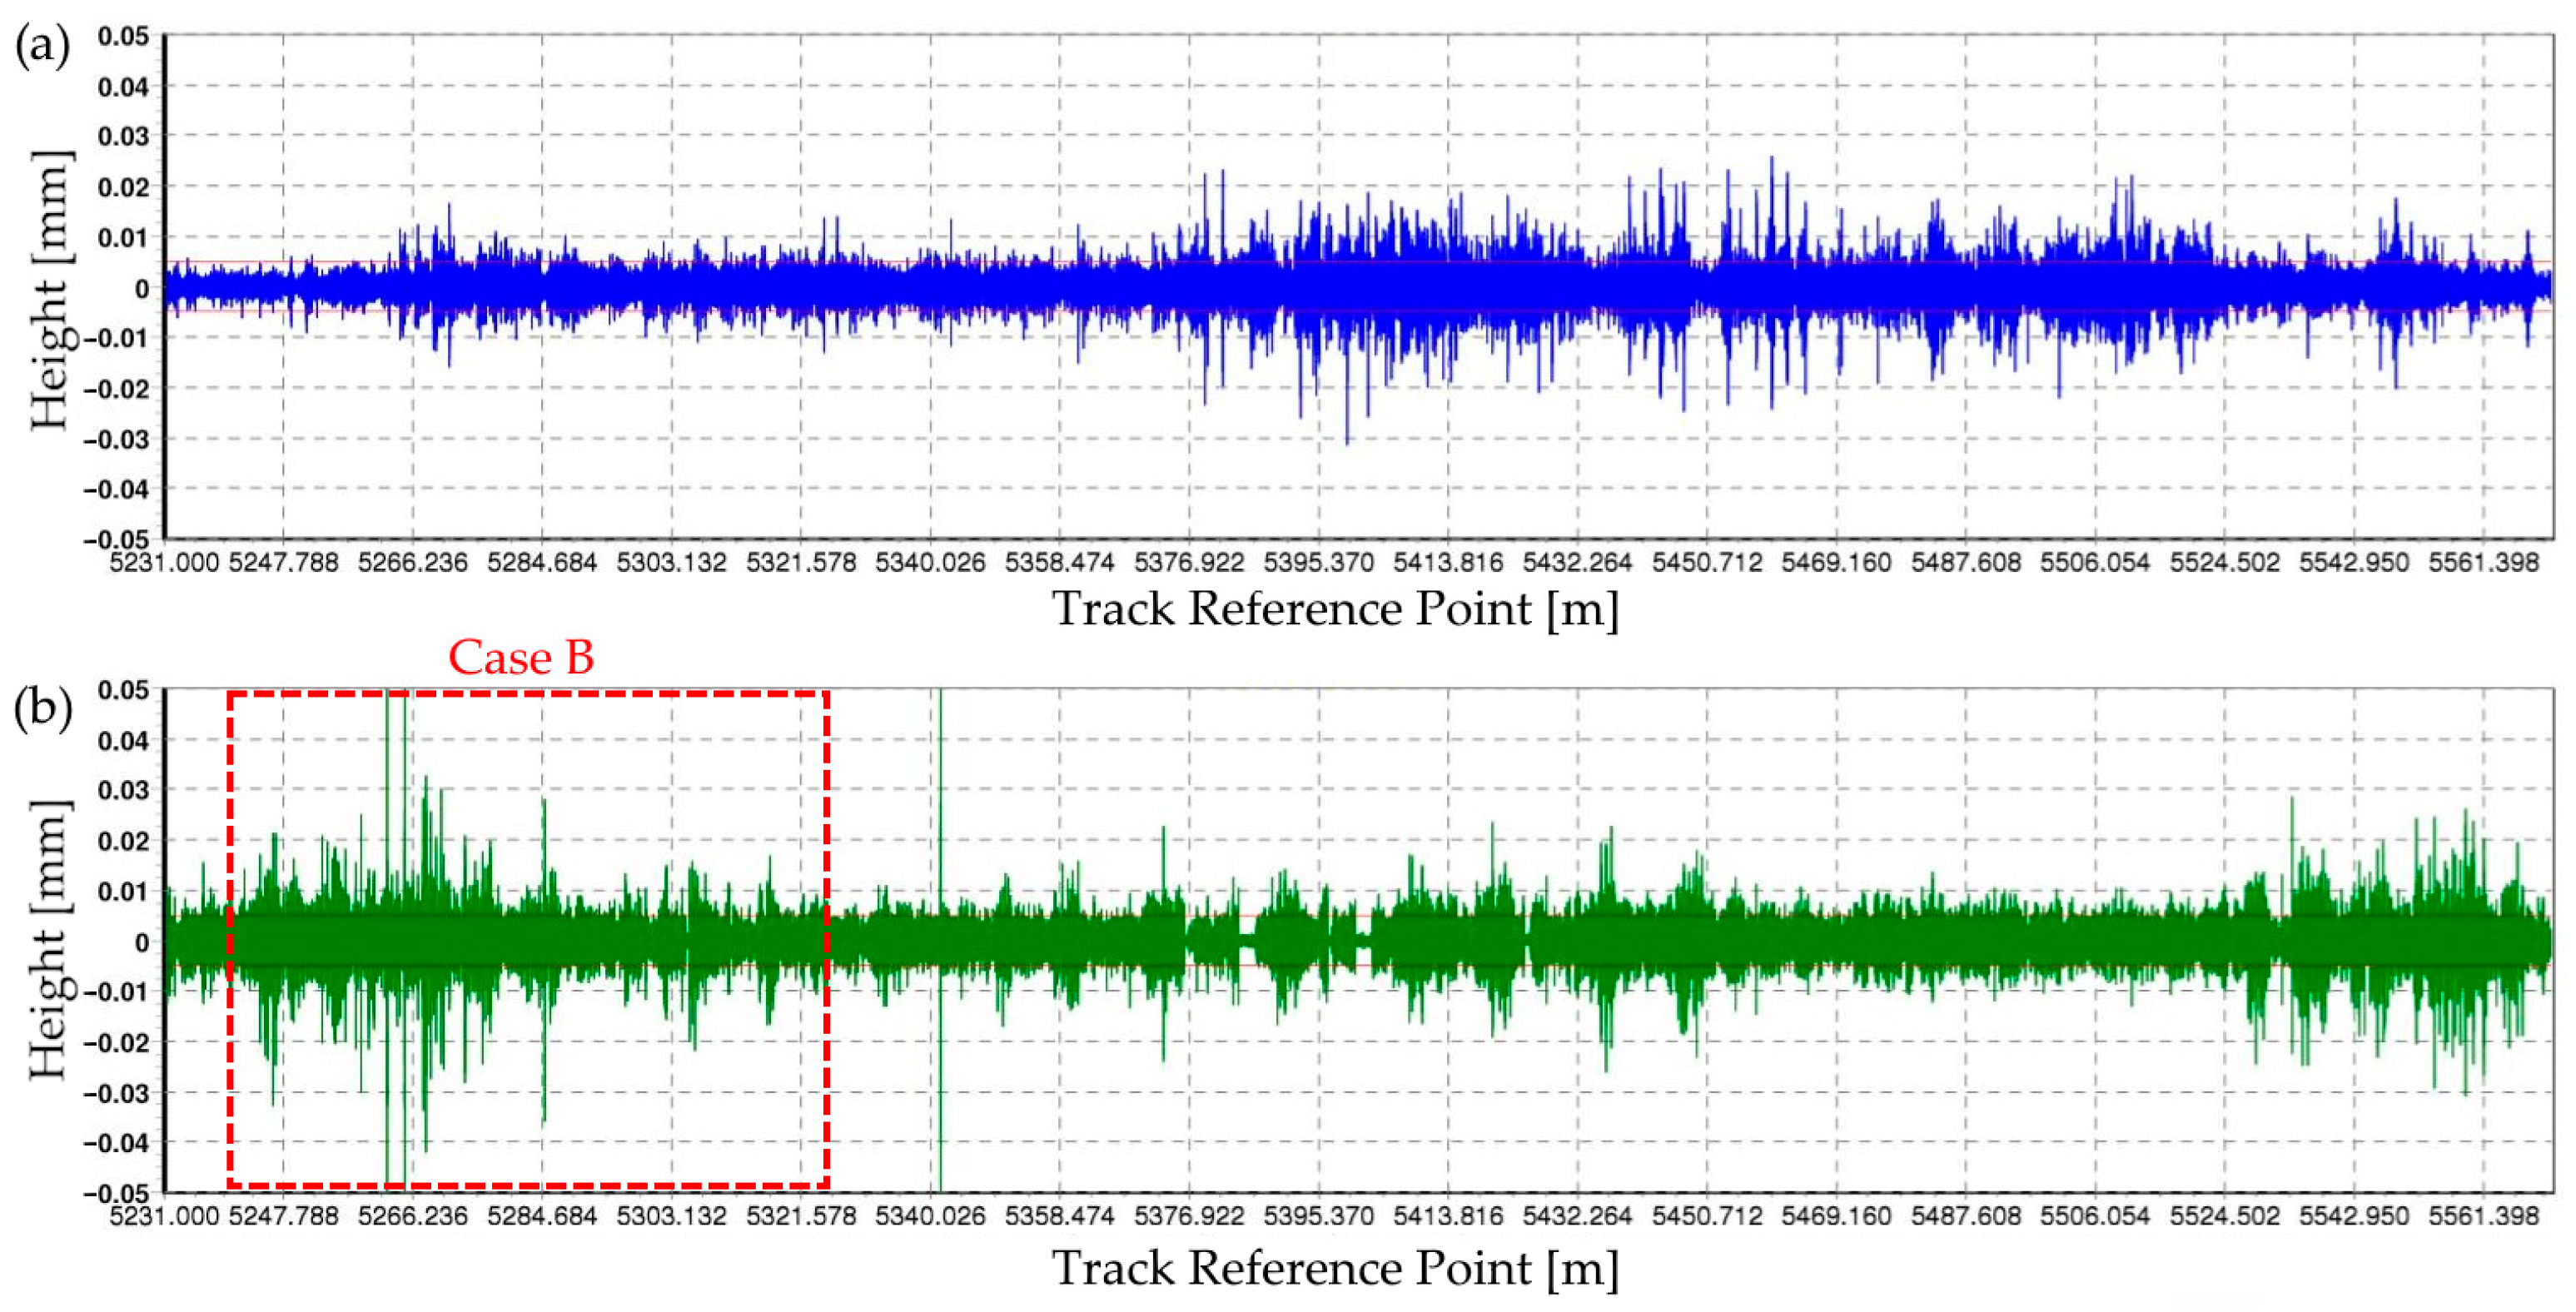
As a complement to the automatic sound-based diagnosis, an independent visual validation was carried out using profilometry with a trolley. The measurements covered extended track segments that include the zones previously identified as Case A and Case B during visual inspection (see Figure 5), corresponding approximately to sections Pk 4.855–4.914 and Pk 5.239–5.326, respectively.
Figure 19 presents the longitudinal roughness profile of both rails for a segment that includes Case A. In this profile, a wave-like pattern is observed on the right rail, with amplitudes exceeding 0.03 mm and a clear periodic repetition, consistent with the typical morphology of short-pitch corrugation. These irregularities spatially coincide with the zones where the IIAPD and EWISI detected higher impulsive spectral content.
Figure 20 shows the profile corresponding to a longer segment that includes Case B. In this case, the right rail exhibits oscillations of greater amplitude, exceeding 0.03 mm, and a persistent regular modulation within the interval consistent with the visually inspected segment. This severity matches the highest values recorded by the EWISI, which prioritizes spectral events with high energy and a well-defined impulsive pattern.
Although the graphs cover a broader range than that defined by visual inspection, the correspondence between the critical zones and the recorded spectral values reinforces the validity of the proposed indices and supports the applicability of acoustic analysis as a reliable tool for the indirect detection of corrugation.

4. Discussion

4.1. Comparative Analysis by Speed: Robustness and Diagnostic Capability

The comparison between methodologies reveals clearly differentiated behaviors. The results for each speed allow us to identify the advantages and limitations of each approach:
  • Bocciolone et al. [32]: The index shows high variability during acceleration and braking, which reduces its reliability. At low speeds, its sensitivity decreases drastically. Finally, normalization by quadratic speed introduces distortions that affect the coherence between recordings.
  • De Rosa et al. [30]: The spectrogram reveals areas with energy patterns compatible with corrugation, especially at high speeds. However, its interpretation requires prior experience, and at low speeds, key responses are lost (such as S5 at 60 km/h or S6 at 40 km/h).
  • Proposed methodology: Both the IIAPD and EWISI show consistent detections across the six identified sections, with greater sensitivity at 75 km/h and acceptable stability even at 40 km/h. The IIAPD highlights moderate and distributed defects, while the EWISI discriminates zones with greater spectral severity. The dual logic enables precise and tiered diagnosis, without relying on fixed thresholds or subjective interpretation.

4.2. Influence of Travel Direction and Dynamic Conditions

When comparing the recordings according to the direction of travel, relevant differences were observed between the methodologies:
  • Bocciolone shows strong dependence on train dynamics. During acceleration or braking phases, it generates responses that exceed the amplitudes of confirmed defective zones, affecting coherence between travel directions.
  • De Rosa offers greater stability in runs with similar conditions but loses detection capability in the reverse direction, especially at low speed. Additionally, the presence of energy in bands not associated with corrugation issues compromises its interpretation.
  • The proposed methodology (IIAPD and EWISI) presents a structured response by the direction of travel, with consistent spectral patterns aligned with kilometer position. The response is not affected by speed changes, and the indices maintain their selectivity without generating false positives during transitional phases. This resilience confirms their robustness against variable dynamic conditions and their applicability in real-world environments.
It is also worth noting that the test section included curved and counter-curved track segments with their respective transition areas, where the proposed indices showed robust and consistent performance without loss of detection capability.

4.3. Limitations of This Study

This study also presents some limitations that must be acknowledged. From a numerical perspective, the dynamic thresholds (e.g., impulsiveness threshold and adaptive prominence criteria) were derived from the specific dataset that was analyzed. While they proved effective in this case, their generalization to other lines may require further calibration. In addition, the proposed indices (IIAPD and EWISI) provide relative severity metrics but do not yet establish universal acceptance thresholds for defect severity, which remains a topic for future research. Experimentally, the validation was limited to a specific railway section with six confirmed corrugation cases, under controlled operating speeds up to 75 km/h. Other operational factors, such as different vehicle types, environmental conditions (e.g., rain, temperature), and structural elements like viaducts or bridges, were not explicitly considered. These aspects represent natural extensions for future experimental campaigns aimed at reinforcing the robustness and generalizability of the methodology.

5. Conclusions

This work presents a diagnostic methodology for the automatic detection of rail corrugation, based on the spectral analysis of interior sound recorded under real operating conditions. Through a controlled experimental design and the application of two specific indices (IIAPD and EWISI), the methodology accurately diagnosed all six visually confirmed corrugation sections at 75, 60, and 50 km/h. At 40 km/h, the IIAPD maintained full detection, while the EWISI responded more strongly in the most severe zones (such as S2 and S4) but still identified the remaining sections with lower index values.
The results demonstrate that the proposed methodology offers significant advantages over existing solutions. In particular, its diagnostic accuracy (97.9%) surpassed the next best-performing reference method (79.1%) by nearly 19 percentage points, quantitatively confirming its robustness under real operating conditions. Spatial segmentation by length, dynamic adjustment of the analysis band, and the combined use of PSD and FFT allow for the characterization not only of the presence of a defect but also of its relative severity. The dual logic of the indices provides diagnostic versatility, distinguishing between extensive or incipient defects and those with high spectral severity, without requiring manual intervention or subjective interpretation.
Moreover, the capture architecture, which integrates acoustic signals and speed, can be implemented with moderately complex instrumentation, without the need for external positioning or reference systems. This enables its integration into autonomous trains as an onboard system for continuous diagnostics.
As a future line of work, the development of adaptive severity thresholds for both indices is considered, automatically adjusted based on travel speed. This would enable real-time alerts and support progress towards an autonomous and scalable diagnostic system for predictive maintenance. In addition, we are working on collecting new real-world acoustic datasets from commercially operated metro lines, which will not only support the application of AI-based pattern recognition techniques but also include structural environments such as viaducts and bridges. This will enable a direct comparison with the deterministic IIAPD and EWISI, and the exploration of hybrid approaches that combine the interpretability of deterministic methods with the potential detection accuracy of trained AI models.
In summary, the methodology proposed in this work constitutes a mathematically grounded framework for the detection of corrugation defects based on acoustic signal analysis. Its formulation through functional spectral indices makes it suitable for integration into future autonomous monitoring systems, particularly under real operational constraints.

Author Contributions

Conceptualization, C.R.S.-O., J.M. and J.D.C.-M.; Methodology, J.D.C.-M., C.R.S.-O. and J.M.; Software, J.D.C.-M., C.R.S.-O. and J.M.; Validation, C.R.S.-O., J.M., J.D.C.-M. and J.M.M.; Formal analysis, C.R.S.-O. and J.D.C.-M.; Investigation, C.R.S.-O., J.D.C.-M. and J.M.M.; Resources, J.M.M.; Writing—original draft, C.R.S.-O. and J.D.C.-M.; Writing—review & editing, C.R.S.-O., J.D.C.-M. and J.M.M.; Supervision, J.D.C.-M. All authors have read and agreed to the published version of the manuscript.

Funding

This research received no external funding.

Data Availability Statement

The dataset supporting the findings of this study was deposited in Zenodo (https://zenodo.org/records/16569018, accessed on 28 August 2025).

Acknowledgments

All authors thank CITEF for its financial support and CITEF’s personnel for their assistance and help in the realization of this project.

Conflicts of Interest

The authors declare no conflicts of interest.

References

  1. Zhai, W.; Jin, X.; Wen, Z.; Zhao, X. Wear Problems of High-Speed Wheel/Rail Systems: Observations, Causes, and Countermeasures in China. Appl. Mech. Rev. 2020, 72, 060801. [Google Scholar] [CrossRef]
  2. Jin, X. Research Progress of High-Speed Wheel–Rail Relationship. Lubricants 2022, 10, 248. [Google Scholar] [CrossRef]
  3. Zhang, P.; Li, S.; Li, Z. Short Pitch Corrugation Mitigation by Rail Constraint Design. Int. J. Mech. Sci. 2023, 243, 108037. [Google Scholar] [CrossRef]
  4. Zhang, P.; Li, S.; Dollevoet, R.; Li, Z. Parametric Investigation of Railway Fastenings into the Formation and Mitigation of Short Pitch Corrugation. Rail. Eng. Sci. 2024, 32, 286–306. [Google Scholar] [CrossRef]
  5. Wang, Q.-A.; Huang, X.-Y.; Wang, J.-F.; Ni, Y.-Q.; Ran, S.-C.; Li, J.-P.; Zhang, J. Concise Historic Overview of Rail Corrugation Studies: From Formation Mechanisms to Detection Methods. Buildings 2024, 14, 968. [Google Scholar] [CrossRef]
  6. Wu, B.; Wang, W.; Pan, J.; Hu, Y.; Xu, R.; Ye, D.; Yan, W.; Zhang, R. Study on Corrugated Wear on High-Speed Railways Based on an Improved Finite Element Model of Wheel-Rail Rolling Contact. Tribol. Int. 2023, 179, 108199. [Google Scholar] [CrossRef]
  7. Ma, C.; Gao, L.; Xin, T.; Cai, X.; Nadakatti, M.M.; Wang, P. The Dynamic Resonance under Multiple Flexible Wheelset-Rail Interactions and Its Influence on Rail Corrugation for High-Speed Railway. J. Sound Vib. 2021, 498, 115968. [Google Scholar] [CrossRef]
  8. Bao, P.; Cui, X.; Ding, H.; Yin, Y.; Du, Z.; Yang, Z. Influences of Friction Self-Excited Vibration Characteristics of Various Types of High-Speed Trains on Rail Corrugations in Braking Sections. Eng. Fail. Anal. 2022, 134, 106087. [Google Scholar] [CrossRef]
  9. Wang, Y.; Wang, P.; Wang, Q.; Chen, Z.; He, Q. Using Vehicle Interior Noise Classification for Monitoring Urban Rail Transit Infrastructure. Sensors 2020, 20, 1112. [Google Scholar] [CrossRef]
  10. Soeta, Y.; Shimokura, R. The Impact of External Environments and Wheel-Rail Friction on Noise inside a Train Car. Noise Vib. Worldw. 2012, 43, 9–22. [Google Scholar] [CrossRef]
  11. Jeong, W.; Jeong, D. Acoustic Roughness Measurement of Railhead Surface Using an Optimal Sensor Batch Algorithm. Appl. Sci. 2020, 10, 2110. [Google Scholar] [CrossRef]
  12. Xin, T.; Wang, S.; Gao, L.; Huo, H.; Ding, Y.; Wang, P.; Chen, P.; Liu, P. Field Measurement of Rail Corrugation Influence on Environmental Noise and Vibration: A Case Study in China. Measurement 2020, 164, 108084. [Google Scholar] [CrossRef]
  13. Lei, X. Methods for Predicting the Ambient Vibration and Noise Resulting from Rail Transit. Proc. Inst. Mech. Eng. Part F J. Rail Rapid Transit 2020, 234, 1054–1067. [Google Scholar] [CrossRef]
  14. Tsai, K.-T.; Lin, M.-D.; Lin, Y.-H. Noise Exposure Assessment and Prevention around High-Speed Rail. Int. J. Environ. Sci. Technol. 2019, 16, 4833–4842. [Google Scholar] [CrossRef]
  15. Sadeghi, J.; Hasheminezhad, A. Correlation between Rolling Noise Generation and Rail Roughness of Tangent Tracks and Curves in Time and Frequency Domains. Appl. Acoust. 2016, 107, 10–18. [Google Scholar] [CrossRef]
  16. Thompson, D.J.; Hemsworth, B.; Vincent, N. Experimental Validation of the Twins Prediction Program for Rolling Noise, Part 1: Description of the Model and Method. J. Sound Vib. 1996, 193, 123–135. [Google Scholar] [CrossRef]
  17. Thompson, D.J.; Fodiman, P.; Mahé, H. Experimental Validation of the Twins Prediction Program for Rolling Noise, Part 2: Results. J. Sound Vib. 1996, 193, 137–147. [Google Scholar] [CrossRef]
  18. Thompson, D.J.; Jones, C.J.C. A review of the Modelling of Wheel/Rail Noise Generation. J. Sound Vib. 2000, 231, 519–536. [Google Scholar] [CrossRef]
  19. Prakash, A.; Tadepalli, T. A Review of Acoustic Signal-Based Detection of Damage in Railway Tracks. In Proceedings of the 2024 IEEE Conference on Engineering Informatics (ICEI), Melbourne, Australia, 20–28 November 2024; pp. 1–13. [Google Scholar]
  20. Yao, S.; Yue, L.; Xie, W.; Zheng, S.; Tang, S.; Liu, J.; Wang, W. Investigating the Influence of Non-Uniform Characteristics of Layered Foundation on Ground Vibration Using an Efficient 2.5D Random Finite Element Method. Mathematics 2024, 12, 1488. [Google Scholar] [CrossRef]
  21. UNE-EN 15610; Aplicaciones Ferroviarias. Acústica. Medición de la Rugosidad de los Carriles y de las Ruedas Relacionada con la Generación de Ruido de Rodadura. Asociación Española de Normalización: Madrid, Spain, 2020.
  22. Grassie, S.L. Rail Irregularities, Corrugation and Acoustic Roughness: Characteristics, Significance and Effects of Reprofiling. Proc. Inst. Mech. Eng. Part F J. Rail Rapid Transit 2012, 226, 542–557. [Google Scholar] [CrossRef]
  23. Mori, H.; Tsunashima, H.; Kojima, T.; Matsumoto, A.; Mizuma, T. Condition Monitoring of Railway Track Using In-Service Vehicle. J. Mech. Syst. Transp. Logist. 2010, 3, 154–165. [Google Scholar] [CrossRef]
  24. Xiao, B.; Liu, J.; Zhang, Z. A Heavy-Haul Railway Corrugation Diagnosis Method Based on WPD-ASTFT and SVM. Shock. Vib. 2022, 2022, 8370796. [Google Scholar] [CrossRef]
  25. Han, J.; Xiao, X.; Wu, Y.; Wen, Z.; Zhao, G. Effect of Rail Corrugation on Metro Interior Noise and Its Control. Appl. Acoust. 2018, 130, 63–70. [Google Scholar] [CrossRef]
  26. UNE-EN ISO 3095; Acústica. Aplicaciones Ferroviarias. Medición Del Ruido Emitido Por Vehículos Que Circulan Sobre Carriles. Asociación Española de Normalización: Madrid, Spain, 2014.
  27. Shafique, R.; Siddiqui, H.-U.-R.; Rustam, F.; Ullah, S.; Siddique, M.A.; Lee, E.; Ashraf, I.; Dudley, S. A Novel Approach to Railway Track Faults Detection Using Acoustic Analysis. Sensors 2021, 21, 6221. [Google Scholar] [CrossRef]
  28. Siddiqui, H.U.R.; Saleem, A.A.; Raza, M.A.; Zafar, K.; Munir, K.; Dudley, S. IoT Based Railway Track Faults Detection and Localization Using Acoustic Analysis. IEEE Access 2022, 10, 106520–106533. [Google Scholar] [CrossRef]
  29. Sfayyih, A.H.; Sabry, A.H.; Jameel, S.M.; Sulaiman, N.; Raafat, S.M.; Humaidi, A.J.; Kubaiaisi, Y.M.A. Acoustic-Based Deep Learning Architectures for Lung Disease Diagnosis: A Comprehensive Overview. Diagnostics 2023, 13, 1748. [Google Scholar] [CrossRef] [PubMed]
  30. De Rosa, A.; Luber, B.; Müller, G.; Fuchs, J. Methodology to Detect Rail Corrugation from Vehicle On-Board Measurements by Isolating Effects from Other Sources of Excitation. Appl. Sci. 2024, 14, 8920. [Google Scholar] [CrossRef]
  31. Thompson, D.J. On the Relationship between Wheel and Rail Surface Roughness and Rolling Noise. J. Sound Vib. 1996, 193, 149–160. [Google Scholar] [CrossRef]
  32. Bocciolone, M.; Caprioli, A.; Cigada, A.; Collina, A. A Measurement System for Quick Rail Inspection and Effective Track Maintenance Strategy. Mech. Syst. Signal Process. 2007, 21, 1242–1254. [Google Scholar] [CrossRef]
  33. Li, S.; Núñez, A.; Li, Z.; Dollevoet, R. Automatic Detection of Corrugation: Preliminary Results in the Dutch Network Using Axle Box Acceleration Measurements. In Proceedings of the JRC2015, San Jose, CA, USA, 23–26 March 2015; American Society of Mechanical Engineers Digital Collection: San Jose, CA, USA, 2015. [Google Scholar]
  34. Hsu, W.-L.; Chang, C.-M. Rail Corrugation Index Development by Sound-Field Excitation on the Carriage Floor of In-Service Train. Sensors 2023, 23, 7539. [Google Scholar] [CrossRef]
  35. Jeong, W. Spectral Characteristics of Rail Surface by Measuring the Growth of Rail Corrugation. Appl. Sci. 2021, 11, 9568. [Google Scholar] [CrossRef]
  36. Han, J.; Wang, H.; Zhao, G.; Liu, X.; Xiao, X.; He, Y. Indirect Detection of Short-Pitch Rail Corrugation Using Acoustic Signal. IEEE Trans. Instrum. Meas. 2025, 74, 1–13. [Google Scholar] [CrossRef]
  37. Khan, D.; Burdzik, R. Measurement and Analysis of Transport Noise and Vibration: A Review of Techniques, Case Studies, and Future Directions. Measurement 2023, 220, 113354. [Google Scholar] [CrossRef]
  38. Zhou, W.; Li, X.; Shi, X. Joint Optimization of Time-Dependent Line Planning and Differential Pricing with Passenger Train Choice in High-Speed Railway Networks. Mathematics 2023, 11, 1290. [Google Scholar] [CrossRef]
  39. Cano-Moreno, J.D.; de Pedro, J.M.M.S.; Villagrá, M.R.; González, R.G. Design and Development of a Data Acquisition System to Monitor Comfort and Safety in Railways. Insight—Non-Destr. Test. Cond. Monit. 2021, 63, 47–54. [Google Scholar] [CrossRef]
  40. Donkoh, E.K.; Opoku, A.A. Optimal Geometric Disks Covering Using Tessellable Regular Polygons. JMR 2016, 8, 25. [Google Scholar] [CrossRef]
  41. UNE-EN 13231-5; Aplicaciones Ferroviarias. Vía. Recepción de Trabajos. Parte 5: Procedimientos Para El Reperfilado de Carril En Plena Vía, Interruptores, Cruces y Dispositivos de Expansión. Asociación Española de Normalización: Madrid, Spain, 2019.
  42. Zhao, Y.; Zhao, C.; Wang, L.; Wang, P. A Rail Corrugation Evaluation Method Using Fractal Characterization Based on Structure Function Method. Wear 2022, 506–507, 204454. [Google Scholar] [CrossRef]
  43. Soto Ocampo, C.R. Desarrollo de un Sistema de Diagnóstico de Maquinaria Rotativa: Aplicación a Rodamientos de Apoyo de ejes Ferroviarios. Ph.D. Thesis, Universidad Politécnica de Madrid, Madrid, Spain, 2023. [Google Scholar]
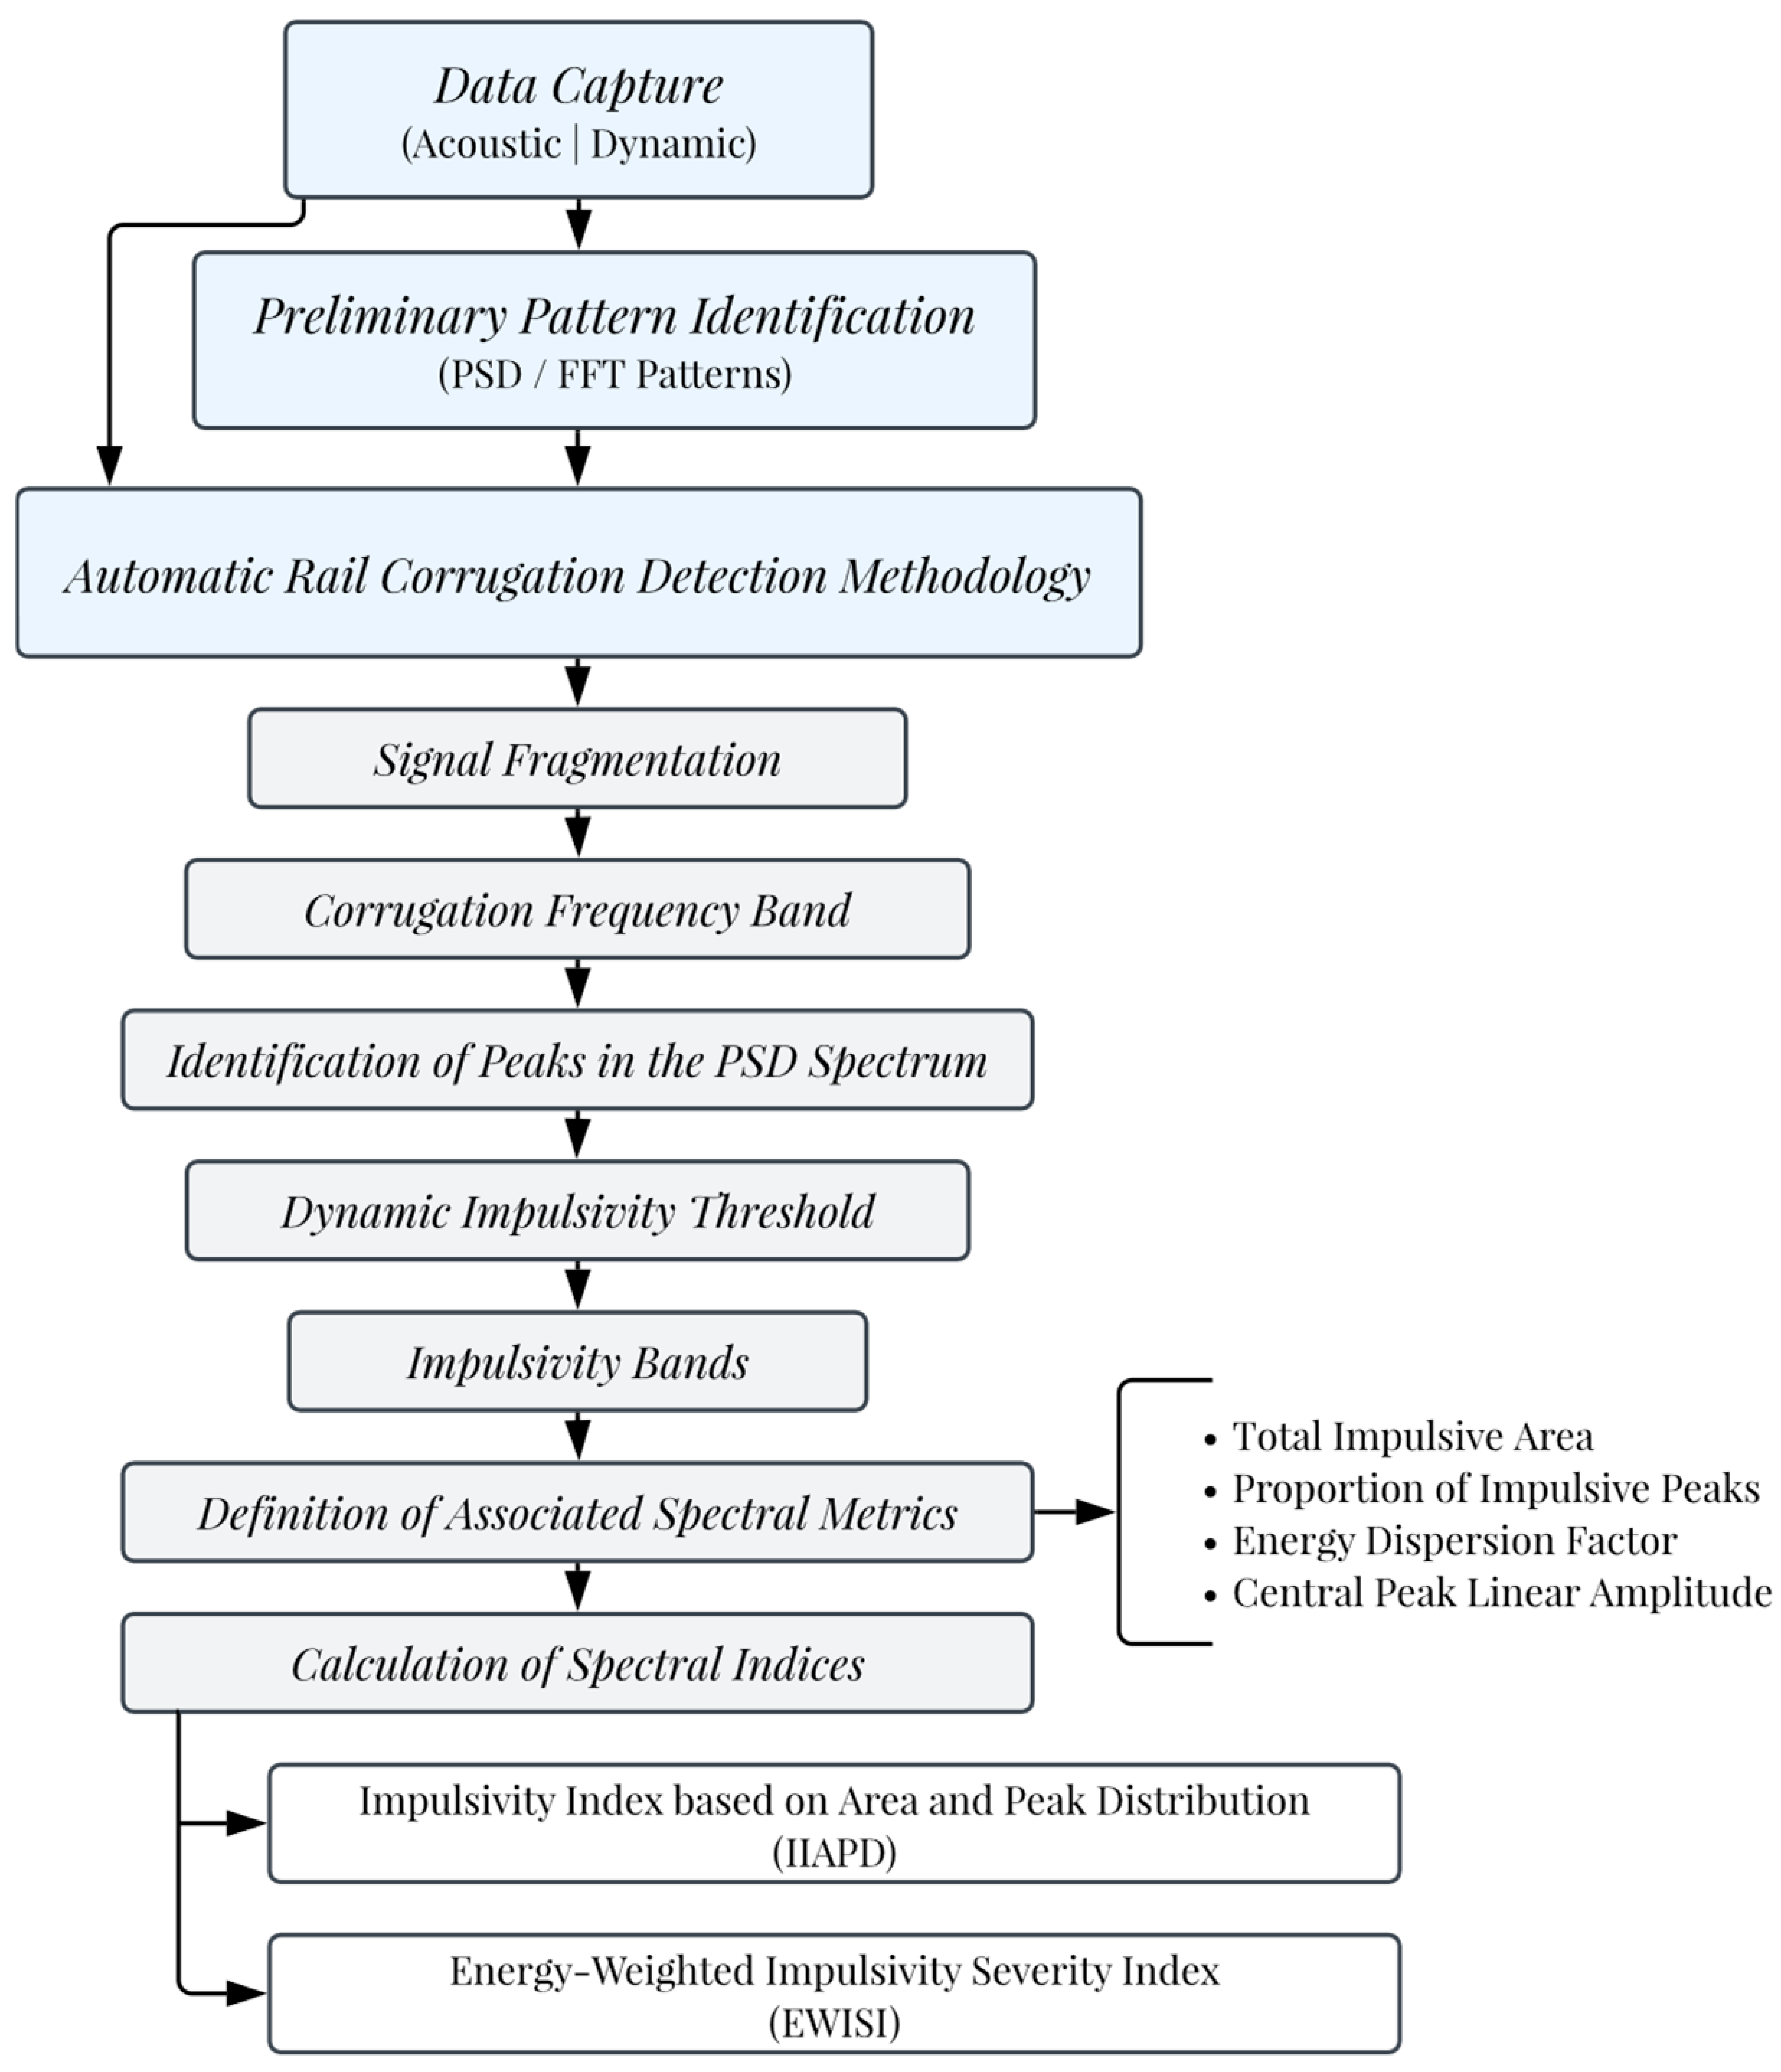
Figure 1. Block diagram of the proposed methodology for automatic rail corrugation detection, showing the three main phases: data acquisition, preliminary pattern characterization, and automated diagnosis using spectral indices (IIAPD and EWISI).
Mathematics 13 02815 g001
Figure 2. Architecture of the data acquisition system, based on Raspberry Pi 3B.
Mathematics 13 02815 g002
Figure 3. Layout of sensors and connections to the data acquisition system (accelerometers, Doppler radar, and sound recording).
Mathematics 13 02815 g003
Figure 4. Relationship between the acoustic signal and kilometer position at different travel speeds: (a) operating speed (75 km/h), (b) 60 km/h, (c) 50 km/h, and (d) 40 km/h.
Mathematics 13 02815 g004
Figure 5. Track zones with severe corrugation. Kilometric position: Case A (4.855–4.914); and Case B (5.239–5.326).
Mathematics 13 02815 g005
Figure 6. Spectrogram of the sound recording at the operating speed of 75 km/h, showing high-energy bands (red box) associated with corrugation defects.
Mathematics 13 02815 g006
Figure 7. Spectrograms of acoustic signals at different speeds: (a) operating speed of 75 km/h, (b) 60 km/h, (c) 50 km/h, and (d) 40 km/h.
Mathematics 13 02815 g007
Figure 8. Spectral analysis of Section 4 identified with possible corrugation problems (operating speed of 75.8 km/h).
Mathematics 13 02815 g008
Figure 9. Representation of the sound spectrum for the same track segment (Case B): (a) power spectral density (PSD) showing local maxima and (b) fast Fourier transform (FFT) highlighting clustered impulsive components.
Mathematics 13 02815 g009
Figure 10. Example frequency band for corrugation defects with wavelengths of 10 to 100 mm.
Mathematics 13 02815 g010
Figure 11. PSD spectrum of an acoustic segment x w . The red box marks the corrugation study band. Asterisks indicate study peaks considered as possible corrugation indicators.
Mathematics 13 02815 g011
Figure 12. FFT spectrum of an acoustic segment x w . The horizontal line represents the dynamic impulsiveness threshold Timp, calculated from the full spectral amplitude vector (entire F F T x w spectrum). Peaks above this threshold are considered impulsive spectral components.
Mathematics 13 02815 g012
Figure 13. (ad) Evaluation of sideband impulsivity for spectral peaks identified as potential indicators of corrugation using PSD and FFT analysis.
Mathematics 13 02815 g013
Figure 19. Height profile measured with a trolley in Case A (Pk 4.855–4.914): (a) left rail and (b) right rail.
Mathematics 13 02815 g019
Figure 20. Height profile measured with a trolley in Case B (Pk 5.239–5.326): (a) left rail and (b) right rail.
Mathematics 13 02815 g020
Table 1. External sensors.
VariablesNumberLocationsSensorsImages
Vertical Acceleration2Axle box (one per axle)Accelerometer ICP 100 mV/g, range ±60 g [KS-76C-100]Mathematics 13 02815 i001
Signal conditioner IEPE [M33]Mathematics 13 02815 i002
Low-Pass Filter 10 kHz [M29]
Linear Speed1Bogie frameRADAR based on Doppler effect [GSS15C]Mathematics 13 02815 i003
Table 2. Frequency bands for the identification of problems at wavelengths from 10 to 100 mm, at different speeds.
CaseMean Speed [km/h]fmin [Hz]fmax [Hz]
1752032032
2601671667
3501391389
4401111111
Table 3. Detected areas of potential corrugation problems at different operating speeds.
SectionInitial Pk [km]Final Pk [km]
S14.2434.300
S24.7184.805
S34.8554.927
S45.2505.352
S55.4385.577
S65.7295.829
Table 4. Evaluation of the six sections of each record identified as having potential corrugation problems. Frequency, wavelength, and noise level [f (Hz) (λ (mm)) [dB]].
SpeedSection 1Section 2Section 3Section 4Section 5Section 6
Operation809 (26.2) [−29]715 (30.1) [−25]692 (30.4) [−26]727 (29) [−26]774 (27.5) [−26]844 (25.5) [−29]
60 km/h645 (26.1) [−25]610 (27.6) [−32]598 (28.4) [−37]586 (28.6) [−31]645 (26.4) [−28]692 (24.4) [−26]
50 km/h539 (26) [−39]481 (29.1) [−38]457 (30.7) [−41]469 (29.8) [−40]516 (27.2) [−34]563 (25.1) [−36]
40 km/h434 (25.8) [−35]387 (29.6) [−34]375 (30.8) [−35]375 (30.1) [−33]410 (27.3) [−37]446 (25.4) [−39]
Table 5. Diagnostic accuracy of the proposed methodology compared with reference methods across different train speeds.
SpeedProposed
(IIAPD + EWISI)
De Rosa [30]Bocciolone [32]
75 km/h6/6 (100%)6/6 (100%)3/6 (50%)
60 km/h5.5/6 (91.66%)4/6 (66.6%)2/6 (33.3%)
50 km/h6/6 (100%)4/6 (66.6%)3/6 (50%)
40 km/h6/6 (100%)5/6 (83.3%)6/6 (100%)
Disclaimer/Publisher’s Note: The statements, opinions and data contained in all publications are solely those of the individual author(s) and contributor(s) and not of MDPI and/or the editor(s). MDPI and/or the editor(s) disclaim responsibility for any injury to people or property resulting from any ideas, methods, instructions or products referred to in the content.