Article

A Statistical Analysis of the Effect of Fin Design Factors on the Cooling Performance and System Mass of PCM–Fin Structured BTMS for LIB Cell

1
Graduate School of Mechanical Engineering, Konkuk University, Seoul 05029, Republic of Korea
2
School for Engineering of Matter, Transport and Energy, Arizona State University, Tempe, AZ 85281, USA
3
School of Mechanical Engineering, Konkuk University, Seoul 05029, Republic of Korea
*
Author to whom correspondence should be addressed.
Mathematics 2025, 13(17), 2800; https://doi.org/10.3390/math13172800
Submission received: 16 July 2025 / Revised: 20 August 2025 / Accepted: 29 August 2025 / Published: 31 August 2025
(This article belongs to the Special Issue Engineering Thermodynamics and Fluid Mechanics)

Abstract

The low thermal conductivity of phase change material (PCM) critically constrains the cooling performance of PCM-based battery thermal management system (BTMS). To address this limitation, embedding high-thermal-conductivity fins into PCM was recently explored. However, it may increase the overall BTMS mass, degrading vehicle performance. Therefore, a quantitative evaluation of the effects of fin design on cooling performance and system mass is required. In this study, the effects of fin design factors in a PCM–fin structured BTMS on the maximum cell temperature and BTMS mass was analyzed using design of experiments (DoE) and analysis of variance (ANOVA). To characterize BTMS thermal behavior, a numerical model was developed by applying thermal fluid partial differential equations (PDEs) with the enthalpy–porosity method to represent the phase change of the PCM. Fin number, thickness, and angle were selected as design factors; responses were calculated through thermal fluid analysis. The results showed a trade-off between thermal performance and mass across all design factors. The number of fins had the greatest effect on maximum cell temperature (78.27%) but less on mass (28.85%). Fin thickness moderately affected temperature (16.71%) but strongly increased mass (63.93%). Fin angle had minimal impact, 4.10% on temperature and 3.10% on mass.

1. Introduction

In response to steadily intensifying global environmental regulations aimed at reducing greenhouse gas emissions, the transition from internal combustion engine vehicles to electric vehicles (EVs) has been significantly accelerating [1,2]. Lithium-ion batteries (LIBs) have become the widely adopted energy source for EVs owing to their high energy density, long life cycle, and low self-discharge rate [3,4]. However, considerable heat is generated within LIB cells during charging and discharging processes due to internal resistance and entropy change [5]. Without sufficient heat dissipation, thermal accumulation within the battery cells can lead to overheating, thereby degrading cell performance, shortening lifespan, and compromising operational safety. Furthermore, if excessive cell temperatures are not promptly controlled, the likelihood of thermal runaway increases substantially [6,7]. Accordingly, effective battery cooling through a battery thermal management system (BTMS) is required to maintain the appropriate operating temperature range of 288.15–313.15 K [8].
Cooling strategies of BTMS are mainly classified into four types: air cooling [9,10], liquid cooling [11,12], heat pipe cooling [13,14], and phase change material (PCM)-based cooling [15,16]. Air cooling systems are widely adopted due to their structural simplicity, but their limited cooling capacity often fails to meet the thermal requirements of long-range EV applications [11]. Liquid cooling provides superior thermal performance, but their cost of additional power consumption and system complexity remain significant limitations [17]. Heat pipes have recently gained interest owing to their heat transfer efficiency and long-term durability; however, their implementation cost remains a considerable drawback [18].
PCMs are capable of absorbing substantial amounts of latent heat during phase transitions, offering a passive and energy-efficient solution for battery thermal regulation [19]. Compared with other techniques, PCM-based cooling systems require no external power, offer cost advantages, and promote spatial temperature uniformity. Nevertheless, the intrinsically low thermal conductivity of PCMs considerably limits their heat dissipation capability [20]. To address this limitation, many previous studies have been conducted on incorporating thermally conductive additives such as aluminum particles [21], nanoparticles [22], carbon fibers [23], and expanded graphite (EG) [24] into PCM matrices. These materials significantly enhance the heat dissipation capability of PCM and thus improve temperature regulation performance of BTMS [25]. However, the addition of metallic fillers may cause sedimentation and agglomeration during PCM melting due to density differences, which deteriorates thermal uniformity across the battery module [26,27].
Recently, incorporating high-thermal-conductivity metallic fins into the PCM domain has emerged as a promising approach to overcome this limitation. The increased interfacial area facilitated by the fins improves heat transfer between the battery and the PCM, thereby enhancing the overall thermal response and mitigating thermal accumulation. Owing to their ease of manufacturing and installation flexibility, metallic fins are widely utilized in thermal management of electronic systems [28]. Given that the heat transfer area provided by the fins directly affects BTMS performance, various studies have investigated the influence of fin design factors on cooling characteristics. Choudhari et al. numerically examined the effects of fin geometry, number, thickness, and external convective heat transfer coefficient under different discharge rates in a PCM–fin BTMS [29]. Li et al. used computational fluid dynamics (CFD) to evaluate the effects of fin number, aspect ratio, shape, and material, demonstrating that novel fractal-shaped fins outperform conventional straight fins in both thermal dissipation capability and temperature uniformity [30]. Sun et al. introduced a novel composite fin structure combining straight and arched profiles, thereby expanding the thermal conduction pathways and increasing heat transfer surface area [31]. Sutheesh et al. numerically assessed a PCM system with honeycomb-shaped fin, showing that the advanced configuration achieved lower maximum cell temperatures across all C-rates compared to no fin and simple honeycomb-shaped fin [32]. Dagdevir et al. analyzed the impact of helical fin width, number of rounds, and EG fraction in composite PCM on BTMS thermal response, reporting that increasing these design factors prolongs the battery’s safe operational time [33]. Despite these efforts, most existing studies have not conducted a detailed quantitative assessment of individual fin design factors in relation to thermal performance and mass.
Although the integration of the fins effectively enhances the heat dissipation performance of PCM, it inevitably leads to an increase in BTMS mass, which can adversely impact EV driving range and dynamic performance. Therefore, a detailed quantitative comparison of the influence of each fin design factor on both cooling performance and BTMS mass is necessary. However, most prior investigations have been limited to basic parametric studies, often relying on qualitative interpretation of simulation results without statistical justification. More recently, some studies have moved beyond simple parametric analysis by employing a surrogate model and multi-objective optimization to improve the thermal performance of PCM-integrated BTMSs. Zhang et al. optimized BTMS parameters using high-dimensional surrogate models and an extended elitist non-dominated sorting genetic algorithm (E-NSGA-II) to simultaneously minimize the maximum battery temperature and system weight in a hybrid BTMS [34]. While these methods aim to derive optimal designs, studies addressing the statistical significance and contribution of individual fin design factors remain scarce. Thus, a statistical approach is required to systematically quantify the influence of each design factor on battery temperature and BTMS mass.
In this study, a statistical methodology was proposed to quantitatively evaluate the effects of fin design factors on the thermal performance and mass of a PCM–fin structured BTMS for a cylindrical 18,650 LIB cell. A numerical model was developed to characterize the thermal behavior of the BTMS by applying governing equations of thermal fluid analysis with the enthalpy–porosity method to represent the phase change of the PCM. The number of fins ( N ), fin thickness ( t ), and fin angle ( θ ) were selected as the design factors. The maximum cell temperature ( T m a x ) and BTMS mass ( m ) were defined as the responses. Sampling points were generated using design of experiments (DoE), and thermal fluid analysis was performed to compute the responses at each sampling point. All three design factors were found to exhibit a trade-off relationship between thermal performance and BTMS mass. Subsequently, analysis of variance (ANOVA) was conducted to quantify the statistical significance and contribution of each design factor. The ANOVA results indicated that the number of fins had the highest impact on T m a x , contributing 78.27%, but its influence on m was relatively lower at 28.85%. In contrast, fin thickness had a more moderate effect on T m a x (16.71%) but exhibited a dominant contribution to m (63.93%). Fin angle showed the smallest effect among the considered factors, contributing 4.10% to T m a x and 3.10% to m .

2. Thermal Fluid Analysis Method of PCM–Fin Structured BTMS

2.1. 18650 Cylindrical LIB Cell with PCM-Fin Structured BTMS

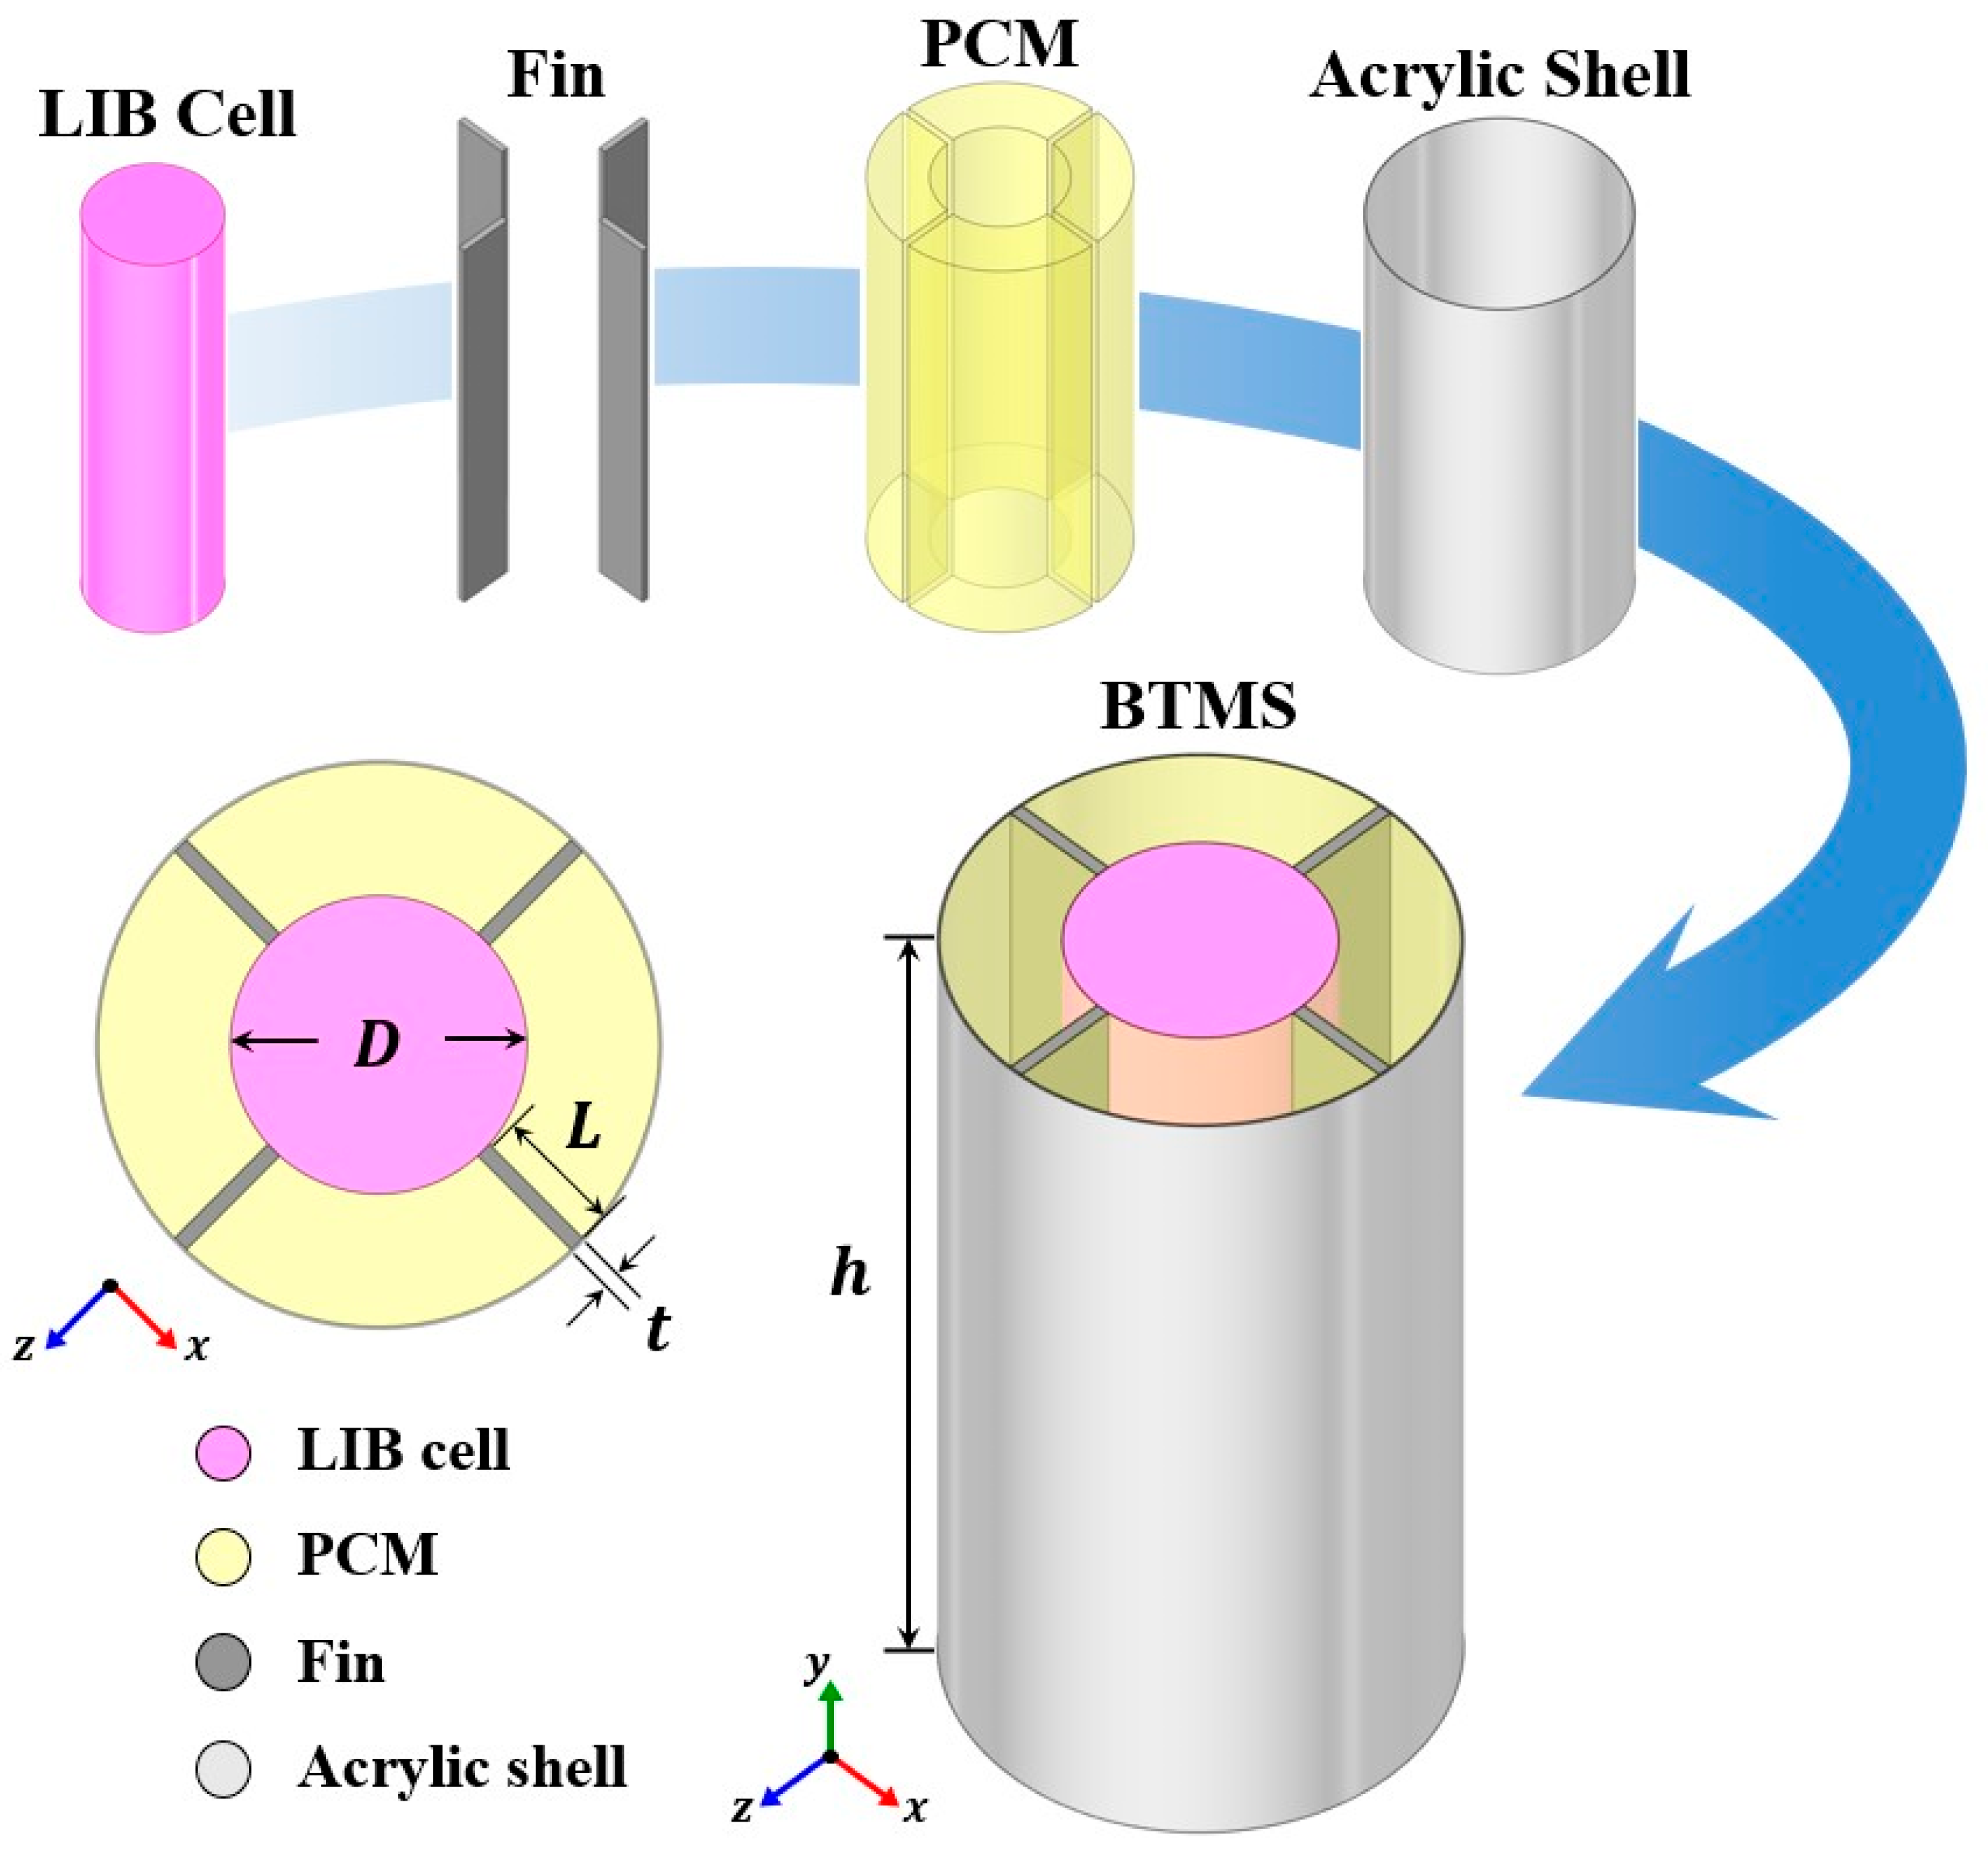
In this study, the Panasonic NCR18650PF cylindrical lithium-ion battery cell was selected to analyze the thermal behavior of the LIB. Figure 1a,b show the 18650 cylindrical lithium-ion battery cell and the phase change material (PCM), respectively. The PCM–fin structured BTMS for cooling the LIB cell is illustrated in Figure 2. A cylindrical cell with a diameter D = 18   m m and a height h = 65   m m is positioned at the center of the BTMS. Aluminum fins with a length L = 8   m m and thickness t = 1   m m are attached in contact with the outer surface of the cell. The outer structure of the BTMS is enclosed by an acrylic shell, and the space between the cell, fins, and shell is filled with paraffin-based PCM. The specifications of the LIB are summarized in Table 1, and the thermophysical properties of each material are listed in Table 2.

2.2. Numerical Analysis

2.2.1. Governing Equations

In this study, the thermal behavior of a battery thermal management system (BTMS) composed of PCM, a battery cell, aluminum fins, and an acrylic shell was analyzed numerically. The governing equations for the thermal fluid analysis were solved using the finite volume method (FVM) implemented in Ansys Fluent 2024R1. For the PCM undergoing phase change, the enthalpy–porosity method was employed. Based on the thermophysical characteristics of each component, the following governing equations were applied.
To simplify the numerical calculation and reduce computational cost, the following assumptions were adopted:
  • The phase state of PCM is homogeneous and isotropic [30].
  • The properties of the PCM in the solid and liquid phases are identical; thus, no volume change occurs due to phase transition [25,35].
  • The flow of liquid PCM is unsteady, laminar, and incompressible.
  • The effect of radiation heat transfer is neglected.
  • The BTMS interior is assumed to be fully filled with PCM without voids, and additional structural elements (e.g., encapsulation layers, other protective casings beyond the acrylic shell, and adhesives) are not considered.
  • The thermal contact resistance between the cell and the fins is neglected, assuming ideal thermal contact [31].
It should be noted that thermal contact resistance may affect heat transfer at material interfaces. However, it was not considered in this study to simplify the model, following previous work [31] that demonstrated its negligible effect under controlled contact conditions. Similarly, while considering temperature-dependent properties could improve the fidelity of thermal behavior prediction of PCM, it would also increase the computational complexity, and therefore constant and isotropic properties were assumed in this study for simplification.
Based on these assumptions, the numerical model of the BTMS was established. The governing equations for the PCM are as follows:
Continuity equation of PCM:
ρ P C M u x + ρ P C M v y + ρ P C M w z = 0
where ρ P C M denotes the density of the PCM [kg/m3], with u ,   v , and w representing the x-, y-, and z-components of the velocity of liquid PCM, respectively.
Momentum conservation equation of PCM:
ρ P C M u t + u u x + v u y + w u z = p x + μ P C M 2 u x 2 + 2 u y 2 + 2 u z 2 + S x
ρ P C M v t + u v x + v v y + w v z = p y + μ P C M 2 v x 2 + 2 v y 2 + 2 v z 2 + S y
ρ P C M w t + u w x + v w y + w w z = p z + μ P C M 2 w x 2 + 2 w y 2 + 2 w z 2 + S z
where μ p c m represents the dynamic viscosity of the liquid PCM [kg/(m·s)], and S is the momentum sink term, defined as in Equations (5)–(7).
S x = 1 β 2 β 3 + ε A m u s h u
S y = 1 β 2 β 3 + ε A m u s h v
S z = 1 β 2 β 3 + ε A m u s h w
where ε is a small constant introduced to avoid division by zero and A m u s h is the mush zone parameter, set to 10 5 [32]. β denotes the liquid fraction of the PCM, which is defined according to the phase change temperature range of the PCM, as given in Equation (8):
β =   0 ,     T < T s T T s T l T s ,     T s T T l 1 ,     T > T l
where T s and T l denote the solidus and liquidus temperature of the PCM, respectively.
Energy conservation equation of PCM:
ρ P C M H t + u H x + v H y + w H z = k P C M 2 T x 2 + 2 T y 2 + 2 T z 2
where k P C M is the thermal conductivity of the PCM [W/m·K] and H is the total enthalpy of the PCM [J/m3], which is calculated using Equations (10)–(12).
H = h s + H
h s = h r e f + T r T c p , P C M d T
H = β L
where h s is the sensible enthalpy, H is the enthalpy change, h r e f is the reference enthalpy at reference temperature T r e f , c p , P C M is the specific heat capacity of the PCM [J/kg·K], and L is the latent heat of the PCM [J/kg].
Energy conservation equation of battery:
ρ b c p , b T t = x k b T x + y k b T y + z k b T z + Q b
where ρ b , c p , b , k b , and Q b refer to the density [kg/m3], specific heat capacity [J/kg·K], thermal conductivity [W/m·K], and volumetric heat generation rate [W/m3] of the battery.
Energy conservation equation of fin:
ρ f c p , f T t = x k f T x + y k f T y + z k f T z
where ρ f , c p , f , and k f denote the density [kg/m3], specific heat capacity [J/kg·K], and thermal conductivity of the aluminum fins, respectively.
Energy conservation equation of acrylic shell:
ρ a c p , a T t = x k a T x + y k a T y + z k a T z
where ρ a , c p , a , and k a denote the density [kg/m3], specific heat capacity [J/kg·K], and thermal conductivity of the acrylic shell, respectively.

2.2.2. Initial and Boundary Conditions

The initial temperatures of all components in the PCM–fin structured BTMS were set to 300 K, assumed to be at room temperature conditions. In this study, a constant volumetric heat generation rate of 94,023.84   W / m 3 [29], corresponding to the heat generation at a 3C discharge rate, was applied to simplify the comparison of cooling performance among design factors and ensure computational efficiency. Assuming natural convection, a convective heat transfer coefficient of 5 W/m2·K and an ambient temperature of T = 300   K were applied to all external surfaces of the BTMS exposed to air.

2.2.3. Grid and Time Step Independence

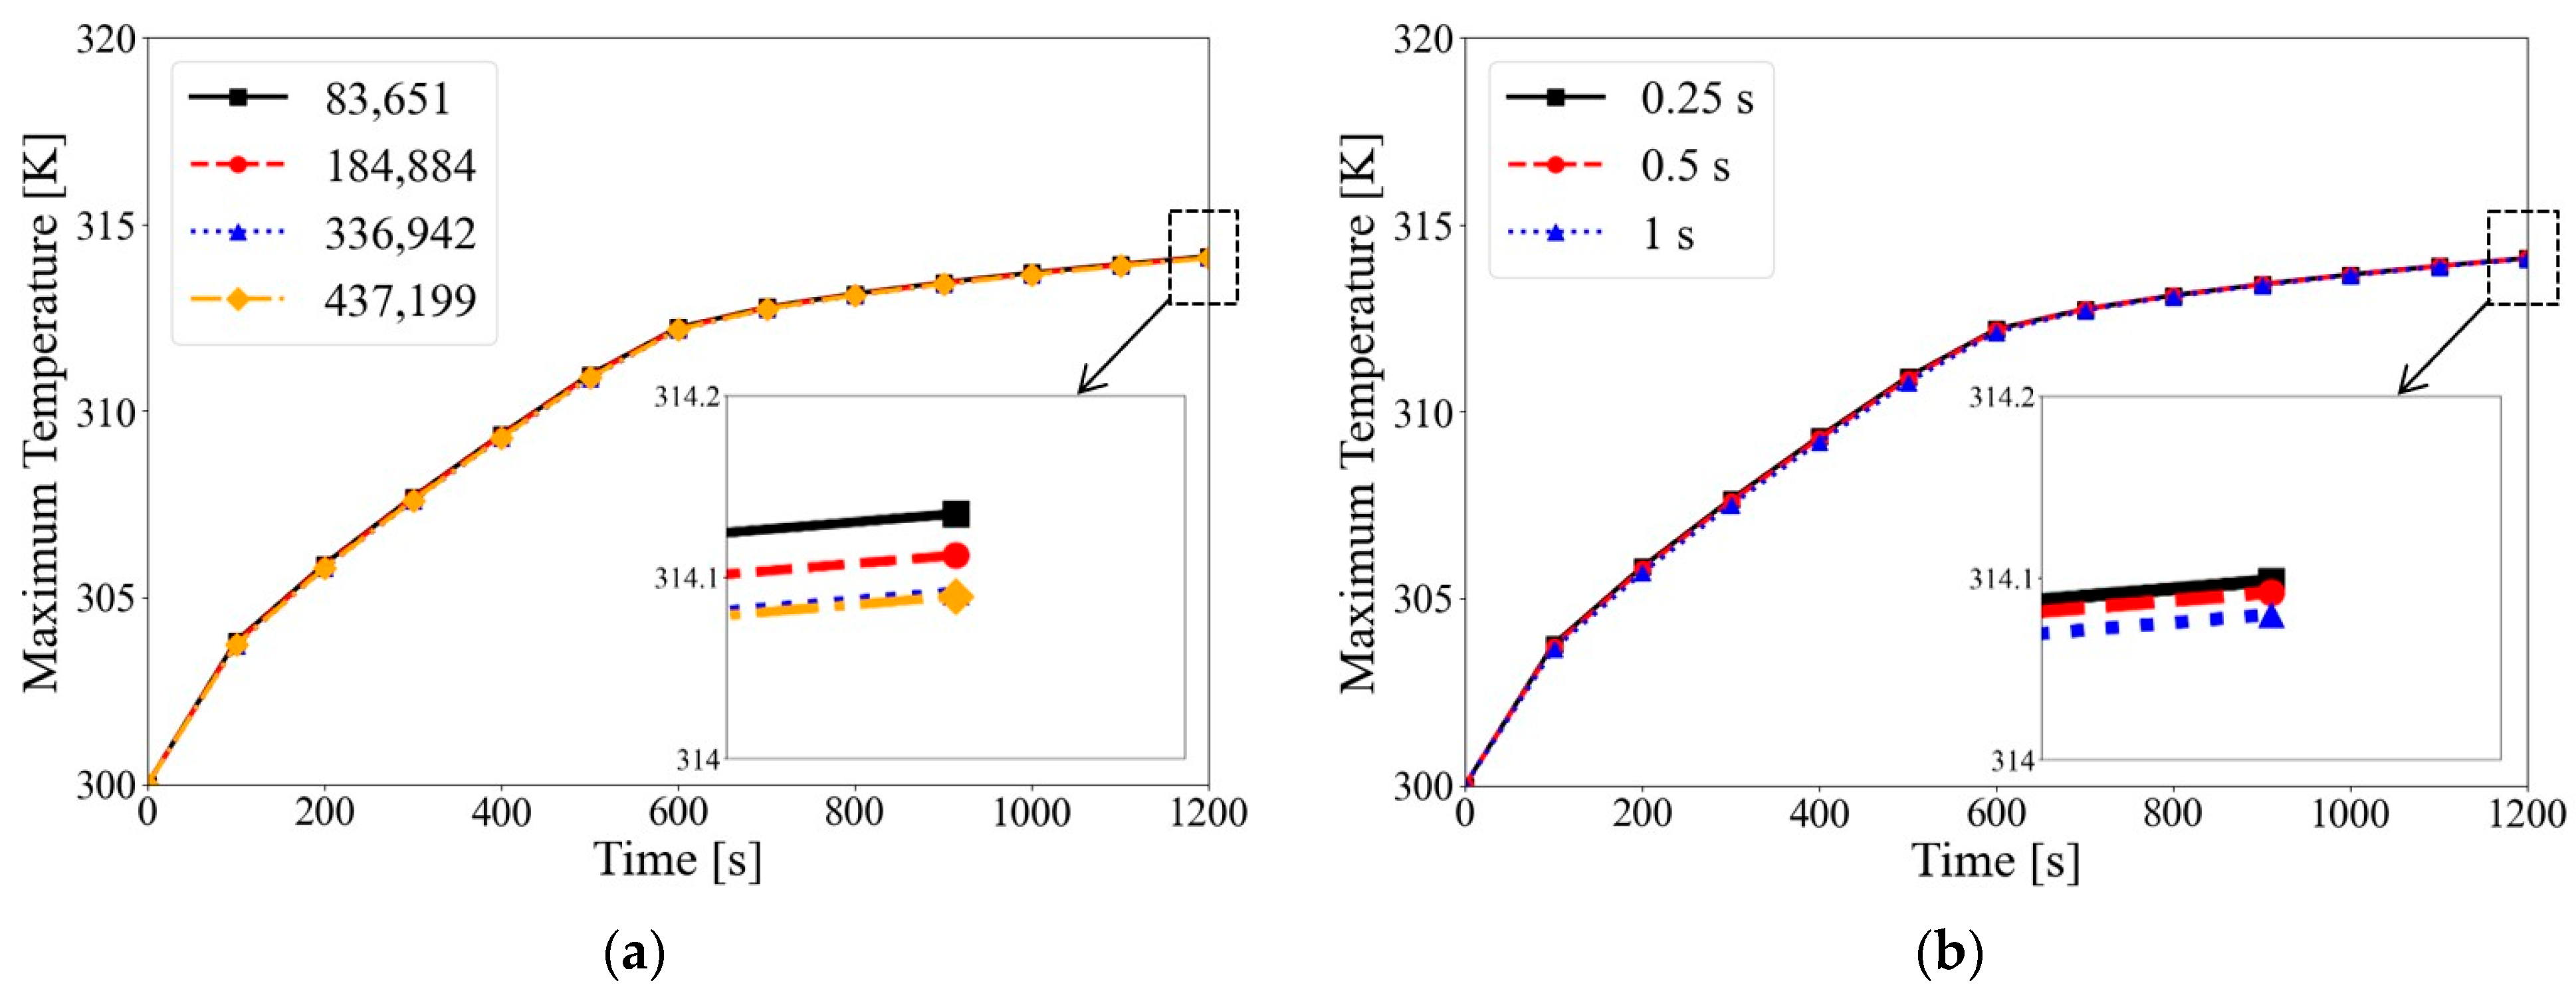
To ensure the accuracy of the numerical analysis method, the maximum temperature of the LIB cell was calculated under various grid numbers and time step sizes, respectively.
Figure 3a shows the maximum cell temperature calculated for grid numbers of 83,651, 184,330, 336,942, and 437,199. The result showed that the maximum cell temperature gradually converged as the grid number increased. In particular, as the grid number increases to 336,942 and 437,199, the calculated result is stable and consistent. Considering both simulation accuracy and computational cost, a grid number of 336,942 was selected for the subsequent analysis.
Figure 3b presents the maximum cell temperature calculated under various time step sizes applied to the transient thermal fluid analysis. The applied time step sizes were 0.25 s, 0.5 s, and 1 s. The result showed that the maximum cell temperature gradually converged with decreasing time step size. Since the maximum cell temperature hardly changes with the decreasing time steps from 0.5 s to 0.25 s, a time step size of 0.5 s was selected for the subsequent simulations.
After grid and time step were selected based on the independence tests, numerical simulations were performed on a custom-built workstation equipped with an Intel Core i7-14700F CPU (20 cores, 2.1 GHz, Intel Corporation, Santa Clara, USA) and 64 GB DDR4-3200 RAM (32 GB×2; CL22; Samsung Electronics Co., Ltd., Suwon, Republic of Korea). On average, each simulation required approximately 2 h of computation time.

2.2.4. Validation of Numerical Analysis Method

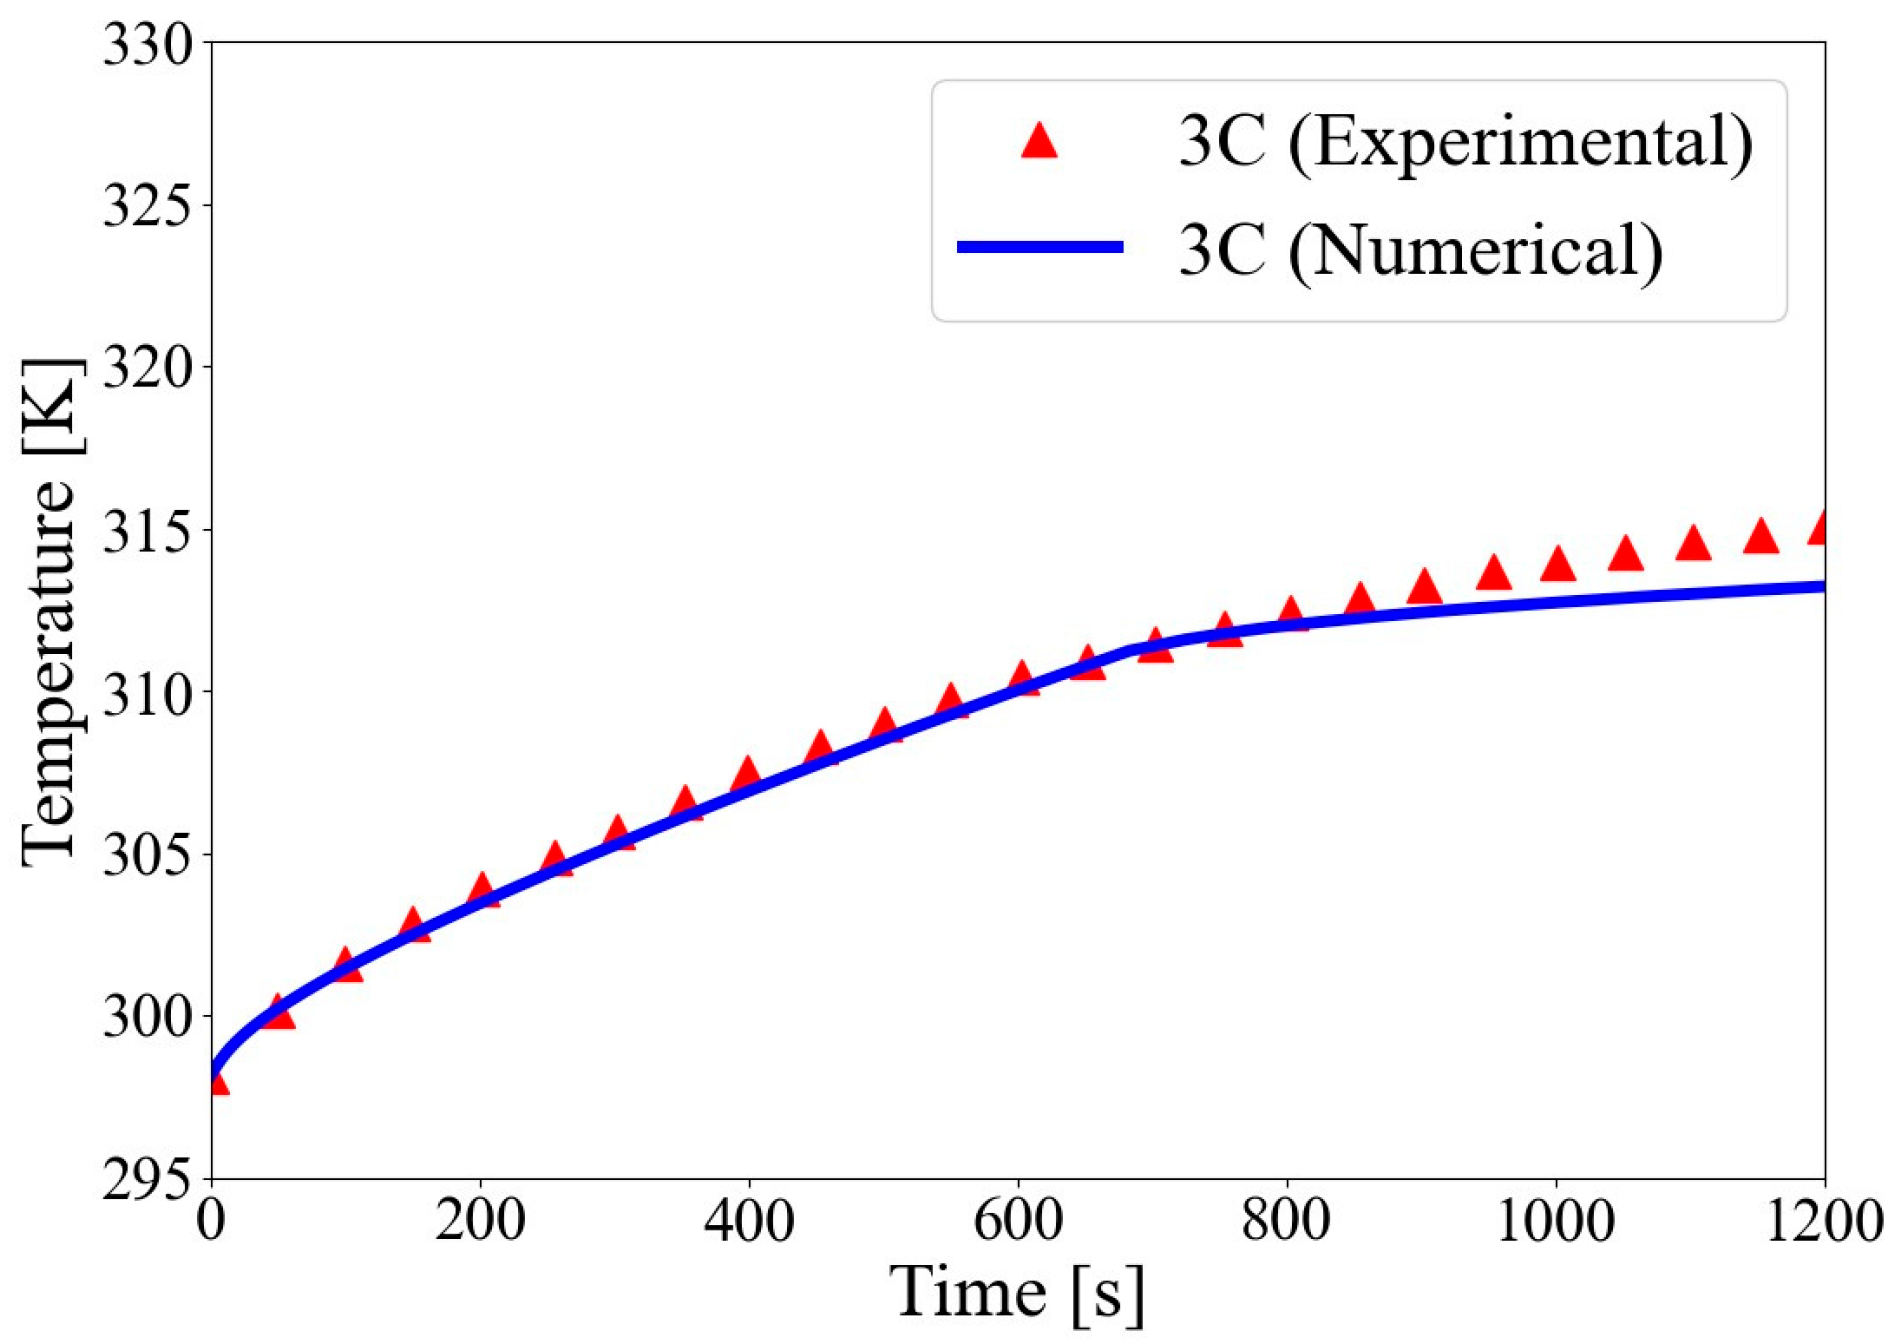
To validate the numerical analysis method, the simulated surface temperature variation of the LIB cell under a 3C discharge rate and an initial temperature of 298.15 K was compared with the experimental results reported by Zhang et al. [36], as shown in Figure 4. The comparison indicated that the trend of temperature rise in the simulation closely followed the experimental trend, with a relative error of less than 0.6%. This demonstrates good agreement between the numerical and experimental data, confirming the accuracy of the numerical method used in this study.

2.3. Numerical Analysis Result

Figure 5 illustrates the variation in the maximum temperature ( T m a x ) of the LIB cell over time. The maximum temperature of the cell occurs at the center of the cell, and it initially increases rapidly during the early stage of discharge, followed by a significant reduction in the rate of temperature rise around t = 600   s . This behavior is attributed to the phase change of the PCM adjacent to the cell. Once the PCM temperature exceeds the melting point (also referred to as the solidus temperature) of 311.15 K, the absorbed heat no longer contributes to a temperature increase but is instead utilized as latent heat to drive the phase transition. Unlike sensible heat, which contributes to temperature change, latent heat is fully consumed during the phase change process, thereby significantly reducing the rate of temperature increase in the cell. The PCM employed in this study has a latent heat capacity of 165 kJ/kg, indicating a sufficiently high thermal storage capacity. Thus, the PCM serves as an effective thermal buffer, mitigating the rapid temperature increase of the cell during the melting process.
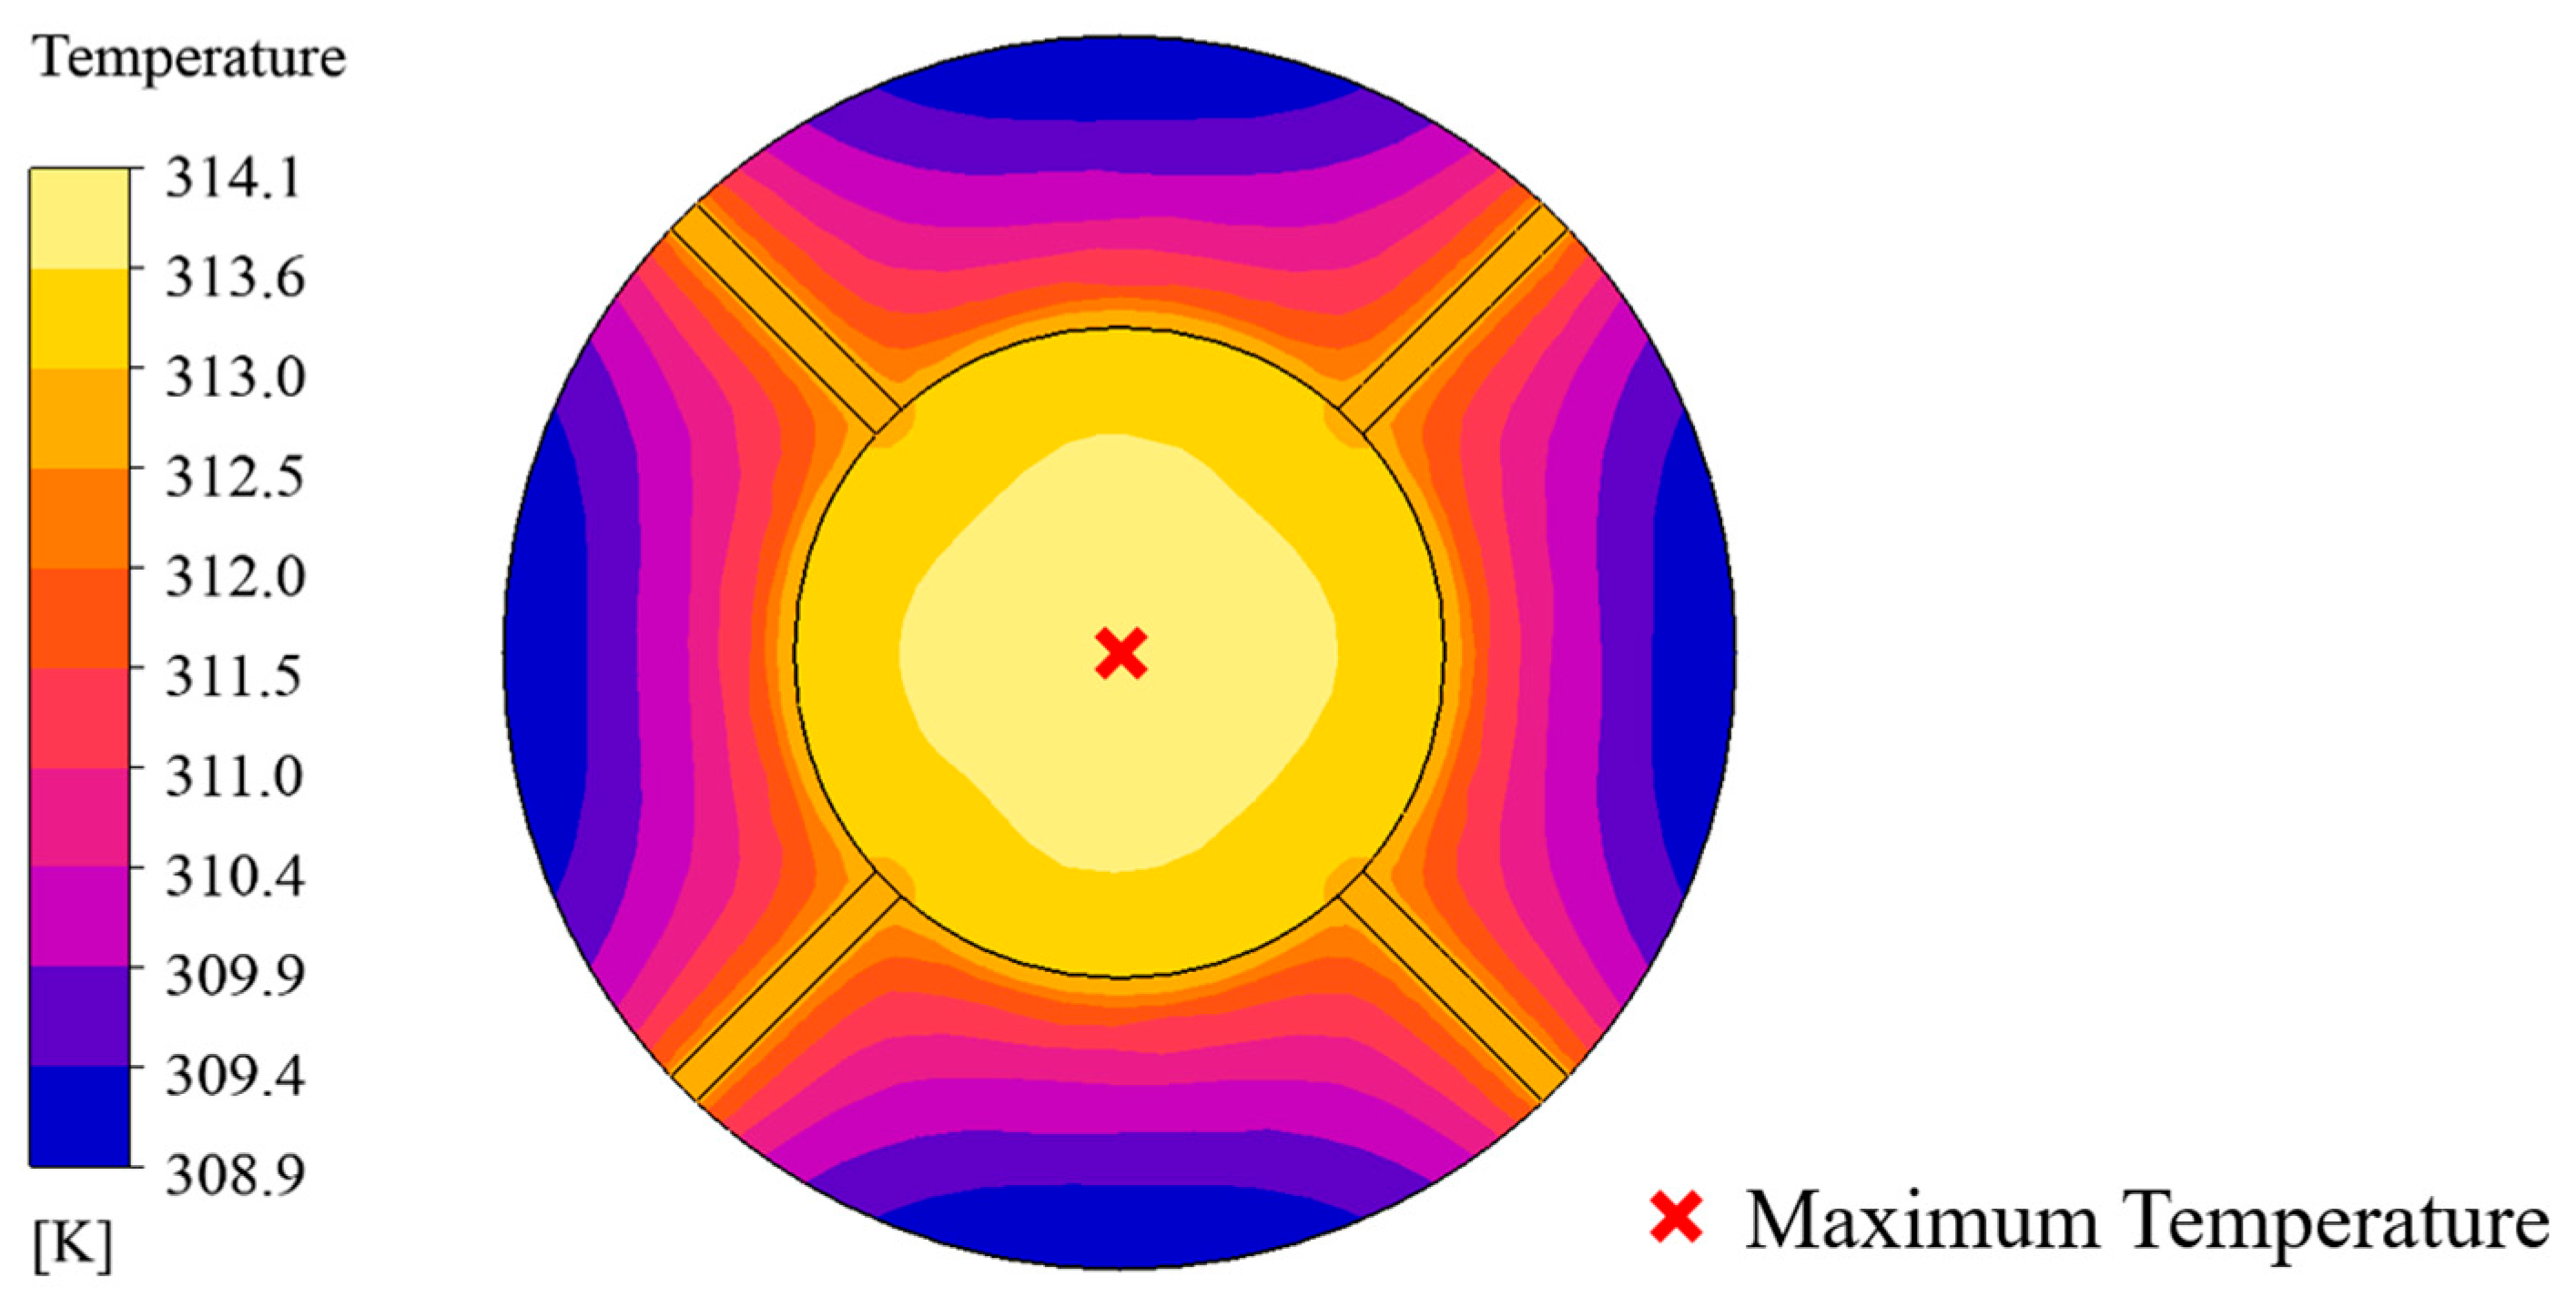
Figure 6 shows the temperature distribution of the PCM–fin structured BTMS at 1200 s, which corresponds to the time point immediately after the end of discharge. The maximum cell temperature is 314.1 K and occurs at the center of the cell. All temperatures are presented in Kelvin for consistency. For reference, 300 K corresponds to 26.85 °C. Heat generated by the cell is transferred to the fins and subsequently absorbed by the surrounding PCM, raising the temperature of the PCM in contact with the cell and fins. The fins act as heat conduction paths that facilitate thermal dissipation from the cell, and their geometry directly affects cooling performance. Therefore, a quantitative analysis of the influence of fin geometry on cell cooling characteristics is essential. Furthermore, since a high fin density may contribute to increased BTMS mass, it is also necessary to assess the impact of fin geometry on overall system weight.

3. Statistical Analysis for Thermal Characteristics of a LIB Cell

3.1. Design Factors and Responses of DoE

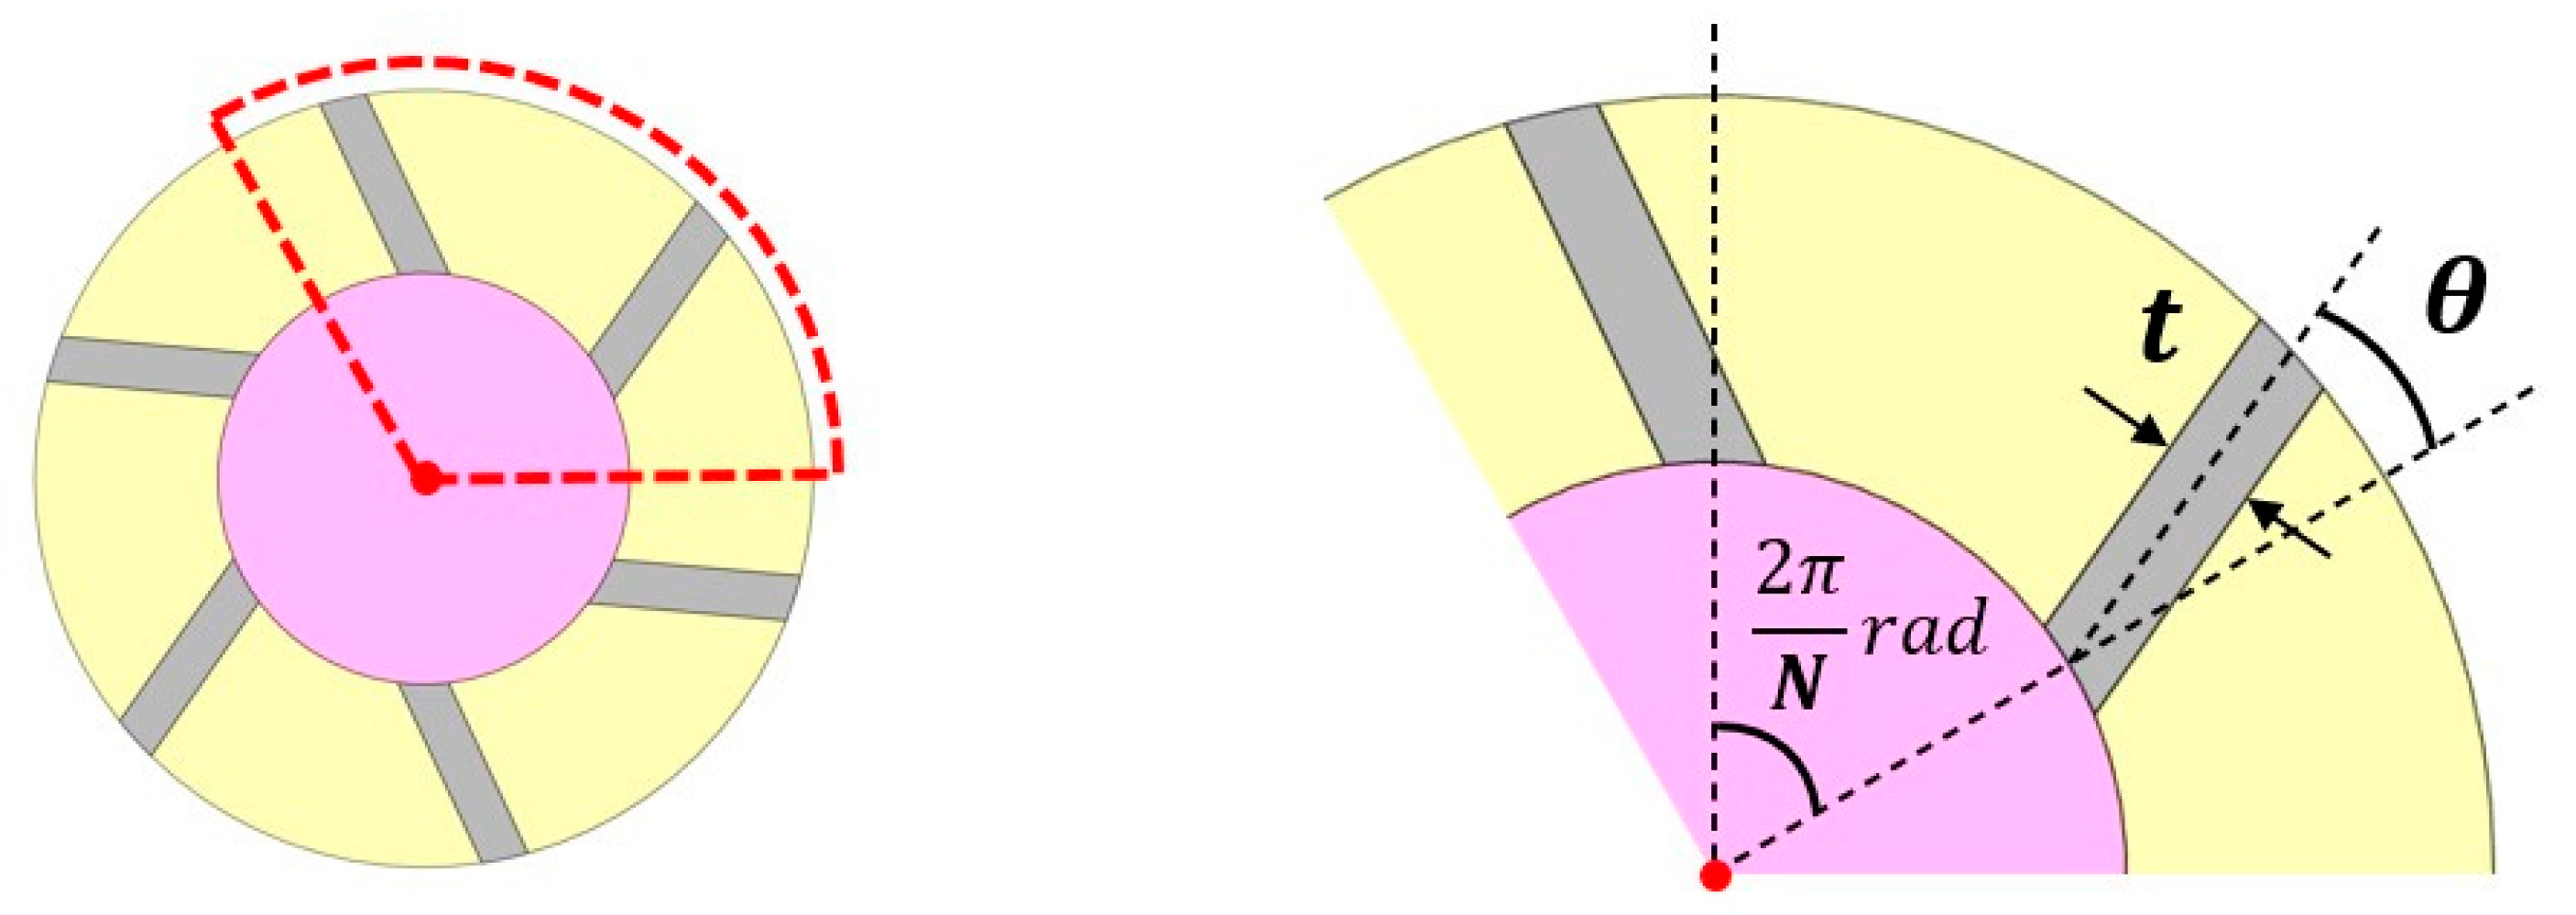
In this study, the number of fins ( N ), fin thickness ( t ), and fin angle ( θ ) were selected as design factors to analyze their effects on cooling performance and BTMS mass. Figure 7 schematically illustrates the definitions of each fin design factor. The number of fins refers to the count of fins placed adjacent to the cell within the BTMS. In this configuration, the spacing between fins is kept constant; therefore, the spacing decreases as the number of fins increases. The fin thickness is defined as the distance between the two parallel surfaces of the fin that are in contact with the PCM. The fin angle is defined as the angle between the centerline of the fin and the straight line connecting the center of the cell to the center of the cell–fin contact surface. The types and levels of these design factors are summarized in Table 3. The maximum temperature of the LIB cell ( T m a x ) and the total mass ( m ) of the PCM–fin structured BTMS were defined as the responses. In this study, BTMS mass was calculated as the sum of the masses of the LIB cell, fins, PCM, and acrylic shell.
Design of experiments (DoE) is a statistical analysis method used to obtain maximum information regarding the effects of design factors on response variables with a minimal number of simulations or experiments [37]. To evaluate the responses for all possible combinations of the design factors, the full-factorial design (FFD) method was employed. For k design factors at x -levels, the total number of sampling points in the FFD approach is defined as shown in Equation (16):
T o t a l   n u m b e r   o f   s a m p l i n g   p o i n t s = x k
The present study employed three design factors, and a five-level full-factorial design (FFD) was implemented. Accordingly, a total of 5 3 = 125 sampling points were considered.

3.2. Analysis of Variance (ANOVA)

Analysis of variance (ANOVA) is a statistical method used to quantitatively evaluate the relative effects of multiple design factors on responses and to assess their statistical significance [38]. ANOVA systematically distinguishes between variation among groups and variation within groups to identify which design factors have a statistically significant influence on the results, thereby enhancing the reliability of the analysis. One of the key advantages of ANOVA is that it not only compares mean values but also quantifies variation in the data through the sum of squares, allowing for simultaneous assessment of both the relative importance and statistical significance of each factor.
In ANOVA, the total variation in the dataset is expressed as the total sum of squares ( S S T o t a l ), which is decomposed into between-group variation ( S S B e t w e e n ) and within-group variability ( S S W i t h i n ). This relationship is expressed in Equation (17):
S S T o t a l = S S B e t w e e n + S S W i t h i n
The total sum of squares ( S S T o t a l ) is calculated as the sum of the squared differences between all data points and the overall mean, as defined in Equation (18):
S S T o t a l = i = 1 k j = 1 n i y i j σ 2
where y i j represents the j th data point in the i th group, σ is the overall mean, and n i denotes the number of data points in group i .
The between-group variation ( S S B e t w e e n ) is expressed as the sum of the squared differences between the mean of each group and the overall mean, as shown in Equation (19):
S S B e t w e e n = i = 1 k n i σ i σ 2
where σ i denotes the mean of group i .
The within-group variation ( S S W i t h i n ) is calculated as the sum of the squared differences between each data point and its corresponding group mean and is defined in Equation (20):
S S W i t h i n = i = 1 k j = 1 n i y i j σ i 2
Each sum of squares is divided by its corresponding degrees of freedom (DoF) to obtain the mean square (MS), as defined in Equations (21) and (22):
M S B e t w e e n = S S B e t w e e n D o F B e t w e e n
M S W i t h i n = S S W i t h i n D o F W i t h i n
The F -value represents the extent to which the variation between groups exceeds the variation within groups. A higher F -value indicates that the corresponding design factor has a stronger effect on the responses. The ratio of the mean square between groups to the mean square within groups yields the F -value, as given in Equation (23):
F v a l u e = M S B e t w e e n M S W i t h i n
The calculated F -value is used to determine the p -value based on the F -distribution. The p -value represents the probability of observing an F -value as larger than the calculated value by random chance. In this study, a significance level of 0.05 was adopted; hence, a design factor is considered statistically significant if its p -value is less than or equal to 0.05.
In addition, the percent contribution of each design factor is defined as the proportion of the total sum of squares accounted for by that design factor, as shown in Equation (24):
P e r c e n t   c o n t r i b u t i o n   % = S S F a c t o r S S T o t a l × 100
A higher percent contribution indicates that the design factor plays a more dominant role in explaining the variation in the response. In this study, the percent contributions of the individual design factors were calculated to identify the primary influencing factors and evaluate their relative importance with respect to the responses.

4. Results and Discussion

4.1. Effect of Fin Design Factors of BTMS

In this section, the effects of individual fin design factors on the cooling performance and BTMS mass were analyzed. The selected design factors were the number of fins ( N ), fin thickness ( t ), and fin angle ( θ ), while the corresponding responses were defined as the maximum cell temperature ( T m a x ) and total system mass ( m ).
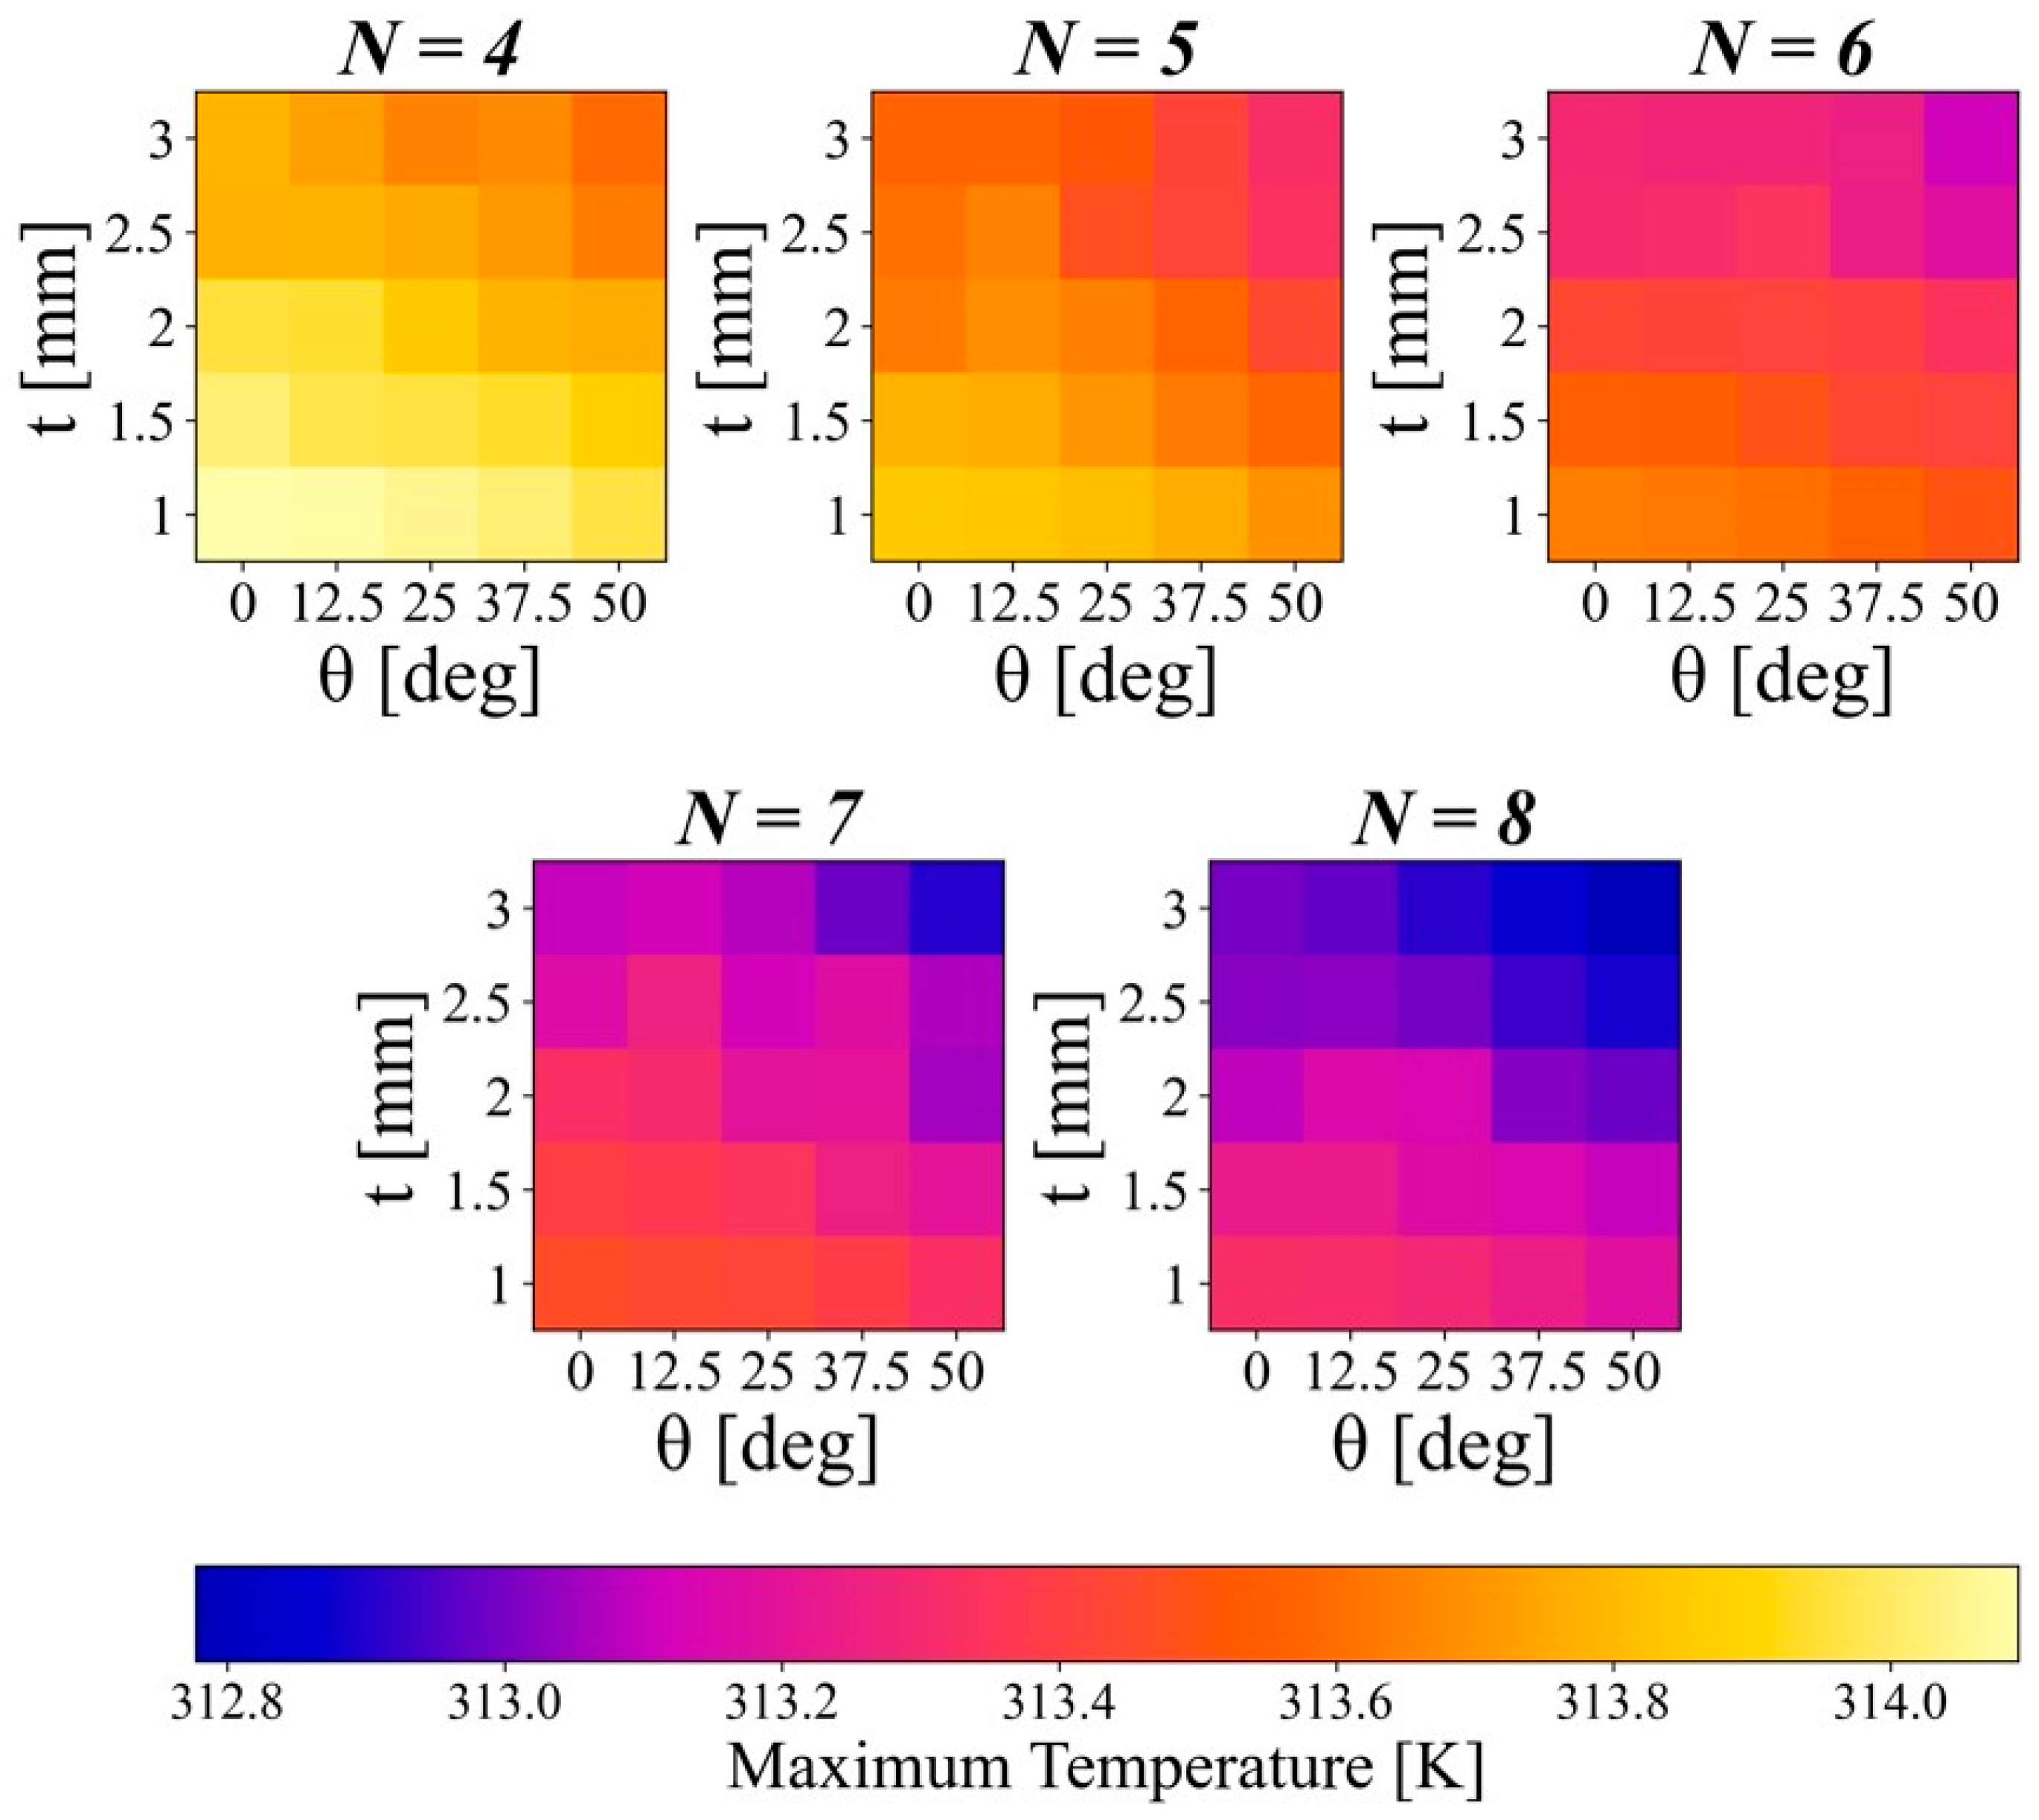
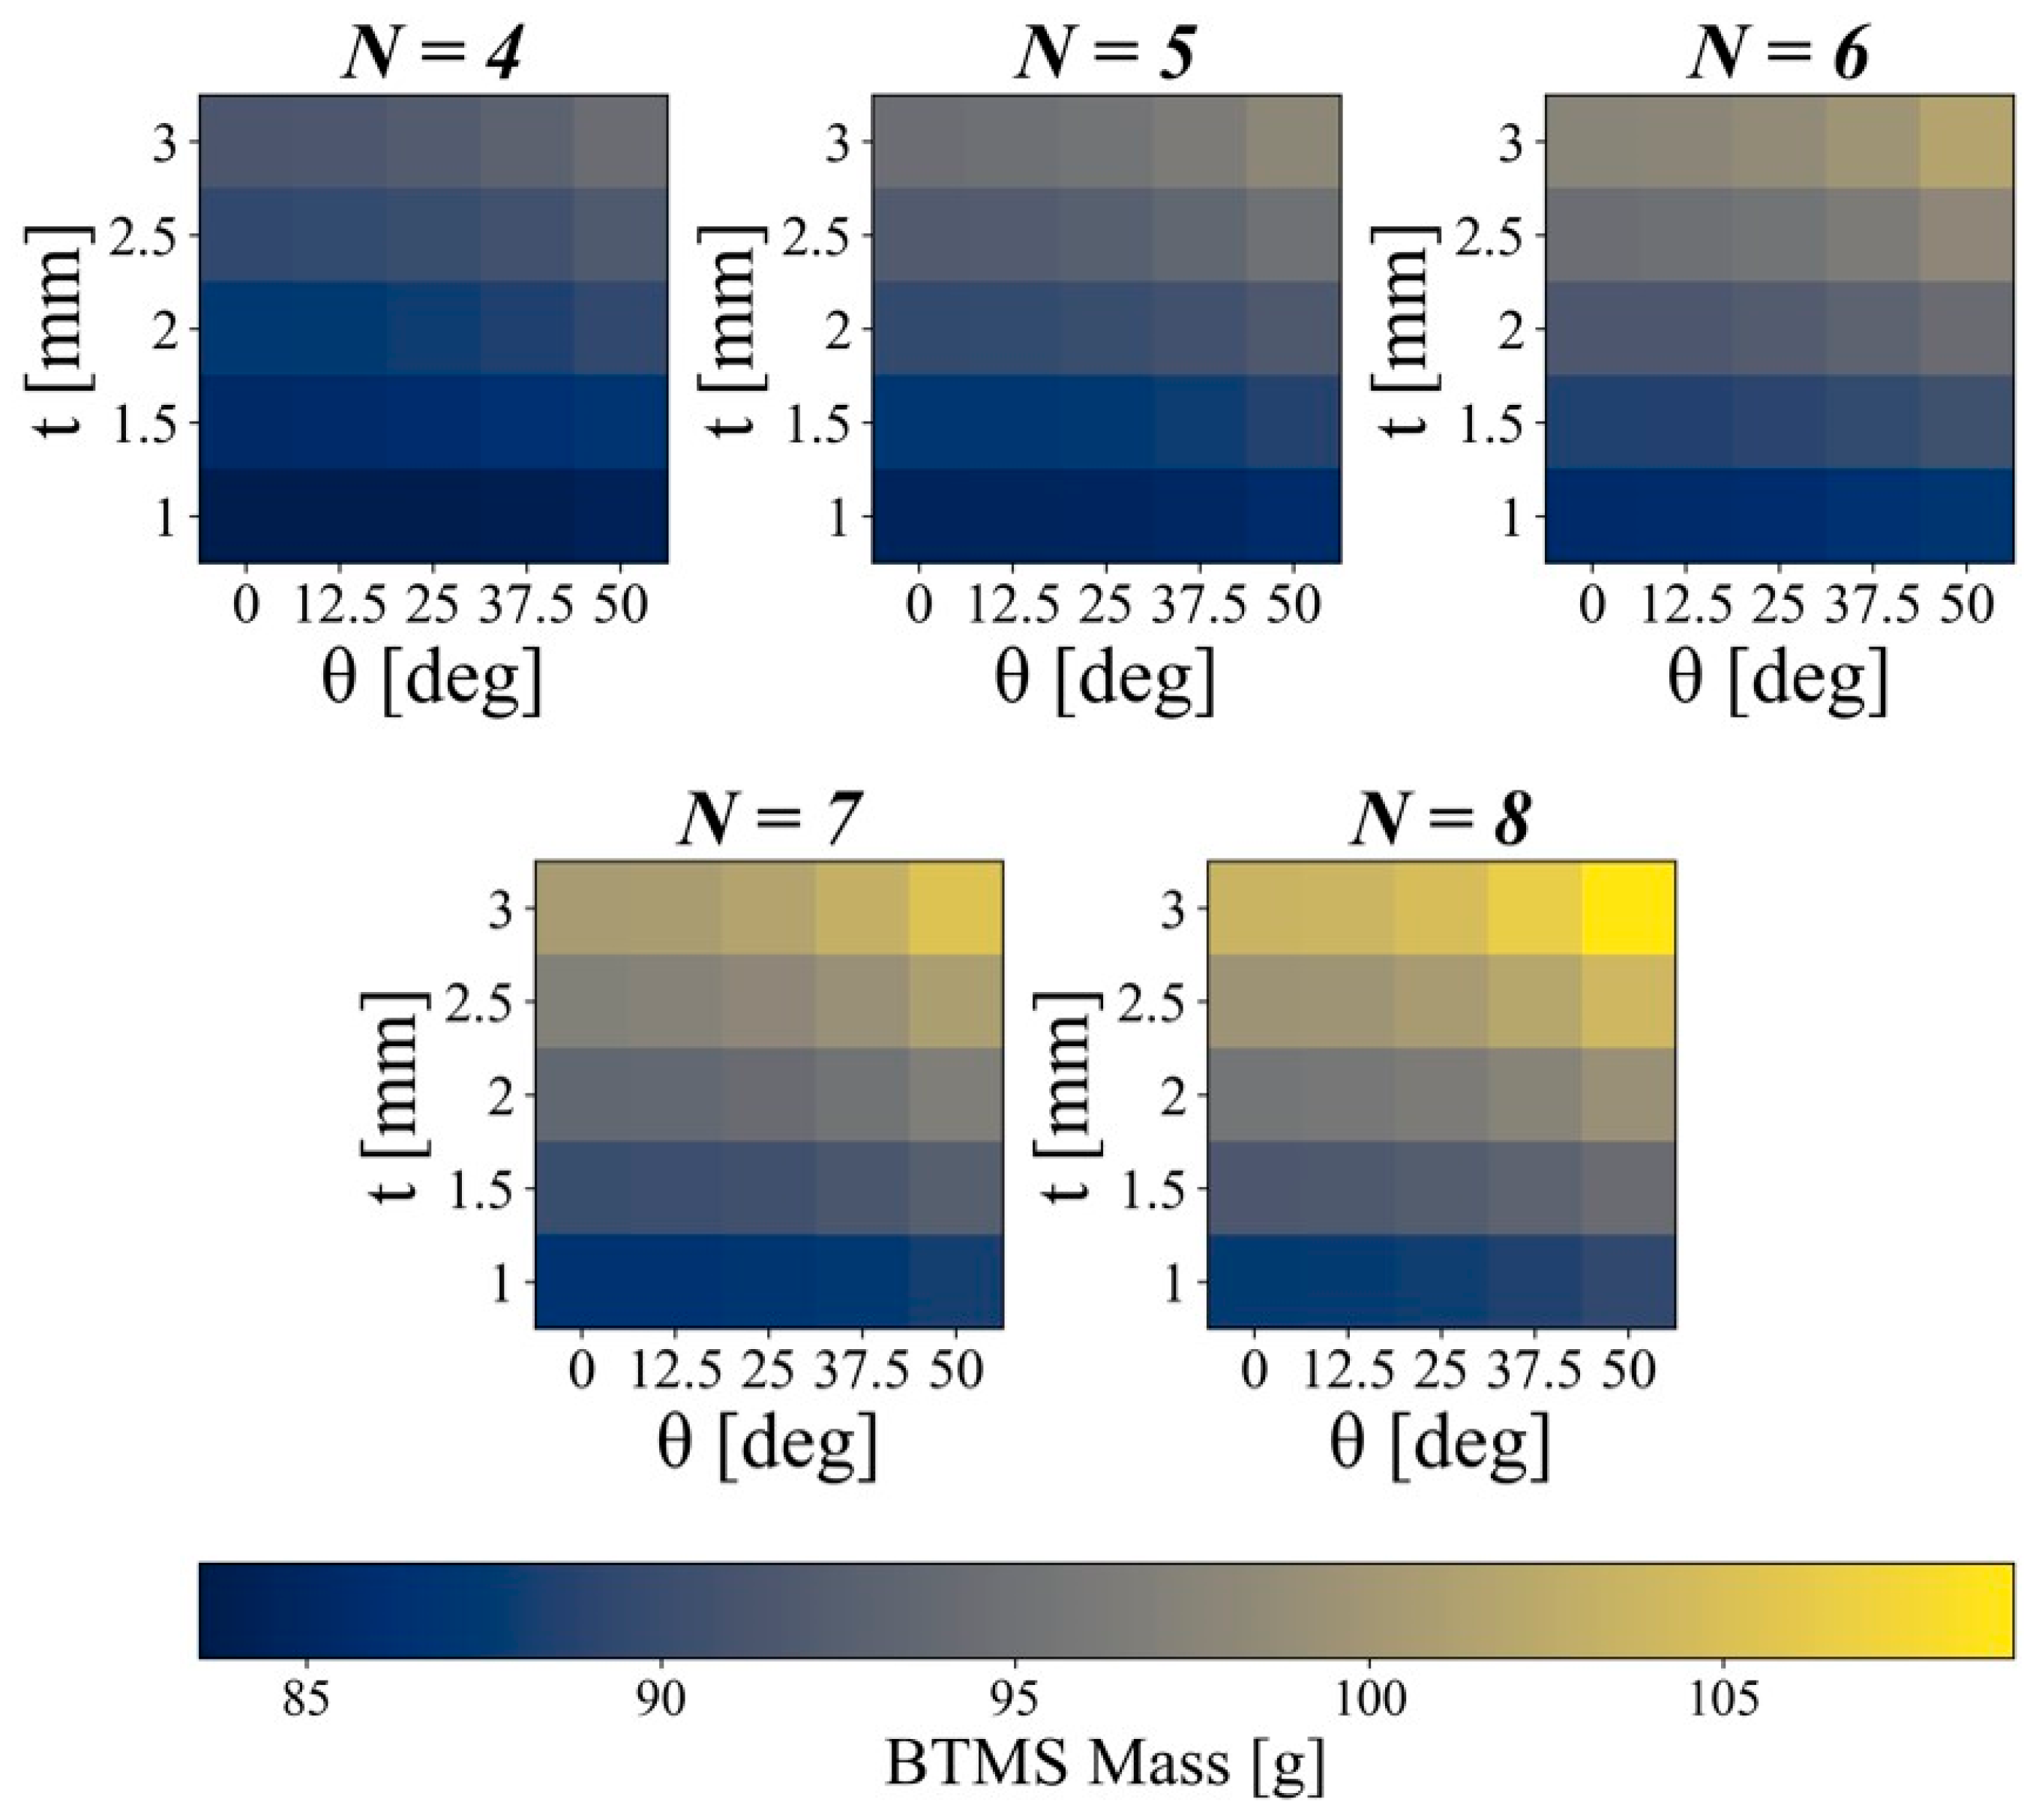
Figure 8 and Figure 9 present the DoE results, visualizing the influence of all fin design factor combinations on both responses. For consistency, the color scale was fixed across all subplots within each figure, corresponding to temperature and mass in Figure 8 and Figure 9, respectively. For all three factors, a consistent trade-off relationship was observed; as the design factor increased, the heat transfer area through the fins increased, resulting in a reduction in the cell’s maximum temperature but an increase in overall mass. When the lowest levels of the design factors were applied (i.e., N = 4, t = 1 mm, and θ = 0 deg), the BTMS mass was the lowest at 83.5 g, while the maximum cell temperature was the highest at 314.1 K. Conversely, at the highest design factor levels (i.e., N = 8, t = 3 mm, and θ = 50 deg), the cell experiences the lowest peak temperature of 312.8 K, while the system becomes the heaviest at 109.1 g.
These observations suggest that variations in fin geometry directly govern both thermal and mass characteristics of the system. To identify which design factor most significantly affects each response, it is necessary to quantify the difference of temperature and mass with respect to each design factor changes. Therefore, the following sections present the results obtained by individually varying each design factor to examine how it influences the responses and to explain the underlying physical mechanisms.

4.1.1. Number of Fins

As shown in Figure 10, the thermal behavior of the BTMS was compared for the number of fins of 4, 5, 6, 7, and 8 under fixed conditions of t = 2 m m and θ = 25   d e g , which correspond to the mid-levels of fin thickness and angle, respectively. The heat transfer area between the fins and both the cell and PCM increases proportionally with the number of fins. Furthermore, since the thermal conductivity of the fins is significantly higher than that of the PCM, adding more fins markedly improves the heat dissipation capacity of the BTMS, thereby reducing the maximum cell temperature. However, due to spatial constraints within the BTMS, increasing the number of fins reduces the volume available for the PCM. Given that the density of the fins is higher than that of the PCM, this results in an overall increase in system mass.
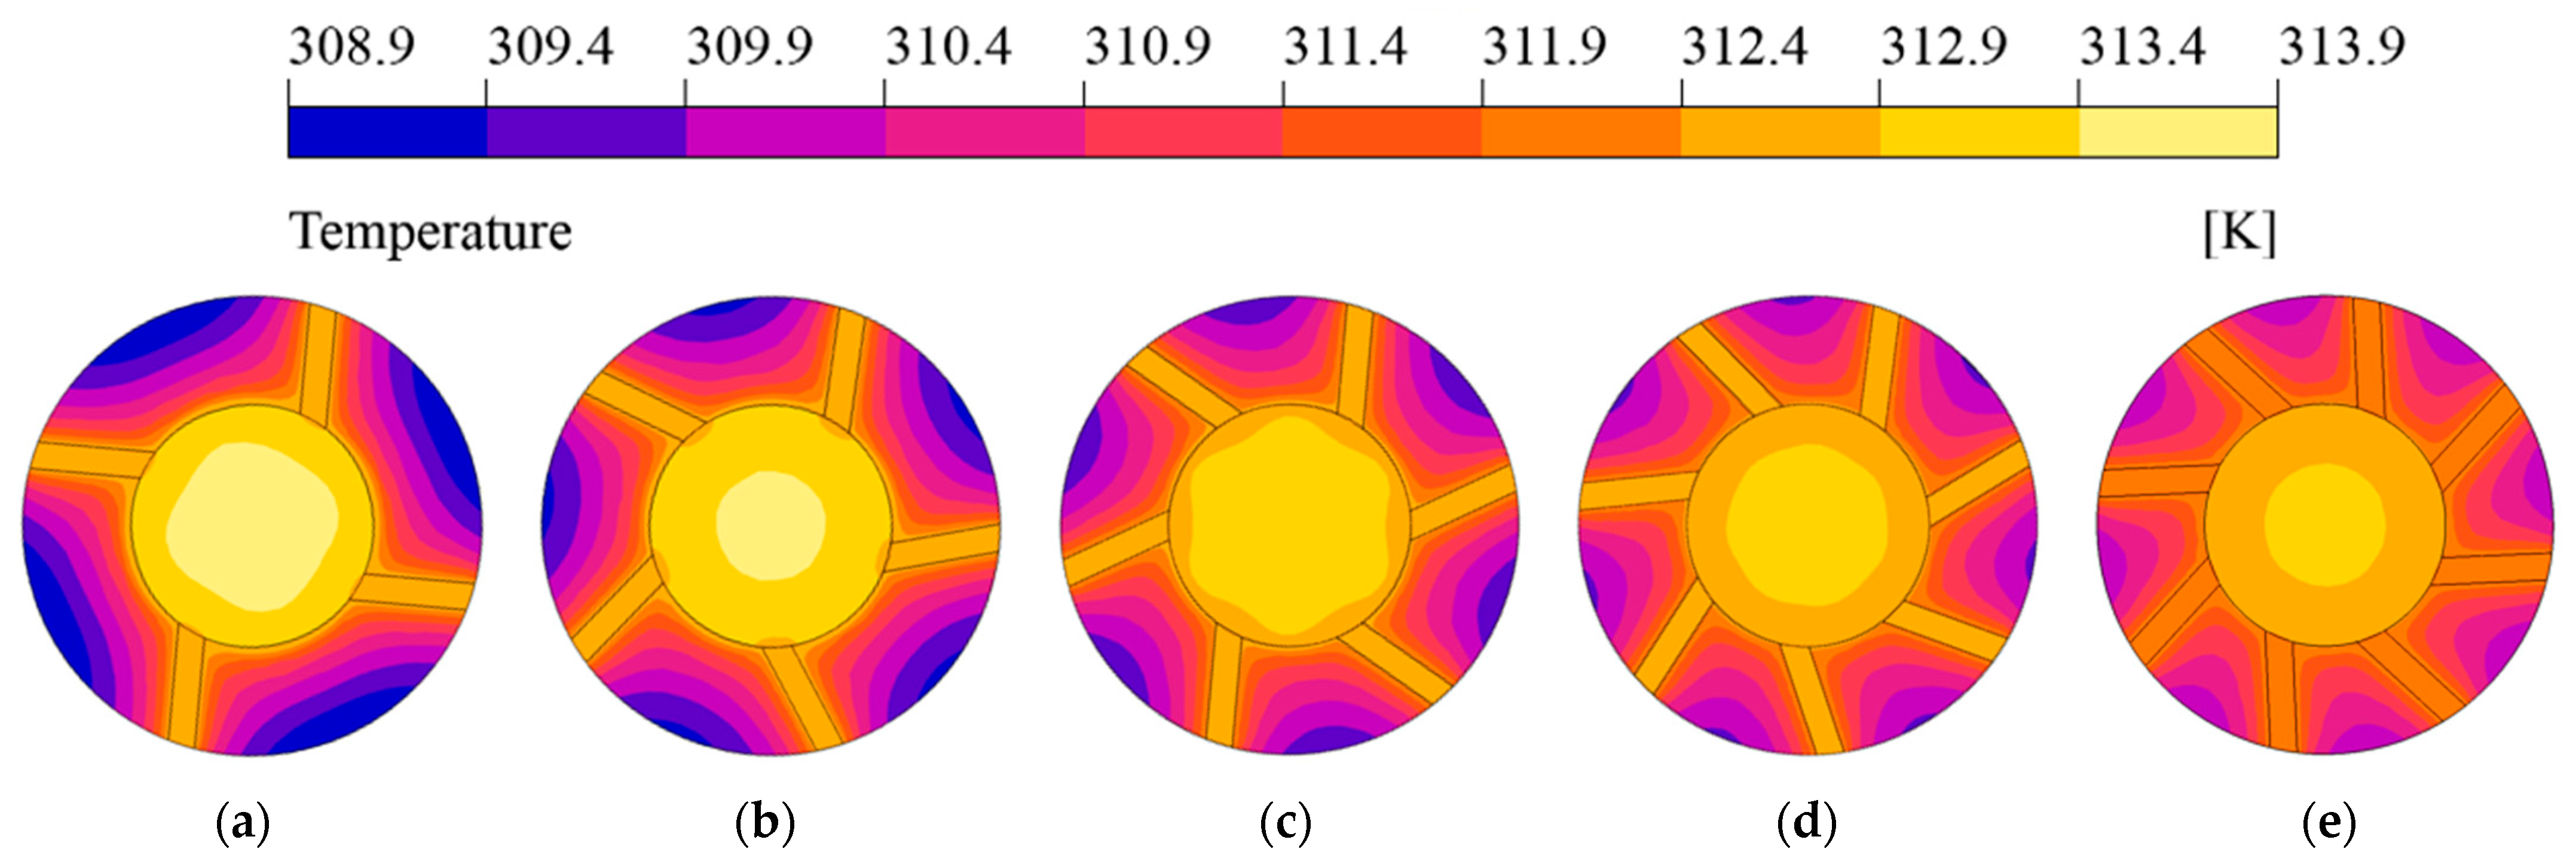
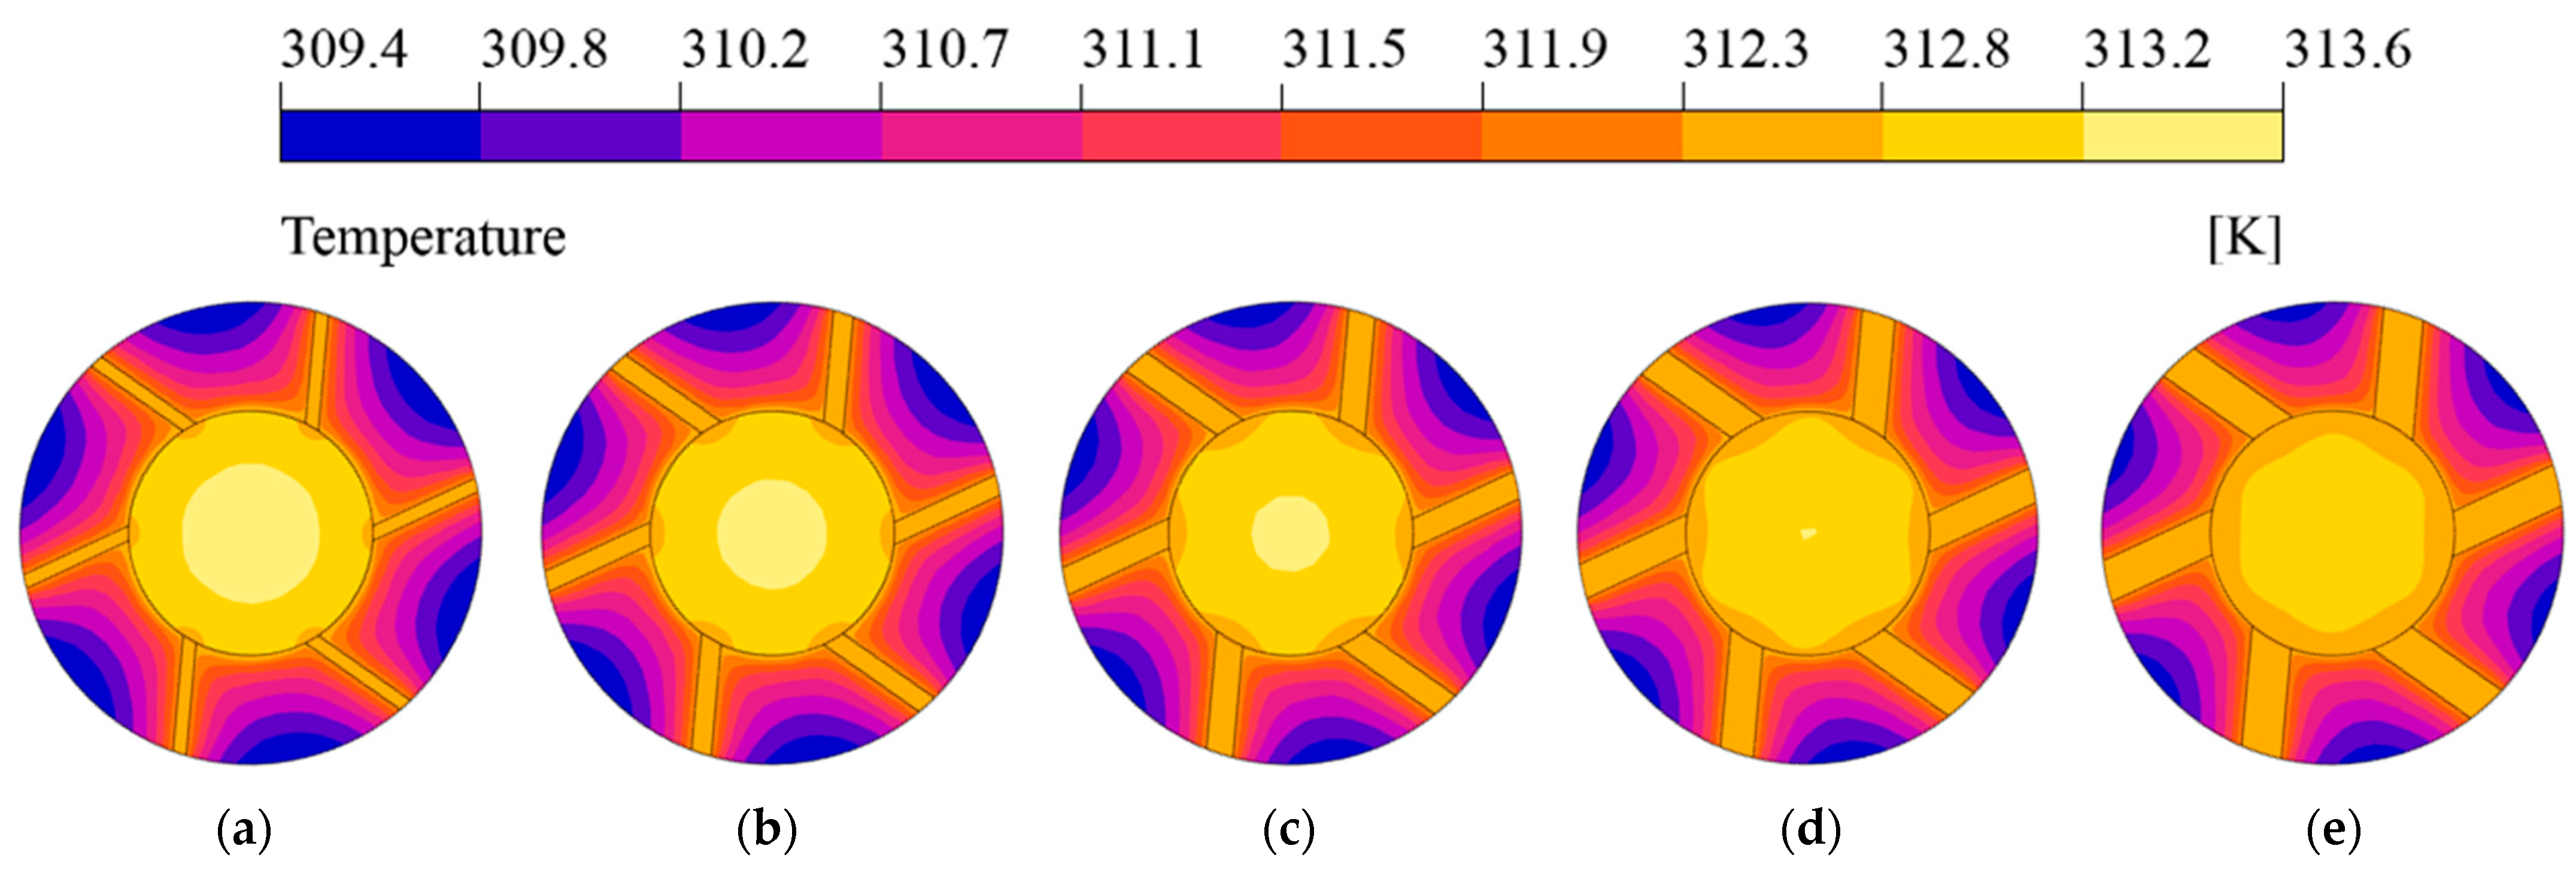
Figure 11 shows the temperature distributions of the PCM–fin structured BTMS at different numbers of fins. As the number of fins increases, the heat dissipation pathways from the cell become more diverse. Accordingly, the spacing between adjacent fins decreases. As the PCM adjacent to the fins remains at a relatively higher temperature owing to conductive heat transfer, the reduced fin spacing further limits the region of low-temperature PCM. Consequently, with an increasing number of fins, the overall temperature distribution of the BTMS exhibits more pronounced variations. The area of low-temperature PCM decreases, indicating that more heat is transferred from the cell to the PCM via the fins. As a result, the maximum temperature at the center of the cell is further reduced.
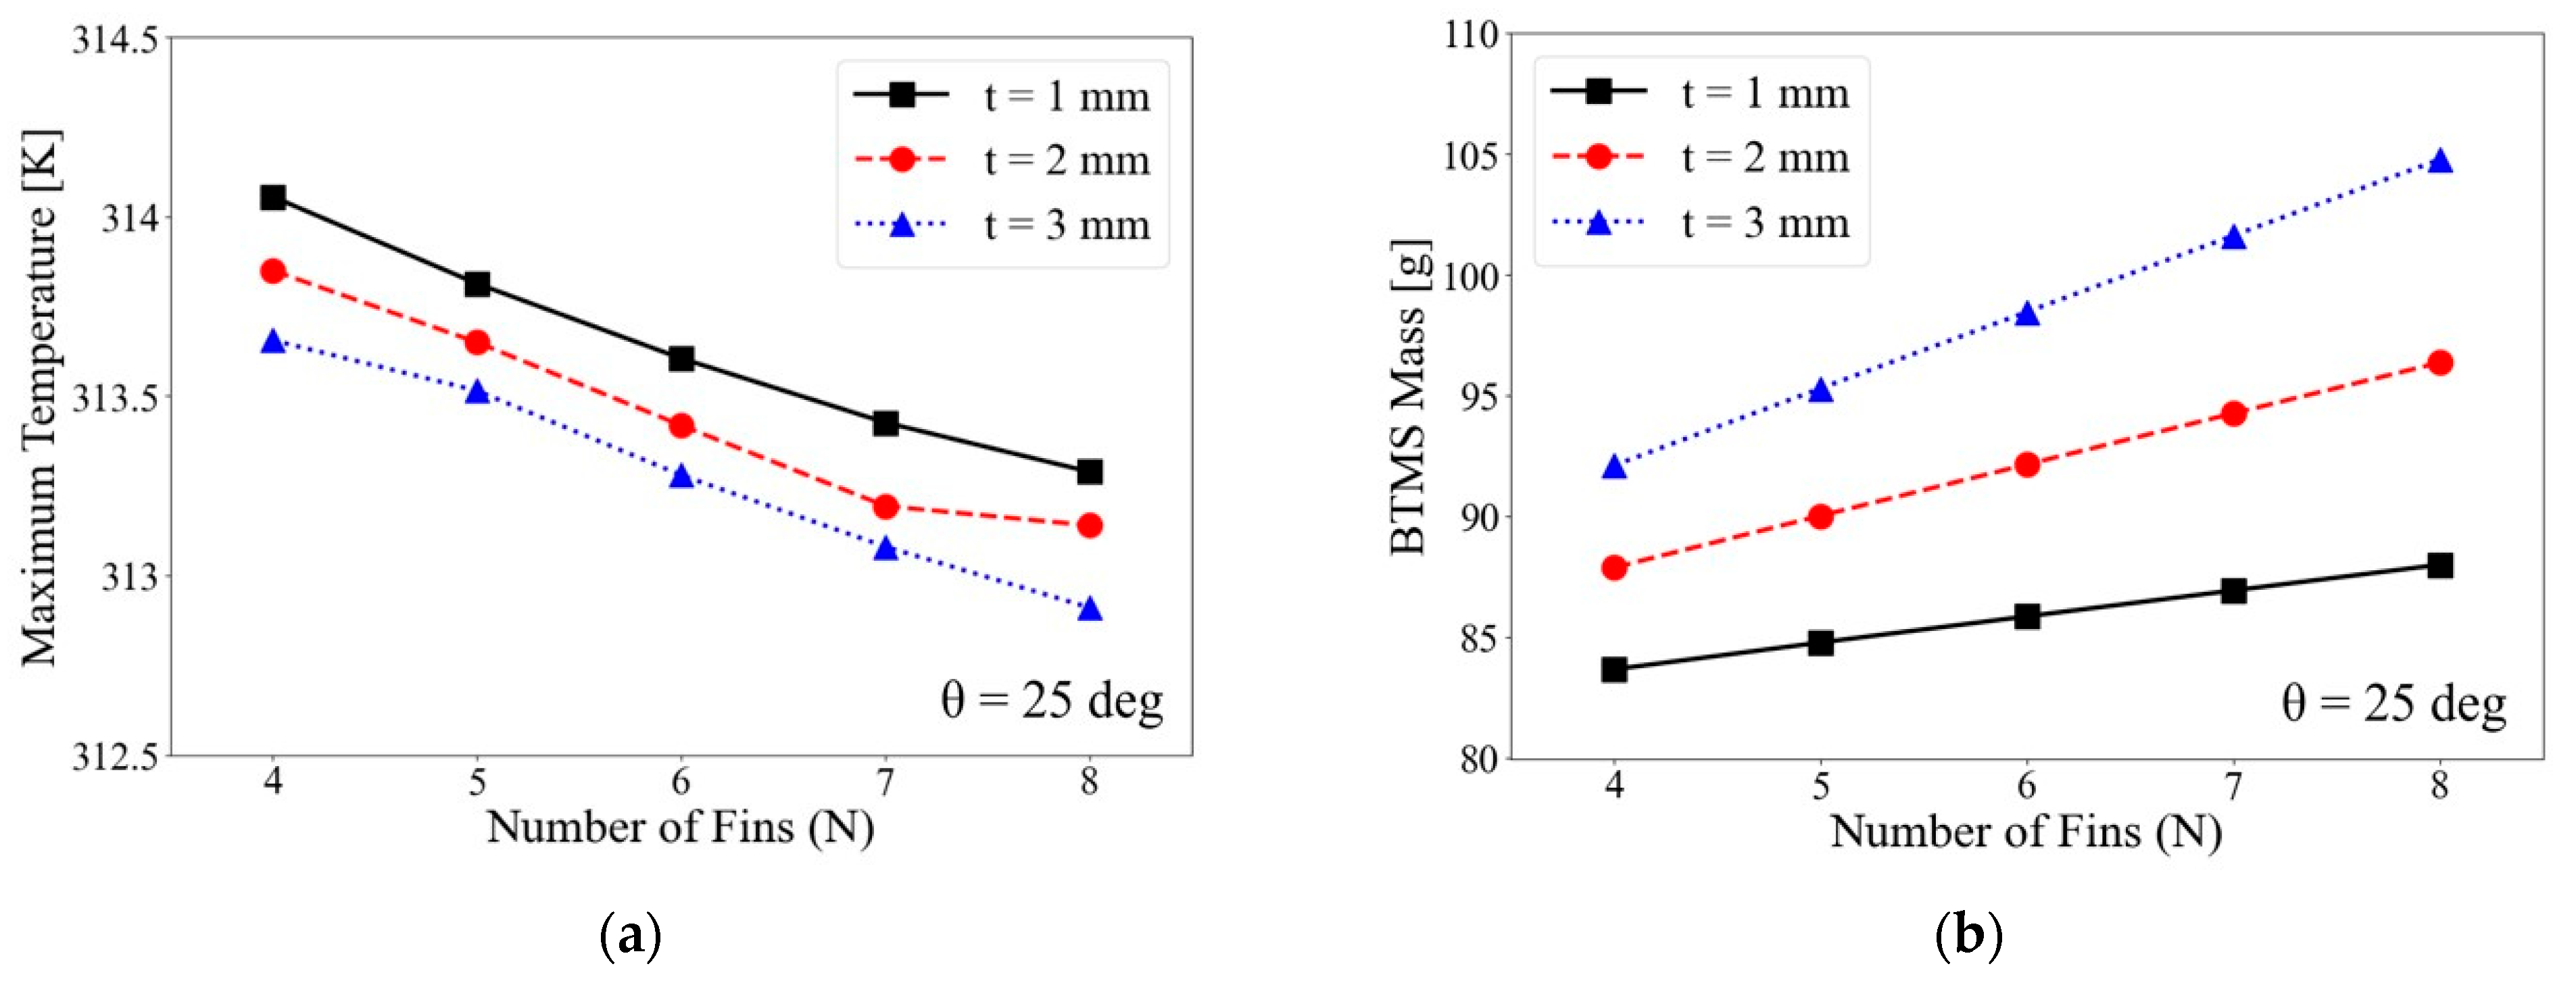
Figure 12 presents the variations in the maximum cell temperature ( T m a x ) and BTMS mass ( m ) at different numbers of fins. When the fin thickness is 2 mm, increasing the number of fins from four to eight reduces T m a x from 313.9 K to 313.1 K, corresponding to a decrease of 0.8 K. In contrast, m increases linearly with the number of fins. This indicates that increasing the number of fins is a superior way to enhance heat transfer from the cell to the PCM; however, it also leads to an increase in mass of the system and, therefore, does not necessarily translate to an improvement in overall cooling efficiency. Additionally, when the fin thickness is 3 mm, the rate of mass increase with additional fins is substantially higher than that observed at fin thickness of 1 mm.
From a practical manufacturing standpoint, increasing the number of fins may require more complex assembly processes and tighter manufacturing tolerances to ensure consistent thermal contact between fins and the cell.

4.1.2. Fin Thickness

The cooling performance and mass variations of five PCM–fin structured BTMS configurations with fin thicknesses of 1 mm, 1.5 mm, 2 mm, 2.5 mm, and 3 mm under fixed conditions of N = 6 and θ = 25   d e g , as shown in Figure 13, were analyzed. When the fin length is fixed, increasing the thickness leads to a larger cross-sectional area of fin, which reduces conductive thermal resistance. As a result, the heat transfer rate through the fins increases, enabling more effective dissipation of the heat generated by the cell.
Figure 14 shows the temperature distributions of the PCM–fin structured BTMS at different fin thicknesses. As the fin thickness increases, the contact area between the fins and the cell becomes larger, which enhances interfacial heat transfer and leads to a lower maximum temperature at the center of the cell.
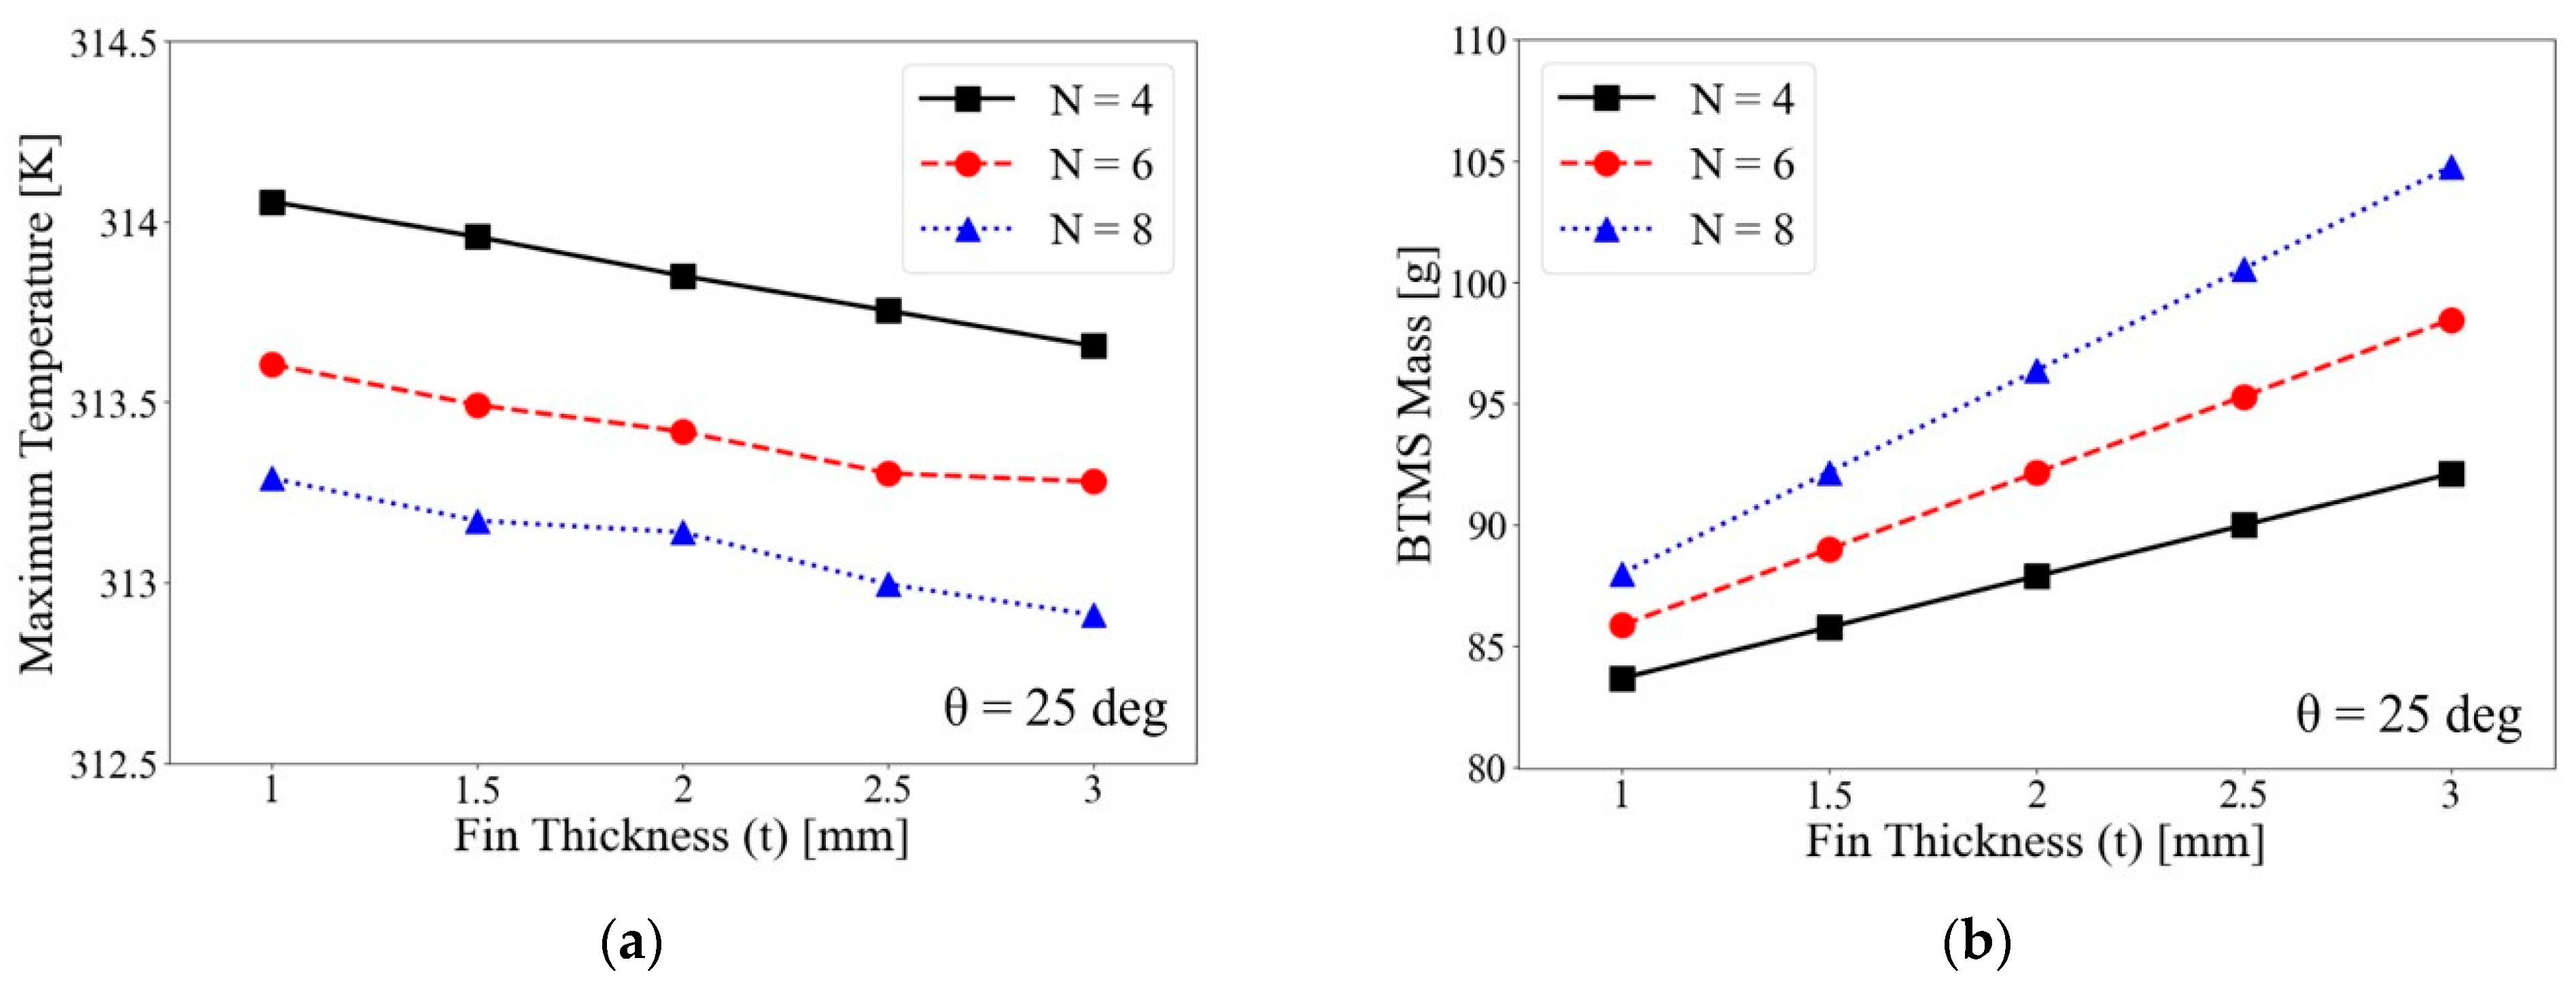
Figure 15 presents the variations in maximum cell temperature and BTMS mass at different fin thicknesses. When the fin thickness increases from 1 mm to 3 mm, the maximum cell temperature decreases from 313.6 K to 313.3 K—a reduction of 0.3 K. This temperature reduction is attributed to the decrease in conduction thermal resistance due to the increased fin thickness. However, the increase in thickness also leads to a larger fin volume. Since the high-density fins replace a portion of the PCM, the total system mass increases. Consequently, increasing fin thickness introduces a trade-off between improved cooling performance and increased BTMS mass. Furthermore, when N = 8 , the rate of increase in BTMS mass with fin thickness is significantly higher than that observed when N = 4 .
In terms of manufacturing feasibility and cost, while thicker fins improve thermal conduction, machining or extrusion of thicker fins may increase manufacturing costs, particularly when tight dimensional tolerances are required.

4.1.3. Fin Angle

When the other design factors are held constant, increasing the fin angle expands the thermal interface between the fins and both the cell and PCM. As shown in Figure 16, the thermal characteristics of the BTMS were compared for fin angles of 0   d e g ,   12.5   d e g ,   25   d e g ,   37.5   d e g , a n d   50   d e g under fixed conditions of N = 6 and t = 2   m m .
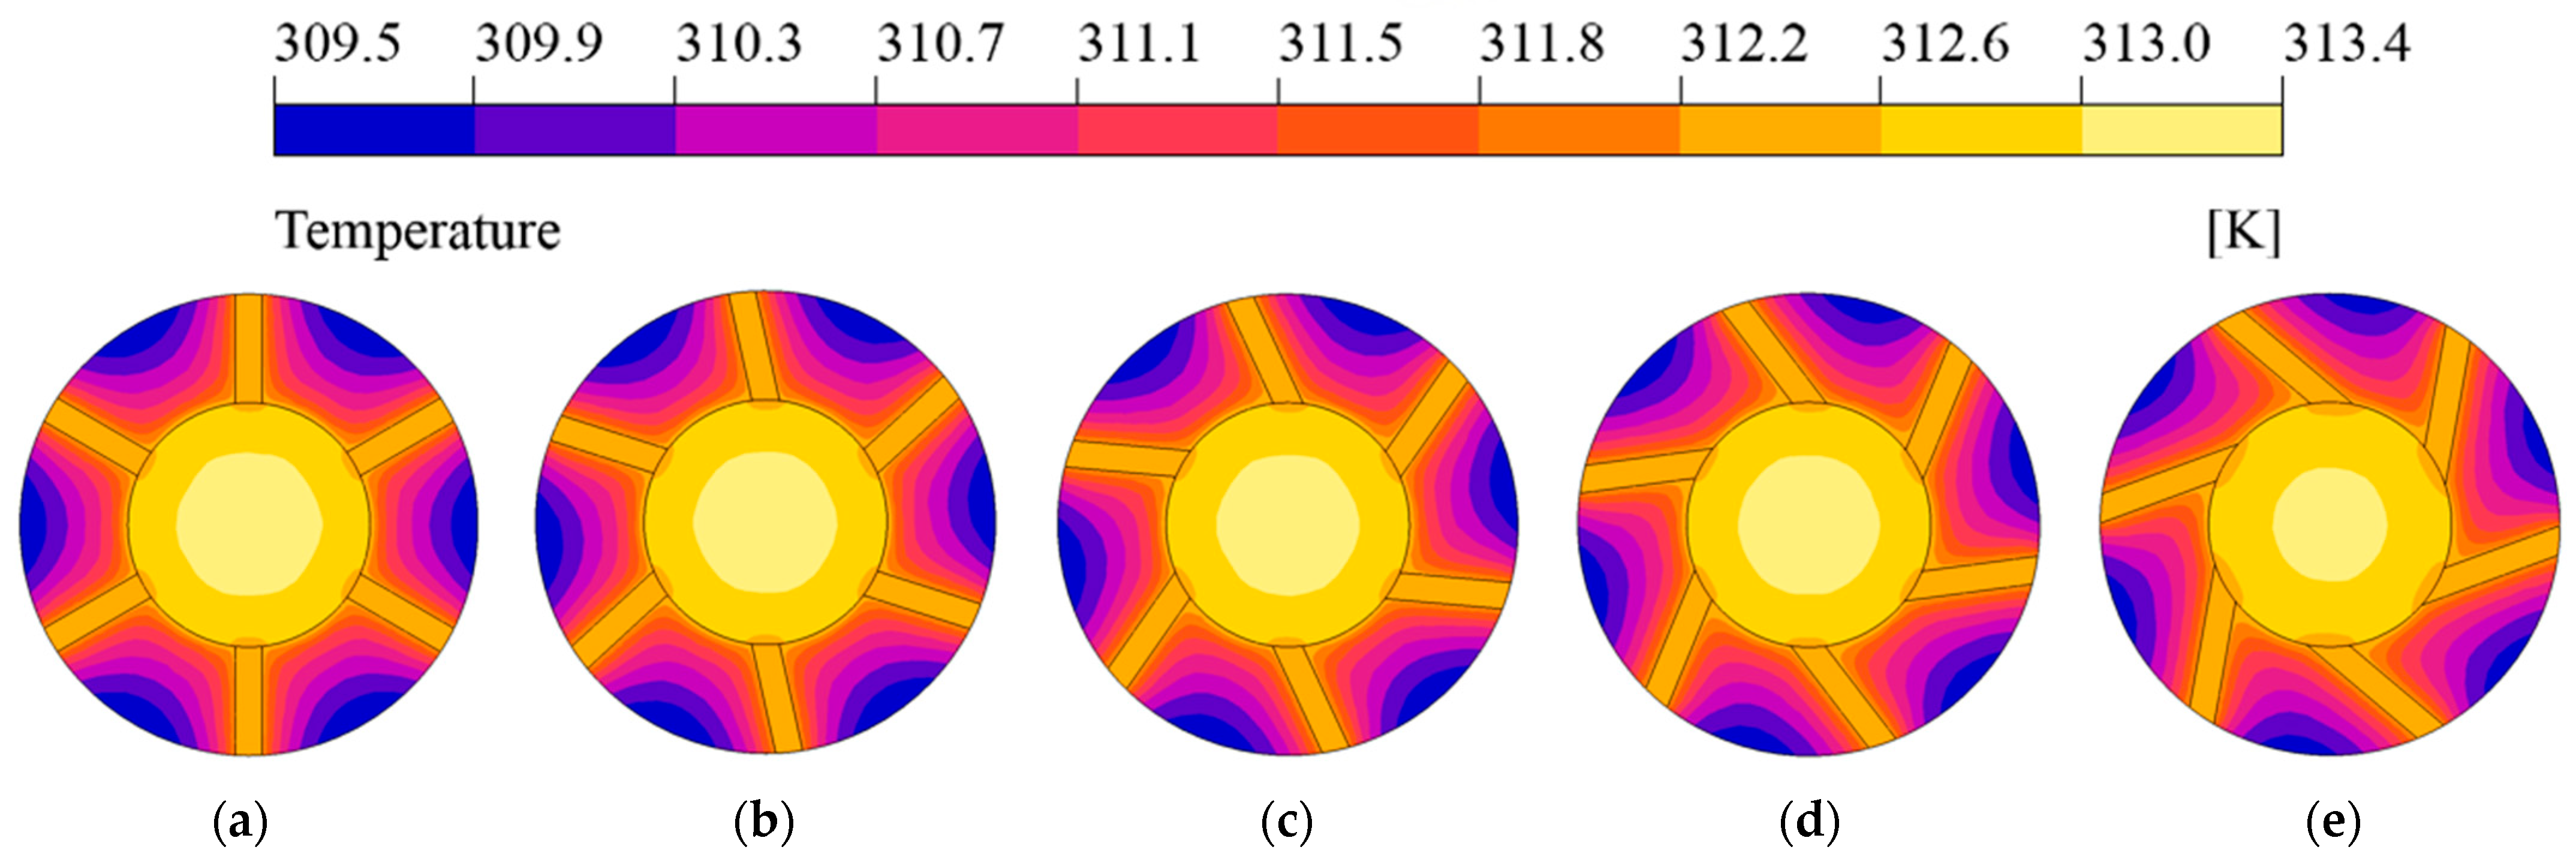
Figure 17 illustrates the temperature field of the PCM–fin structured BTMS at various fin angles. As the fin angle widens, the surface area of interaction between the fins and the cell also increases. Although this improvement in geometric configuration facilitates better thermal conduction at the interface and leads to a slight drop in the peak cell temperature, it does not substantially influence the overall heat dissipation performance.
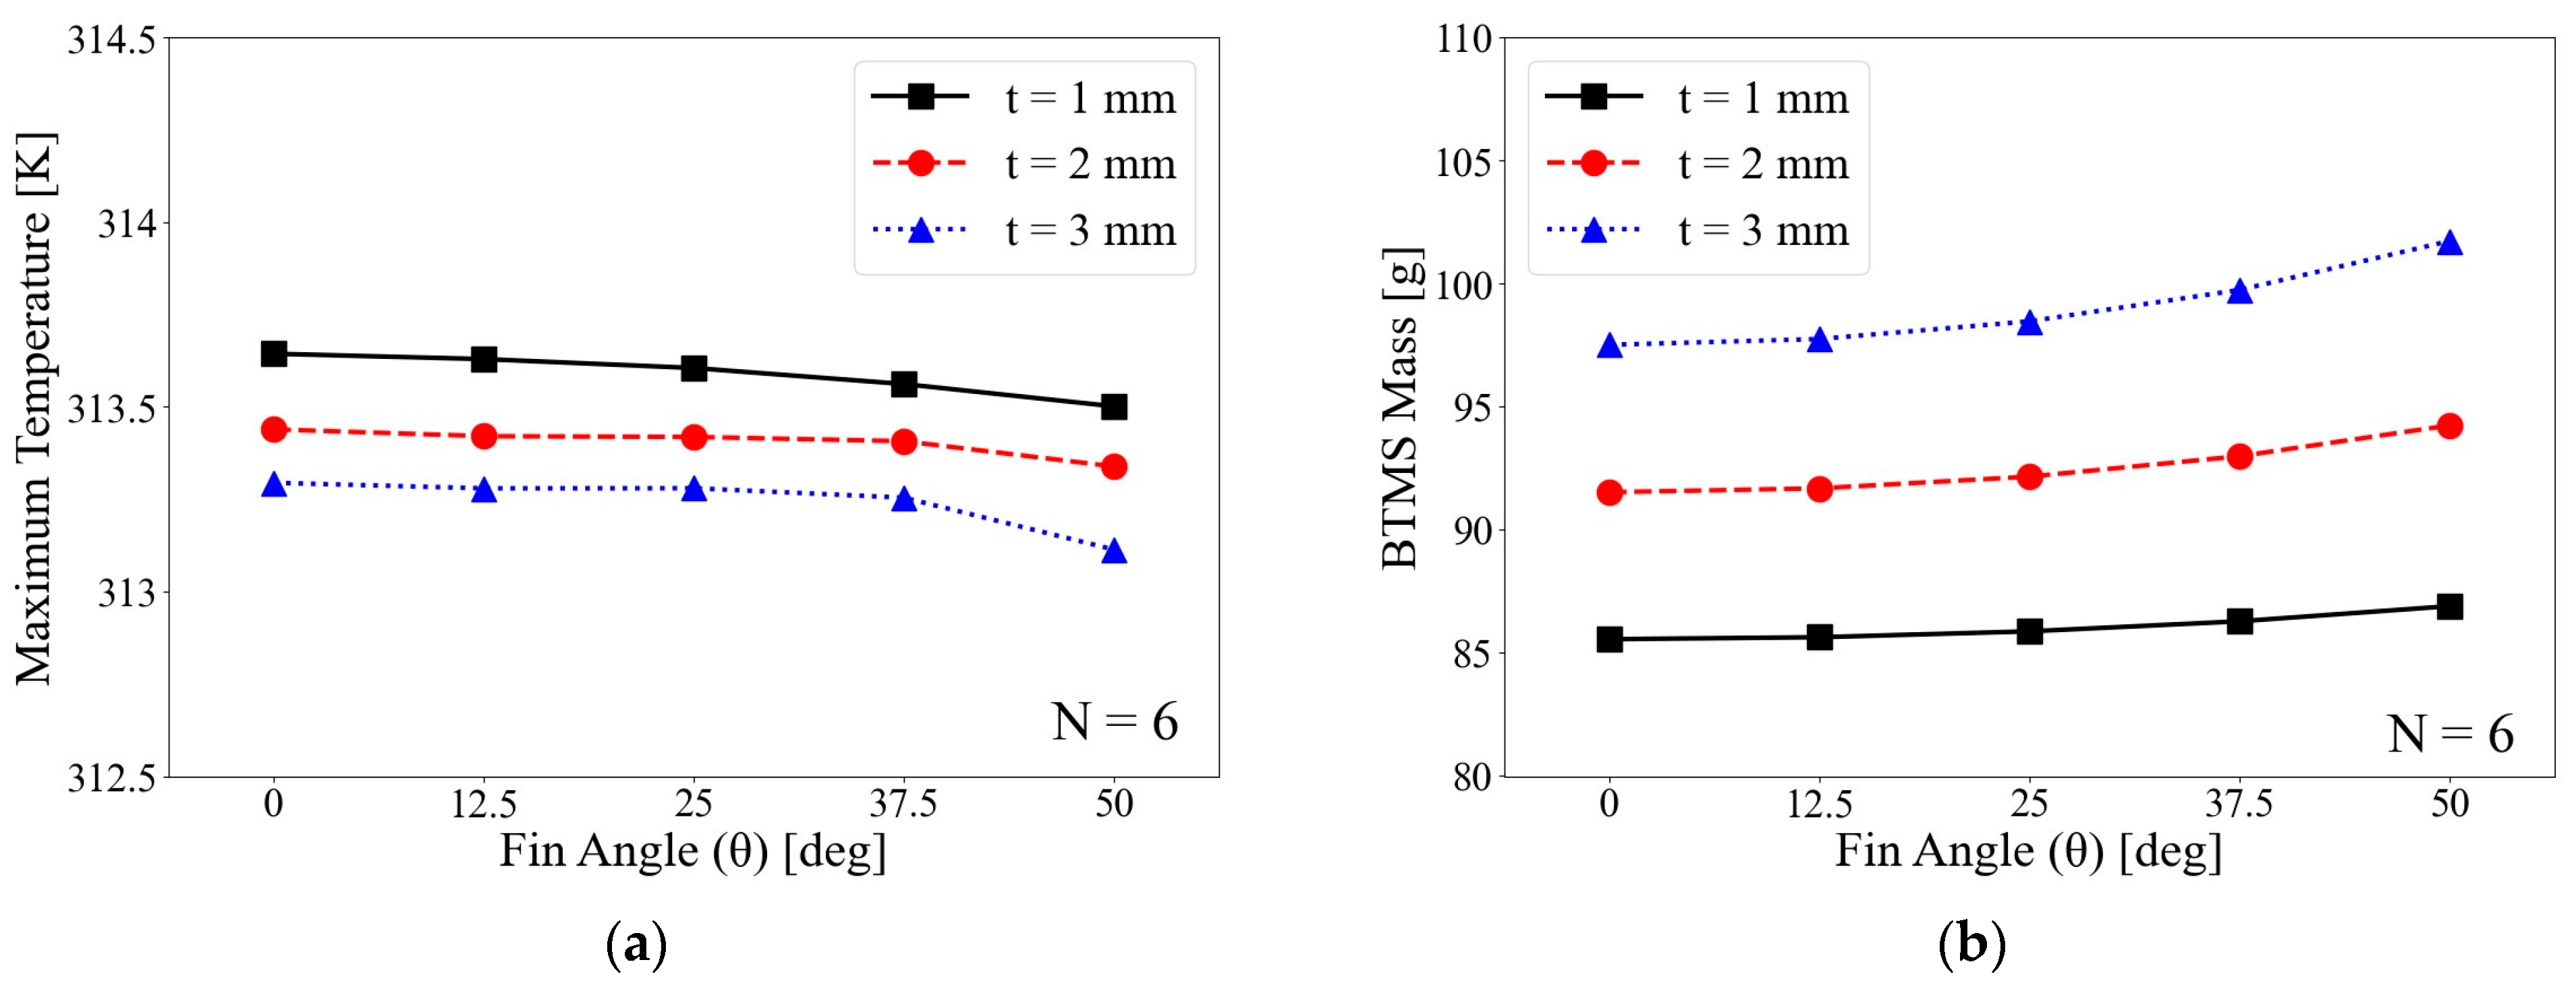
Figure 18 depicts the trends in both maximum cell temperature and total mass of the entire system across the different fin angles. As the fin angle increases from 0   d e g to 50   d e g , the highest cell temperature decreases marginally from 313.4 K to 313.3 K—a minimal difference of 0.1 K. This is the smallest temperature drop among all three design factors, indicating that increasing the fin angle does not notably improve the cooling performance of the BTMS. These findings suggest that the improvement in heat transfer resulting from increased fin angle is marginal. Meanwhile, in contrast to the linear increase in system mass observed with increasing fin number and thickness, the BTMS mass increased approximately quadratically with increasing fin angle. Notably, the rate of mass increase was more pronounced at t = 3 m m than at t = 1 m m .
Considering potential manufacturing and fitting challenges, increasing fin angle enlarges the contact interface between the fins and the cell but also results in sharper edges at the contact region. This may increase thermal contact resistance due to imperfect fit and raise manufacturing difficulty, especially for high-precision or automated assembly processes.
Although the effects of each fin design factor on the maximum cell temperature and BTMS mass were analyzed based on the DoE results, such analyses are inherently limited in quantitatively identifying the relative importance of each factor. Therefore, it is necessary to employ analysis of variance (ANOVA), a statistical method to quantify the relative influence of multiple design factors on the responses and assess their statistical significance simultaneously.

4.2. ANOVA Results for Responses

This section presents the statistical analysis results obtained using ANOVA to assess the effects of the three design factors—fin number ( N ), thickness ( t ), and angle ( θ )—on the responses: maximum cell temperature ( T m a x ) and BTMS mass ( m ). A design factor is considered statistically significant if its p -value is less than the significance level of 0.05. Additionally, a higher percent contribution indicates a greater influence of the corresponding design factor on the response.
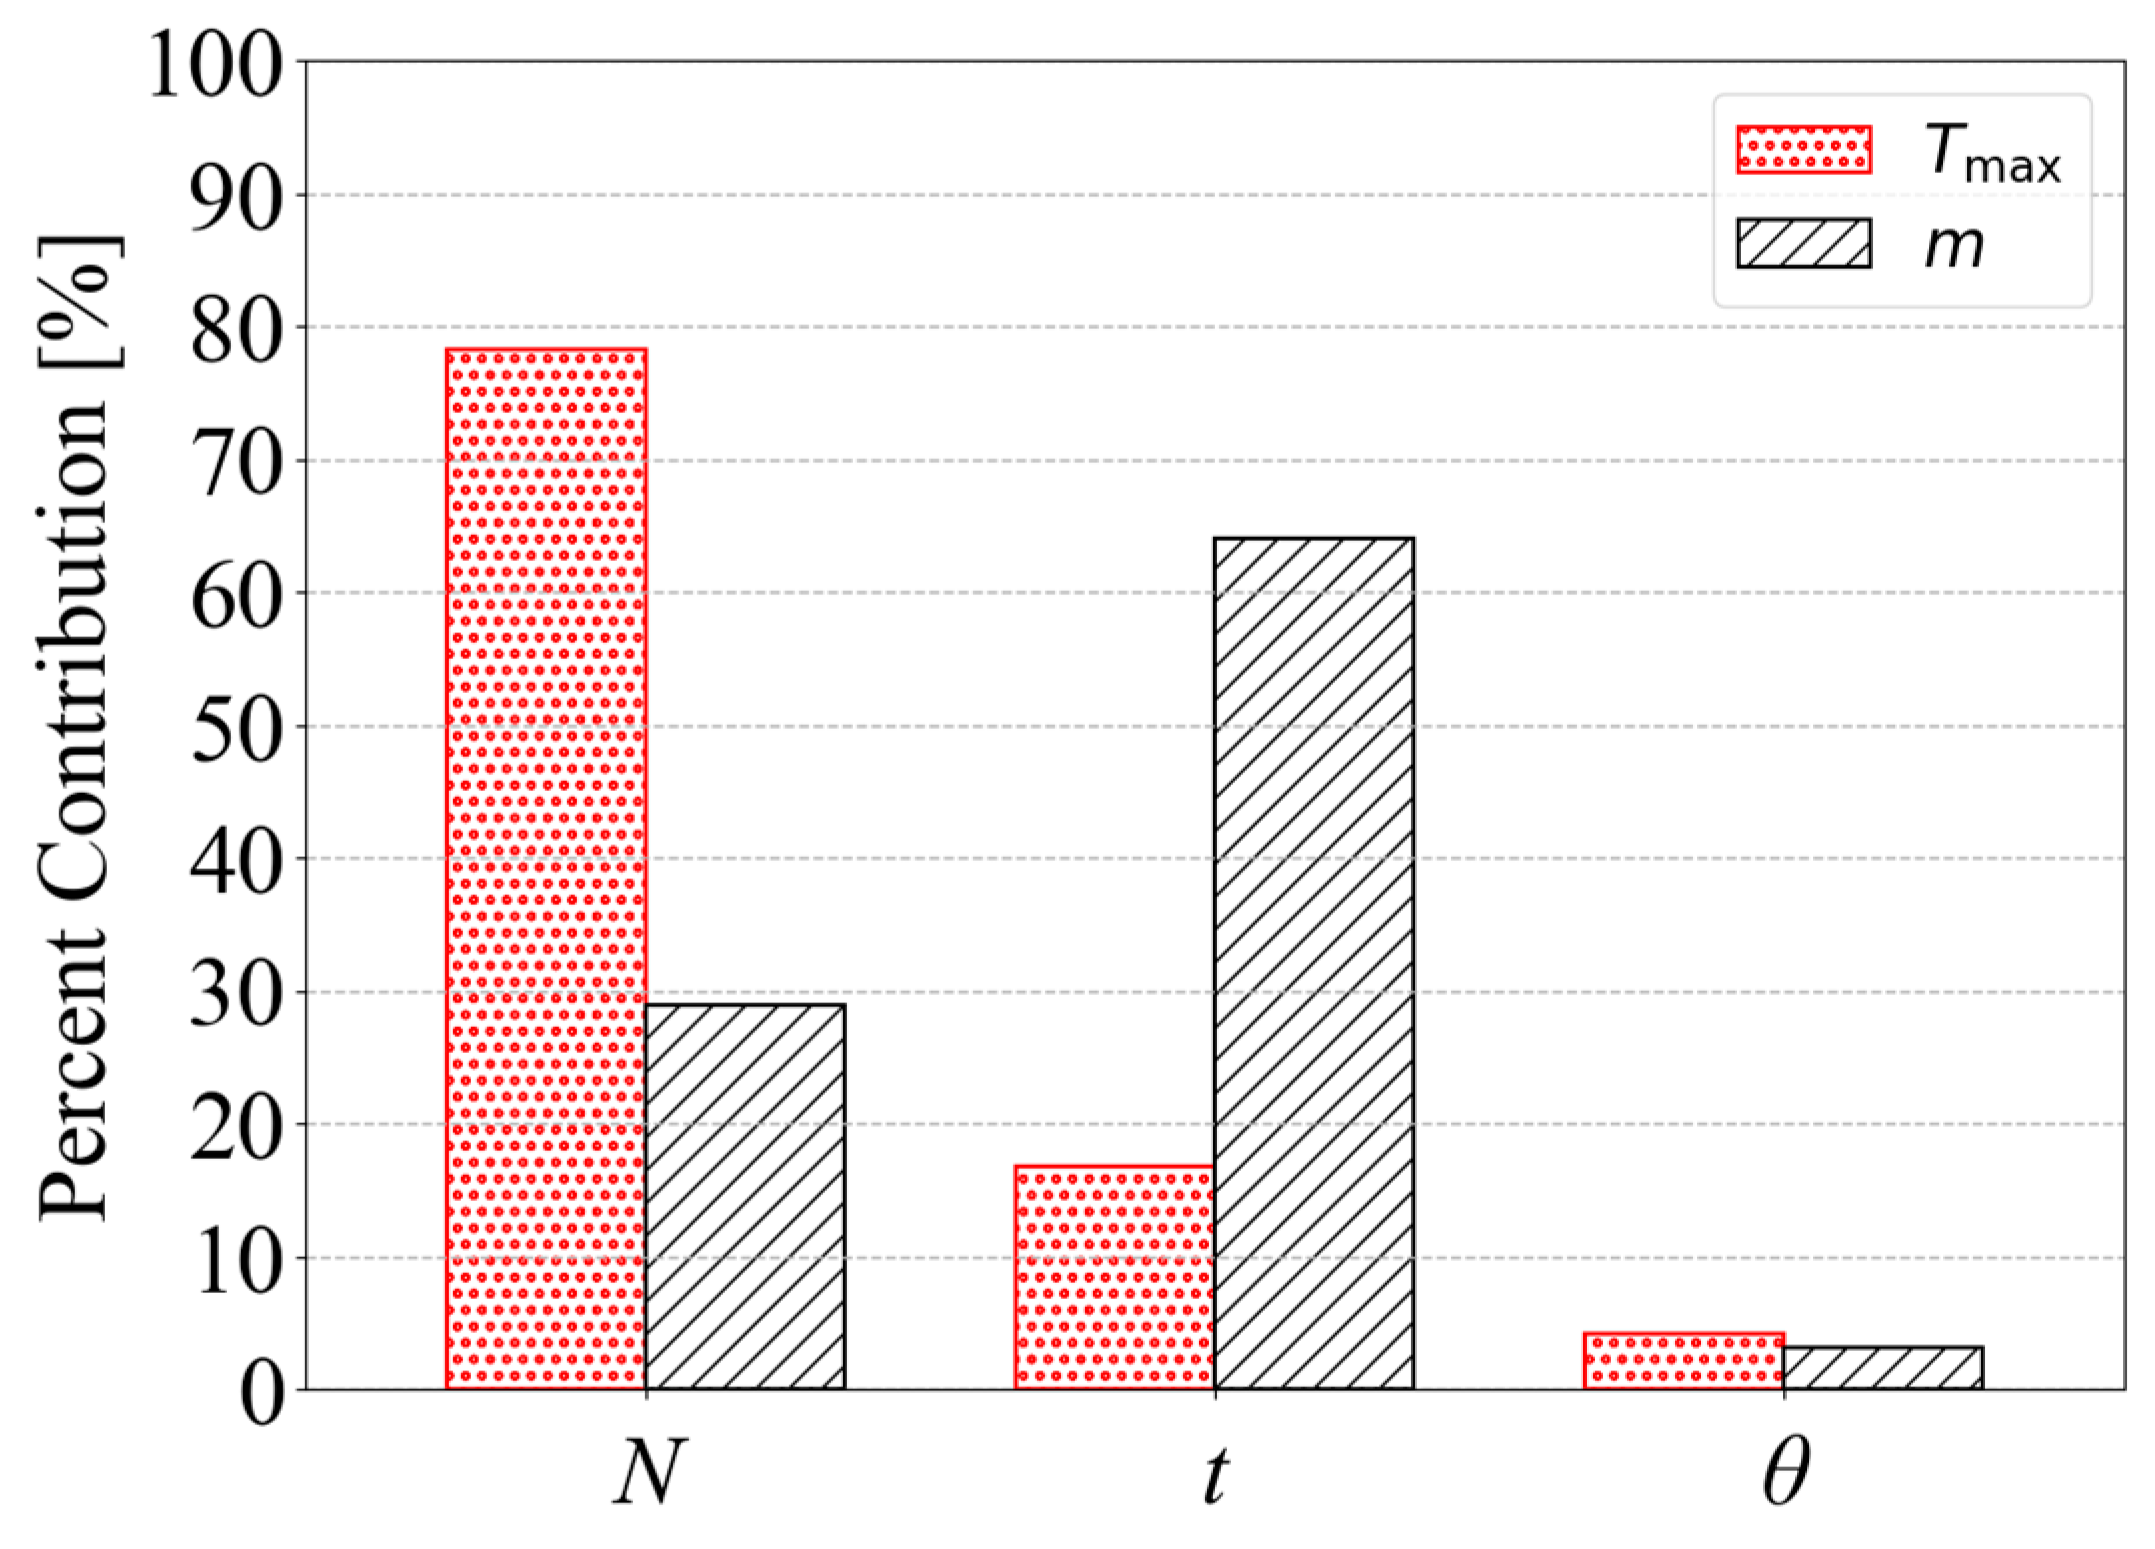
Table 4 presents the ANOVA results for T m a x . The main effect of all three design factors exhibit p -values lower than the significance level of 0.05, indicating that each factor confirms their statistically significant impact on T m a x . Among them, N shows the highest percent contribution (78.27%), followed by t and θ , with contributions of 16.71% and 4.10%, respectively. These results suggest that the number of fins has the most pronounced effect on enhancing the cooling performance of the LIB cell. The relative importance of the design factors follows the order N > t > θ . Furthermore, the interaction effects (e.g., N : t ) between the design factors were also evaluated. The percent contributions of all interaction terms were less than 1%, indicating that the interaction effects were negligible compared to the main effects. These findings confirm that the variation in T m a x is predominantly governed by the main effects of the design factors rather than their interactions.
Table 5 presents the ANOVA results for BTMS mass ( m ). Since m is defined as the aggregate summation of the masses of individual BTMS components, the physical influence of interaction effects among the design factors on m is inherently limited. Therefore, ANOVA was conducted considering only the main effects for m . The result showed that all three design factors yield p -values below the significance level of 0.05, indicating that they are statistically significant contributors to m . Unlike the ANOVA results for T m a x , the relative importance of the design factors for m follows the order t > N > θ . The most influential factor is t , with a percent contribution of 63.93%, followed by N and θ , with contributions of 28.85% and 3.10%, respectively. These results suggest that fin thickness plays the most critical role in determining the overall system mass.
Figure 19 compares the percent contributions of each design factor to T m a x and m , based on the ANOVA results. The influence of the design factors varied between the two responses. For T m a x , the most influential factor was the number of fins, with the relative importance following the order N > t > θ . In contrast, for m , the most dominant design factor was the fin thickness, with the importance ranking as t > N > θ . In both responses, the fin angle consistently showed the least influence among the three factors.
A key observation is the contrasting influence of N and t on the two responses. While N accounted for the largest contribution to T m a x at 78.27%, its influence on m was significantly lower, at 28.85%. Conversely, t had a relatively minor contribution to T m a x (16.71%) but was the most dominant factor for m , with a contribution of 63.93%. These results indicate that the effects of design factors on heat dissipation capability and the overall system mass are not inherently aligned and should therefore be considered independently during the design process.

5. Conclusions

In this study, a statistical methodology was developed to quantitatively evaluate the effects of the number of fins ( N ), fin thickness ( t ), and angle ( θ ) on the cooling performance and mass of a PCM–fin structured BTMS applied to a 18650 cylindrical LIB cell. To analyze the thermal behavior of the BTMS, a numerical model incorporating the enthalpy–porosity method was employed to represent the phase change process. Sampling points were selected using DoE, and the corresponding responses were computed via thermal fluid analysis. The analysis revealed a consistent trade-off relationship between thermal performance and system mass across all design factors. ANOVA results indicated that the relative influence of each design factor varied between the two responses. For the maximum cell temperature ( T m a x ), the order of significance was N > t > θ , whereas, for BTMS mass ( m ), it was t > N > θ . Specifically, N exhibited a dominant contribution of 78.27% to T m a x but only 28.85% to m . Conversely, t had a moderate effect on T m a x (16.71%) but emerged as the key factor for m , contributing 63.93%. The impact of θ remained the lowest for both responses, contributing 4.10% for T m a x and 3.10% for m . These findings demonstrate that it is essential to consider both objectives simultaneously to achieve an optimal balance between cooling performance and lightweight design in PCM–fin structured BTMS. To further enhance the applicability of the proposed methodology, future work should also investigate the effects of varying discharge rates (C-rate) and ambient temperatures on BTMS performance. Also, in practical applications, manufacturability and structural constraints—such as thermal contact resistance and fabrication complexity—should be carefully evaluated in parallel with the design process.

Author Contributions

Conceptualization, J.G. and C.-W.K.; methodology, J.G. and C.-W.K.; software, J.G., C.P., and H.L.; validation, J.G., C.P., H.L., and W.K.; formal analysis, J.G., C.P., and H.L.; investigation, J.G. and C.-W.K.; resources, J.G., C.P., and H.L.; data curation, J.G. and W.K.; writing—original draft preparation, J.G.; writing—review and editing, J.G., C.P., H.L., W.K., and C.-W.K.; visualization, J.G.; supervision, C.-W.K.; project administration, C.-W.K.; funding acquisition, C.-W.K. All authors have read and agreed to the published version of the manuscript.

Funding

This research was supported by National Research Foundation of Korea (NRF) grant funded by the Korea government Ministry of Science, ICT & Future Planning (RS-2024-00352401), the Technology Innovation Program (RS-2024-00444961) funded By the Ministry of Trade, Industry & Energy (MOTIE, Korea), and Korean Institute for Advancement of Technology (KIAT) grant funded by the Korea Government (MOTIE) (RS-2024-00435502, Human Resource Development Program for Industrial Innovation (Global)).

Data Availability Statement

The datasets presented in this article are not readily available because the data are part of an ongoing study. Requests to access the datasets should be directed to the corresponding author.

Conflicts of Interest

The authors declare no conflicts of interest.

Abbreviations

The following abbreviations are used in this manuscript:
PCMPhase Change Material
LIBLithium-ion Battery
BTMSBattery Thermal Management System
DoEDesign of Experiments
ANOVAAnalysis of variance
PDEPartial Differential Equation
FFDFull Factorial Design
CFDComputational Fluid Dynamics
SSSum of Squares
MSMean Square
DoFDegrees of Freedom

References

  1. Jaguemont, J.; Omar, N.; Van den Bossche, P.; Mierlo, J. Phase-Change Materials (PCM) for Automotive Applications: A Review. Appl. Therm. Eng. 2018, 132, 308–320. [Google Scholar] [CrossRef]
  2. Park, C.; Lee, J.; Lee, H.; Chang, H.K.; Kim, C.W. Enhancing Thermal Stability in Prismatic Lithium-Ion Battery Pack in Electric Vehicle through Optimization for an Indirect Liquid-Cooling System. J. Comput. Des. Eng. 2025, 12, 51–64. [Google Scholar] [CrossRef]
  3. Weng, J.; Huang, Q.; Li, X.; Zhang, G.; Ouyang, D.; Chen, M.; Yuen, A.C.Y.; Li, A.; Lee, E.W.M.; Yang, W.; et al. Safety Issue on PCM-Based Battery Thermal Management: Material Thermal Stability and System Hazard Mitigation. Energy Storage Mater. 2022, 53, 580–612. [Google Scholar] [CrossRef]
  4. Chang, H.K.; Lee, J.; Kim, C.W. A Statistical Analysis of Thermal Characteristics of 55-Ah Large-Format LIB Pouch Cell with Different Tab-Type, Tab Size, and Tab Position. Case Stud. Therm. Eng. 2022, 30, 101777. [Google Scholar] [CrossRef]
  5. Zhao, Y.; Zou, B.; Zhang, T.; Jiang, Z.; Ding, J.; Ding, Y. A Comprehensive Review of Composite Phase Change Material Based Thermal Management System for Lithium-Ion Batteries. Renew. Sustain. Energy Rev. 2022, 167, 112667. [Google Scholar] [CrossRef]
  6. Zhao, Y.; Zhang, X.; Yang, B.; Cai, S. A Review of Battery Thermal Management Systems Using Liquid Cooling and PCM. J. Energy Storage 2024, 76, 109836. [Google Scholar] [CrossRef]
  7. Park, S.; Lee, H.; Park, C.; An, J.; Kim, C.W. Optimization Using Kriging Metamodel and CMA-ES to Improve Temperature Uniformity of Electric Vehicle Liquid-Cooled Cylindrical Li-Ion Battery BTMS. J. Comput. Des. Eng. 2024, 12, 167–178. [Google Scholar] [CrossRef]
  8. Jouhara, H.; Khordehgah, N.; Serey, N.; Almahmoud, S.; Lester, S.P.; Machen, D.; Wrobel, L. Applications and Thermal Management of Rechargeable Batteries for Industrial Applications. Energy 2019, 170, 849–861. [Google Scholar] [CrossRef]
  9. Xu, X.M.; Sun, X.D.; Hu, D.H.; Li, R.Z.; Tang, W. Research on Heat Dissipation Performance and Flow Characteristics of Air-Cooled Battery Pack. Int. J. Energy Res. 2018, 42, 3658–3671. [Google Scholar] [CrossRef]
  10. Shahid, S.; Agelin-Chaab, M. Experimental and Numerical Studies on Air Cooling and Temperature Uniformity in a Battery Pack. Int. J. Energy Res. 2018, 42, 2246–2262. [Google Scholar] [CrossRef]
  11. Shang, Z.; Qi, H.; Liu, X.; Ouyang, C.; Wang, Y. Structural Optimization of Lithium-Ion Battery for Improving Thermal Performance Based on a Liquid Cooling System. Int. J. Heat Mass. Transf. 2019, 130, 33–41. [Google Scholar] [CrossRef]
  12. Wang, N.; Li, C.; Li, W.; Chen, X.; Li, Y.; Qi, D. Heat Dissipation Optimization for a Serpentine Liquid Cooling Battery Thermal Management System: An Application of Surrogate Assisted Approach. J. Energy Storage 2021, 40, 102771. [Google Scholar] [CrossRef]
  13. Jose, J.; Kumar Hotta, T. A Comprehensive Review of Heat Pipe: Its Types, Incorporation Techniques, Methods of Analysis and Applications. Therm. Sci. Eng. Prog. 2023, 42, 101860. [Google Scholar] [CrossRef]
  14. Smith, J.; Singh, R.; Hinterberger, M.; Mochizuki, M. Battery Thermal Management System for Electric Vehicle Using Heat Pipes. Int. J. Therm. Sci. 2018, 134, 517–529. [Google Scholar] [CrossRef]
  15. Huang, Y.H.; Cheng, W.L.; Zhao, R. Thermal Management of Li-Ion Battery Pack with the Application of Flexible Form-Stable Composite Phase Change Materials. Energy Convers. Manag. 2019, 182, 9–20. [Google Scholar] [CrossRef]
  16. Fan, Z.; Gao, R.; Liu, S. A Novel Battery Thermal Management System Based on P Type Triply Periodic Minimal Surface. Int. J. Heat Mass. Transf. 2022, 194, 123090. [Google Scholar] [CrossRef]
  17. Luo, J.; Zou, D.; Wang, Y.; Wang, S.; Huang, L. Battery Thermal Management Systems (BTMs) Based on Phase Change Material (PCM): A Comprehensive Review. Chem. Eng. J. 2022, 430, 132741. [Google Scholar] [CrossRef]
  18. Yang, T.; Su, S.; Xin, Q.; Zeng, J.; Zhang, H.; Zeng, X.; Xiao, J. Thermal Management of Lithium-Ion Batteries Based on Honeycomb-Structured Liquid Cooling and Phase Change Materials. Batteries 2023, 9, 287. [Google Scholar] [CrossRef]
  19. Ling, Z.; Cao, J.; Zhang, W.; Zhang, Z.; Fang, X.; Gao, X. Compact Liquid Cooling Strategy with Phase Change Materials for Li-Ion Batteries Optimized Using Response Surface Methodology. Appl. Energy 2018, 228, 777–788. [Google Scholar] [CrossRef]
  20. Chen, Z.; Wang, S.; Dang, C.; Yin, L.; Ren, H. Optimal Distribution of the Fin Structures in a Phase Change Material Module for Battery Thermal Management. J. Energy Storage 2024, 99, 113194. [Google Scholar] [CrossRef]
  21. Darkwa, J.; Zhou, T. Enhanced Laminated Composite Phase Change Material for Energy Storage. Energy Convers. Manag. 2011, 52, 810–815. [Google Scholar] [CrossRef]
  22. Swamy, K.A.; Verma, S.; Bhattacharyya, S. Experimental and Numerical Investigation of Nanoparticle Assisted PCM-Based Battery Thermal Management System. J. Therm. Anal. Calorim. 2024, 149, 11223–11237. [Google Scholar] [CrossRef]
  23. Samimi, F.; Babapoor, A.; Azizi, M.; Karimi, G. Thermal Management Analysis of a Li-Ion Battery Cell Using Phase Change Material Loaded with Carbon Fibers. Energy 2016, 96, 355–371. [Google Scholar] [CrossRef]
  24. Huang, R.; Li, Z.; Hong, W.; Wu, Q.; Yu, X. Experimental and Numerical Study of PCM Thermophysical Parameters on Lithium-Ion Battery Thermal Management. Energy Rep. 2020, 6, 8–19. [Google Scholar] [CrossRef]
  25. Zhang, F.; Zhai, L.; Zhang, L.; Yi, M.; Du, B.; Li, S. A Novel Hybrid Battery Thermal Management System with Fins Added on and between Liquid Cooling Channels in Composite Phase Change Materials. Appl. Therm. Eng. 2022, 207, 118198. [Google Scholar] [CrossRef]
  26. Fan, R.; Zheng, N.; Sun, Z. Evaluation of Fin Intensified Phase Change Material Systems for Thermal Management of Li-Ion Battery Modules. Int. J. Heat Mass. Transf. 2021, 166, 120753. [Google Scholar] [CrossRef]
  27. Fan, Z.; Gao, R.; Liu, S. Thermal Conductivity Enhancement and Thermal Saturation Elimination Designs of Battery Thermal Management System for Phase Change Materials Based on Triply Periodic Minimal Surface. Energy 2022, 259, 125091. [Google Scholar] [CrossRef]
  28. Sun, Z.; Fan, R.; Yan, F.; Zhou, T.; Zheng, N. Thermal Management of the Lithium-Ion Battery by the Composite PCM-Fin Structures. Int. J. Heat Mass. Transf. 2019, 145, 118739. [Google Scholar] [CrossRef]
  29. Choudhari, V.G.; Dhoble, A.S.; Panchal, S. Numerical Analysis of Different Fin Structures in Phase Change Material Module for Battery Thermal Management System and Its Optimization. Int. J. Heat Mass. Transf. 2020, 163, 120434. [Google Scholar] [CrossRef]
  30. Li, W.; Zhao, J.; Zhang, L.; Wang, J.; Zhang, X.; Zhu, Y.; Zhao, J. Thermal Management Optimization Strategy for Lithium-Ion Battery Based on Phase Change Material and Fractal Fin. J. Energy Storage 2024, 102, 114159. [Google Scholar] [CrossRef]
  31. Sun, Z.; Fan, R.; Zheng, N. Thermal Management of a Simulated Battery with the Compound Use of Phase Change Material and Fins: Experimental and Numerical Investigations. Int. J. Therm. Sci. 2021, 165, 106945. [Google Scholar] [CrossRef]
  32. Sutheesh, P.M.; Jose, J.; Hotta, T.K.; Rohinikumar, B. Numerical Investigations on Thermal Performance of PCM-Based Lithium-Ion Battery Thermal Management System Equipped with Advanced Honeycomb Structures. Int. Commun. Heat Mass. Transf. 2024, 158, 107937. [Google Scholar] [CrossRef]
  33. Dagdevir, T.; Ding, Y. Numerical Investigation of Battery Thermal Management by Using Helical Fin and Composite Phase Change Material. J. Energy Storage 2024, 75, 109674. [Google Scholar] [CrossRef]
  34. Zhang, W.; Li, X.; Liu, G.; Ouyang, N.; Yuan, J.; Xie, Y.; Wu, W. Optimization Design of a Hybrid Thermal Runaway Propagation Mitigation System for Power Battery Module Using High-Dimensional Surrogate Models. Renew. Energy 2024, 225, 120288. [Google Scholar] [CrossRef]
  35. Kong, D.; Peng, R.; Ping, P.; Du, J.; Chen, G.; Wen, J. A Novel Battery Thermal Management System Coupling with PCM and Optimized Controllable Liquid Cooling for Different Ambient Temperatures. Energy Convers. Manag. 2020, 204, 112280. [Google Scholar] [CrossRef]
  36. Zhang, F.; Lu, F.; Liang, B.; Zhu, Y.; Gou, H.; Xiao, K.; He, Y. Thermal Performance Analysis of a New Type of Branch-Fin Enhanced Battery Thermal Management PCM Module. Renew. Energy 2023, 206, 1049–1063. [Google Scholar] [CrossRef]
  37. Park, S.; Lee, H.; Park, C.; Kim, C.W. A Statistical Analysis of the Effect of Design Factors of the Cylindrical Battery Module on the Thermal Behavior by C-Rate. Heliyon 2024, 10, e39220. [Google Scholar] [CrossRef]
  38. Lee, H.; Park, S.; Kim, C.W. Electrochemical–Thermal Fluid Coupled Analysis and Statistical Analysis of Cooling System for Large Pouch Cells. Mathematics 2024, 12, 3261. [Google Scholar] [CrossRef]
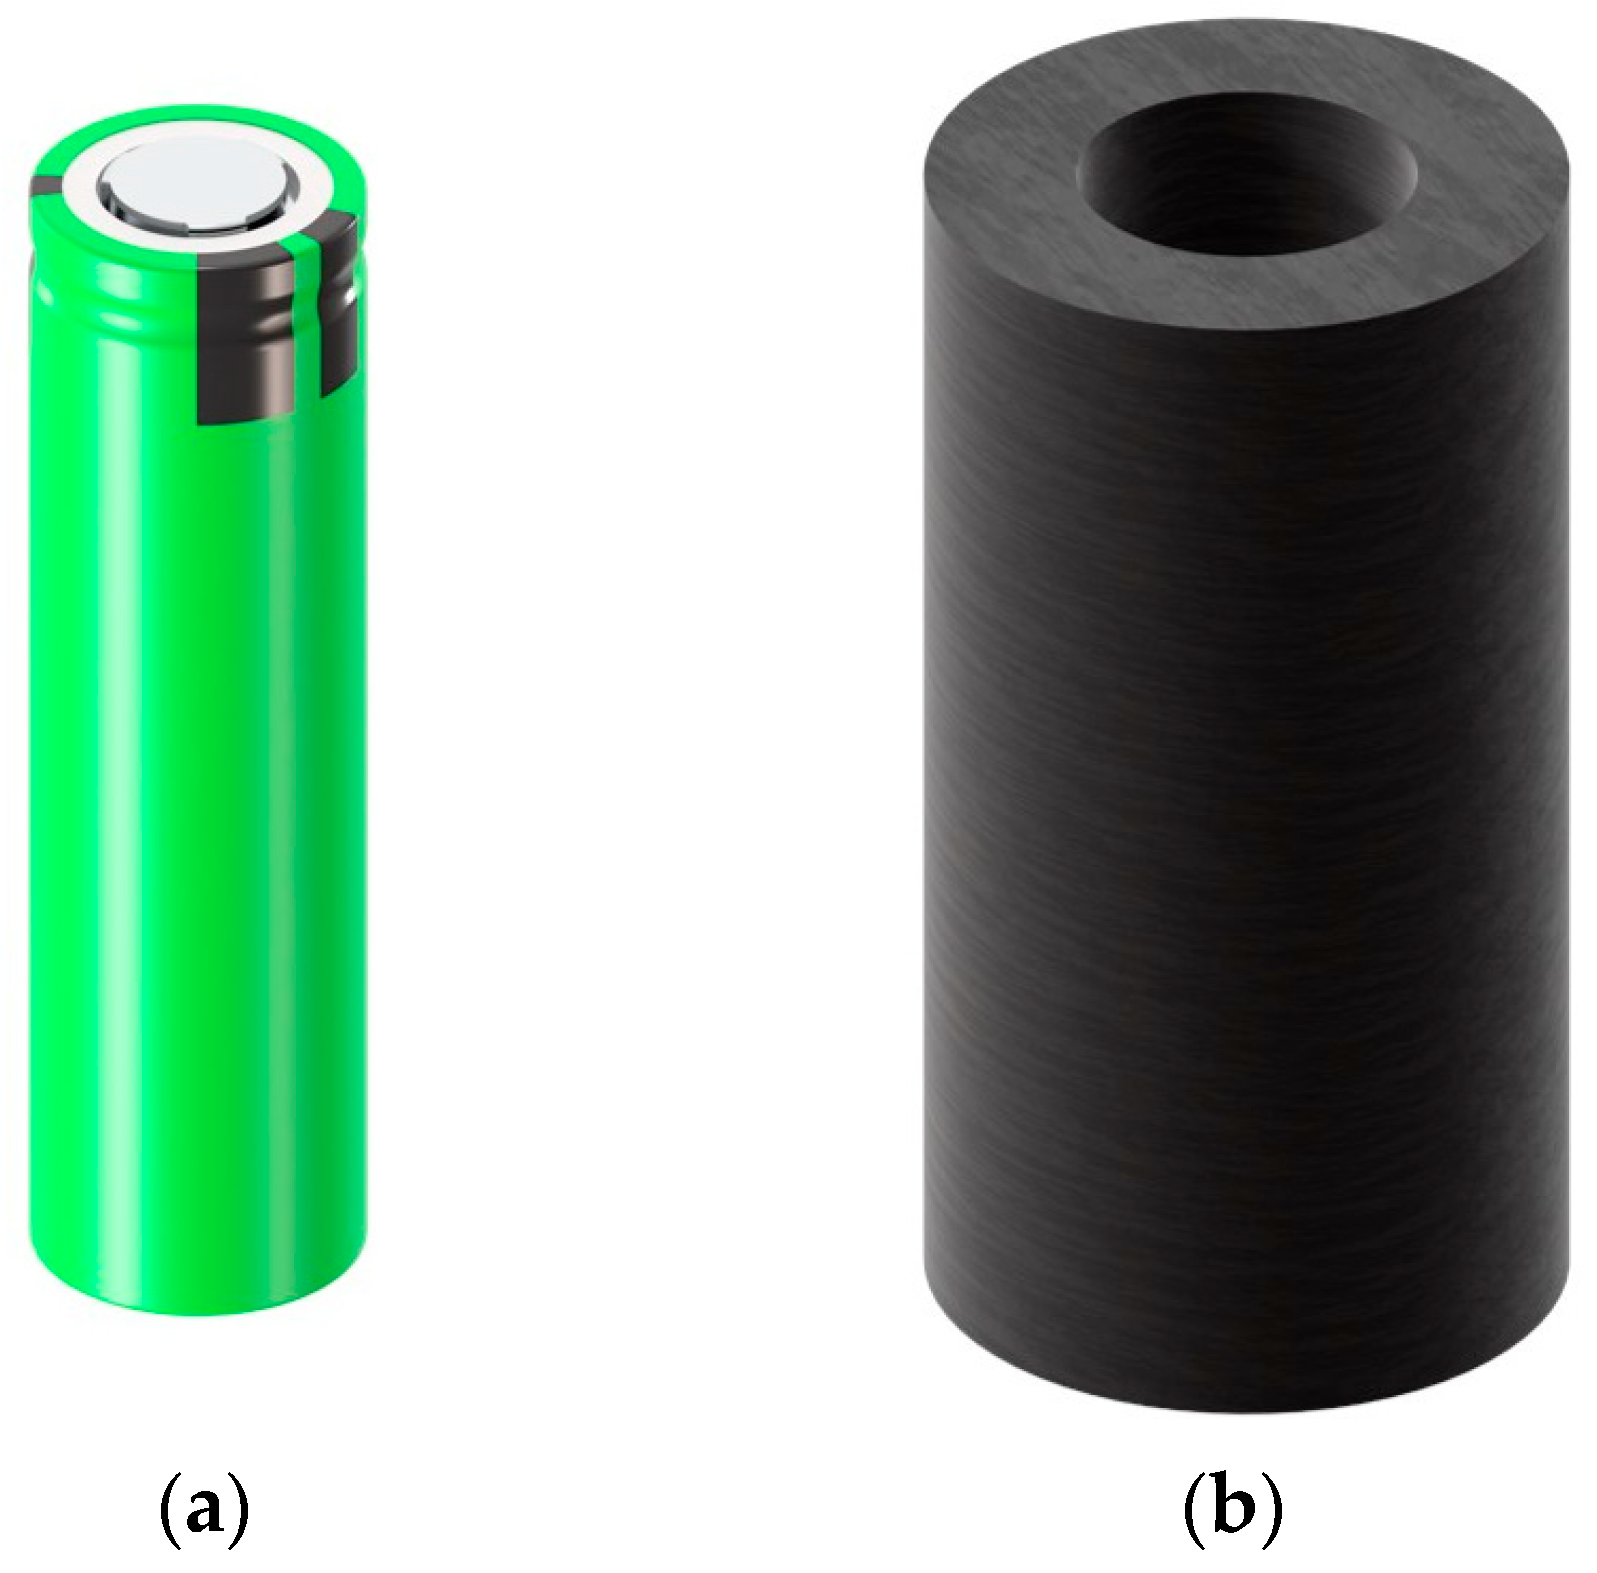
Figure 1. (a) 18650 cylindrical LIB cell; (b) PCM (paraffin RT-42).
Mathematics 13 02800 g001
Figure 2. Schematic of PCM–fin structured BTMS.
Mathematics 13 02800 g002
Figure 3. (a) Grid independence test; (b) time step independence test.
Mathematics 13 02800 g003
Figure 4. Surface temperature of LIB cell: comparison of experimental [36] and numerical results.
Mathematics 13 02800 g004
Figure 5. Maximum temperature of LIB cell.
Mathematics 13 02800 g005
Figure 6. Temperature distribution of PCM–fin structured BTMS after discharge.
Mathematics 13 02800 g006
Figure 7. Design factors of fin in PCM–fin structured BTMS.
Mathematics 13 02800 g007
Figure 8. Result of DoE: maximum temperature of LIB cell.
Mathematics 13 02800 g008
Figure 9. Result of DoE: BTMS mass.
Mathematics 13 02800 g009
Figure 10. PCM–fin structured BTMS with different fin numbers: (a) 4; (b) 5; (c) 6; (d) 7; (e) 8.
Mathematics 13 02800 g010
Figure 11. Temperature distribution of PCM–fin structured BTMS with different fin numbers: (a) 4; (b) 5; (c) 6; (d) 7; (e) 8.
Mathematics 13 02800 g011
Figure 12. The effect of fin number on (a) maximum temperature ( T m a x ); (b) BTMS mass ( m ).
Mathematics 13 02800 g012
Figure 13. PCM–fin structured BTMS with different fin thicknesses: (a) 1 mm; (b) 1.5 mm; (c) 2 mm; (d) 2.5 mm; (e) 3 mm.
Mathematics 13 02800 g013
Figure 14. Temperature distribution of PCM–fin structured BTMS with different fin thicknesses: (a) 1 mm; (b) 1.5 mm; (c) 2 mm; (d) 2.5 mm; (e) 3 mm.
Mathematics 13 02800 g014
Figure 15. The effect of fin thickness on (a) maximum temperature ( T m a x ); (b) BTMS mass ( m ).
Mathematics 13 02800 g015
Figure 16. PCM–fin structured BTMS with different fin angles: (a) 0   d e g ; (b) 12.5   d e g ; (c) 25   d e g ; (d) 37.5   d e g ; (e) 50   d e g .
Mathematics 13 02800 g016
Figure 17. Temperature distribution of PCM–fin structured BTMS with different fin angles: (a) 0   d e g ; (b) 12.5   d e g ; (c) 25   d e g ; (d) 37.5   d e g ; (e) 50   d e g .
Mathematics 13 02800 g017
Figure 18. The effect of fin angle on (a) maximum temperature ( T m a x ); (b) BTMS mass ( m ).
Mathematics 13 02800 g018
Figure 19. Percent contribution of each design factor on the responses.
Mathematics 13 02800 g019
Table 1. Specification of the LIB cell.
ItemsUnitValue
Type 18,650
Diameter m m 18
Height m m 65
Mass g 44.5
Nominal voltage V 3.6
Nominal capacity A h 2.4
Internal resistance m Ω 30
Table 2. Thermophysical properties of materials.
PropertiesUnitLIB CellPCMAluminumAcryl
Density k g / m 3 272082027191215
Specific heat capacity J / ( k g · K ) 30020008711300
Thermal conductivity W / ( m · K ) 30.2202.40.17
Dynamic viscosity k g / ( m · s ) 0.02
Latent heat J / k g 165,000
Solidus temperature K 311.15
Liquidus temperature K 316.15
Table 3. Design factors and their levels.
Design Factors1st Level2nd Level3rd Level4th Level5th Level
N 45678
t [mm]11.522.53
θ [deg]012.52537.550
Table 4. ANOVA result for maximum cell temperature ( T m a x ).
Design
Factors
Sum of
Squares
Degrees of
Freedom
Mean
Square
F -ValuePercent
Contribution
p -Value
N 9.46064942.3651623001.02478.27%<0.05
t 2.01983440.504958640.713916.71%<0.05
θ 0.49580440.123951157.27444.10%<0.05
N : t 0.022388160.0013991.7754350.19%0.0548
N : θ 0.022116160.0013821.7538660.18%0.0587
t : θ 0.015983160.0009991.2674740.13%0.2456
Error0.050440640.000788 0.42%
Table 5. ANOVA result for BTMS mass ( m ).
Design
Factors
Sum of
Squares
Degrees of
Freedom
Mean
Square
F -ValuePercent
Contribution
p -Value
N 1188.5814297.1452196.469328.85%<0.05
t 2633.9934658.4983435.392263.93%<0.05
θ 127.8065431.9516221.126083.10%<0.05
Error169.39171121.512426 4.11%
Disclaimer/Publisher’s Note: The statements, opinions and data contained in all publications are solely those of the individual author(s) and contributor(s) and not of MDPI and/or the editor(s). MDPI and/or the editor(s) disclaim responsibility for any injury to people or property resulting from any ideas, methods, instructions or products referred to in the content.