Article

Dynamic Stochastic Game Models for Collaborative Emergency Response in a Two-Tier Disaster Relief System

School of Economics and Management, Northwest University, Xi’an 710127, China
*
Author to whom correspondence should be addressed.
Mathematics 2025, 13(17), 2780; https://doi.org/10.3390/math13172780
Submission received: 19 July 2025 / Revised: 14 August 2025 / Accepted: 21 August 2025 / Published: 29 August 2025

Abstract

This study investigates collaborative disaster response strategies involving the government and social organizations from a dynamic perspective, incorporating stochastic disturbances that influence emergency resource supply. To examine the strategic interactions among the participants, three stochastic differential game models are formulated under distinct scenarios: centralized decision making for collusive emergency response, decentralized emergency response without a cost-sharing contract, and decentralized emergency response with a cost-sharing contract. Under an infinite-horizon planning framework, the closed-form solutions for the optimal response efforts and the corresponding value functions are derived for all three scenarios and comparatively analyzed. The results indicate that compared with the purely decentralized scenario, introducing a cost-sharing mechanism achieves a Pareto improvement by optimizing both overall system efficiency and emergency supply availability. Although the centralized collusive model results in the highest expected level of emergency resource supply, it is also associated with the greatest uncertainty. Furthermore, a numerical simulation based on emergency resource allocation during the Wenchuan earthquake is conducted. The results show significant differences in resource availability and response performance under different response mechanisms. Centralized collaboration, together with a well-designed cost-sharing mechanism, can significantly enhance the robustness and efficiency of the overall system, offering important insights for optimizing real-world disaster response strategies.

1. Introduction

Due to escalating environmental degradation and global climate change, natural hazards continue to represent one of the most significant threats to human survival and economic development. These phenomena are characterized by their dynamic nature, increasing frequency, intricate interactions, destructive capacity, and inherent unpredictability [1]. Empirical data indicate that extreme meteorological and climate-induced events—such as cyclones, hailstorms, and floods—account for approximately 83 % of all natural catastrophes. Since the early 20th century, both natural and man-made disasters have resulted in the deaths of more than 400,000 people and impacted the lives of around 1.7 billion individuals worldwide. A striking 92 % of these fatalities have occurred in developing and emerging economies, with the Asia–Pacific and African regions being disproportionately affected. For instance, the catastrophic Indian Ocean tsunami of 2004, one of the deadliest natural events in recent history, was triggered by a powerful undersea earthquake near Sumatra. It caused massive devastation, especially in Indonesia, leading to hundreds of thousands of casualties and displacing millions. Similarly, on 12 May 2008, the Wenchuan Earthquake—also referred to as the Great Sichuan Earthquake—struck China’s Sichuan province with severe impact, causing widespread destruction and loss of life. The earthquake, measuring 7.9 in magnitude, unleashed widespread destruction across a vast area, causing immense loss of life and property. Therefore, disaster reduction is essential for the government in emergency management [2].
Natural disasters can occur anywhere, at any moment, with potentially unlimited damage. Consequently, there will be an urgent need for emergency supplies, money, rescue workers, emergency communications, etc. Building a strategic emergency reserve system is necessary to satisfy those demands and improve the survival rate. For example, the World Food Programme, Médecins Sans Frontières, and others have developed foundational systems for emergency supply reserves. Similarly, China initiated its own emergency material reserve mechanism as early as 1998. Despite establishing a supply reserve system, a few shortages remain that need to be addressed [3]. Response speed, resource mobilization, and inter-organizational coordination are the three critical indicators for emergency response. Firstly, when confronted with a sudden catastrophe, the emergency management system might become bogged down by bureaucracy in the initial phase. Secondly, in the aftermath of a disaster, the reserves maintained by governmental bodies and major humanitarian organizations must be sufficient to address the sharp surge in demand for emergency supplies. Inadequate provisioning often leads to delayed medical response, hindered rescue efforts, and the spread of infectious diseases, all of which contribute significantly to the overall casualty rate. Additionally, disasters often cause significant harm to essential infrastructure, resulting in disruptions to the distribution of relief supplies and the deployment of rescue teams. This is incredibly impactful in today’s society, where our reliance on infrastructure services continues to grow. Therefore, the government and emergency management agencies must construct an efficient and inter-organizational disaster relief system.
Game theory provides a rigorous framework for analyzing strategic interactions and decision-making processes among multiple stakeholders, each operating under specific objectives, limitations, and control mechanisms. This approach has been widely applied to dynamic decision-making scenarios, such as resource distribution [4], carbon regulation [5,6], collaborative advertising [7], recycling systems [8], and the coordination of policies for water pollution mitigation [9,10]. In recent years, differential game theory has been increasingly applied to emergency resource supply, such as joint transportation for disaster aid [11], corporate philanthropy in post-disaster scenarios [12], and the refinement of misinformation detection mechanisms [13]. For example, Chen developed a model of China’s emergency reserve system that included the public and private sectors, finding that joint reserves are more effective than reactive strategies under fiscal constraints [14]. Zhang investigated cooperation incentives through a tripartite game involving governments, enterprises, and the public [15]. Qiu demonstrated that stringent oversight by higher administrative entities (HAEs) plays a significant role in enabling interregional coordination. Additionally, reward and penalty mechanisms enforced by HAEs can either expedite or hinder convergence to a stable strategic profit [16]. Du focused on optimizing government mobilization strategies by analyzing collaboration patterns between official institutions and community-based non-profit organizations [17]. From a broader theoretical perspective, the stochastic game framework provides a unifying structure for modeling dynamic strategic interactions under uncertainty [18], while unconventional modeling approaches from systems neurology offer insights into intuitive and creative decision making [19]. Moreover, historic behavior in discrete-time dynamical systems reveals complex, non-averaging patterns that may have analogues in long-term strategic processes [20]. For further theoretical and empirical developments, readers are encouraged to consult [21,22].
Prior research has predominantly examined emergency management through the lenses of regulatory oversight, expenditure, service demand, and response duration, often neglecting the influence of stochastic disturbances. In differential games, such uncertainty plays a significant role in reshaping the dynamic evolution of the game and the equilibrium strategies chosen by the involved participants [23,24]. Specifically, random disturbances can alter the expected payoffs, influence the effectiveness of control actions, and introduce unpredictability into the state transitions of the dynamic system under consideration [25]. Consequently, decision makers must account for these stochastic elements when formulating their strategies and adapt their approaches to handle the inherent uncertainty in the game environment. To better reflect the complex and volatile nature of disaster environments—affected by weather events, secondary disasters, logistics disruptions, infrastructure failures, and shifting market signals—recent research has increasingly turned to stochastic differential game models as a more robust analytical framework. For instance, Wang incorporated stochastic reputation dynamics into emission-reduction decisions in green supply chains [24]; Liu applied SDG theory to optimize water resource allocation with random hydrological variations [26]; Zou explored collaborative innovation with cost sharing and market uncertainty [27]; and Sun [28] constructed green innovation dynamics in supply chains, capturing the impact of competition intensity and government subsidies in a stochastic scenario.
Building on these developments, this paper investigates collaborative disaster response strategies involving the government and social organizations from a dynamic perspective, incorporating stochastic factors that influence emergency supply. The remainder of this paper is structured as follows: Section 2 outlines the research problem and presents some basic assumptions. Section 3 introduces several essential preliminaries. Section 4, Section 5 and Section 6 present three distinct models proposed to analyze disaster response strategies: centralized decision making for collusive emergency response, decentralized emergency response without a cost-sharing contract, and decentralized emergency response with a cost-sharing contract. Section 7 contains an evaluation supported by numerical simulations, while we conclude this paper in Section 8 with a summary.

2. Problem Formulation and Assumptions

2.1. Problem Formulation

In this study, we examine a streamlined emergency relief framework involving governmental bodies and social organizations, aiming to optimize dynamic response mechanisms under the impact of large-scale natural catastrophes. To investigate this objective, three types of stochastic differential game models are developed: centralized decision making for collusive emergency response, decentralized emergency response without a cost-sharing contract, and decentralized emergency response with a cost-sharing contract. Drawing upon these three formulations, the research seeks to address the following core issues: (1) How does emergency resource availability evolve with time in the disaster relief system? (2) How can players collaboratively enhance emergency resource availability? (3) What is the optimal strategy?

2.2. Basic Assumption

(1)
The disaster relief system primarily consists of the government and social organizations, where the latter refers to diverse non-governmental groups formed organically by different societal segments to address natural disasters [29].
(2)
According to prior studies [30,31], the costs associated with post-disaster relief efforts are generally positively correlated with the intensity of response efforts. In this study, we adopt the quadratic function commonly used in differential game models, i.e.,
C G = 1 2 k G E G 2 , C S = 1 2 k S E S 2 ,
where C G , C S represent the total costs incurred by the government and social organizations when carrying out emergency responses. E G , E S denote their corresponding response efforts, such as the scale of emergency procurement, logistics deployment, or personnel mobilization. k G and k S are the marginal cost coefficients: a larger k G or k S means that each additional unit of effort requires disproportionately higher spending, reflecting increasing marginal costs. Such cost function not only satisfies the fundamental assumption of increasing marginal costs but also ensures the convexity of the objective function, thereby facilitating the derivation of closed-form equilibrium solutions via the Hamilton–Jacobi–Bellman (HJB) equation.
(3)
Emergency resource availability A ( t ) is dynamic and influenced by various uncertain factors such as technological shifts, policy changes, and sudden external shocks. Traditional static or deterministic models often overlook the complexity and volatility of real-time decision making in such environments. To address this issue, we introduce a stochastic differential equation to capture uncertainty in the decision-making process. Specifically, inspired by the classical Nerlove–Arrow goodwill model [32] and its stochastic extensions [24,26,27,28], we describe A ( t ) as a stochastic process, i.e.,
d A ( t ) = α E G ( t ) + β E S ( t ) ( δ + λ ) A ( t ) d t + ρ A ( t ) d W ( t ) , A ( 0 ) = A 0 > 0 ,
where α , β > 0 denote the marginal effectiveness of governmental and societal response efforts, respectively. More intuitively, α measures how efficiently governmental actions are converted into available resources. Such actions include emergency procurement and the release of national stockpiles. In contrast, β reflects the contribution efficiency of societal forces, which may involve public donations, volunteer logistics support, and mobilization of the private sector. The parameter δ > 0 is the natural decay rate of emergency supplies, capturing loss from consumption, spoilage, or expiration. λ > 0 represents the additional depletion rate caused by infrastructure damage such as blocked transportation or destroyed storage facilities. The term W ( t ) represents a standard Brownian motion capturing random environmental disturbances, such as sudden policy changes, extreme weather events, or secondary disasters. And, ρ > 0 quantifies the intensity of these stochastic shocks. A larger value of ρ indicates greater volatility in resource availability.
Specifically, the diffusion term ρ A ( t ) d W ( t ) ensures the non-negativity of A ( t ) , thereby avoiding unrealistic scenarios such as negative emergency supplies. Moreover, it captures the state-dependent nature of uncertainty: when resources are abundant, the complexity of allocation and management increases, leading to higher volatility. Conversely, as A ( t ) 0 , the diffusion term diminishes, and without external input, the system may fall into prolonged stagnation. Such a nonlinear stochastic equation effectively integrates endogenous strategic behavior with exogenous environmental uncertainty and has been widely applied in related studies.
(4)
The willingness and ability of organizations to engage in collaboration are fundamentally shaped by their access to resources and operational competencies. Institutions with limited assets or minimal influence often exhibit lower levels of engagement in joint initiatives. Furthermore, the effectiveness of emergency responses is closely tied to both the adequacy of response measures and the availability of necessary emergency resources, i.e.,
Γ = μ E G + η E S + θ A ,
This linear additive form is chosen to capture the separable and cumulative impacts of each input factor and to facilitate closed-form analytical derivations within the HJB framework. Here, Γ represents the emergency response efficacy function, while μ and η denote the marginal effectiveness of governmental and societal intervention efforts, respectively. The parameter θ captures the incremental influence of resource accessibility.
(5)
Non-governmental groups primarily rely on government funding and donations from the public for their operational finances. The effectiveness of these organizations in responding to disasters influences their overall influence and the amount of donations. Additionally, the emergency response efforts of social organizations can enhance their reputation in the community. Hence, the reputation function D can be constructed as
D = ε E S + ω A ,
This formulation reflects the independent and complementary contributions of social effort and resources to the evolution of reputation and also aligns with existing works in cooperative decision making. Where ε , ω are the marginal impact coefficients of social organizations’ response efforts and resource availability.
For convenience, the above variables are summarized in Table 1.
Drawing upon the preceding analysis, the goals pursued by governmental bodies and social institutions can be defined as follows:
J G = 0 e r t π 1 E G + π G Γ 1 2 k G E G 2 d t , J S = 0 e r t π 2 D + π S Γ 1 2 k S E S 2 d t ,
where r is the discount rate, π 1 denotes the marginal impact coefficient of the government’s response effort on its credibility, and π 2 represents the indirect benefit of social organizations obtained by the reputation function.

3. Preliminary

In this section, we introduce the key theoretical foundations that support the modeling and solution of stochastic differential games. We begin with a summary of Kolmogorov’s extension theorem, which provides the foundation for constructing Brownian motion. This is followed by the definition of Itô processes and the presentation of Itô’s lemma, culminating in the derivation of the Hamilton–Jacobi–Bellman (HJB) equation, an important tool for solving infinite-horizon stochastic optimal control problems.

3.1. Stochastic Foundation

Lemma 1
(Kolmogorov’s extension theorem [33]). Suppose that for every finite subset { t 1 , . . . , t m } T , m N , there exists a probability measure { η t 1 , . . . , t m } on R n m satisfying the following conditions:
  • Consistency under permutations:
    η t π ( 1 ) , , t π ( m ) ( Z 1 × × Z m ) = η t 1 , , t m ( Z π 1 ( 1 ) × × Z π 1 ( m ) )
    for any permutation π of { 1 , 2 , , m } ;
  • Projective consistency:
    η t 1 , , t m ( Z 1 × × Z m ) = η t 1 , , t m + ι ( Z 1 × × Z m × R n × × R n )
    for all ι N .
Then there exists a probability space ( Ω , F , P ) and a family of random variables { X t } t T such that
P [ X t 1 Z 1 , , X t m Z m ] = η t 1 , , t m ( Z 1 × × Z m ) .
Definition 1
(Brownian motion). A stochastic process { B t } t 0 with transition density p ( t , x , y ) defined by
p ( t , x , y ) = ( 2 π t ) n / 2 exp | x y | 2 2 t
is called standard Brownian motion starting at x.
Definition 2
(Itô Process). Let B t be standard Brownian motion. A process χ t is an Itô process if
χ t = χ 0 + 0 t μ ( s ) d s + 0 t η ( s ) d B s ,
with μ and η satisfying appropriate integrability and adaptiveness conditions.
Lemma 2
(Itô’s formula [33]). Let ζ t be an Itô process satisfying
d ζ t = μ d t + η d B t ,
and let ψ ( t , s ) be twice continuously differentiable. Then, ϕ t = ψ ( t , ζ t ) is also an Itô process and satisfies
d ϕ t = ψ t ( t , ζ t ) d t + ψ s ( t , ζ t ) d ζ t + 1 2 2 ψ s 2 ( t , ζ t ) ( d ζ t ) 2 .
Here, the quadratic variation term ( d ζ t ) 2 is evaluated as η 2 d t due to the identity ( d B t ) 2 = d t , which accounts for the second-order effect of the stochastic component in ζ t and contributes to the second derivative term in the expansion.

3.2. Hamilton–Jacobi–Bellman Equation for the Stochastic Control Problem

In solving infinite-horizon stochastic optimal control problems, it is standard practice to omit the explicit time variable t when formulating the value function and deriving the Hamilton–Jacobi–Bellman (HJB) equation. This simplification is mathematically justified under the assumption that the system dynamics and objective functions are time-invariant, and that a constant discount rate r > 0 is applied. Under these conditions, the optimization problem becomes stationary, meaning that the optimal strategy and the associated value depend solely on the current state rather than the specific point in time. As a result, the value function is expressed as V ( x ) instead of V ( t , x ) , and the HJB equation simplifies from a partial differential equation to an ordinary differential equation, which significantly enhances analytical tractability while preserving the core stochastic dynamics.
We now consider a standard stochastic optimal control problem:
max u E 0 T f ( t , x , u ) d t + ϕ ( x ( T ) , T )
subject to
d x = g ( x , u ) d t + σ ( x , u ) d z , x ( 0 ) = x 0 ,
where f is the running payoff, ϕ is the terminal payoff function, and d z denotes a standard Wiener process. The functions g and σ denote the drift and diffusion terms, respectively.
Define the value function J ( t , x ) as the optimal expected reward starting from state x at time t:
J ( t , x ) = max u E t T f ( s , x ( s ) , u ( s ) ) d s + ϕ ( x ( T ) , T ) x ( t ) = x .
According to the dynamic programming principle, for a small time increment Δ t , we write
J ( t , x ) max u E f ( t , x , u ) Δ t + J ( t + Δ t , x + Δ x ) .
where Δ x = g ( x , u ) Δ t + σ ( x , u ) Δ z follows from SDE.
Using Taylor expansion around ( t , x ) :
J ( t + Δ t , x + Δ x ) J + J t Δ t + J x Δ x + 1 2 J x x ( Δ x ) 2 .
Substituting the SDE expression for Δ x , and noting that E [ Δ z ] = 0 , E [ ( Δ z ) 2 ] = Δ t , we obtain
E [ Δ x ] = g ( x , u ) Δ t , E [ ( Δ x ) 2 ] = σ 2 ( x , u ) Δ t .
Taking expectation and simplifying:
J ( t , x ) = max u f ( t , x , u ) Δ t + J + J t Δ t + J x g ( x , u ) Δ t + 1 2 J x x σ 2 ( x , u ) Δ t .
Subtract J ( t , x ) from both sides and divide by Δ t :
0 = max u f ( t , x , u ) + J t + J x g ( x , u ) + 1 2 J x x σ 2 ( x , u ) .
This is the dynamic programming equation. Then consider the infinite-horizon case with discount rate r. Suppose J ( t , x ) = e r t V ( x ) , and substitute into the dynamic programming equation yields [34]:
r V ( x ) = max u f ( x , u ) + V ( x ) g ( x , u ) + 1 2 σ 2 ( x , u ) V ( x ) .
Equation (5) is the HJB equation for the infinite-horizon stochastic control problem. It characterizes the necessary condition that the value function must satisfy in optimal control under uncertainty.

4. Centralized Decision Making for Collusive Emergency Response

In this scenario, the government and social organizations are treated as collusive participants sharing common goals in emergency management. They collaboratively determine the optimal levels of emergency response E G and E S , aiming to maximize the total profit of the disaster relief system. For ease of reference, this collusive framework is designated as model “c”. Accordingly, the corresponding optimal control formulation is expressed as
max E G , E S J G S c ( E G , E S ) = 0 e r t { π 1 E G + π 2 ( ε E S + ω A ) + ( π G + π S ) ( μ E G + η E S ) + θ A 1 2 k G E G 2 1 2 k S E S d t
subject to
d A ( t ) = α E G ( t ) + β E S ( t ) ( δ + λ ) A ( t ) d t + ρ A ( t ) d W ( t ) , A ( 0 ) = A 0 > 0 .
Theorem 1.
The equilibrium results for the collusive emergency model are presented below.
(i) The optimal emergency response efforts are
E G c = α ω π 2 + θ ( π G + π S ) + ( δ + λ + r ) ( π 1 + μ ( π G + π S ) ) ( δ + λ + r ) k G , E S c = β ( ω π 2 + θ ( π G + π S ) ) + ( δ + λ + r ) ( ε π 2 + η ( π G + π S ) ) ( δ + λ + r ) k S .
(ii) The optimal emergency performance value for the disaster relief system is
V G S c = ω π 2 + θ ( π G + π S ) δ + λ + r A + ( χ 2 π 2 + χ 3 ( π G + π S ) ) 2 2 r ( δ + λ + r ) 2 k S + ( α ω π 2 + ( δ + λ + r ) π 1 + χ 1 ( π G + π S ) ) 2 2 r ( δ + λ + r ) 2 k G ,
where χ 1 = α θ + μ ( δ + λ + r ) , χ 2 = β ω + ε ( δ + λ + r ) , χ 3 = β θ + η ( δ + λ + r ) .
Proofs of this and subsequent results are given in the Appendix A.
The optimal emergency response efforts E G c , E S c increase with θ , which indicates that as emergency resource availability has a greater impact on disaster response performance, each party is more inclined to engage in disaster relief activities. Moreover, E G c and E S c are positively related to α , β , which suggests that as the impact of the emergency response effort on emergency resource availability increases, greater efforts would be made.
Proposition 1.
The expectation and variance of emergency resource availability are
E [ A c ( t ) ] = e ( δ + λ ) t A 0 Δ c δ + λ e ( δ + λ ) t + Δ c δ + λ , V a r [ A c ( t ) ] = ρ 2 δ + λ A 0 e ( δ + λ ) t e 2 ( δ + λ ) t + Δ c ρ 2 2 ( δ + λ ) 2 1 2 e ( δ + λ ) t + e 2 ( δ + λ ) t ,
where Δ c = α E G c + β E S c . A straightforward computation indicates
l i m t E [ A c ( t ) ] = Δ c δ + λ , l i m t V a r [ A c ( t ) ] = Δ c ρ 2 2 ( δ + λ ) 2 .
Remark 1.
The expectation of emergency resource availability has the following relationship:
E [ A c ( t ) ] t < 0 when δ + λ > Δ c A 0 ,
E [ A c ( t ) ] t > 0 when δ + λ < Δ c A 0 .
Remark 2.
The variance of emergency resource availability has the following relationship:
V a r [ A c ( t ) ] t < 0 w h e n t < ln [ 2 A 0 ( δ + λ ) Δ c A 0 ( δ + λ ) Δ c ] / ( δ + λ ) ,
V a r [ A c ( t ) ] t > 0 w h e n t > ln [ 2 A 0 ( δ + λ ) Δ c A 0 ( δ + λ ) Δ c ] / ( δ + λ ) .
First, drawing upon Proposition 1, increased contributions from governmental bodies and civil society are associated with a higher anticipated level of emergency resources available within the disaster response system. However, both the upper bounds of the expected value and variance of this resource availability diminish as the decay parameter δ and the marginal influence factor λ of infrastructure impairment grow. In contrast, an escalation in stochastic fluctuations leads to a rise in the limiting variance. Second, as indicated in Remarks 1 and 2, significant variability induced by random disturbances can lead to a reduction in accessible emergency supplies when the condition δ + λ > Δ c A 0 holds and the time parameter t exceeds ln [ 2 A 0 ( δ + λ ) Δ c A 0 ( δ + λ ) Δ c ] / ( δ + λ ) . Therefore, when facing such conditions, more attention should be paid to maintaining emergency supplies.

5. Decentralized Emergency Response Without a Cost-Sharing Contract

In this scenario, the government and social organizations function autonomously. Each player independently seeks to optimize its respective profits and determines its own level of emergency response. Additionally, no financial support is extended from the government to social organizations, implying that X ( t ) = 0 . For convenience, we refer to this scenario as “n”. Therefore, the corresponding optimal control issues of the disaster response system are
max E G J G n ( E G ) = 0 e r t π 1 E G + π G ( μ E G + η E S ) + θ A 1 2 k G E G 2 d t max E S J S n ( E S ) = 0 e r t π 2 ( ε E S + ω A ) + π S ( μ E G + η E S ) + θ A 1 2 k S E S 2 d t
subject to
d A ( t ) = α E G ( t ) + β E S ( t ) ( δ + λ ) A ( t ) d t + ρ A ( t ) d W ( t ) , A ( 0 ) = A 0 > 0 .
Theorem 2.
The equilibrium results for the decentralized emergency model without a cost-sharing contract are presented below.
(i) The optimal emergency response efforts are
E G n = α θ π G + ( δ + λ + r ) π 1 + μ π G ( δ + λ + r ) k G , E S n = β ( ω π 2 + θ π S ) + ( δ + λ + r ) ε π 2 + η π S ( δ + λ + r ) k S .
(ii) The optimal emergency performance value for the government is
V G n = θ π G δ + λ + r A + ( χ 1 π G + ( δ + λ + r ) π 1 ) 2 2 r ( δ + λ + r ) 2 k G + 2 χ 3 π G ( χ 2 π 2 + χ 3 π S ) 2 r ( δ + λ + r ) 2 k S ;
The optimal emergency performance value for social organizations is
V S n = ω π 2 + θ π S δ + λ + r A + ( χ 2 π 2 + χ 3 π S ) 2 2 r ( δ + λ + r ) 2 k S + 2 ( χ 1 π G + ( δ + λ + r ) π 1 ) ( α ω π 2 + χ 1 π S ) 2 r ( δ + λ + r ) 2 k G ,
where χ 1 = α θ + μ ( δ + λ + r ) , χ 2 = β ω + ε ( δ + λ + r ) , χ 3 = β θ + η ( δ + λ + r ) .
In contrast to a centralized emergency strategy, the decentralized response bases its optimal level of effort purely on marginal returns. Moreover, the value of outcomes increases with greater access to emergency supplies. Furthermore, when the economy and society gradually recover from natural disasters ( t ), materials and commodities are no longer in shortage. However, in this state, the decay rate δ and discount rate ρ will be extremely high, which might result in
π 1 + μ π G k G α θ π G ( δ + λ + r ) k G
and
ε π 2 + η π S k S β ( ω π 2 + θ π S ) ( δ + λ + r ) k G .
Hence, at this point in time, the impact coefficients α , β do not affect the decision making of the government and social organizations. In short, both parties pay more attention to short-term economic benefits. On the contrary, when the economy and society are being greatly influenced by natural disasters and suffering from a shortage of supplies ( t t 0 ), ρ , δ are very small, which might result in
π 1 + μ π G k G α θ π G ( δ + λ + r ) k G
and
ε π 2 + η π S k S β ( ω π 2 + θ π S ) ( δ + λ + r ) k G ,
where the impact coefficients α , β significantly affect the decision making of the government and social organizations. It is worth noting that the above result precisely matches the analysis mentioned at the end of Section 4.
Proposition 2.
The expectation and variance of emergency resource availability are
E [ A n ( t ) ] = e ( δ + λ ) t A 0 Δ n δ + λ e ( δ + λ ) t + Δ n δ + λ , V a r [ A n ( t ) ] = ρ 2 δ + λ A 0 e ( δ + λ ) t e 2 ( δ + λ ) t + Δ n ρ 2 2 ( δ + λ ) 2 1 2 e ( δ + λ ) t + e 2 ( δ + λ ) t ,
where Δ n = α E G n + β E S n . Straightforward computation indicates
l i m t E [ A n ( t ) ] = Δ n δ + λ , l i m t V a r [ A n ( t ) ] = Δ n ρ 2 2 ( δ + λ ) 2 .

6. Decentralized Emergency Response with a Cost-Sharing Contract

In this scenario, we consider a decentralized emergency response system with a cost-sharing contract. The government determines both its own level of intervention and the proportion of financial support ( 0 < X ( t ) < 1 ) provided to social organizations, aiming to encourage broader participation in relief efforts. Social organizations choose their respective response intensities based on the available support. Similar to previous settings, both the government and social actors independently seek to optimize their individual objectives. For clarity, this setting is referred to as model “s”. Thus, the optimal control equations of the disaster relief system are
max E G J G s ( E G ) = 0 e r t π 1 E G + π G ( μ E G + η E S ) + θ A 1 2 k G E G 2 1 2 X k S E S 2 d t max E S J S s ( E S ) = 0 e r t π 2 ( ε E S + ω A ) + π S ( μ E G + η E S ) + θ A 1 2 ( 1 X ) k S E S 2 d t
subject to
d A ( t )   =   ( α E G ( t )   +   β E S ( t )     ( δ   +   λ ) A ( t ) ) d t   +   ρ A ( t ) d W ( t ) , A ( 0 )   =   A 0 > 0
Theorem 3.
The equilibrium results for the decentralized emergency model are presented below.
(i) The optimal emergency response efforts are
E G s = α θ π G + ( δ + λ + r ) π 1 + μ π G ( δ + λ + r ) k G , E S s = β ( ω π 2 + θ π S ) + ( δ + λ + r ) ε π 2 + η π S ( δ + λ + r ) ( 1 X ) k S .
(ii) The optimal emergency performance value for the government is
V G n = θ π G δ + λ + r A + ( χ 1 π G + ( δ + λ + r ) π 1 ) 2 2 r ( δ + λ + r ) 2 k G + ( χ 2 π 2 + χ 3 ( 2 π G + π S ) ) 2 8 r ( δ + λ + r ) 2 k S ;
The optimal emergency performance value for social organizations is
V S n = ω π 2 + θ π S δ + λ + r A + ( χ 1 π G + ( δ + λ + r ) π 1 ) ( α ω π 2 + χ 1 π S ) r ( δ + λ + r ) 2 k G + ( χ 2 π 2 + c π S ) ( χ 2 π 2 + χ 3 ( 2 π G + π S ) ) 4 r ( δ + λ + r ) 2 k S ,
where  χ 1 = α θ + μ ( δ + λ + r ) , χ 2 = β ω + ε ( δ + λ + r ) , χ 3 = β θ + η ( δ + λ + r ) .
Unlike the decentralized emergency response model without a cost-sharing contract, the government’s optimal level of effort remains constant, indicating that the introduction of a cost-sharing mechanism does not influence its decision making.
Proposition 3.
The expectation and variance of emergency resource availability are
E [ A s ( t ) ] = e ( δ + λ ) t A 0 Δ s δ + λ e ( δ + λ ) t + Δ s δ + λ , V a r [ A s ( t ) ] = ρ 2 δ + λ A 0 e ( δ + λ ) t e 2 ( δ + λ ) t + Δ s ρ 2 2 ( δ + λ ) 2 1 2 e ( δ + λ ) t + e 2 ( δ + λ ) t ,
where Δ s = α E G s + β E S s . A straightforward computation indicates
l i m t E [ A s ( t ) ] = Δ s δ + λ , l i m t V a r [ A s ( t ) ] = Δ s ρ 2 2 ( δ + λ ) 2 .

7. Comparative Analysis of Equilibrium Results

The previous section examined three distinct disaster response scenarios: a collusive model, a decentralized model without cost sharing, and a decentralized model with a cost-sharing mechanism. For each scenario, we determined the corresponding optimal emergency response efforts, performance outcomes, and expectations and variances of emergency resource availability. Next, we will compare the equilibrium results.
Corollary 1.
Comparing the optimal emergency response efforts, we have
E G n = E G s < E G c , E S n < E S s < E S c
under the assumption
2 χ 3 π G > χ 2 π 2 + χ 3 π S
where χ 1 = α θ + μ ( δ + λ + r ) , χ 2 = β ω + ε ( δ + λ + r ) , χ 3 = β θ + η ( δ + λ + r ) .
Under the decentralized emergency response models—without and with a cost-sharing contract (denoted as models “n” and “s”, respectively)—the government’s optimal response effort remains unchanged. However, the optimal effort from social organizations is higher in the cost-sharing case (model “s”) than in the non-cost-sharing case (model “n”). In both cases, the centralized emergency response model achieves the highest overall effort levels from all parties involved. Notably, while the government’s cost-sharing behavior does not alter its own optimal effort, it significantly enhances the social organizations’ involvement, as E S s is directly influenced by the cost-sharing rate.
Corollary 2.
Comparing the optimal emergency performance values, we obtain
V G n < V G s , V S n < V S s
under the assumption
2 χ 3 π G > χ 2 π 2 + χ 3 π S
where χ 1 = α θ + μ ( δ + λ + r ) , χ 2 = β ω + ε ( δ + λ + r ) , χ 3 = β θ + η ( δ + λ + r ) .
Compared with the decentralized emergency response without a cost-sharing contract, the version with a cost-sharing contract yields a greater total benefit to both the government and social organizations. This arrangement enables a Pareto improvement and does not require any external enforcement. The increased total value of the disaster relief system is evident from the inequality V G n + V S n < V G s + V S s . This result confirms that a properly designed cost-sharing mechanism serves as a powerful incentive for enhancing the overall system performance.
Corollary 3.
Comparing the expectation and variance of emergency resource availability, we have
l i m t E [ A c ( t ) ] > l i m t E [ A s ( t ) ] > l i m t E [ A n ( t ) ] , l i m t V a r [ A c ( t ) ] > l i m t V a r [ A s ( t ) ] > l i m t V a r [ A n ( t ) ] .
Among the three scenarios, the centralized emergency response model leads to the highest expected emergency resource levels, albeit with the greatest uncertainty. In contrast, the decentralized model with a cost-sharing contract achieves better outcomes than its counterpart without cost sharing, though it still involves greater variability. These findings imply that a higher emergency performance often comes at the cost of increased risk exposure. Thus, the choice of governance mechanism should align with a government’s risk preferences: a risk-tolerant government may favor centralized coordination, a risk-averse one may prefer decentralized autonomy without cost sharing, while those aiming to balance risk and effectiveness may find cost-sharing-based decentralization most appropriate.
The main comparative results are summarized in Table 2.

8. Numerical Simulations

To evaluate the performance of the proposed emergency coordination models under realistic scenarios, we construct a numerical case study and calibrate the model parameters using publicly available data from the 2008 Wenchuan Earthquake in Sichuan Province, China. The earthquake, which occurred on 12 May and registered a magnitude of 8.0, resulted in over 69,000 casualties and economic losses exceeding CNY 845 billion. Emergency tents, serving as the primary relief resource during the initial 3–5 days, are used as the main object for resource modeling in this study.
Each standard emergency tent covers 12 square meters, costs approximately CNY 100, and accommodates eight individuals. Based on the number of displaced persons (1.48 million), the estimated maximum potential demand for tents is a = 0.00185 (in 10 8 units). To reflect the sensitivity of demand to price changes, we set the demand elasticity parameter as b = 0.000825 (in 10 8 tents per CNY). Initial resource availability is set at A 0 = 0.254 (in 10 8 units), and the natural depletion rate δ = 0.2 represents losses due to decay during transportation and storage.
The government’s and social organizations’ response efforts are denoted by E G and E S , respectively. Their cost coefficients are set as k G = k S = 0.5 , measured in CNY per squared effort unit. The marginal impact parameters of emergency responses are μ = 0.7 for government and η = 0.3 for social organizations, reflecting differences in organizational capability. Additionally, α = 0.4 and β = 0.6 represent their respective impact intensities on emergency supply reinforcement.
The credibility enhancement due to governmental response is parameterized by π 1 = 0.6 , while social organizations gain reputation with marginal profit π 2 = 0.4 . The diffusion coefficient ρ = 0.1 captures environmental uncertainty, modeled through Brownian motion W ( t ) . Infrastructure impairment is characterized by λ = 0.3 , and the discount rate r = 0.2 accounts for time preference. Finally, we adopt ε = 0.4 and ω = 0.3 to reflect the marginal social profits from resource availability and social engagement. All parameter values are calibrated using publicly available data from official post-disaster reports, the academic literature, and statistical yearbooks related to the 2008 Wenchuan Earthquake, ensuring that the numerical simulations are grounded in an actual large-scale disaster scenario.
All simulations are performed using both the Euler and Milstein methods for solving the associated stochastic differential equations, assuming continuous dynamics and an initial condition of A ( 0 ) = A 0 . The Euler method is widely used due to its simplicity, while the Milstein method offers improved accuracy by incorporating derivative terms of the diffusion coefficient. According to the theoretical results proposed by Kloeden and Platen, the Milstein scheme achieves a strong order of convergence of 1.0 when the diffusion term is sufficiently smooth, compared to 0.5 for the Euler scheme [35]. In our model, the diffusion term contains a square root structure, which satisfies the smoothness requirement in the domain A ( t ) > 0 . Hence, using the Milstein method is theoretically justified.
The evolution paths of emergency resource availability are plotted using the Euler and Milstein methods. As illustrated in Figure 1, the emergency resource availability in all three scenarios increases over time and ultimately stabilizes. Among them, the cooperative approach yields the highest level of resource availability, while the decentralized emergency response without a cost-sharing contract results in the lowest. The outcome under the decentralized emergency response with a cost-sharing contract lies between the two aforementioned cases.
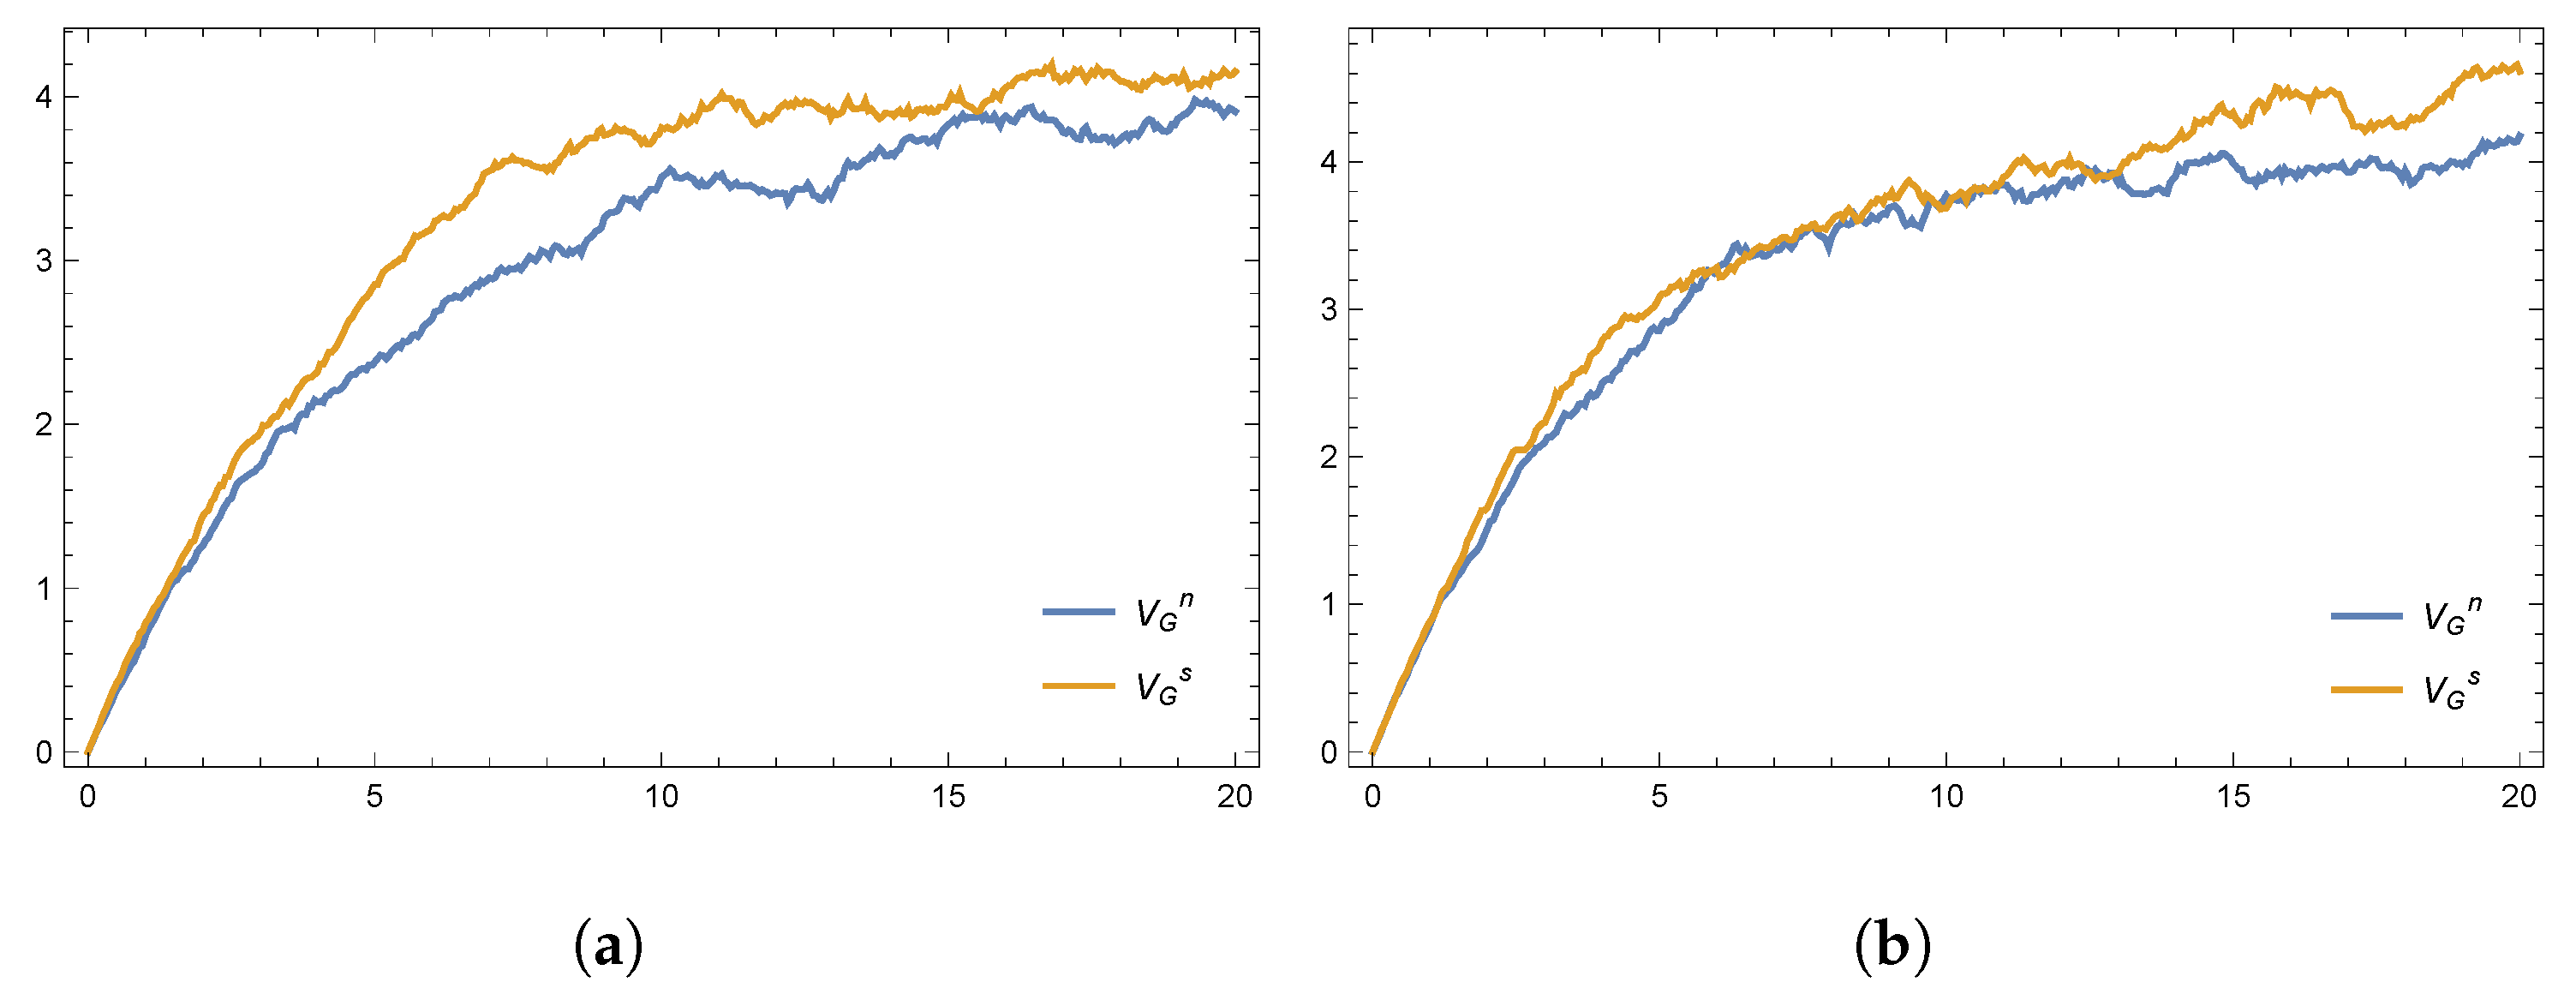
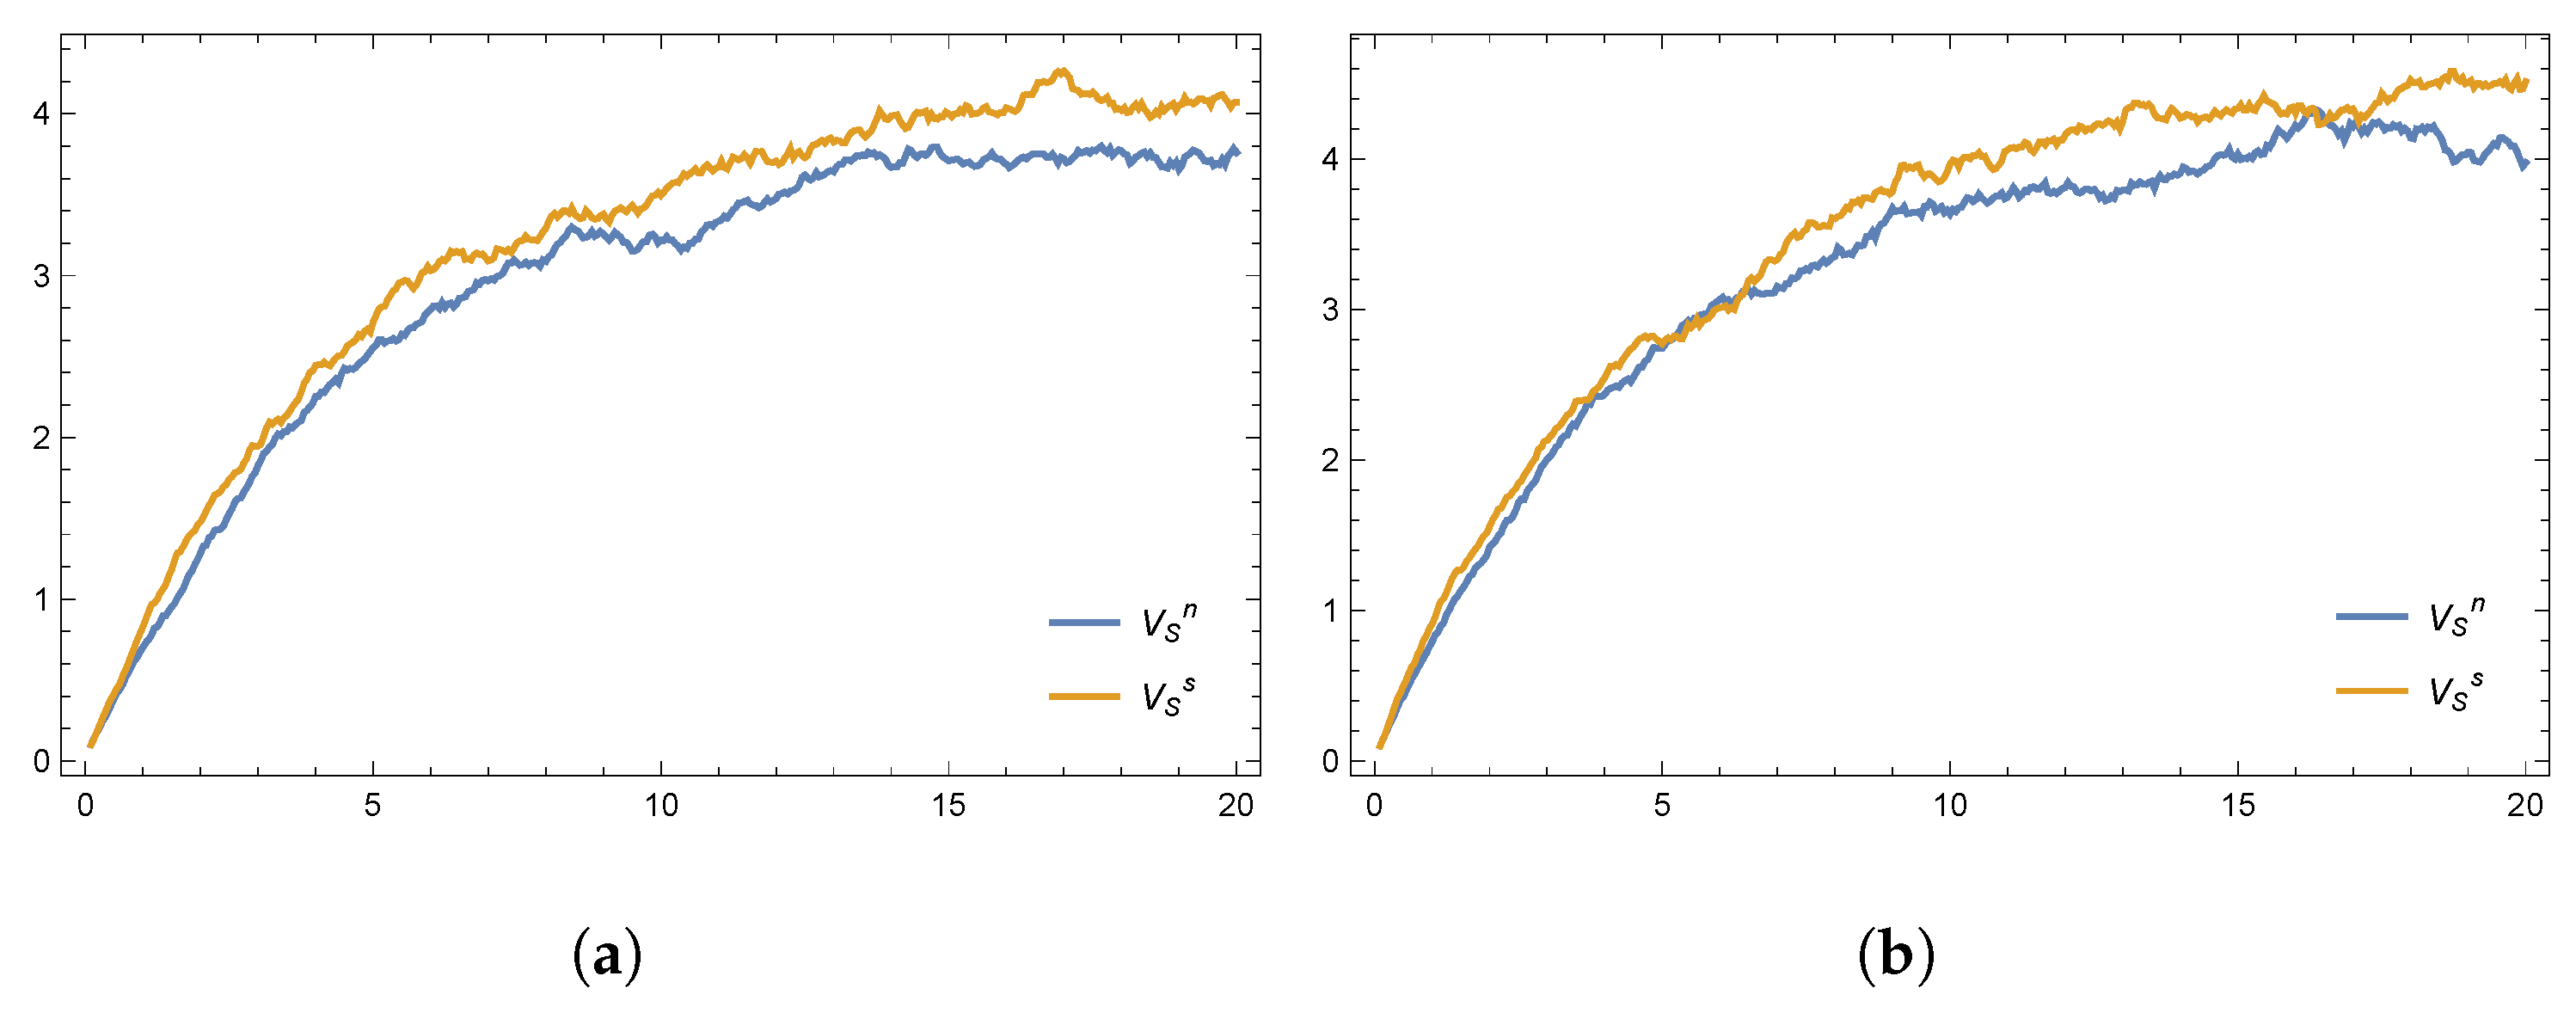
The results in Figure 2 and Figure 3 compare the respective values (i.e., profits) of the government and social organizations under the two decentralized emergency response frameworks. Clearly, the implementation of a cost-sharing contract leads to a Pareto improvement relative to the case without such a contract.
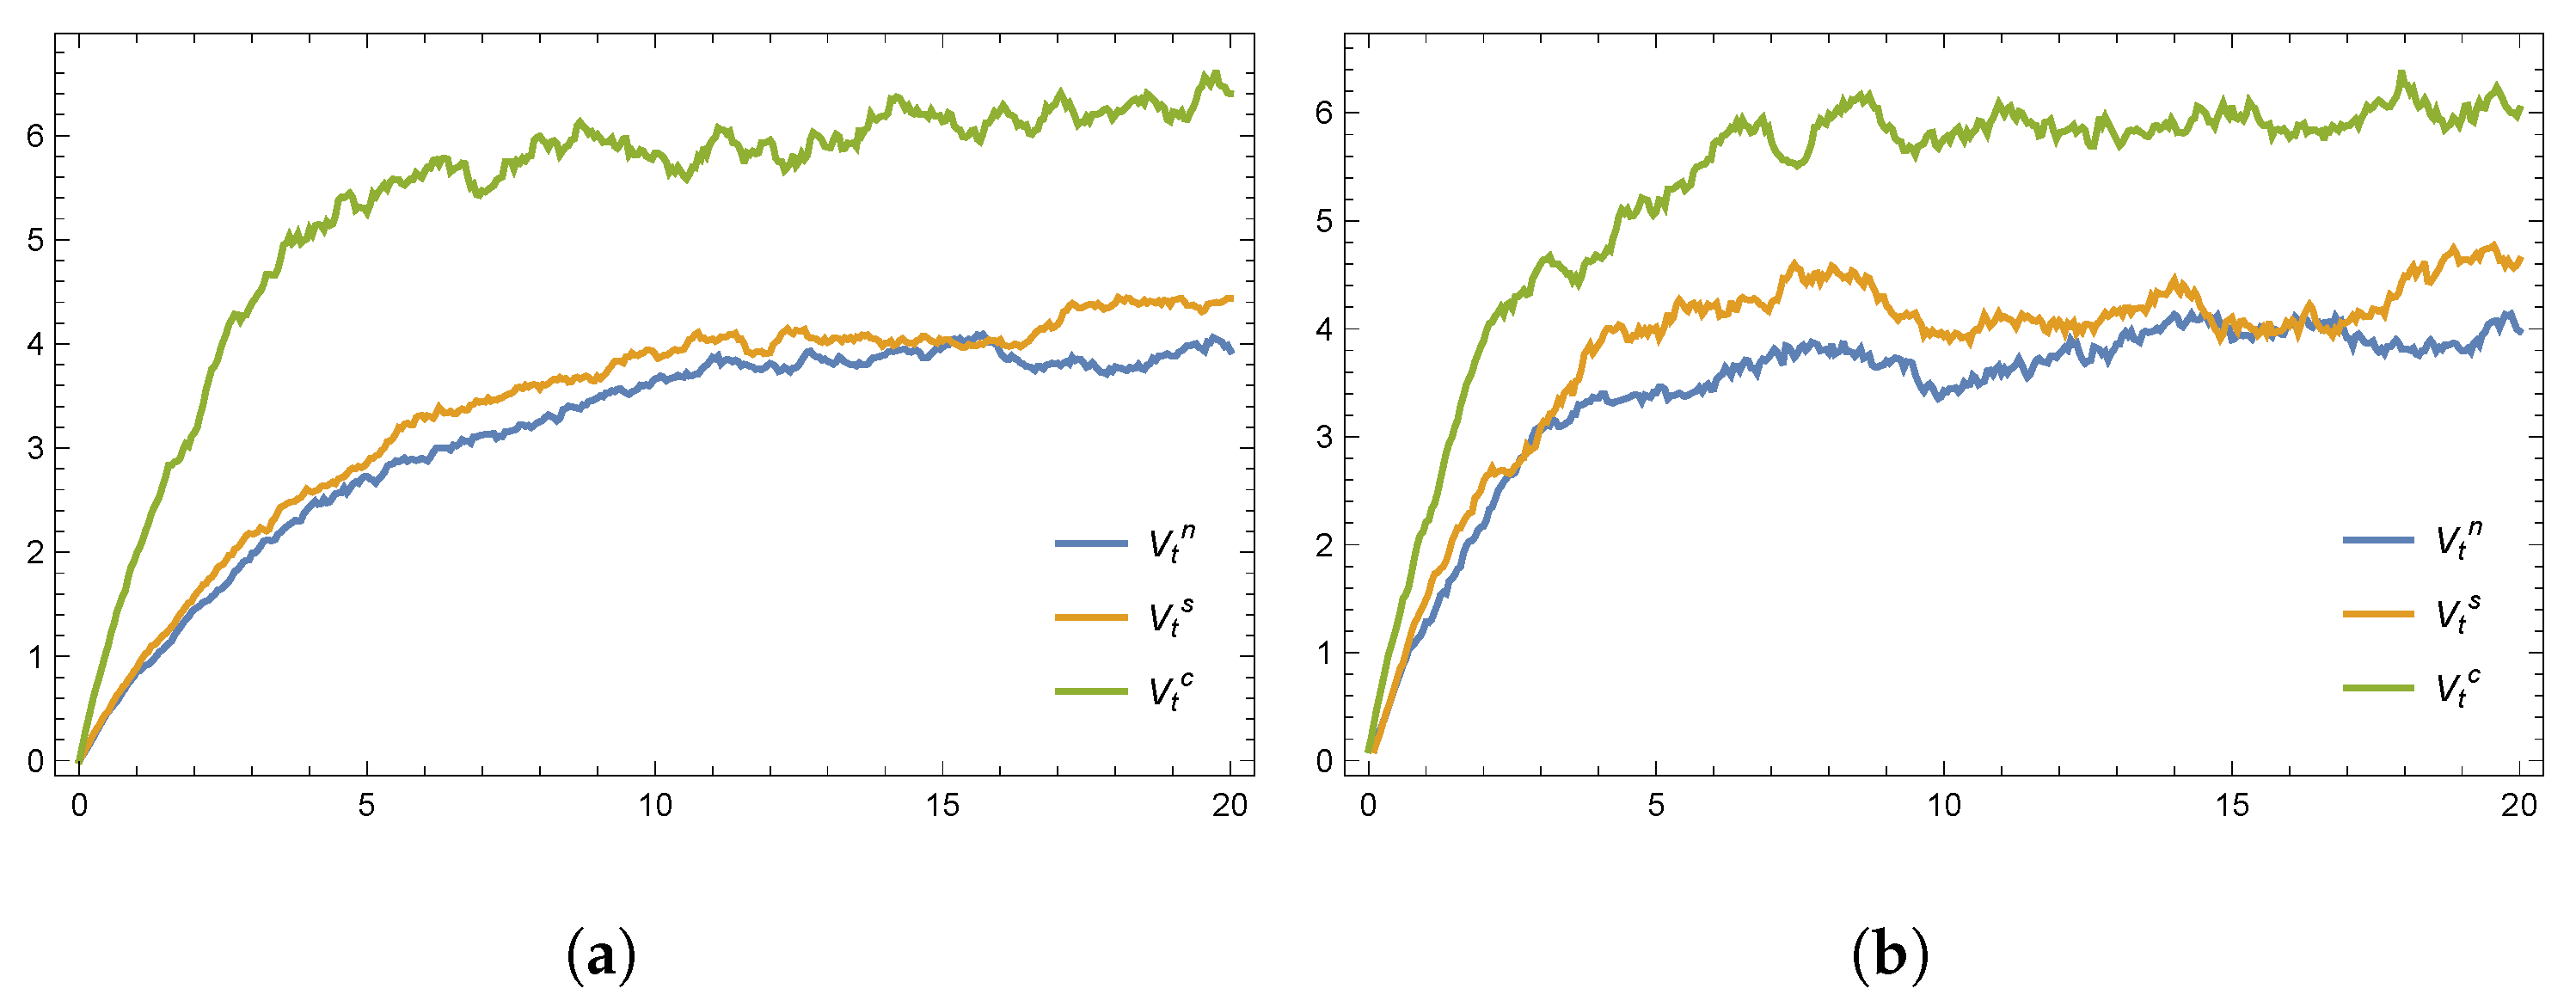
Figure 4 presents the total value generated by the disaster relief system under the three response strategies. The cooperative model delivers the greatest overall benefit, significantly surpassing the results of both decentralized approaches. Notably, the cooperative framework displays a sharp initial increase in total value, whereas the decentralized strategies exhibit more gradual improvements. This highlights the efficiency of centralized decision making. However, due to benefit allocation challenges and the presence of irrational agents, implementing cooperative models in practice remains difficult. Nevertheless, the decentralized emergency response with a cost-sharing contract achieves higher system-wide profits and resource availability than the fully independent counterpart, offering a balanced approach for practical applications.
For convenience, the main results from Figure 1, Figure 2, Figure 3 and Figure 4 are summarized in Table 3.
Figure 5 illustrates the effects of the two key parameters, ρ and λ , on the optimal emergency response efforts of each participant. Overall, as the parameter values increase, the optimal efforts exhibit a pattern of rapid decline followed by gradual stabilization. Regardless of parameter values, the efforts of all participants remain positive. Notably, the optimal strategy of social organizations changes with different parameter values: when ρ < 0.14 , social organizations exert the highest effort under the centralized decision-making model, whereas for ρ > 0.14 , they prefer the decentralized decision-making model with cost sharing. Similarly, variations in λ also induce a shift in the optimal strategy of social organizations from centralized to decentralized decision making.
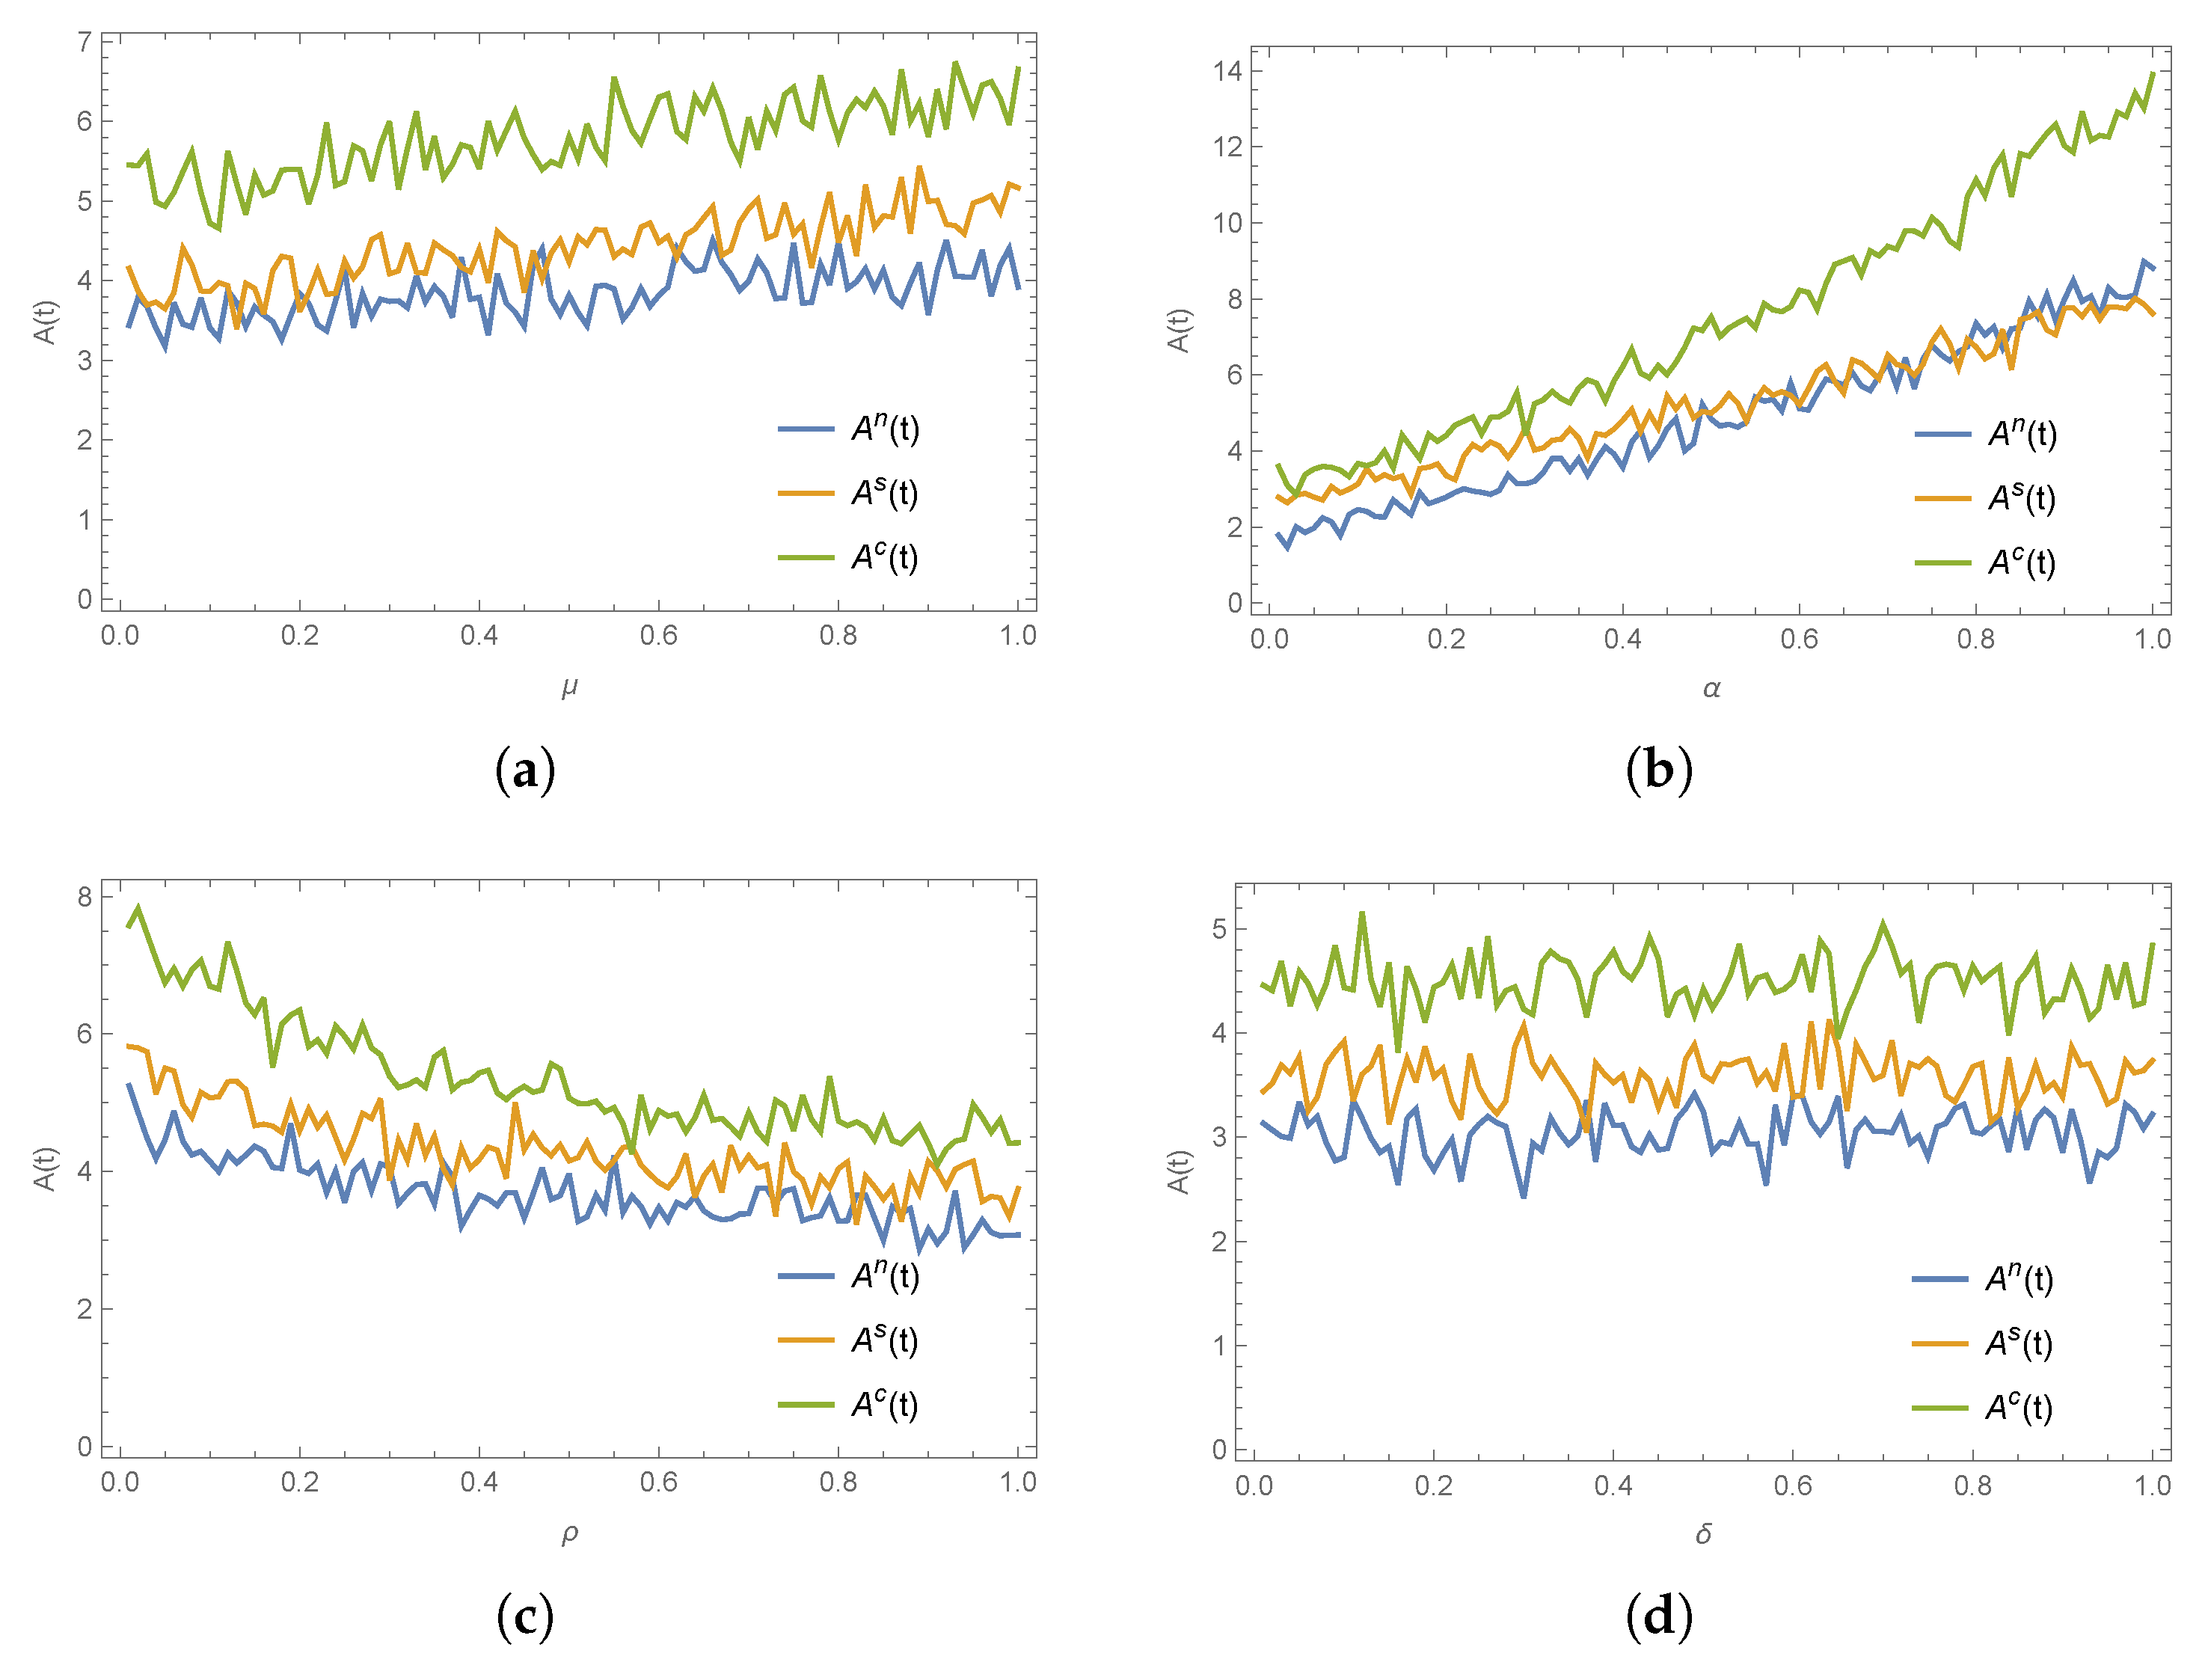
Furthermore, the effects of several key parameters on emergency resource availability are depicted in Figure 6. It can be seen that an increase in the marginal impact of E G , E S on Γ , A leads to a rise in A ( t ) , and due to the fact that α directly influences the trajectory of A ( t ) in Equation (1), the magnitude of this change is more pronounced. In contrast, an increase in the stochastic disturbance coefficient ρ causes the level of A ( t ) to show a decreasing trend under all three decision-making scenarios. Changes in the natural decay coefficient δ , however, have no obvious effect on A ( t ) , suggesting that under the current model parameter settings, the role of natural decay in affecting emergency resource availability is relatively weak.
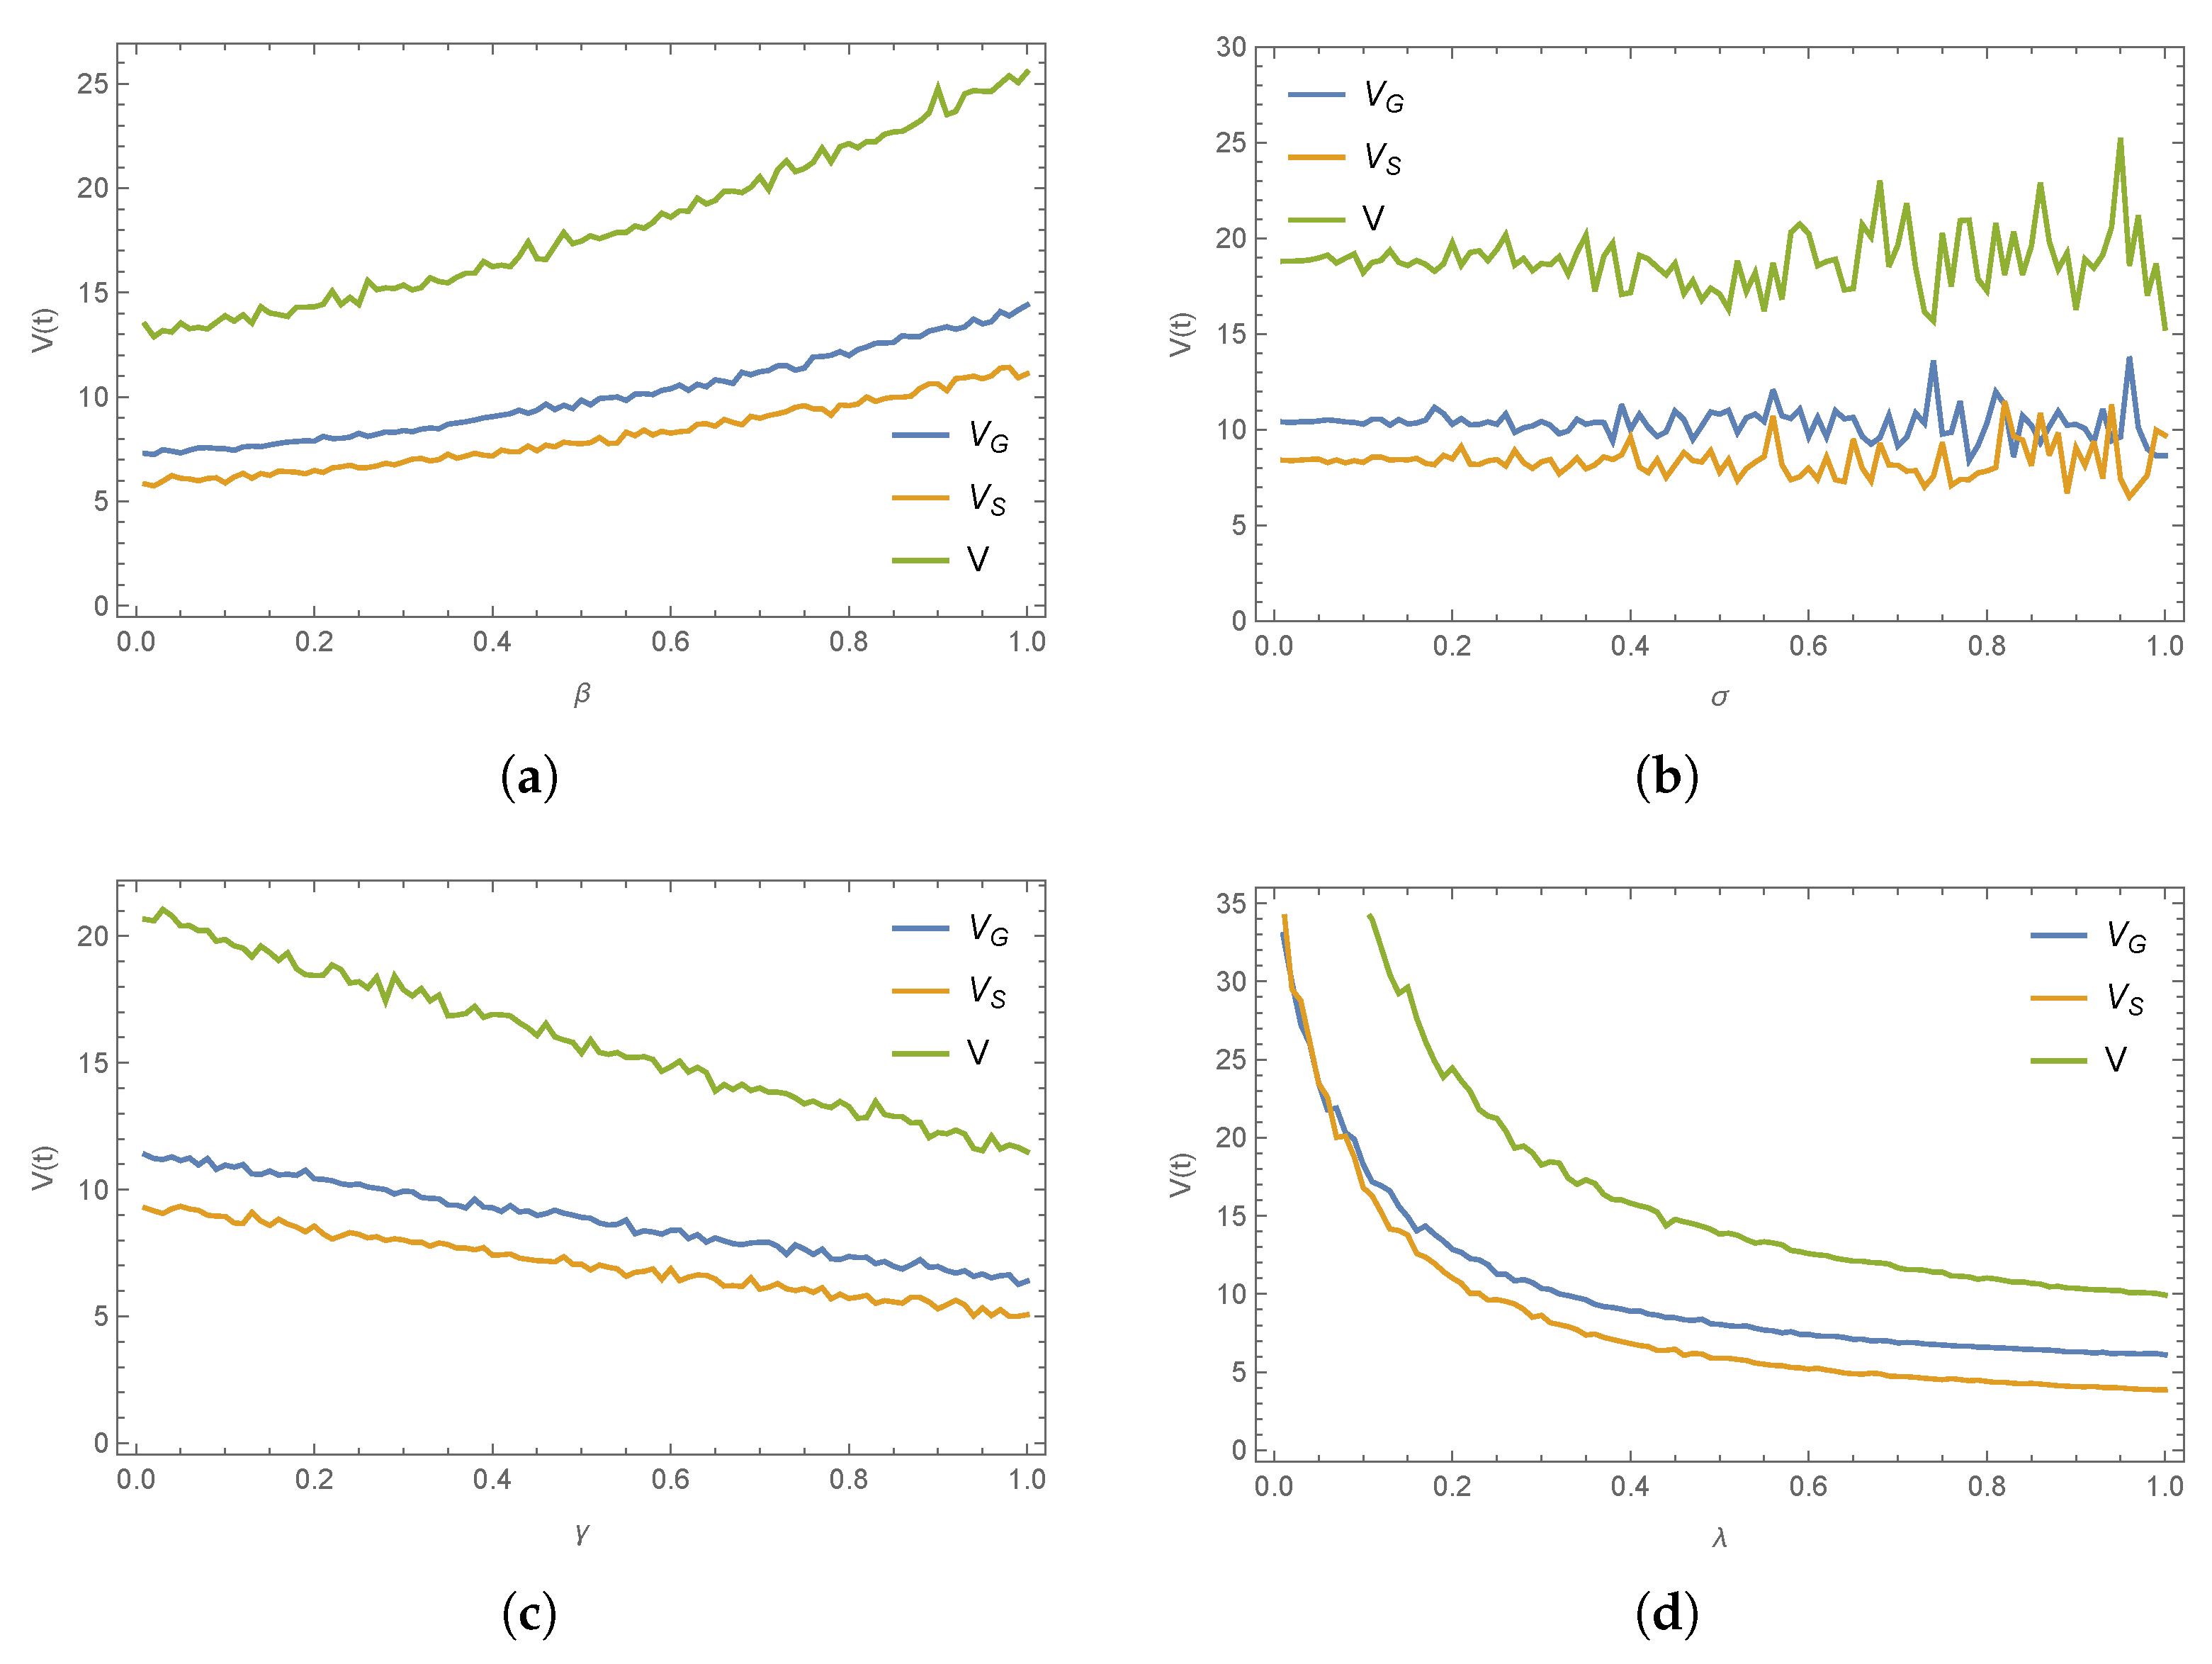
Under the decentralized model without a cost-sharing contract, the optimal emergency performance value of each participant exhibits considerable sensitivity to key parameter changes. As shown in Figure 7, an increase in β leads to a significant and approximately linear growth in the V for all participants. In contrast, as σ increases, the values fluctuate around a relatively stable level, indicating that the intensity of stochastic disturbances has a limited impact on the overall level. The parameter γ shows a clear linear negative correlation with the V. Furthermore, an increase in λ results in a rapid initial decline in the V, followed by a plateau, suggesting that its marginal effect diminishes at higher levels.
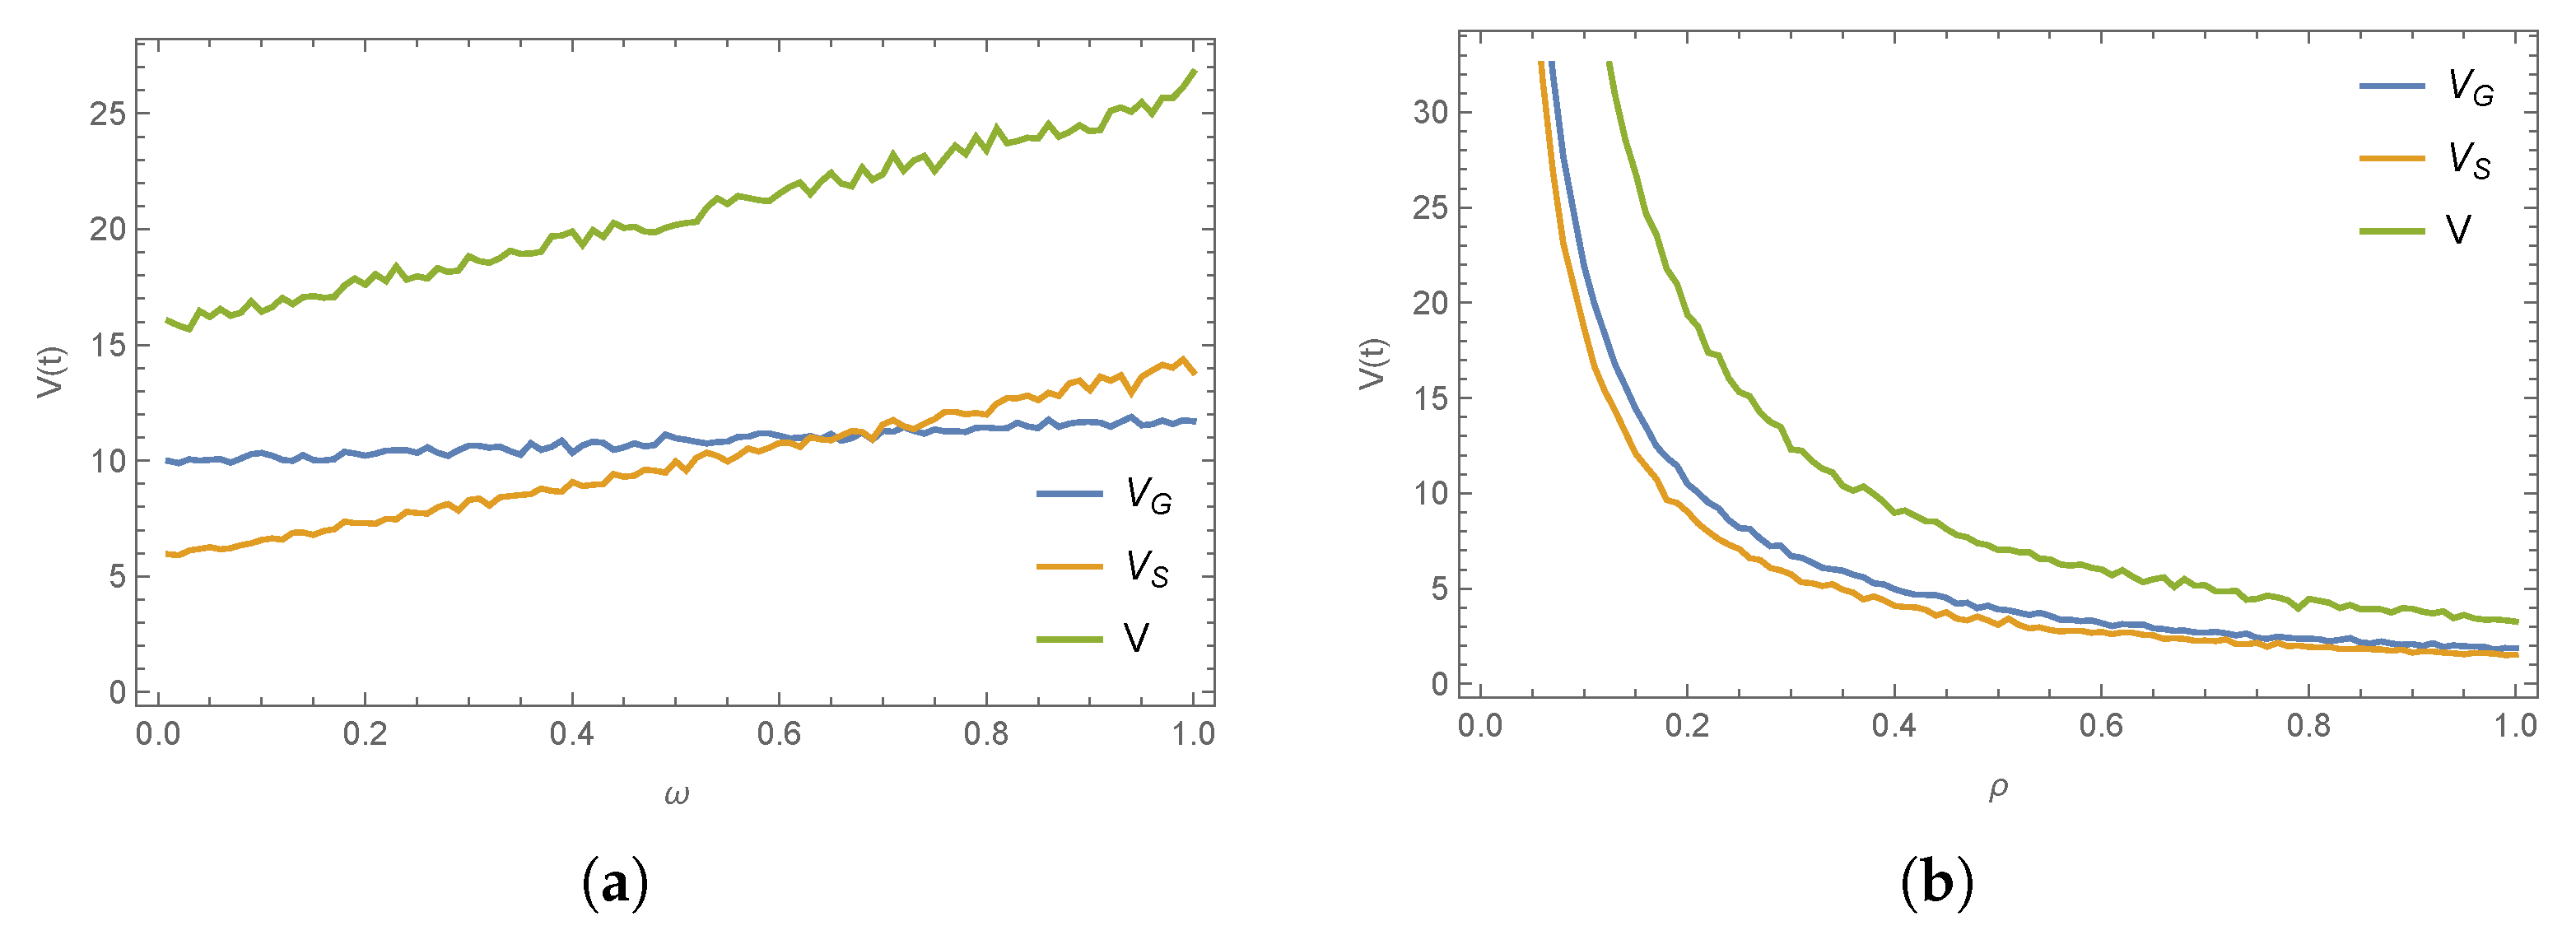
Under the decentralized emergency response with a cost-sharing contract scenario, the impact of key parameters on each participant’s optimal emergency performance value is almost identical to that observed under the scenario without a cost-sharing mechanism. Therefore, only the effects of ω and ρ are presented here. Among them, ω has almost no impact on the government’s optimal emergency performance value (Figure 8).
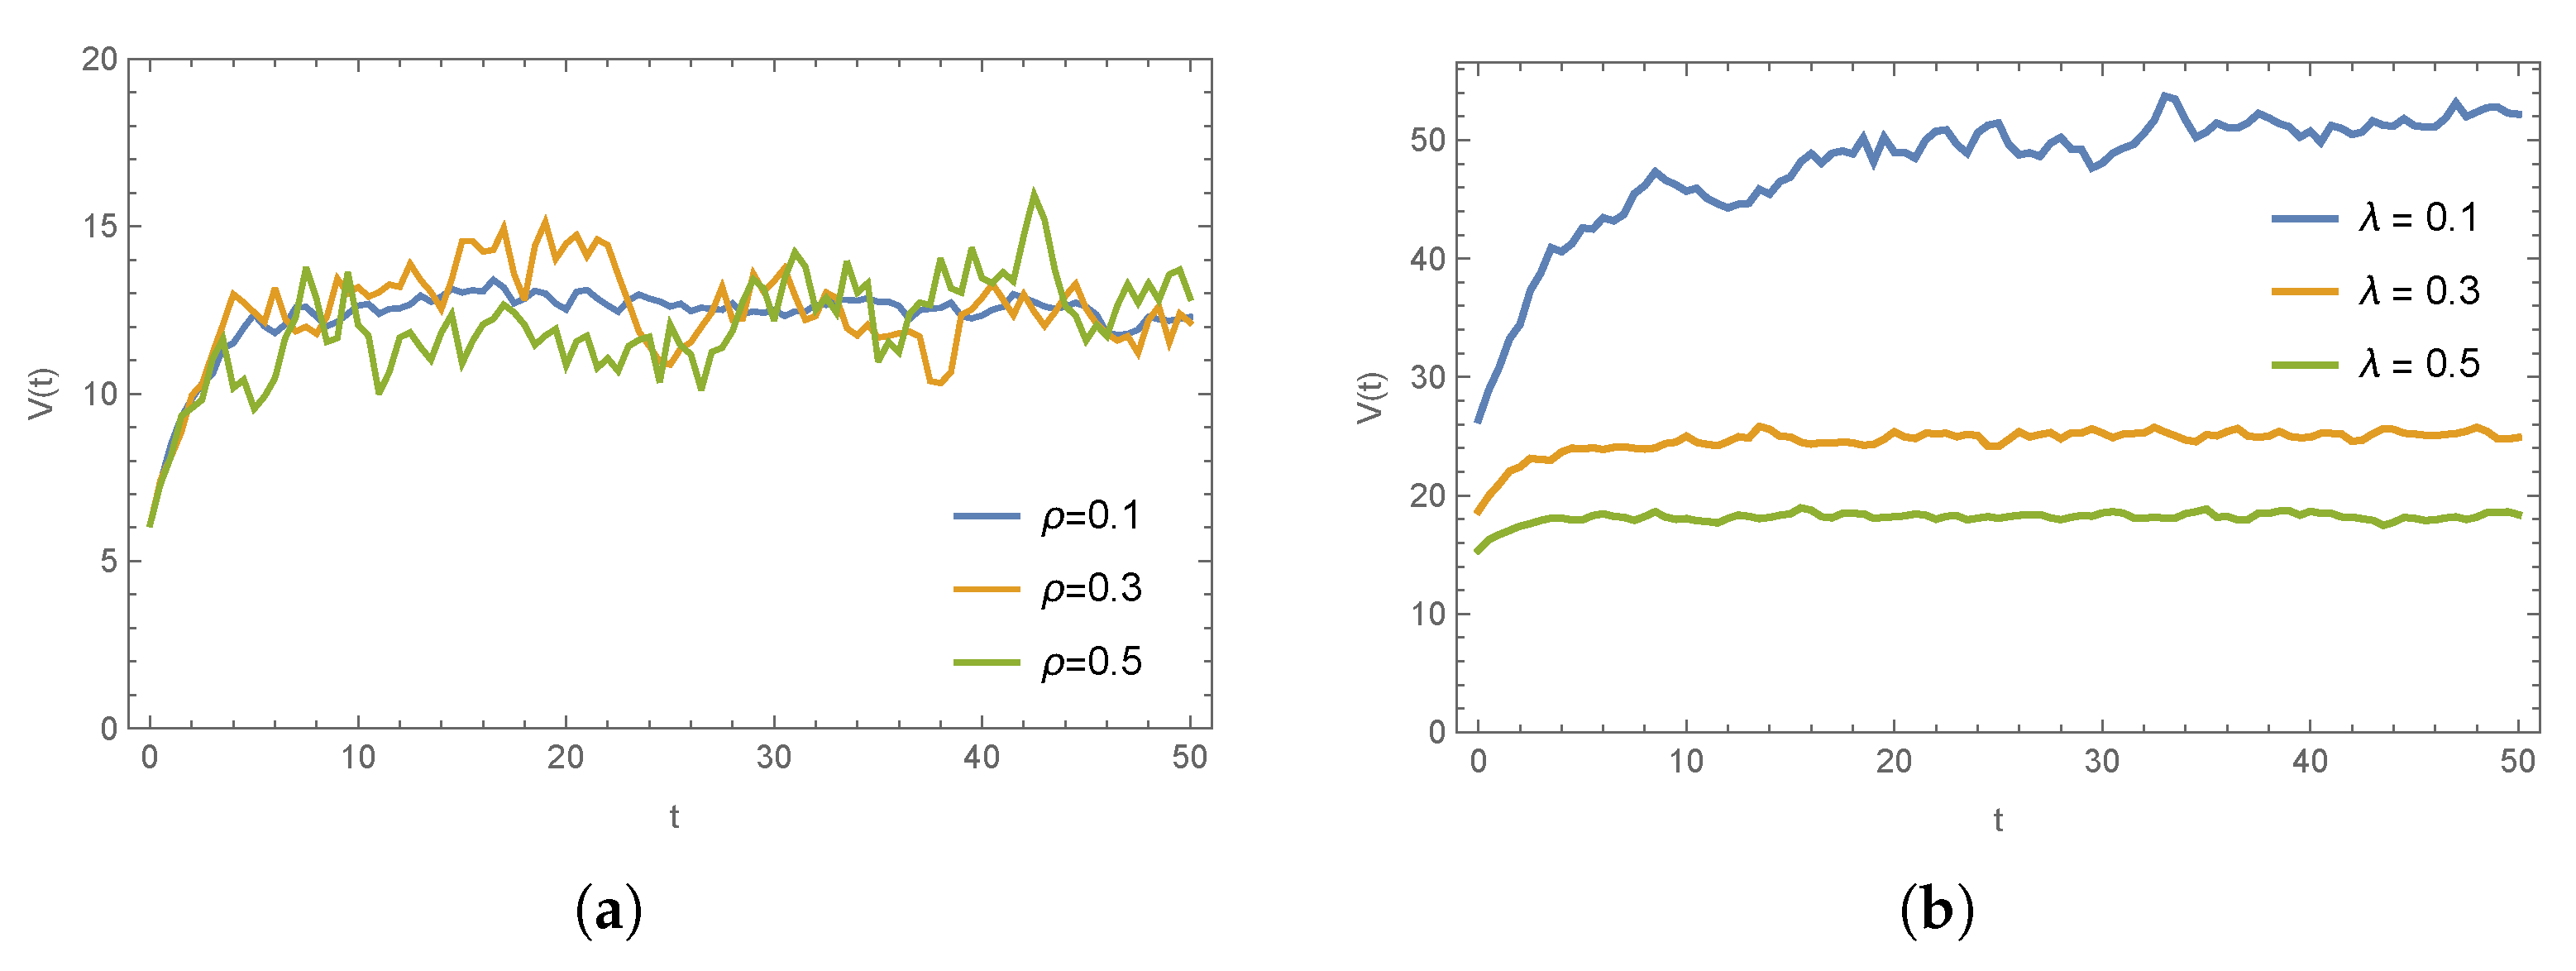
Figure 9 illustrates the effects of the stochastic diffusion coefficient and the natural decay rate on the optimal emergency performance value under the joint decision-making scenario. It can be seen that an increase in the stochastic diffusion coefficient indeed enhances the volatility of the optimal emergency performance value, whereas an increase in the natural decay rate significantly reduces the steady-state level ultimately achieved by the system.
For convenience, the main results from Figure 6, Figure 7, Figure 8 and Figure 9 and other parameters on the emergency response system are summarized in Table 4.

9. Conclusions

This study explores a streamlined disaster response framework using a stochastic differential game approach, deriving the optimal dynamic strategies for emergency actions under the pressure of a major natural disaster. The proposed emergency response strategies are represented by three stochastic differential game models: centralized decision making for collusive emergency response, decentralized emergency response without a cost-sharing contract, and decentralized emergency response with a cost-sharing contract. Each model has distinct characteristics, providing diverse strategies for guiding decision making in disaster response efforts. The findings of the study are summarized as follows:
(1)
Across all three scenarios, the collusive decision-making model enables the government and social organizations to achieve the highest emergency response efforts.
(2)
Introducing a cost-sharing mechanism into a decentralized game can motivate the other participants to engage more proactively in the establishment of a disaster relief system, achieving a Pareto-efficient outcome.
(3)
As all participants work together to enhance emergency supply capacity, the optimal evolution path of emergency resource availability increases over time, eventually stabilizing. Compared to the scenario without cost sharing, a cost-sharing contract yields a higher expected availability but also introduces greater fluctuations.
The above findings have important practical significance for policymakers and relevant operational sectors: although the centralized decision-making model can maximize overall emergency performance, its implementation in practice may face challenges such as high coordination costs, slower decision making due to administrative complexity, and potential resistance from stakeholders with differing priorities. For example, achieving full consensus among multiple agencies during a large-scale disaster may delay timely action. In contrast, introducing an appropriate cost-sharing mechanism can strike a better balance by facilitating flexible coordination and distributing responsibilities more evenly among all players. Therefore, in practice, governments should establish transparent cost allocation schemes and provide targeted incentives for social organizations to ensure their sustained participation, thereby enhancing the resilience and adaptability of the entire emergency response system.
In the current disaster response optimization model, we primarily focus on two key players—government and social organizations—because they typically serve as the leading and coordinating forces in real-world emergency management. However, we fully acknowledge that this setting simplifies the complex and multifaceted nature of actual emergency response systems. In practice, various participants such as private sector enterprises, international aid agencies, local communities, and affected individuals also play indispensable roles in the disaster relief process.
To address these issues, future research will aim to broaden the scope of the model by incorporating additional participants and accounting for their behavioral heterogeneity and differences in resource capacities. For instance, future extensions may include inter-agency coordination among government departments, strategic interactions among multiple NGOs, and the role of private enterprises under different incentive schemes. Moreover, we also plan to incorporate time-varying parameters, nonlinear effects, and conduct empirical calibration using real-world data to improve the model’s realism and practical relevance.

Author Contributions

Software, M.Z.; formal analysis, M.W.; investigation, J.W.; writing, Y.N. All authors have read and agreed to the published version of the manuscript.

Funding

This research received no external funding.

Data Availability Statement

The original contributions presented in this study are included in the article. Further inquiries can be directed to the corresponding author.

Conflicts of Interest

The authors declare no conflicts of interest.

Appendix A

Appendix A.1. Proof of Theorem 1

Proof of Theorem 1. 
Let V G S c represent the value function associated with the complete disaster relief framework. Then, it satisfies V G S c = max E G , E S J G S c ( E G , E S ) . Accordingly, based on the foundational principles of optimal control theory [34], V G S c must obey the associated HJB equation for every A > 0 , i.e.,
r V G S c = max E G , E S π 1 E G + π G ( ε E S + ω A ) + ( π G + π S ) ( μ E G + η E S ) + θ A 1 2 k G E G 2 1 2 k S E S 2 + V G S c α E G + β E S ( δ + λ ) A + 1 2 ρ 2 A V G S c ,
where V G S c = V G S c / A , V G S c = 2 V G S c / A 2 . Considering the first-order derivatives of (A1) in terms of E G , E S and setting them to zero, i.e.,
r V G S c E G = E G k G + π 1 + μ π G + μ π S + α V G S c = 0 , r V G S c E S = E S k S + ε π 2 + η π G + η π S + β V G S c = 0 .
Solving these equations yields the optimal efforts:
E G c = π 1 + μ π G + μ π S + α V G S c k G , E S c = ε π 2 + η π G + η π S + β V G S c k S .
Substituting (A3) into (A1) and considering the balance on both sides, the solution of (A1) should satisfy the following ansatz:
V G S c = a 1 A + a 2 .
where a 1 and a 2 represent constants yet to be specified. Substituting expressions (A3) and (A4) into (A1) and setting the corresponding coefficients of A to zero, we get
a 1 = ω π 2 + θ ( π G + π S ) δ + λ + r , a 2 = ( χ 2 π 2 + χ 3 ( π G + π S ) ) 2 2 r ( δ + λ + r ) 2 k S + ( α ω π 2 + ( δ + λ + r ) π 1 + χ 1 ( π G + π S ) ) 2 2 r ( δ + λ + r ) 2 k G ,
where χ 1 = α θ + μ ( δ + λ + r ) , χ 2 = β ω + ε ( δ + λ + r ) , χ 3 = β θ + η ( δ + λ + r ) .

Appendix A.2. Proof of Proposition 1

Proof of Proposition 1. 
Inserting (7) into (6), optimal emergency resource availability A c ( t ) takes the form
d A c ( t ) = ( Δ c ( δ + λ ) A ( t ) ) d t + ρ A ( t ) d W ( t ) , A c ( 0 ) = A 0 > 0 , Δ c = α 2 ω π 2 + θ ( π G + π S ) + α ( δ + λ + r ) ( π 1 + μ ( π G + π S ) ) ( δ + λ + r ) k G + β 2 ( ω π 2 + θ ( π G + π S ) ) + β ( δ + λ + r ) ( ε π 2 + η ( π G + π S ) ) ( δ + λ + r ) k S .
Let ψ ( t , x ) = e ( δ + λ ) t x . To obtain the stochastic differential of ψ ( t , A c ( t ) ) , we apply Itô’s lemma, as stated in Lemma 2. Given that ψ ( t , x ) is linear in x, its second-order derivative with respect to x vanishes. Then, we have
d ψ ( t , A c ( t ) ) = ψ t ( t , A c ( t ) ) d t + ψ x ( t , A c ( t ) ) d A c ( t ) + 1 2 2 ψ x 2 ( t , A c ( t ) ) ( d A c ( t ) ) 2 = ( δ + λ ) e ( δ + λ ) t A c ( t ) d t + e ( δ + λ ) t d A c ( t ) ,
where ψ x x ( t , x ) = 0 for all x.
Next, substituting the dynamics of A c ( t ) , which follows the Itô process,
d A c ( t ) = ( δ + λ ) A c ( t ) Δ c d t + ρ A c ( t ) d W ( t ) ,
To obtain
d ψ ( t , A c ( t ) ) = ( δ + λ ) e ( δ + λ ) t A c ( t ) d t + e ( δ + λ ) t ( δ + λ ) A c ( t ) Δ c d t + ρ A c ( t ) d W ( t ) = Δ c e ( δ + λ ) t d t + ρ e ( δ + λ ) t A c ( t ) d W ( t ) .
This yields the final expression:
d ψ ( t , A c ( t ) ) = Δ c e ( δ + λ ) t d t + ρ e ( δ + λ ) t A c ( t ) d W ( t ) .
The derivation above ensures mathematical rigor by explicitly applying Itô’s lemma and specifying the drift and diffusion terms of the underlying process. The linearity of ψ ( t , x ) simplifies the expansion and leads to a concise stochastic differential.
Integrating the above equation gives
e ( δ + λ ) t A c ( t ) = G c ( 0 ) + 0 t Δ c e ( δ + λ ) u d u + 0 t ρ e ( δ + λ ) u A c ( u ) d W ( u ) = A 0 + Δ c ( δ + λ ) ( e ( δ + λ ) u 1 ) + ρ 0 t e ( δ + λ ) u A c ( u ) d W ( u ) .
Since the Itô integral has an expectation of zero, applying the expectation to (A6) will yield
E [ A c ( t ) ] = e ( δ + λ ) t A 0 Δ c δ + λ e ( δ + λ ) t + Δ c δ + λ .
For δ + λ > 0 , we get
lim t E [ A c ( t ) ] = Δ c δ + λ .
Let ϕ ( t ) = e ( δ + λ ) t A c ( t ) . According to Itô’s formula, we have
d ϕ ( t ) = Δ c e ( δ + λ ) t d t + σ e ( δ + λ ) t A c ( t ) d W ( t ) = Δ c e ( δ + λ ) t d t + ρ e ( δ + λ ) t 2 ϕ ( t ) d W ( t ) .
On the basis of Lemma 2, we get
d ϕ 2 ( t ) = 2 ϕ ( t ) d ϕ ( t ) + d ϕ ( t ) d ϕ ( t ) = 2 Δ c e ( δ + λ ) t ϕ ( t ) d t + 2 ρ e ( δ + λ ) t 2 ϕ 3 2 ( t ) d W ( t ) + ρ 2 e ( δ + λ ) t ϕ ( t ) d t .
Integrating the above formula, we obtain
ϕ 2 ( t ) = A 0 2 + ( 2 Δ c + ρ 2 ) 0 t e ( δ + λ ) u ϕ ( u ) d u + 2 ρ 0 t e ( δ + λ ) u 2 ϕ 3 2 ( u ) d z ( u ) .
Taking mathematical expectations on (A6) and (A8), we have
E [ ϕ ( t ) ] = A 0 + Δ c δ + λ ( e ( δ + λ ) t 1 )
and
E [ ϕ 2 ( t ) ] = A 0 2 + 2 Δ c + ρ 2 δ + λ A 0 Δ c δ + λ ( e ( δ + λ ) t 1 ) + Δ c ( 2 Δ c + ρ 2 ) 2 ( δ + λ ) 2 e 2 ( δ + λ ) t 1 .
According to ϕ ( t ) = e ( δ + λ ) t A c ( t ) , we obtain
E [ ( A c ) 2 ( t ) ] = e 2 ( δ + λ ) t A 0 2 + Δ c ( 2 Δ c + ρ 2 ) 2 ( δ + λ ) 2 1 e 2 ( δ + λ ) t + 2 Δ c + ρ 2 δ + λ A 0 Δ c δ + λ e ( δ + λ ) t e 2 ( δ + λ ) t .
Therefore, according to (A7) and (A9), we obtain
Var [ A c ( t ) ] = ρ 2 δ + λ A 0 e ( δ + λ ) t e 2 ( δ + λ ) t + Δ c ρ 2 2 ( δ + λ ) 2 1 2 e ( δ + λ ) t + e 2 ( δ + λ ) t
and
lim t Var [ A c ( t ) ] = Δ c ρ 2 2 ( δ + λ ) 2 .

Appendix A.3. Proof of Theorem 2

Proof of Theorem 2. 
Denoting the value functions for the government and social organizations as V G n , V S n , we get V G n = max E G J G n ( E G ) and V S n = max E S J S n ( E S ) . According to the terms of optimal control theory [34], V S n must obey the HJB equation for every A > 0 , i.e.,
r V S n = max E G π 2 ( ε E S + ω A ) + π S ( ( μ E G + η E S ) + θ A ) + 1 2 ρ 2 A V S n 1 2 k S E S 2 + α E G + β E S ( δ + λ ) A V S n ,
where V S n = V S n / A , V S n = 2 V S n / A 2 . Considering the first-order derivatives of (A10) in terms of E S , and setting it to zero, i.e.,
r V S n E G = E S k S + ε π 2 + η π S + β V S n = 0 ,
Solving this equation yields the optimal effort:
E S n = ε π 2 + η π S + β V S n k S .
Similarly, V G n obeys the following equation:
r V G n ( A ) = max E S π 1 E G + π G ( ( μ E G + η E S ) + θ A ) + 1 2 ρ 2 A V G n 1 2 k G E G 2 + α E G + β E S ( δ + λ ) A V G n ,
where V G n = V G n / A , V G n = 2 V G n / A 2 . Considering the first-order derivatives of (A13) in terms of E G and setting it to zero, i.e.,
r V G n E G = E G k G + π 1 + μ π G + α V G n = 0 ,
Solving this equation yields the optimal effort:
E G n = π 1 + μ π G + α V G n k G .
Substituting (A12) and (A15) into (A10) and (A13) and considering the balance on both sides, the solutions should satisfy the following ansatz:
V G n = a 1 A + a 2 , V S n = b 1 A + b 2 ,
where a 1 , a 2 , b 1 , b 2 are the constants to be determined. Substituting (A12), (A15), and (A16) into (A10) and (A13) and letting all the coefficients of A go to zero, we get
a 1 = θ π G δ + λ + r , a 2 = ( χ 1 π G + ( δ + λ + r ) π 1 ) 2 2 r ( δ + λ + r ) 2 k G + 2 χ 3 π G ( χ 2 π 2 + χ 3 π S ) 2 r ( δ + λ + r ) 2 k S , b 1 = ω π 2 + θ π S δ + λ + r , b 2 = 2 ( χ 1 π G + ( δ + λ + r ) π 1 ) ( α ω π 2 + χ 1 π S ) 2 ρ ( δ + λ + r ) 2 k G + ( χ 2 π 2 + χ 3 π S ) 2 2 r ( δ + λ + r ) 2 k S ,
where χ 1 = α θ + μ ( δ + λ + r ) , χ 2 = β ω + ε ( δ + λ + r ) , χ 3 = β θ + η ( δ + λ + r ) .

Appendix A.4. Proof of Theorem 3

Proof of Theorem 3. 
Denoting the value functions for the government and social organizations as V G s , V S s , we get V G s = max E G J G n ( E G ) and V S s = max E S J S s ( E S ) . According to optimal control theory [34], V S s must obey the HJB equation for every A > 0 , i.e.,
r V S s = max E G , E S π 2 ( ε E S + ω A ) + π S ( ( μ E G + η E S ) + θ A ) + 1 2 ρ 2 A V S s 1 2 ( 1 X ) k S E S 2 + α E G + β E S ( δ + λ ) A V S s ,
where V S s = V S s / A , V S s = 2 V S s / A 2 . Considering the first-order derivatives of (A17) in terms of E S and setting it to zero, i.e.,
r V S n E S = ( 1 X ) E S k S + ε π 2 + η π S β V S s = 0 ,
Solving this equation yields the optimal effort:
E S s = ε π 2 + η π S β V S s ( 1 X ) k S .
Similarly, V G s obeys the equation
r V G s ( G ) = max E G , E S π 1 E G + π G ( ( μ E G + η E S ) + θ A ) + 1 2 ρ 2 A V G s 1 2 k G E G 2 1 2 X k S E S 2 + α E G + β E S ( δ + λ ) A V G s ,
where V G s = V G s / A , V G s = 2 V G s / A 2 . Considering the first-order derivatives of (A20) in terms of E G and setting it to zero, i.e.,
r V G n E G = E G k G + π 1 + μ π G + α V G s = 0 ,
Solving this equation yields the optimal effort:
E G s = π 1 + μ π G + α V G s k G .
Then, we substitute (A19) and (A22) into (A20). Now consider the optimal cost-sharing ratio X by partially differentiating the government’s HJB Equation (A20) with respect to X. Since only the terms involving E S depend on X, and E S itself is a function of X, we compute
d d X π G η E S s 1 2 X k S ( E S s ) 2 = 0 .
Recall the best response of social organizations:
E S s = ε π 2 + η π S β V G s ( 1 X ) k S ,
Differentiating Equation (A23) using the product and chain rule yields
π G η d E S s d X 1 2 k S ( E S s ) 2 X k S E S s · d E S s d X = 0 ,
Solving this equation and simplifying leads to the optimal X:
X = ε π 2 η ( 2 π G π S ) 2 β V G s + β V S s ε π 2 + η ( 2 π G π S ) + 2 β V G s + β V S s .
Substituting (A19) and (A22) into (A17) and (A20) and considering the balance on both sides, the solutions should satisfy the following ansatz:
V G s = a 1 A + a 2 , V S s = b 1 A + b 2 ,
where a 1 , a 2 , b 1 , b 2 are the constants to be determined. Substituting (A19), (A22), and (A27) into (A17) and (A20) and letting all the coefficients of A to zero, we get
a 1 = θ π G δ + λ + r , a 2 = ( χ 1 π G + ( δ + λ + r ) π 1 ) 2 2 r ( δ + λ + r ) 2 k G + ( χ 2 π 2 + χ 3 ( 2 π G + π S ) ) 2 8 r ( δ + λ + r ) 2 k S , b 1 = ω π 2 + θ π S δ + λ + r , b 2 = ( χ 1 π G + ( δ + λ + r ) π 1 ) ( α ω π 2 + χ 1 π S ) r ( δ + λ + r ) 2 k G + ( χ 2 π 2 + c π S ) ( χ 2 π 2 + χ 3 ( 2 π G + π S ) ) 4 r ( δ + λ + r ) 2 k S , X = 2 χ 3 π G χ 2 π 2 χ 3 π S 2 χ 3 π G + χ 2 π 2 + χ 3 π S , 2 χ 3 π G > χ 2 π 2 + χ 3 π S 0 . 2 χ 3 π G < χ 2 π 2 + χ 3 π S
where χ 1 = α θ + μ ( δ + λ + r ) , χ 2 = β ω + ε ( δ + λ + r ) , χ 3 = β θ + η ( δ + λ + r ) .

References

  1. Khan, M.T.I.; Anwar, S.; Sarkodie, S.A.; Yaseen, M.R.; Nadeem, A.M. Do natural disasters affect economic growth? The role of human capital, foreign direct investment, and infrastructure dynamics. Heliyon 2023, 9, e12911. [Google Scholar] [CrossRef]
  2. Jemli, R. The importance of natural disasters’ governance for macroeconomic performance and countries resilience. Int. J. Disaster Resil. Built. Environ. 2021, 12, 387–399. [Google Scholar] [CrossRef]
  3. Wang, J.; Shi, P.; Yi, X.; Jia, H.; Zhu, L. The regionalization of urban natural disasters in China. Nat. Hazards 2008, 44, 169–179. [Google Scholar] [CrossRef]
  4. Wang, D.; Qi, C.; Wang, H. Improving emergency response collaboration and resource allocation by task network mapping and analysis. Saf. Sci. 2014, 70, 9–18. [Google Scholar] [CrossRef]
  5. Sun, L.; Cao, X.; Alharthi, M.; Zhang, J.; Taghizadeh-Hesary, F.; Mohsin, M. Carbon emission transfer strategies in supply chain with lag time of emission reduction technologies and low-carbon preference of consumers. J. Clean. Prod. 2020, 264, 121664. [Google Scholar] [CrossRef]
  6. Kang, Y.; Dong, P.; Ju, Y.; Zhang, T. Differential game theoretic analysis of the blockchain technology investment and carbon reduction strategy in digital supply chain with government intervention. Comput. Ind. Eng. 2024, 189, 109953. [Google Scholar] [CrossRef]
  7. Zhang, J.; Gou, Q.; Liang, L.; Huang, Z. Supply chain coordination through cooperative advertising with reference price effect. Omega-Int. J. Manag. S. 2013, 41, 345–353. [Google Scholar] [CrossRef]
  8. Zhang, Z.; Yu, L. Altruistic mode selection and coordination in a low-carbon closed-loop supply chain under the government’s compound subsidy: A differential game analysis. J. Clean. Prod. 2022, 366, 132863. [Google Scholar] [CrossRef]
  9. Xiao, L.; Liu, J.; Ge, J. Dynamic game in agriculture and industry cross-sectoral water pollution governance in developing countries. Agric. Water Manag. 2021, 243, 106417. [Google Scholar] [CrossRef]
  10. Xu, H.; Tan, D. Optimal Abatement Technology Licensing in a Dynamic Transboundary Pollution Game: Fixed Fee Versus Royalty. Comput. Econ. 2023, 61, 905–935. [Google Scholar] [CrossRef]
  11. Lu, Y.; Xu, J. The progress of emergency response and rescue in China: A comparative analysis of Wenchuan and Lushan earthquakes. Nat. Hazard. 2014, 74, 421–444. [Google Scholar] [CrossRef]
  12. Zhao, L.; Li, C.; Guo, X. Research of cooperative relief strategy between government and enterprise based on differential game. Syst. Eng. Pract. 2018, 38, 885–899. [Google Scholar]
  13. Li, B.; Li, H.; Sun, Q.; Lv, R. Optimal control of false information clarification system under major emergencies based on differential game theory. Comput. Intel. Neurosc. 2022, 2022, 7291735. [Google Scholar] [CrossRef]
  14. Chen, T.; Huang, J. Exploratory research on the system of China relief reserve. Syst. Eng. 2012, 5, 99–106. [Google Scholar] [CrossRef]
  15. Zhang, M.; Kong, Z. A tripartite evolutionary game model of emergency supplies joint reserve among the government, enterprise and society. Comput. Ind. Eng. 2022, 169, 108132. [Google Scholar] [CrossRef]
  16. Qiu, Y.; Shi, M.; Zhao, X.; Jing, Y. System dynamics mechanism of cross-regional collaborative dispatch of emergency supplies based on multi-agent game. Complex. Intell. Syst. 2023, 9, 2321–2332. [Google Scholar] [CrossRef]
  17. Du, L.; Qian, L. The government’s mobilization strategy following a disaster in the Chinese context: An evolutionary game theory analysis. Nat. Hazards 2016, 80, 1411–1424. [Google Scholar] [CrossRef]
  18. Dutta, P.K. A folk theorem for stochastic games. J. Econ. Theory 1995, 66, 1–32. [Google Scholar] [CrossRef]
  19. Peter, S.; Ibrahim, B. Intuitive innovation: Unconventional modeling and systems neurology. Mathematics 2023, 11, 1–22. [Google Scholar] [CrossRef]
  20. Saburov, M. The discrete-time Kolmogorov systems with historic behavior. Mathematics 2023, 11, 3456. [Google Scholar] [CrossRef]
  21. Fan, Z.; Xu, W.; Zhang, W. Research on digital transformation strategy and subsidy mechanism of manufacturing supply chain based on differential game. AIMS Math. 2023, 8, 23850–23870. [Google Scholar] [CrossRef]
  22. Li, H.; Xiang, S.; Yang, Y.; Liu, C. Differential evolution particle swarm optimization algorithm based on good point set for computing Nash equilibrium of finite noncooperative game. AIMS Math. 2021, 6, 1309–1323. [Google Scholar] [CrossRef]
  23. Jia, Z.; Liu, X. Uncertain stochastic hybrid differential game system with V-n jumps: Saddle point equilibrium strategies and application to advertising duopoly game. Chaos Solitons Fractals 2023, 171, 113490. [Google Scholar] [CrossRef]
  24. Wang, K.; Wu, P.; Zhang, W. Stochastic differential game of joint emission reduction in the supply chain based on CSR and carbon cap-and-trade mechanism. J. Franklin. Inst. 2024, 361, 106719. [Google Scholar] [CrossRef]
  25. Hashemi, D.H.; Khalilpourazari, S. Stochastic weekly operating room planning with an exponential number of scenarios. Ann. Oper. Res. 2023, 328, 643–664. [Google Scholar] [CrossRef]
  26. Liu, J.; Xiao, L.; Wang, J.; Wang, C. Payments for environmental services strategy for transboundary air pollution: A stochastic differential game perspective. Sci. Total Environ. 2022, 852, 158286. [Google Scholar] [CrossRef]
  27. Zou, Y.; He, D.; Sun, R. Research on the Mechanism of Collaborative Innovation in Green Technology among Supply Chain Enterprises Based on Cost Sharing and Market Competition. Sustainability 2024, 16, 6295. [Google Scholar] [CrossRef]
  28. Sun, R.; He, D.; Yan, J. Dynamic analysis of green technology innovation in products and processes under supply chain competition scenarios—A study based on stochastic differential game model. J. Environ. Manag. 2025, 373, 123545. [Google Scholar] [CrossRef]
  29. Meding, J.K.V.; Oyedele, L.; Cleland, D.; Spillane, J.; Konanahalli, A. Mapping NGO competency to reduce human vulnerability in post-disaster communities: Comparing strategies in Sri Lanka and Bangladesh. Int. J. Humanit. 2011, 8, 119–138. [Google Scholar] [CrossRef]
  30. Breton, M.; Zaccour, G.; Zahaf, M. A differential game of joint implementation of environmental projects. Automatica 2005, 41, 1737–1749. [Google Scholar] [CrossRef]
  31. Hartman, R.; Wheeler, D.; Singh, M. The cost of air pollution abatement. Appl. Econ. 1997, 29, 759–774. [Google Scholar] [CrossRef]
  32. Nerlove, M.; Arrow, K.J. Optimal advertising policy under dynamic conditions. Economica 1962, 114, 129–142. [Google Scholar] [CrossRef]
  33. Oksendal, B. Stochastic Differential Equations: An Introduction with Applications; Springer: Berlin/Heidelberg, Germany, 2003. [Google Scholar]
  34. Morton, I.K.; Nancy, L.S. Dynamic Optimization: The Calculus of Variations and Optimal Control in Economics and Management; Elsevier: New York, NY, USA, 1981. [Google Scholar]
  35. Kloeden, P.E.; Platen, E. Numerical Solution of Stochastic Differential Equations; Springer: Berlin/Heidelberg, Germany, 1992. [Google Scholar]
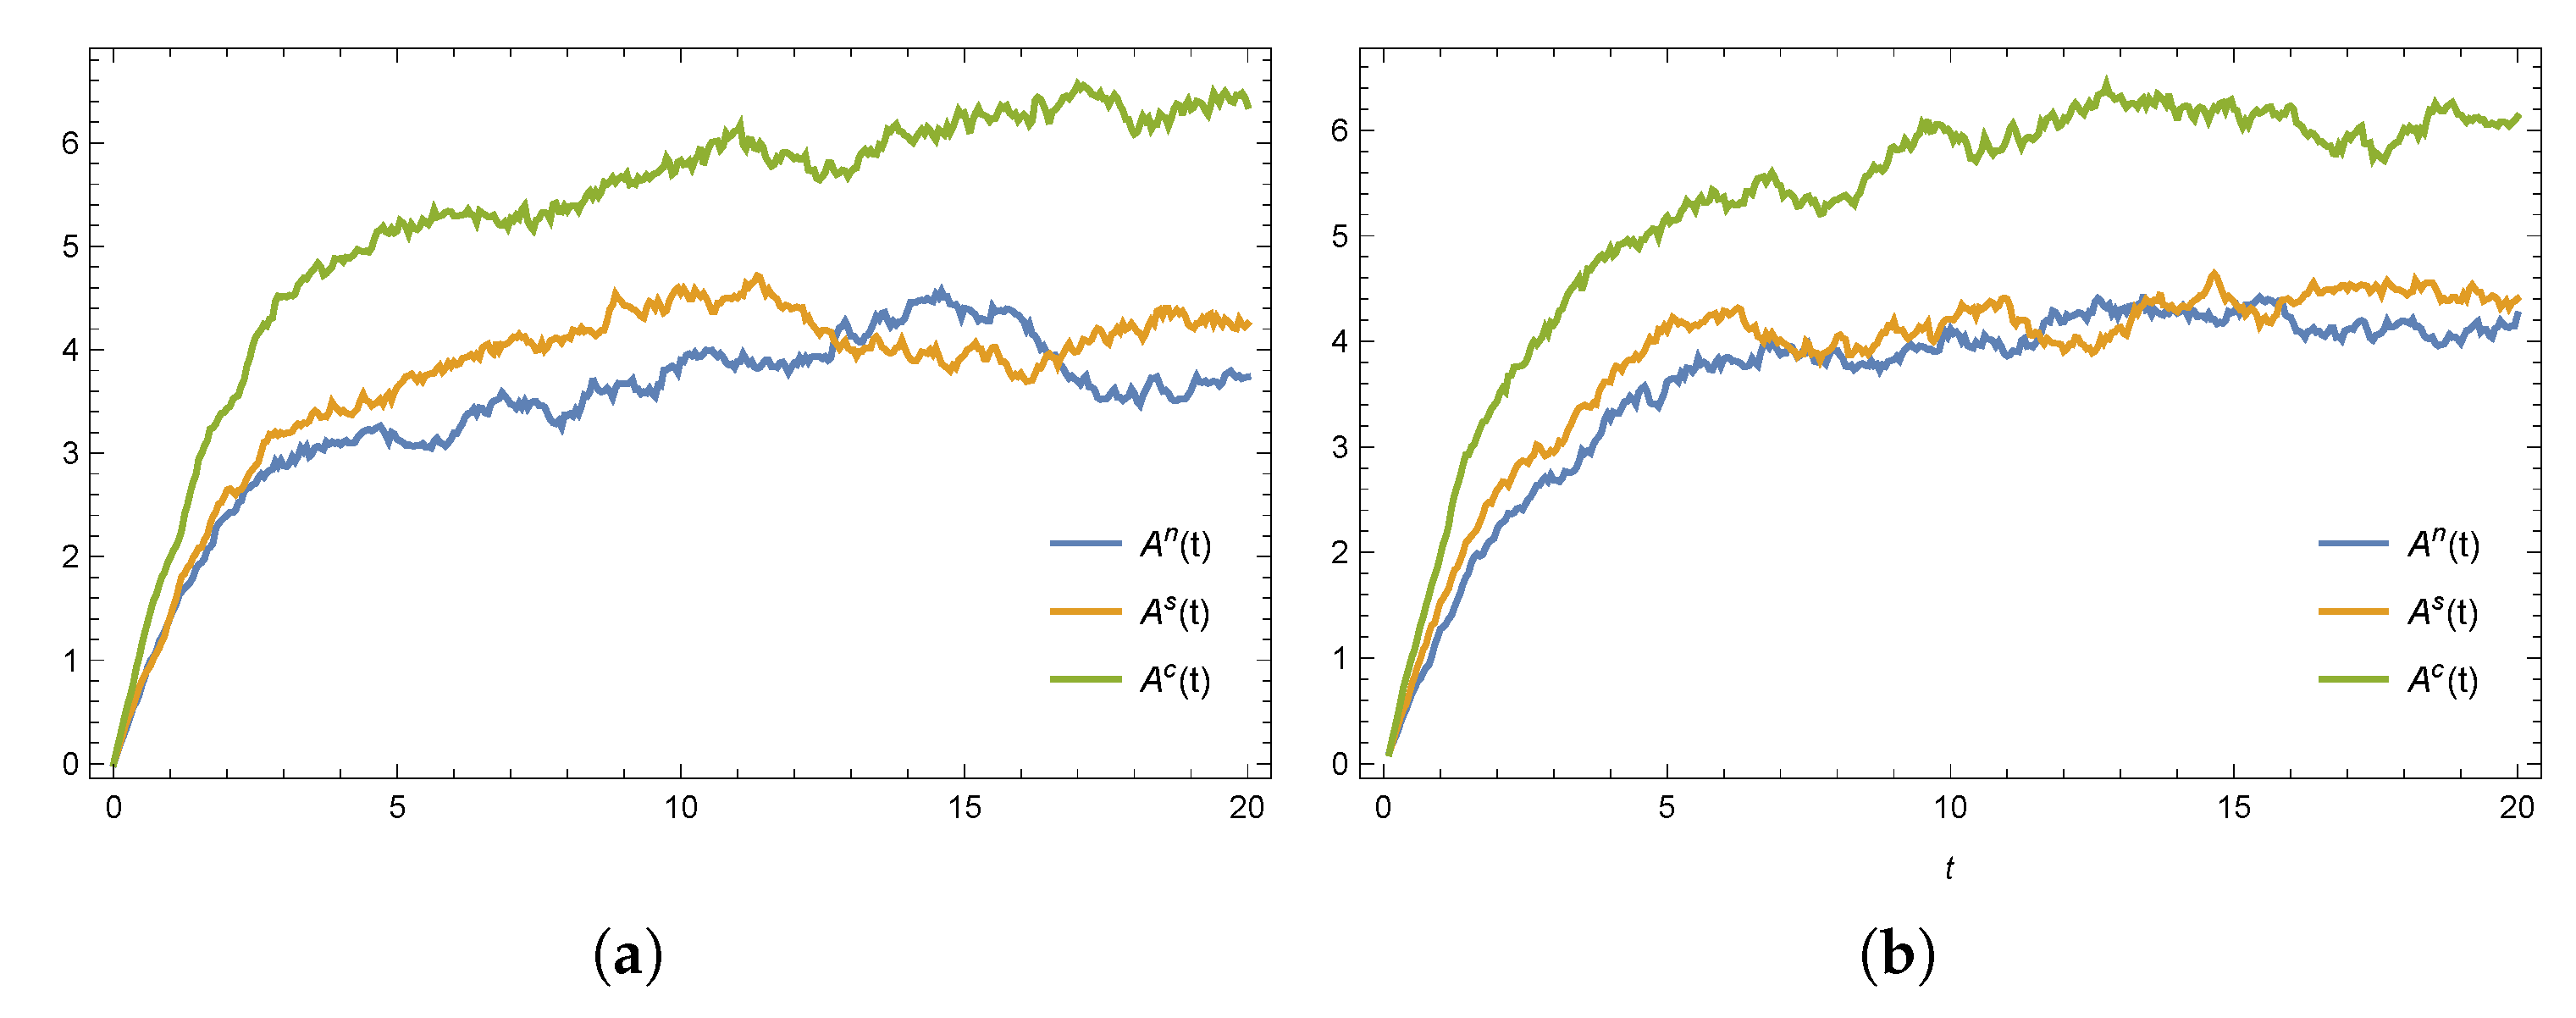
Figure 1. The evolution paths of emergency resource availability plotted using the (a) Euler and (b) Milstein methods.
Mathematics 13 02780 g001
Figure 2. The value of the government in the decentralized models plotted using the (a) Euler and (b) Milstein methods.
Mathematics 13 02780 g002
Figure 3. The value of social organizations in the decentralized models plotted using the (a) Euler and (b) Milstein methods.
Mathematics 13 02780 g003
Figure 4. The total value of the entire disaster relief system plotted using the (a) Euler and (b) Milstein methods.
Mathematics 13 02780 g004
Figure 5. The impact of key parameters on emergency response efforts. (a) ρ on E G . (b) ρ on E S . (c) λ on E G and (d) λ on E S .
Mathematics 13 02780 g005
Figure 6. The impact of key parameters on emergency resource availability A ( t ) . (a) μ on A ( t ) . (b) α on A ( t ) . (c) ρ on A ( t ) and (d) δ on A ( t ) .
Mathematics 13 02780 g006
Figure 7. The impact of key parameters on optimal emergency performance value under the scenario “n”. (a) β on V ( t ) . (b) σ on V ( t ) . (c) r on V ( t ) and (d) λ on V ( t ) .
Mathematics 13 02780 g007
Figure 8. The impact of key parameters on optimal emergency performance value under the scenario “s”. (a) ω on V ( t ) and (b) ρ on V ( t ) .
Mathematics 13 02780 g008
Figure 9. The impact of key parameters on optimal emergency performance value under the scenario “c”. (a) ρ on V ( t ) and (b) λ on V ( t ) .
Mathematics 13 02780 g009
Table 1. List of variables.
VariableDescription
Decision variable E G The response effort of the government
E S The response effort of social organizations
State variable A ( t ) The emergency resource availability
Model parameters k G , k S The cost coefficients of the government and social organizations
C G , C S The cost of the government and social organizations
α , β The marginal impact of E G , E S in Equation (1)
δ The natural decay rate of emergency supplies
λ The marginal impact of infrastructure impairment
Γ The emergency response efficacy of organizations
μ , η The marginal impact of E G , E S on Γ
θ The incremental influence of A on Γ
DThe reputation of organizations
ε The marginal impact of E S on D
ω The marginal impact of A on D
rThe discount rate
π 1 The marginal profit coefficient of the government
π 2 The indirect profit of social organizations
Table 2. Comparison of main results across three emergency response models.
E G E S V G V S lim t E [ A ( t ) ] lim t Var [ A ( t ) ]
c > n = s c > s > n s > n s > n c > s > n c > s > n
c” = centralized decision making for collusive emergency response, “s” = decentralized emergency response with a cost-sharing contract, “n” = decentralized emergency response without a cost-sharing contract. The above relationship holds only under the assumption 2 χ 3 π G > χ 2 π 2 + χ 3 π S , where χ 1 = α θ + μ ( δ + λ + r ) , χ 2 = β ω + ε ( δ + λ + r ) , χ 3 = β θ + η ( δ + λ + r ) .
Table 3. Comparison of main results across three emergency response models.
lim t E [ A ( t ) ] V G V S V
Euler method c > s > n s > n s > n c > s > n
Milstein method c > s > n s > n s > n c > s > n
c” = centralized decision making for collusive emergency response, “s” = decentralized emergency response with a cost-sharing contract, “n” = decentralized emergency response without a cost-sharing contract.
Table 4. The impact of key parameters on emergency response system.
α β σ η μ θ ε ω r ρ λ δ
model n A ( t ) +++++++--
V G +++++++----
V S +++++++----
V+++++++----
model s A ( t ) +++++--
V G +++++++----
V S +++++++----
V+++++++----
model c A ( t ) +++++++--
V+++++++---
+ represents positive influence, - represents negative influence, ∼ represents no significant influence.
Disclaimer/Publisher’s Note: The statements, opinions and data contained in all publications are solely those of the individual author(s) and contributor(s) and not of MDPI and/or the editor(s). MDPI and/or the editor(s) disclaim responsibility for any injury to people or property resulting from any ideas, methods, instructions or products referred to in the content.