Abstract
High-resolution 3D pavement images have become a valuable data source for automated surface distress detection and assessment. However, accurately identifying and segmenting cracks from pavement images remains challenging, due to factors such as low contrast and hair-like thinness. This study investigates key factors affecting segmentation performance and proposes a novel deep learning architecture designed to enhance segmentation robustness under these challenging conditions. The proposed model integrates a multi-resolution feature extraction stream with gated attention mechanisms to improve spatial awareness and selectively fuse information across feature levels. Our extensive experiments on a 3D pavement dataset demonstrated that the proposed method outperformed several state-of-the-art architectures, including FCN, U-Net, DeepLab, DeepCrack, and CrackFormer. Compared with U-Net, it improved F1 from 0.733 to 0.780. The gains were most pronounced on thin cracks, with F1 from 0.531 to 0.626. Our paired t-tests across folds showed the method is statistically better than U-Net and DeepCrack on Recall, IoU, Dice, and F1. These findings highlight the effectiveness of the attention-guided, multi-scale feature fusion method for robust crack segmentation using 3D pavement data.
MSC:
68T07
1. Introduction
Pavements serve as the foundational infrastructure of highway transportation systems, providing structural support for vehicular traffic. To maintain serviceability and safety, it is essential to conduct regular pavement condition surveys to assess current conditions, forecast deterioration, and prioritize maintenance and rehabilitation efforts. In recent years, automated pavement condition surveys have gained widespread adoption across state highway agencies, largely due to advances in high-resolution data collection technologies.
High-resolution intensity/range images, which are also known as two-dimensional/three-dimensional (2D/3D) images, are widely adopted for pavement surface distress measurement. The intensity value reflected by the pavement surface under certain lighting conditions is captured by 2D images. Line-scan cameras are commonly used to collect 2D pavement surface images. A line-scan camera only scans a single pixel line at a time; thus, it is much easier to use focused illumination (such as a line laser) to maintain consistent lighting conditions with much less energy consumption [1]. The range value of the pavement surface is captured by 3D images, with each pixel value denoting the elevation of a point on the pavement surface. Given the inherent physical properties of pavement distress, it is generally accepted that 3D imaging has the potential to provide more relevant and valuable information, along with reduced interference or ’noise,’ compared to 2D imaging [2].
Even with high-resolution data, accurately and efficiently extracting distress information remains a significant challenge. Pavement surfaces are inherently complex, exhibiting variations in texture, material composition, and surface condition across different locations and over time. This complexity is further exacerbated by aging, environmental exposure, and the imaging characteristics of the sensors used. One of the most significant challenges involves the inconsistent visibility of cracks in 3D pavement images, which can vary greatly depending on crack width, depth, and surface texture. As Figure 1 shows, thin cracks may be difficult to detect due to limited pixel resolution and their narrow physical width, while low-contrast cracks, which are often observed in asphalt concrete pavements with coarse aggregate mixtures, tend to lack sharp boundaries, due to surface roughness. This wide variability in crack appearance poses substantial challenges for both traditional image-processing techniques and contemporary deep learning-based approaches.
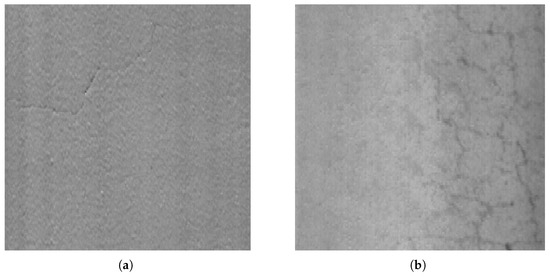
Figure 1.
Sample 3D pavement surface images: (a) thin crack, and (b) low-contrast crack.
To address these challenges, this study systematically investigates the key factors influencing segmentation performance when applying deep learning techniques to high-resolution 3D pavement imagery. We focus on two primary dimensions: (1) how model architecture choices influence segmentation accuracy, particularly in handling varying crack shapes and textures, and (2) the impact of distress characteristics such as crack visibility and continuity. Based on this analysis, we propose a novel deep learning model that incorporates a multi-resolution feature extraction stream and gated attention mechanisms. This architecture is specifically designed to enhance segmentation robustness under challenging visual conditions. The model was evaluated against state-of-the-art (SOTA) methods across three crack categories, including thin and low-contrast cracks, to validate its performance gains and limitations. Our experimental results demonstrate that the proposed model significantly enhances crack segmentation performance, with particularly notable improvements in detecting thin cracks.
The remainder of the paper is organized as follows. Section 2 reviews prior work on pavement distress segmentation, including both conventional and deep learning-based approaches. Section 3 describes the 3D pavement datasets used in this study and model evaluation metrics. Section 4 presents a performance evaluation of several SOTA segmentation models, including FCN, U-Net, DeepLab, DeepCrack, and CrackFormer. Based on the insights gained from this analysis, Section 5 introduces the proposed deep learning architecture, which integrates multi-resolution feature extraction and gated attention mechanisms to address the observed challenges. Section 6 presents and analyzes the results, including comparative evaluation, ablation studies, and limitation discussion. Finally, Section 7 concludes with a summary of key findings and directions for future research.
2. Related Work
Segmenting pavement distress remains a persistent challenge due to the variation in distress types, pavement textures, and pavement conditions. The existing methods for distress segmentation generally fall into two broad categories: traditional rule-based image-processing techniques and modern machine learning approaches. Each category has evolved with different goals, strengths, and limitations.
2.1. Rule-Based Methods
Traditional methods rely on predefined heuristics and mathematical operations to extract crack features from pavement images. These techniques are grounded in classic computer vision principles and include methods such as intensity thresholding [3,4], which binarizes grayscale images based on pixel intensity values, under the assumption that cracks appear significantly darker than their surrounding regions. However, the performances of these methods are highly sensitive to illumination variability and surface noise, limiting their generalizability across different pavement conditions.
Edge detection methods [5], including those using Sobel filters or Canny operators, attempt to trace crack boundaries by identifying abrupt intensity changes. Though these methods enhance edge clarity, they often struggle to distinguish between actual cracks and background clutter like lane markings or surface textures. Wavelet transform-based approaches [6] aim to improve robustness by capturing features across multiple frequency bands, yet they may fail to reconstruct full crack geometries. Seed-based detection [7,8] offers fast implementation for real-time processing by dividing images into patches and evaluating pixel contrast, but it struggles with threshold consistency across diverse datasets.
Other algorithms attempt to address these limitations through more complex models. Optimization-based crack detection [9] frames the segmentation problem as a global search, incorporating multiple parameters to improve detection accuracy—at the cost of increased computational complexity. CrackTree [10] introduces a probabilistic map informed by local intensity contrast and tensor voting to extract crack paths more effectively, though it does not retain crack width information. Overall, while rule-based methods have laid important groundwork for automated distress detection, they often lack the adaptability and robustness needed for imagery with background and feature complexities.
2.2. Deep Learning-Based Methods
Deep learning has emerged as a transformative approach in pavement distress segmentation, leveraging convolutional neural networks (CNNs) to learn hierarchical features directly from data. Since 2015, deep learning models have steadily replaced rule-based systems, due to their superior generalization and ability to handle complex imaging conditions.
Most deep learning-based models adopt the encoder–decoder architecture, inspired by Fully Convolutional Networks (FCNs). Early implementations, such as those by Dung and Anh [11], used VGG16 as the encoder to extract deep semantic features and upsampling layers for reconstruction. These models achieved promising results but suffered from loss of spatial detail, due to pooling operations. To address this, later works, like that of Yang et al. [12], introduced skip connections to fuse high-level semantic features with low-level spatial features, significantly improving boundary sharpness and crack continuity. This innovation is especially effective for detecting thin cracks that are only a few pixels wide.
Subsequent research further explored backbone variations and architecture refinements. Bang et al. [13] investigated deeper networks like ResNet-152 for feature extraction, while Jenkins et al. [14] adapted U-Net for pavement segmentation, highlighting the benefits and trade-offs of spatial resolution retention. Zou et al. [15] proposed DeepCrack, which enhances U-Net by introducing deep supervision at multiple decoder levels to improve training efficiency and segmentation accuracy, particularly for fine-scale cracks. Zhang et al. [16] introduced a Generative Adversarial Network (GAN)-based framework for self-supervised crack detection, aiming to reduce annotation costs. Pan et al. [17] also employed a GAN-based convolutional framework for the purpose of refining crack boundaries and suppress background noise for improving delineation in low-contrast scenes. Liu et al. [18] introduced Crackformer, a transformer-based network that leverages self-attention to capture long-range dependencies while preserving fine crack details. Zhang and Liu [19] proposed a network that leverages deformable convolution, weighted loss function, and multi-scale attention for real-world pavement imagery, reporting consistent gains in Precision and Recall.
In the context of 3D pavement imagery, Zhang et al. [2] developed CrackNet, which avoids pooling layers entirely to preserve spatial information throughout the network. Although computationally intensive, CrackNet achieves strong results on 3D data. Its successor, CrackNet-R [20], incorporates recurrent units to capture temporal or spatial dependencies, resulting in faster inference and improved segmentation stability. More recently, Wen et al. [21] proposed PCDNet, a seed operation–based deep model tailored for 3D asphalt surface crack detection that preserves local geometry in range/elevation data; Gui et al. [22] leveraged transfer learning with enhanced deep edge features to improve cross-scene generalization for 3D crack detection; and Ding et al. [23] introduced richer attention and hybrid pyramid structures to better fuse multi-scale cues in 3D profiles, enhancing automated segmentation on asphalt surfaces.
2.3. Research Gaps and Motivation
Despite recent advancements, deep learning models still encounter difficulties in accurately segmenting pavement distress features under visually challenging conditions, such as extremely thin or low-contrast cracks. Similar challenges have been addressed in other imaging domains: Cai et al. estimated circumferential cracks in sea ice under highly textured and irregular surfaces [24], Zhou et al. achieved segmentation of ice floes in noisy, low-contrast imagery [25], and Wang et al. proposed a multi-resolution salient feature detection framework for cluttered scenes [26]. In geometric data analysis, Deng et al. precisely detected circular structures in free-form surface point clouds [27], illustrating the potential of range/elevation-based feature extraction. These works demonstrate effective strategies for isolating subtle features from complex or degraded backgrounds. However, this specific challenge has not been explicitly addressed in pavement crack segmentation, particularly when leveraging 3D pavement imagery. Most existing encoder–decoder architectures exhibit varying performance in pavement crack segmentation tasks. In addition, limited research has systematically examined how crack attributes, such as width, contrast, and continuity, influence segmentation performance. This study addresses these limitations by analyzing both model-related and image-based factors and proposing a novel architecture specifically designed to enhance segmentation robustness under challenging crack appearances in 3D pavement imagery.
3. Dataset and Experimental Configuration
This section outlines the dataset construction, evaluation criteria, and training configuration used to develop and validate the crack segmentation models. A high-resolution 3D pavement surface image dataset was compiled to capture a diverse range of crack types and imaging conditions. In addition, evaluation metrics and experimental protocols were specified to ensure fair and reproducible comparison with existing methods.
3.1. Dataset Description
A dataset of 3D pavement surface images was developed for this study. The images contained in this dataset were collected by commercial vendors using professional pavement condition survey systems in both Mississippi and Texas. Each image has a resolution of 1536 × 900 px, which approximately covers the width of a full highway traffic lane. The value of each pixel within a 3D image accounts for the range of a pavement surface sample point.
A total of 89 pavement surface images from 10 different pavement sections were selected to form an image dataset. Each image was divided into 4 sub-images of the same size with no overlap, and a total of 356 sub-images were obtained for the study. These images were carefully selected so that the dataset could include distresses in a variety of types, severities, and backgrounds. In this study, we divided the cracks into three categories based on width and contrast in the 3D imagery (shown in Figure 2): thick cracks, defined as those wider than two pixels; thin cracks, defined as having a width of two pixels or less; and low-contrast cracks, which exhibited weak pixel value differences from the surrounding pavement surface. Thin cracks pose a particular challenge for segmentation models, due to their limited spatial footprint and discontinuous appearance. Moreover, many thin cracks inherently exhibit low contrast, making them difficult to distinguish from the background, even under favorable background conditions.
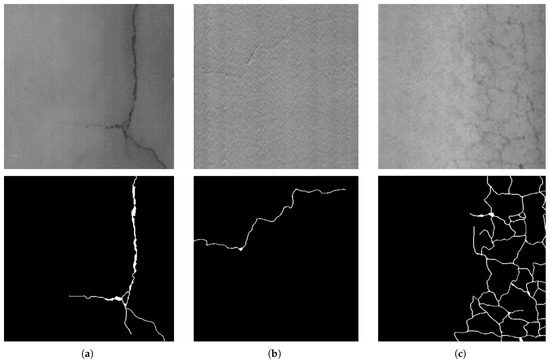
Figure 2.
Examples of crack categories based on width and contrast in digital images ((upper): 3D images; (lower): ground truth). From (left) to (right): (a) cracks with width greater than 2 pixels (thick cracks), (b) cracks with width equal to or less than 2 pixels (thin cracks), and (c) cracks with poorly defined edges due to weak range contrast (low-contrast cracks).
Annotation was manually conducted using Adobe Photoshop, where each pixel was labeled as either crack or non-crack. Achieving precise crack labeling is inherently challenging, particularly for thin cracks and those with poorly defined boundaries. Existing practices often simplify the annotation process by labeling only the crack skeletons, disregarding their actual widths [15]. In this study, we aimed to produce annotations that would more accurately reflect the true crack widths. However, due to the diverse cracking patterns and the subjective nature of manual labeling, annotation consistency can vary among annotators. To mitigate this, all our annotations were reviewed and refined by multiple annotators following a shared labeling protocol to ensure consistency across the dataset. To further support model development and evaluation, additional grayscale datasets were incorporated, including a synthetic dataset [28], CRKWH100, and CrackTree260 [10]. The synthetic dataset provides pixel-level ground truth with 100% accuracy, and it was used exclusively for training purposes within the 3D dataset. CRKWH100 and CrackTree260 consist of top-down pavement surface images captured by smartphones, and they were included to support complementary model evaluation. In this study, CrackTree260 was used for training and CRKWH100 for testing, providing an additional benchmark to further validate the proposed method.
3.2. Evaluation Metrics
Precision, Recall, F1-score, Intersection over Union (IoU), and the Dice coefficient were the primary evaluation metrics adopted in this study. Due to the significant imbalance between crack and background pixels, the commonly used metric of Accuracy was not included, as it can fail to meaningfully differentiate model performance under such conditions.
Precision, Recall, and F1-score are widely used to assess the classification behavior of deep learning models. Precision refers to the proportion of true positive predictions among all predicted positives, while Recall indicates the proportion of true positive predictions among all actual crack pixels. An F1-score provides a harmonic mean of Precision and Recall. The expressions of these three metrics are shown in Equations (1)–(3), where tp denotes the number of true positive pixels, fp denotes false positives, and fn denotes false negatives:
To evaluate spatial overlap between predicted and ground truth crack regions, we also included IoU and the Dice coefficient. IoU measures the ratio of the intersection to the union of the predicted and ground truth regions, while the Dice coefficient emphasizes the overlap relative to the total predicted and actual areas. These metrics are especially relevant for segmentation tasks with thin or fragmented structures. Their formulations are provided in Equations (4) and (5):
To account for boundary uncertainty, we used a relaxed setting in which a predicted positive within two pixels of ground truth counted as a true positive [15]. The non-relaxed setting requires exact overlap.
3.3. Experiment Setting
To ensure fair comparison, all the models were trained and evaluated on the same hardware platform using identical training and evaluation settings. All our experiments were conducted on a workstation equipped with two GPUs, each with 24 GB of memory. The training process utilized a batch size of 8 and was set to run for a maximum of 400 epochs. An early stopping strategy was employed to prevent overfitting.
The model was optimized using stochastic gradient descent (SGD) with an initial learning rate set to 0.1. To enhance the robustness and generalization ability of the model, a series of data augmentation techniques were applied during training. These included random adjustments to brightness, contrast, saturation (jitter), random cropping, and vertical/horizontal flipping.
In this study, we evaluated the models using a stratified five-fold cross-validation scheme. The constructed 3D dataset was first partitioned into five equal-sized folds while maintaining the original distributions of thick, thin, and low-contrast cases. For each split, one fold served as the test set and the remaining four folds were used for training (Figure 3), ensuring that every sample was used for validation exactly once. Because the category proportions are preserved within each fold, stratified cross-validation avoids bias caused by imbalanced class labels and yields more solid validation of the models. After each split, we recorded the evaluation metrics, and the results reported in the following sections are the averages across all five test folds. To examine whether the observed improvements by our proposed method were statistically significant, we performed paired t-tests on the per-fold performance scores of the proposed approach versus the baseline methods; the resulting p-values were used to decide whether the improvements were statistically significant.
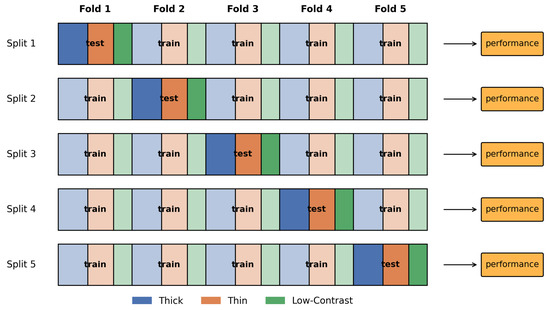
Figure 3.
Stratified five-fold cross-validation with three crack groups: thick, thin, and low-contrast.
4. Performance Analysis of Baseline Models
For this section, we evaluated the performance of SOTA deep learning architectures to establish baseline segmentation capabilities on the proposed 3D pavement dataset. These baseline models were chosen to represent diverse architectural paradigms, including classical encoder–decoder designs, multi-scale context aggregation, and crack-specific feature learning. By comparing their strengths and limitations across different crack categories, this analysis highlights the key challenges in pavement crack segmentation.
4.1. Baseline Models
To establish a performance baseline, we selected six representative deep learning architectures widely used in semantic segmentation and crack detection tasks: FCN [29], U-Net [30], DeepLab [31], SegNet [32], DeepCrack [15], and CrackFormer [18]. These models vary in design philosophy, particularly in their handling of spatial resolution, feature re-use, and contextual information, offering a diverse foundation for comparative analysis:
- FCN (Fully Convolutional Network): One of the earliest segmentation networks, FCN replaces fully connected layers with convolutional layers to enable end-to-end pixel-level prediction. However, due to its reliance on upsampling without explicit skip connections it may struggle with fine spatial details such as thin cracks.
- U-Net: A popular encoder–decoder architecture with symmetric skip connections that fuse high-resolution encoder features with decoder layers. U-Net is widely adopted in medical and pavement image segmentation, due to its effective spatial detail preservation.
- DeepLab: An advanced architecture that uses atrous spatial pyramid pooling (ASPP) to capture multi-scale context and a decoder module for refined boundary prediction. While it excels in capturing broad context, its effectiveness on fine, linear features like pavement cracks remains to be tested in our setting.
- SegNet: An encoder–decoder network that re-uses pooling indices during upsampling to preserve spatial structure. SegNet is computationally efficient and designed for applications where memory and inference speed are critical.
- DeepCrack: A crack-oriented segmentation model that incorporates multi-scale feature learning with dedicated shallow and deep branches to enhance fine-line detection. It is specifically tailored for crack segmentation, making it a valuable benchmark in this context.
- CrackFormer: A transformer-based encoder–decoder tailored for pavement crack segmentation. It leverages self-attention to capture long-range context while multi-scale feature fusion and a lightweight convolutional stem preserve fine, linear crack details with sharp boundaries.
These models were trained and evaluated on the same datasets and settings to provide a fair comparison and to reveal how architectural design influences segmentation performance, particularly in the presence of thin and low-contrast cracks.
4.2. Quantitative Results of Baselines
Table 1 presents the performance of six segmentation architectures: FCN, U-Net, DeepLab with ResNet101 and MobileNet backbones, respectively, SegNet, DeepCrack, and CrackFormer, evaluated using the metrics described in Section 3.2.

Table 1.
Comparison of different architectures across evaluation metrics.
Among the evaluated models, DeepCrack delivered the strongest overall performance, posting the highest Recall (0.713), IoU (0.666), Dice (0.799), and F1 (0.760). CrackFormer ranked next overall, with Recall (0.700), IoU (0.648), Dice (0.785), and F1 (0.746). U-Net and SegNet provided similar, slightly lower performance than DeepCrack and CrackFormer, and FCN remained the weakest overall due to its lack of a structured decoder and skip connections. The two DeepLab variants showed comparable overall performance but differed in trade-offs: DeepLab-MobileNet attained the highest Precision (0.857) yet lower Recall (0.633) than DeepLab-ResNet101 (0.649), and both yielded lower IoU (0.62–0.63)/F1 (0.72–0.73) than DeepCrack and CrackFormer, consistent with the limitations of coarse downsampling and non-parametric upsampling when segmenting thin, boundary-sensitive structures.
DeepCrack and CrackFormer likely outperformed for different, complementary reasons. DeepCrack’s multi-scale branches and deep supervision push features at several resolutions to agree on line-like targets, boosting completeness on faint, fragmented cracks. It is also worth mentioning that DeepCrack tends to produce slightly thicker or more spatially diffuse predictions, which may benefit more from the 2-pixel relaxation criteria. CrackFormer leverages transformer self-attention to aggregate long-range context while preserving local detail, which helps disambiguate crack patterns from look-alike textures.
Table 2 and Figure 4 show the segmentation performance of the base models across different crack categories, revealing the unique challenges posed by each.
Table 2.
F1-scores of segmentation models across different crack categories.
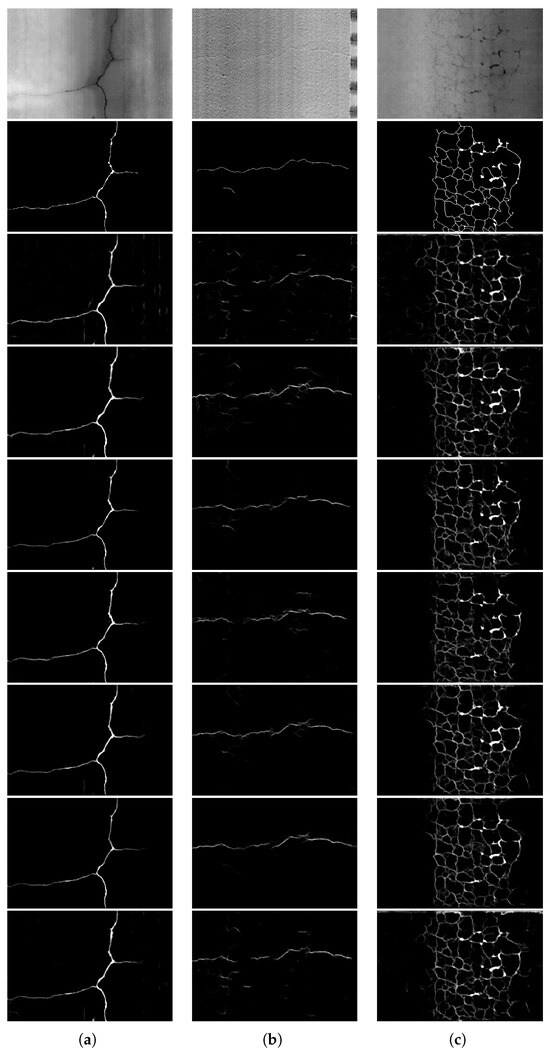
Figure 4.
Sample segmentation results from different architectures on representative examples of (a) thick crack, (b) thin crack, and (c) low-contrast crack. From top to down: 3D image, ground truth, FCN, U-Net, DeepLab_ResNet101, DeepLab_MobileNet, SegNet, DeepCrack, and CrackFormer.
The F1-scores across the different crack categories reveal a clear hierarchy of segmentation difficulty. Thick cracks consistently achieved the highest scores across all the models, likely due to their prominent visual characteristics, larger width, and stronger contrast with the background. In contrast, low-contrast cracks showed moderately reduced performance, reflecting the challenges associated with weak gradients and ambiguous boundaries. Thin cracks were the most difficult to segment, as evidenced by the significant drop in F1-scores. This difficulty arose not only from their narrow structure, which is prone to being lost during downsampling or poorly localized, but also because many thin cracks are inherently low in contrast, compounding the segmentation challenge.
From the architecture perspective, the results aligned with each model’s design: FCN, lacking a true decoder and skip connections, struggled most on thin cracks because coarse upsampling blurs 1–3 px structures; U-Net improved by re-injecting high-resolution features via skips, lifting all the categories but still losing very fine edges after early downsampling; ResNet and MobileNet yielded modest gains on thin cracks through deeper features but did not solve low-contrast ambiguity on their own; SegNet excelled on thick cracks because pooling-indices upsampling preserves coarse layout, yet it was less tuned for fine details; DeepCrack, with multi-scale features and deep supervision, best handled the thin and low-contrast cases and showed lower variability; CrackFormer yielded the best F1 (0.868) over thick cracks, but underperformed on thin and low-contrast cracks compared to DeepCrack, suggesting that even transformer architecture cannot recover fine details once lost in the early stages.
5. Proposed Method
In this study, we adopted U-Net as the base architecture, given its reliable performance and clean encoder–decoder topology. The prior results indicated residual errors on thin and low-contrast cracks, motivating enhancements that preserved fine detail and suppressed background noise. Accordingly, we augmented U-Net with (1) multi-resolution feature extraction and (2) attention-guided skip fusion, which together target finer structure recovery and more selective feature aggregation.
5.1. Multi-Resolution Feature Extraction
As indicated by the experiment results in Section 4, preserving fine spatial details is essential for accurately detecting extremely thin cracks, and this preservation should begin at the earliest stages of feature extraction. To address this need, we propose a multi-resolution feature extraction module to replace the initial encoder block of the standard U-Net architecture. Rather than applying immediate downsampling to the input, the proposed module performs convolution operations in parallel using different stride settings, allowing crack features to be captured at multiple spatial resolutions (Figure 5). The outputs from these parallel branches are subsequently upsampled and fused, resulting in a rich spatial representation that encodes both fine-grained and coarse patterns. This design provides a more robust foundation for early-layer feature extraction and enhances the network’s ability to detect cracks with diverse widths and spatial characteristics.
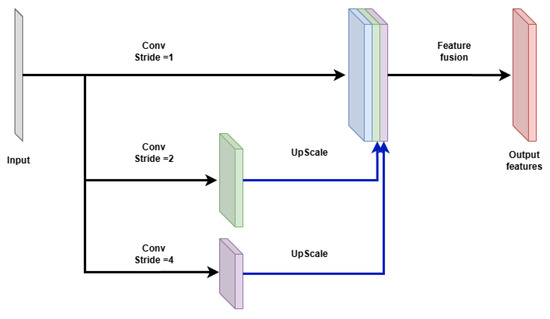
Figure 5.
Multi-resolution feature extraction module.
The high-resolution stream processes the input directly, using a 3 × 3 convolution with stride 1 to preserve fine spatial detail. The medium-resolution stream first downsamples the input, using a 3 × 3 convolution with stride 2, and it then applies another convolutional block to extract mid-level features. Similarly, the low-resolution stream applies a 3 × 3 convolution with stride 4 followed by another convolutional block to capture broader contextual information. The outputs from the three streams are then upsampled (where necessary) to match the highest resolution and concatenated along the channel dimension. A final 1 × 1 convolution is applied to fuse the features and reduce dimensionality. The fusion can be expressed using Equation (6):
where the following applies:
- are the feature maps from the high, medium, and low-resolution streams, respectively;
- denotes bilinear interpolation to the spatial size of ;
- and are the learnable parameters of the fusion convolutional layer;
- is the non-linear activation function (e.g., ReLU).
This design enables the model to effectively aggregate spatial features across multiple scales, improving its robustness against cracks of varying thickness and patterns.
5.2. Attention-Gated Skip Connection
Another observation from the experiment results in Section 4 is that shallow architectures are more effective at preserving fine spatial features, which is particularly beneficial for segmenting thin cracks. In contrast, detecting low-contrast cracks requires a certain level of architectural depth to extract higher-level, abstract representations. This highlights a key design trade-off: either designing a shallower network that maintains fine spatial detail or constructing a deeper network capable of learning abstract features. In this study, we adopted the latter approach by integrating a gated attention mechanism into the U-Net architecture.
In the standard U-Net, skip connections directly concatenate encoder and decoder features without distinction, which may introduce irrelevant or noisy information into the decoding pathway. This becomes especially problematic when segmenting thin or fragmented cracks, where precise localization is critical. To address this limitation, we enhance each skip connection in the proposed architecture with a gated attention mechanism [33]. These attention gates compute spatial relevance maps by combining decoder features (as gating signals) and encoder features, and they use the resulting attention maps to modulate the encoder features before fusion (as shown in Figure 6). This selective filtering process allows the network to emphasize contextually relevant information while suppressing background noise, thereby improving crack localization and overall segmentation accuracy.
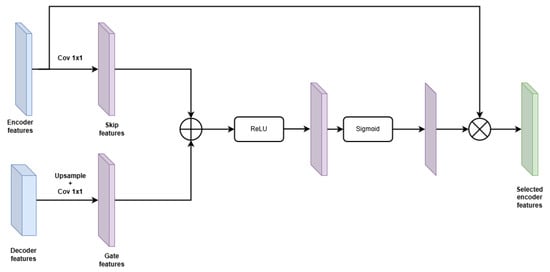
Figure 6.
Gated attention module [33].
The attention mechanism follows a gating strategy to refine skip connections during feature fusion. Specifically, the attention gate takes two inputs: (1) the gating signal from the decoder (upsampled feature), and (2) the corresponding encoder feature map (skip connection). Each input is passed through a separate 1 × 1 convolution and batch normalization layer to unify their channel dimensions and project them into an intermediate feature space. The two transformed signals are added element-wise, activated by ReLU, and further processed by a third 1 × 1 convolution followed by a sigmoid activation to generate the attention map. This attention map is then applied element-wise to the encoder feature map x, allowing the network to selectively focus on informative spatial regions. The equation can be expressed as
where the following applies:
- and are convolutions followed by batch normalization;
- is a convolution + batch normalization + sigmoid;
- denotes the ReLU function;
- ⊙ represents element-wise multiplication;
- is the attention-weighted encoder feature map.
5.3. Network Architecture
The overall network follows the conventional U-Net layout, with four downsampling stages followed by symmetric upsampling stages. Downsampling is performed using max-pooling, and upsampling is achieved via transposed convolutions. Each convolutional block consists of sequential layers of convolution, batch normalization, and ReLU activation. After the final upsampling stage, a 1 × 1 convolution layer is applied to generate the pixel-wise crack probability map. A schematic of the complete architecture is illustrated in Figure 7.
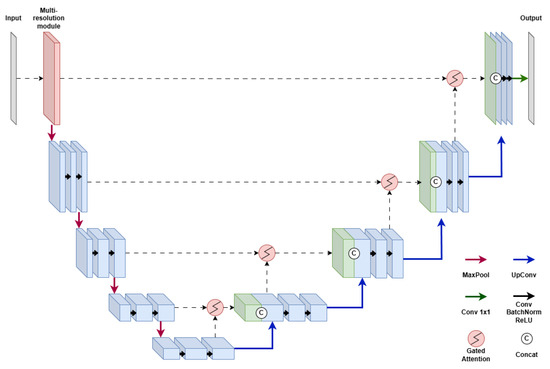
Figure 7.
Proposed architecture based on U-Net.
6. Experiments and Results
6.1. Performance Comparison with Baselines
Table 3 presents a quantitative comparison of the proposed model with U-Net and DeepCrack using Precision, Recall, IoU, Dice, and F1. The proposed model attained the best Recall (0.757), IoU (0.686), Dice (0.816), and F1 (0.780), while DeepCrack achieved the highest Precision (0.813). Relative to U-Net, the proposed method improved Recall by +0.073, IoU by +0.049, Dice by +0.039, and F1 by +0.047; compared with DeepCrack, it yielded gains of +0.044 Recall, +0.020 IoU, +0.017 Dice, and +0.020 F1, with a small decrease in Precision (−0.007). Our paired t-tests across the folds indicated that the proposed model was statistically better than both U-Net and DeepCrack on Recall, IoU, Dice, and F1 (p < 0.05), while the Precision difference versus DeepCrack was not significant. These results suggest that integrating a multi-resolution input module and gated attention–based skip connections into the U-Net backbone strengthens spatial detail preservation and contextual feature selection.
Table 3.
Comparison of the proposed method with U-Net and DeepCrack across evaluation metrics.
Following the overall performance comparison, Table 4 summarizes F1 by crack category. The proposed model attained the highest mean F1 in all three categories: thick (0.859), thin (0.626), and low-contrast (0.766). Improvements were most pronounced for thin cracks (+0.095 vs. U-Net; +0.023 vs. DeepCrack) and for low-contrast cracks (+0.026 vs. U-Net; +0.021 vs. DeepCrack), and they were statistically significant against both baselines (paired t-tests, p < 0.05). For thick cracks, the margin was small (0.859 vs. 0.857/0.855) and not statistically significant. Given that DeepCrack is likely to benefit from the relaxed evaluation criteria because of its broader and more spatially diffuse predictions, the improvements achieved by the proposed model, particularly for thin and low-contrast cracks, suggest an even greater capacity to preserve spatial precision and to handle visually ambiguous regions than the table values alone may imply. These findings indicate that the proposed approach is more effective at capturing the diverse characteristics of pavement cracks and contributes to more robust segmentation performance under challenging visual conditions.
Table 4.
F1-score of different models across crack categories.
To further evaluate the proposed model, CrackTree260 [10] was used for model training, and CRKWH100 was employed for performance validation. The results were compared with those of the original U-Net and DeepCrack, as shown in Table 5. Although both datasets provided relatively accurate annotations, our evaluations were conducted in both relaxed and non-relaxed settings to assess the impact of the evaluation criteria and to enable a consistent comparison across models.
Table 5.
Comparison of segmentation performance with and without relaxation over CRKWH100 dataset.
In the relaxed evaluation setting, the proposed model achieved performance comparable to DeepCrack, with a slightly lower F1-score (0.899 vs. 0.907), IoU (0.834 vs. 0.854), and Dice score (0.910 vs 0.921), while still outperforming U-Net across all metrics. Notably, in the non-relaxed setting, the proposed model surpassed both DeepCrack and U-Net by a substantial margin, achieving the highest scores in Precision (0.649), Recall (0.802), IoU (0.560), Dice (0.718), and F1-score (0.718). These results suggest that the strong performance of DeepCrack under the relaxed criteria may be partially attributed to its broader and more spatially diffuse predictions, which benefit from the two-pixel tolerance. In contrast, the proposed model demonstrated more robust performance under strict evaluation conditions, indicating a higher level of spatial precision and boundary alignment. With accurate crack mask annotations, the proposed model has much stronger potential to deliver accurate and robust segmentation performances.
6.2. Ablation Study
To assess the individual contributions of the proposed architectural components, we conducted an ablation study on three variants of the U-Net model: (1) baseline U-Net, (2) U-Net with a multi-resolution (MS) input module, and (3) U-Net with gated attention (GA) in the skip connections. The full proposed model includes both enhancements.
As shown in Table 6, the baseline U-Net attained F1 (0.733) and IoU (0.637). Adding the multi-resolution module (U-Net+MS) yielded consistent gains, with Precision (0.838), Recall (0.694), IoU (0.665), Dice (0.798), and F1 (0.757), and adding gated attention alone (U-Net+GA) showed a similar pattern, with Precision (0.843), Recall (0.688), IoU (0.657), Dice (0.791), and F1 (0.755). Combining both in the proposed model gave the best overall results: Recall (0.757), IoU (0.686), Dice (0.816), and F1 (0.780), with Precision (0.805). Relative to U-Net, this was +0.073 Recall, +0.049 IoU, +0.039 Dice, and +0.047 F1. Our paired t-tests across the folds indicated that the proposed model was statistically better than U-Net, U-Net+MS, and U-Net+GA on Recall, IoU, Dice, and F1, confirming that the two mechanisms provide complementary benefits when integrated.
Table 6.
Ablation study on U-Net variants and the proposed method.
6.3. Limitations
This study has two primary limitations. Firstly, the dataset is comparatively small (356 tiles); for thin and low-contrast cracks, pixel-accurate ground truth is inherently ambiguous. While our results on CrackTree260 and CRKWH100 provide external evidence, broader validation on larger and more diverse datasets is needed. In addition, for 3D pavement surface imagery, sensor resolution is a key acquisition parameter: the same physical crack can appear markedly different at different spatial samplings. Accordingly, it is necessary to assess the effectiveness of the proposed method across datasets and sensors with varying resolutions. Secondly, despite the overall gains, the performance on thin and low-contrast cracks remained modest. Figure 8 shows two typical failures found in the test. Figure 8a shows an image with no crack, where the model falsely predicted parts of the pavement texture as cracks, likely because those texture features lay between the background and low-contrast crack distributions learned from the dataset. Figure 8b shows “cracks” along lane markings that were misclassified as actual cracks, plausibly due to insufficient negative/edge cases for lane-mark artifacts. These issues also suggest a need for larger, more diverse training data and better consensus masks to reduce false positives in visually ambiguous regions.
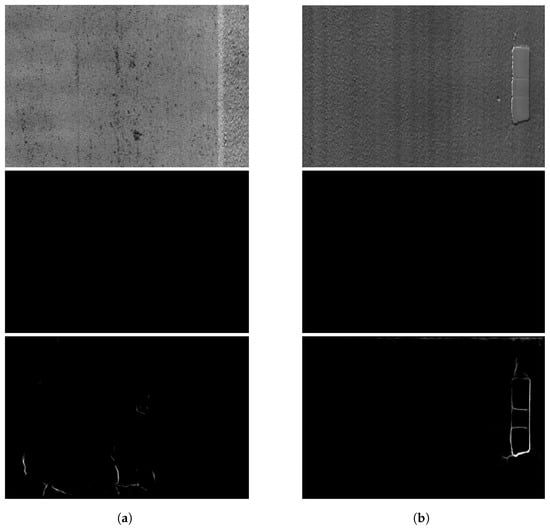
Figure 8.
Sample failures of the proposed model: (a) false positive due to complex background, and (b) false positive due to limited data coverage. From top to bottom: 3D image, ground truth, and prediction from the proposed model.
7. Conclusions
This study investigated the key factors that influence the performance of deep learning models for pavement crack segmentation. Using a 3D pavement surface image dataset along with benchmark datasets, several segmentation architectures were evaluated, and targeted modifications were proposed to enhance segmentation accuracy.
A modified U-Net architecture was developed by incorporating multi-resolution feature extraction and attention-guided skip connections. The proposed model outperformed several SOTA architectures, including FCN, U-Net, DeepLab, DeepCrack, and CrackFormer. It achieved an overall F1-score of 0.780 on the 3D dataset, improving upon the baseline of 0.733, and it demonstrated substantial gains in detecting thin cracks, increasing the F1-score from 0.531 to 0.626. The model also showed strong generalization to benchmark datasets over CRKWH100 and CrackTree260.
The results show that segmentation performance is closely related to crack characteristics, particularly width and contrast. Among the three evaluated crack categories (thick, thin, and low-contrast), thin cracks are consistently the most difficult to segment due to their narrow geometry and low contrast. Effective segmentation of thin cracks requires preserving high-resolution spatial information throughout the network. Models that rely heavily on downsampling and simple interpolation often fail to retain fine spatial details, which limits their ability to detect these challenging crack categories. Therefore, preserving spatial fidelity during both feature extraction and reconstruction appears to be essential for improving segmentation performance.
While the proposed model demonstrated notable improvements, its ability to segment extremely thin cracks remains limited, and the evaluation was conducted on a comparatively small dataset, which may affect the generalizability of the findings. Future work should prioritize the hard cases, especially thin cracks, by exploring strategies aimed at further enhancing the detection of these fine-scale features. Approaches such as edge-aware modules, boundary-sensitive loss functions, or specialized supervision techniques may offer potential benefits. Accordingly, to quantify perceptual and boundary fidelity, future work should report structure- and boundary-aware metrics (e.g., SSIM, Boundary F1) alongside the current pixel-wise measures. Evaluating model behavior under more diverse pavement textures may help improve robustness and applicability in real-world scenarios. Additionally, while this study prioritized detection performance, future research may consider integrating efficiency to support real-time deployment.
Author Contributions
Conceptualization, H.G. and F.W.; methodology, H.G. and J.T.; software, H.G.; validation, H.G., J.T. and X.L.; formal analysis, H.G.; investigation, H.G.; resources, F.W.; data curation, H.G.; writing—original draft preparation, H.G.; writing—review and editing, H.G. and F.W.; visualization, H.G.; supervision, F.W.; project administration, F.W.; funding acquisition, F.W. All authors have read and agreed to the published version of the manuscript.
Funding
This research was funded by the National Science Foundation under Grant #2213694 and Texas State University under Grant 9-2244.
Data Availability Statement
The 3D dataset developed for this study will be made available by the authors on request. The open-sourced datasets, CrackTree260 and CRKWH100, are available in DeepCrack at https://github.com/qinnzou/DeepCrack, accessed on 24 August 2025.
Conflicts of Interest
The authors declare no conflicts of interest.
References
- Yao, X.; Yao, M.; Xu, B. Automated measurements of road cracks using line-scan imaging. J. Test. Eval. 2011, 39, 621–629. [Google Scholar] [CrossRef]
- Zhang, A.; Wang, K.; Li, B.; Yang, E.; Dai, X.; Peng, Y.; Fei, Y.; Liu, Y.; Li, J.; Chen, C. Automated pixel-level pavement crack detection on 3D asphalt surfaces using a deep-learning network. Comput.-Aided Civ. Infrastruct. Eng. 2017, 32, 805–819. [Google Scholar] [CrossRef]
- Zhu, S.; Xia, X.; Zhang, Q.; Belloulata, K. An image segmentation algorithm in image processing based on threshold segmentation. In Proceedings of the 3rd International IEEE Conference on Signal-Image Technologies and Internet-Based System, Shanghai, China, 16–18 December 2007; pp. 673–678. [Google Scholar]
- Oliveira, H.; Correia, P. Automatic road crack segmentation using entropy and image dynamic thresholding. In Proceedings of the 17th European Signal Processing Conference, Glasgow, UK, 24–28 August 2009; pp. 622–626. [Google Scholar]
- Ayenu-Prah, A.; Attoh-Okine, N. Evaluating pavement cracks with bidimensional empirical mode decomposition. EURASIP J. Adv. Signal Process. 2008, 2008, 861701. [Google Scholar] [CrossRef]
- Wang, K.; Li, Q.; Gong, W. Wavelet-based pavement distress image edge detection with a trous algorithm. Transp. Res. Rec. 2007, 2024, 73–81. [Google Scholar] [CrossRef]
- Huang, Y.; Xu, B. Automatic inspection of pavement cracking distress. J. Electron. Imaging 2006, 15, 013017. [Google Scholar] [CrossRef]
- Zhou, Y.; Wang, F.; Meghanathan, N.; Huang, Y. Seed-based approach for automated crack detection from pavement images. Transp. Res. Rec. 2016, 2589, 162–171. [Google Scholar] [CrossRef]
- Tsai, Y.; Kaul, V.; Mersereau, R. Critical assessment of pavement distress segmentation methods. J. Transp. Eng. 2010, 136, 11–19. [Google Scholar] [CrossRef]
- Zou, Q.; Cao, Y.; Li, Q.; Mao, Q.; Wang, S. CrackTree: Automatic crack detection from pavement images. Pattern Recognit. Lett. 2012, 33, 227–238. [Google Scholar] [CrossRef]
- Dung, C.V.; Anh, L. Autonomous concrete crack detection using deep fully convolutional neural network. Autom. Constr. 2019, 99, 52–58. [Google Scholar] [CrossRef]
- Yang, X.; Li, H.; Yu, Y.; Luo, X.; Huang, T.; Yang, X. Automatic pixel-level crack detection and measurement using fully convolutional network. Comput.-Aided Civ. Infrastruct. Eng. 2018, 33, 1090–1109. [Google Scholar] [CrossRef]
- Bang, S.; Park, S.; Kim, H.; Kim, H. Encoder–decoder network for pixel-level road crack detection in black-box images. Comput.-Aided Civ. Infrastruct. Eng. 2019, 34, 713–727. [Google Scholar] [CrossRef]
- Jenkins, M.; Carr, T.; Iglesias, M.; Buggy, T.; Morison, G. A deep convolutional neural network for semantic pixel-wise segmentation of road and pavement surface cracks. In Proceedings of the 26th European Signal Processing Conference (EUSIPCO), Rome, Italy, 3–7 September 2018; pp. 2120–2124. [Google Scholar]
- Zou, Q.; Zhang, Z.; Li, Q.; Qi, X.; Wang, Q.; Wang, S. Deepcrack: Learning hierarchical convolutional features for crack detection. IEEE Trans. Image Process. 2018, 28, 1498–1512. [Google Scholar] [CrossRef] [PubMed]
- Zhang, K.; Zhang, Y.; Cheng, H. Self-supervised structure learning for crack detection based on cycle-consistent generative adversarial networks. J. Comput. Civ. Eng. 2020, 34, 04020004. [Google Scholar] [CrossRef]
- Pan, Z.; Lau, S.L.; Yang, X.; Guo, N.; Wang, X. Automatic pavement crack segmentation using a generative adversarial network (GAN)-based convolutional neural network. Results Eng. 2023, 19, 101267. [Google Scholar] [CrossRef]
- Liu, H.; Yang, J.; Miao, X.; Mertz, C.; Kong, H. Crackformer network for pavement crack segmentation. IEEE Trans. Intell. Transp. Syst. 2023, 24, 9240–9252. [Google Scholar] [CrossRef]
- Zhang, Y.; Liu, C. Network for robust and high-accuracy pavement crack segmentation. Autom. Constr. 2024, 162, 105375. [Google Scholar] [CrossRef]
- Zhang, A.; Wang, K.; Fei, Y.; Liu, Y.; Chen, C.; Yang, G.; Li, J.; Yang, E.; Qiu, S. Automated pixel-level pavement crack detection on 3D asphalt surfaces with a recurrent neural network. Comput.-Aided Civ. Infrastruct. Eng. 2019, 34, 213–229. [Google Scholar] [CrossRef]
- Wen, T.; Lang, H.; Ding, S.; Lu, J.J.; Xing, Y. PCDNet: Seed operation–based deep learning model for pavement crack detection on 3D asphalt surface. J. Transp. Eng. Part B Pavements 2022, 148, 04022023. [Google Scholar] [CrossRef]
- Gui, R.; Sun, Q.; Wu, W.; Zhang, D.; Li, Q. Transfer learning for cross-scene 3D pavement crack detection based on enhanced deep edge features. Eng. Appl. Artif. Intell. 2023, 123, 106452. [Google Scholar] [CrossRef]
- Ding, S.; Lang, H.; Chen, J.; Yuan, Y.; Lu, J. Automated crack segmentation on 3D asphalt surfaces with richer attention and hybrid pyramid structures. Int. J. Pavement Eng. 2023, 24, 2246097. [Google Scholar] [CrossRef]
- Cai, J.; Ding, S.; Zhang, Q.; Liu, R.; Zeng, D.; Zhou, L. Broken ice circumferential crack estimation via image techniques. Ocean Eng. 2022, 259, 111735. [Google Scholar] [CrossRef]
- Zhou, L.; Cai, J.; Ding, S. The identification of ice floes and calculation of sea ice concentration based on a deep learning method. Remote Sens. 2023, 15, 2663. [Google Scholar] [CrossRef]
- Wang, B.; Yang, M.; Cao, P.; Liu, Y. A novel embedded cross framework for high-resolution salient object detection. Appl. Intell. 2025, 55, 277. [Google Scholar] [CrossRef]
- Deng, J.; Liu, S.; Chen, H.; Chang, Y.; Yu, Y.; Ma, W.; Wang, Y.; Xie, H. A Precise Method for Identifying 3D Circles in Freeform Surface Point Clouds. IEEE Trans. Instrum. Meas. 2025, 74, 5023713. [Google Scholar] [CrossRef]
- Gong, H.; Wang, F. Pavement Image Data Set for Deep Learning: A Synthetic Approach. In Proceedings of the 2021 ASCE Airfield and Highway Pavements Conference, Online, 8–10 June 2021; pp. 253–263. [Google Scholar]
- Long, J.; Shelhamer, E.; Darrell, T. Fully convolutional networks for semantic segmentation. In Proceedings of the 2015 IEEE Conference on Computer Vision and Pattern Recognition, Boston, MA, USA, 7–12 June 2015; pp. 3431–3440. [Google Scholar]
- Ronneberger, O.; Fischer, P.; Brox, T. U-Net: Convolutional networks for biomedical image segmentation. In Proceedings of the 18th International Conference on Medical Image Computing and Computer-Assisted Intervention, Munich, Germany, 5–9 October 2015; pp. 234–241. [Google Scholar]
- Chen, L.; Papandreou, G.; Kokkinos, I.; Murphy, K.; Yuille, A. Deeplab: Semantic image segmentation with deep convolutional nets, atrous convolution, and fully connected crfs. IEEE Trans. Pattern Anal. Mach. Intell. 2017, 40, 834–848. [Google Scholar] [CrossRef]
- Badrinarayanan, V.; Kendall, A.; Cipolla, R. SegNet: A deep convolutional encoder-decoder architecture for image segmentation. IEEE Trans. Pattern Anal. Mach. Intell. 2017, 39, 2481–2495. [Google Scholar] [CrossRef]
- Oktay, O.; Schlemper, J.; Le Folgoc, L.; Lee, M.; Heinrich, M.; Misawa, K.; Mori, K.; McDonagh, S.; Hammerla, N.Y.; Kainz, B.; et al. Attention U-Net: Learning where to look for the pancreas. arXiv 2018, arXiv:1804.03999. [Google Scholar] [CrossRef]
Disclaimer/Publisher’s Note: The statements, opinions and data contained in all publications are solely those of the individual author(s) and contributor(s) and not of MDPI and/or the editor(s). MDPI and/or the editor(s) disclaim responsibility for any injury to people or property resulting from any ideas, methods, instructions or products referred to in the content. |
© 2025 by the authors. Licensee MDPI, Basel, Switzerland. This article is an open access article distributed under the terms and conditions of the Creative Commons Attribution (CC BY) license (https://creativecommons.org/licenses/by/4.0/).