Article

Constrained Optimal Control of Information Diffusion in Online Social Hypernetworks

1
School of Computer, Qinghai Normal University, Xining 810008, China
2
The State Key Laboratory of Tibetan Intelligence, Xining 810008, China
3
College of Automation & College of Artificial Intelligence, Nanjing University of Posts and Telecommunications, Nanjing 210023, China
*
Author to whom correspondence should be addressed.
Mathematics 2025, 13(17), 2751; https://doi.org/10.3390/math13172751
Submission received: 2 July 2025 / Revised: 31 July 2025 / Accepted: 22 August 2025 / Published: 27 August 2025
(This article belongs to the Special Issue Nonlinear Dynamics and Control: Challenges and Innovations)

Abstract

With the rapid development of online social networks, issues related to information security and public opinion control have increasingly attracted widespread attention. Therefore, this study establishes a constrained optimal control framework for information diffusion in online social networks, based on the S i S a E I R (Susceptible Inactive–Susceptible Active–Exposed–Informed–Recovered) information diffusion model on social hypernetworks. This framework incorporates both cost and triggering constraints, with the goal of optimally regulating the information diffusion process through dynamic intervention strategies. The existence and uniqueness of the optimal solution are theoretically proven, and the corresponding optimal control strategy is derived. The effectiveness and generality of the model are demonstrated through experiments, and the impact of different combinations of control strategies on system performance enhancement is investigated. The results indicate that the proposed control framework can significantly improve system control effectiveness while satisfying all imposed constraints and exhibits strong generalizability. Not only does this study enrich the theoretical foundation of information diffusion control, but it also provides practical theoretical support for addressing real-world issues such as public opinion guidance and commercial marketing in online social networks.

1. Introduction

As essential platforms for communication and information sharing, online social networks are increasingly becoming the central medium for people’s social activities [1,2]. The widespread adoption of the Internet has led to a significant increase in the frequency and spatiotemporal reach of social media use (e.g., on Facebook, Weibo, and Twitter) [3]. Concurrently, as the speed of information dissemination increases, network security issues have gained widespread attention [4,5,6]. This situation underscores the urgent and critical need to effectively control the influence of both positive and negative information within online social networks.
Since Goffman et al. [7] introduced the S I R epidemic model into the study of information diffusion in 1964, nonlinear dynamical models have played a significant role in characterizing the process of information diffusion within social networks [8,9,10]. Positive and negative information diffuse via interactions among user nodes in online social networks, forming a complex and dynamic process [11]. In recent years, significant achievements have been made in areas such as rumor propagation [12,13] and public opinion guidance [14,15], based on classical epidemic models. However, unlike the physical transmission process characteristic of infectious diseases, information diffusion transcends temporal and spatial limitations. Particularly in online social networks, the presence of complex group structures and frequent multi-source information interactions among users gives rise to higher-order dynamic characteristics [16,17]. Therefore, classical epidemic models derived from ordinary binary relational networks are limited in their ability to study information diffusion in online social networks [18]. To address this issue, our team introduced hypergraphs [19] as a mathematical framework and proposed an S i S a E I R information diffusion model. This model aligns with the structural characteristics of social hypernetworks [20] and incorporates the specific features of information diffusion in online social networks. Given that current research primarily focuses on modeling and describing diffusion processes while often lacking systematic analysis of optimal control strategies [21], many findings struggle to bridge the gap between theory and practice in areas such as network security governance and product promotion. Some recent studies have attempted to tackle information diffusion control using game-theoretic frameworks [22], graph-based neural models [23], or resource-constrained optimization techniques [24]. However, these approaches typically emphasize data-driven or heuristic strategies and often lack rigorous mathematical guarantees or interpretability, especially in constrained settings. Therefore, building upon our previous work, this study further investigates optimal control strategies aimed at achieving precise intervention in the diffusion of both positive and negative information. Building on real-world information diffusion processes, we comprehensively consider three key factors: user attributes, environmental attributes, and information attributes [25,26,27]. We integrate their mechanisms of action into the transitions between different diffusion states, enabling more accurate intervention and control of the information diffusion dynamics.
In this study, to more accurately model and intervene in the diffusion process of both positive and negative information, we propose three information control strategies and optimize their intensities using Pontryagin’s Maximum Principle. The research contributions are summarized as follows:
(1) We introduce a novel constrained optimal control framework for information diffusion. Incorporating both cost and triggering constraints, the framework facilitates adaptive regulation of the diffusion process, aiming to optimize resource allocation and maximize system control effectiveness. Compared to traditional methods, this framework demonstrates superior adaptability to the dynamic variations and complex constraints encountered in practical diffusion scenarios.
(2) We utilize an S i S a E I R model grounded in social hypernetworks. This model more accurately captures the higher-order dynamics of information diffusion. Compared to conventional S I R / S E I R models based on pairwise interactions, the hypernetwork approach effectively captures the complex, multi-dimensional relationships among users, leading to more realistic and precise modeling of information diffusion.
(3) Leveraging optimal control theory (specifically Pontryagin’s Maximum Principle), we rigorously prove the existence and uniqueness of the optimal solution. Furthermore, through extensive experimentation, we validate the effectiveness and generalizability of the proposed framework. Additionally, we develop a dedicated evaluation metric for intervention strategies. This metric enables a comprehensive comparative analysis of multiple strategy combinations, highlighting the framework’s robust adaptability and demonstrating its practical utility.
Section 2 reviews related work. Section 3 proposes three information control strategies and presents the system’s objective function (and loss function, if applicable). Section 4 solves the optimal control problem and defines the system benefit metric. Section 5 verifies the optimal control solution experimentally and analyzes the generalizability of the control strategies. Section 6 summarizes the main contributions and outlines future research directions.

2. Related Work

2.1. The S i S a E I R Model on Online Social Hypernetworks

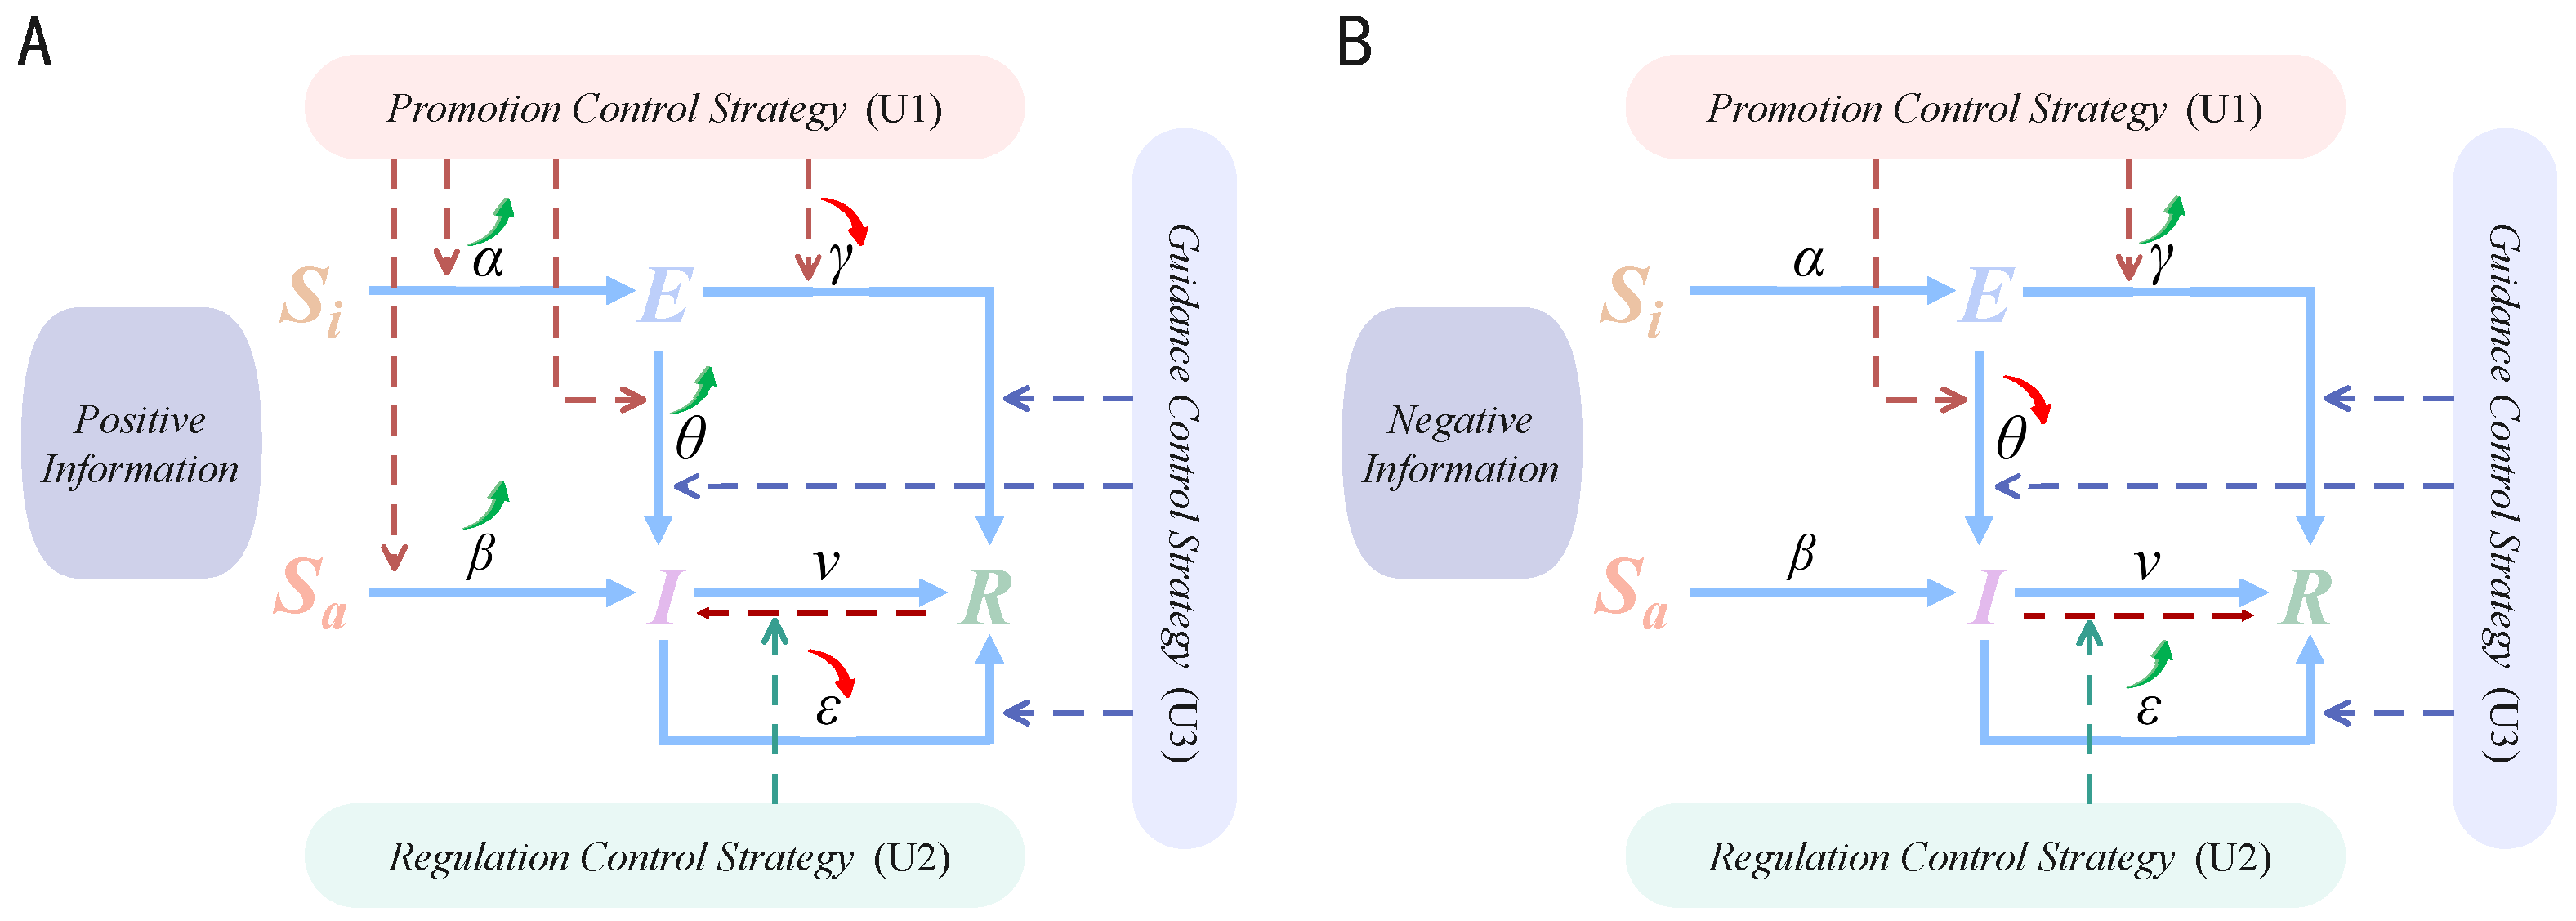
Unlike traditional face-to-face communication, information diffusion in online social networks typically relies on higher-order interactions within social groups [28,29,30]. To realistically simulate this process, our team introduced hypergraphs [31,32,33] to model multi-way user interactions and proposed the S i S a E I R information diffusion model [20]. Figure 1 illustrates the model’s state transitions and corresponding diffusion process in the hypernetwork. Building on classical epidemic models while incorporating online user behaviors, this model refines the Susceptible state (S-state) into two substates: Susceptible Active ( S a -state) and Susceptible Inactive ( S i -state). It retains the Exposed (E-state), Informed (I-state), and Recovered (R-state) states. The E-state denotes users who have received the information but have not yet begun to disseminate it; they may later transition to the I-state to start spreading, or enter the R-state to cease diffusion behavior. The I-state represents users who are aware of the information and are actively disseminating it within the online social network. The R-state refers to users who are aware of the information but no longer engage in its diffusion.
As shown in Figure 1, the state transition relationships among nodes in the S i S a E I R model are as follows:
  • Transition from S i -state to E-state: When a node in the S i -state is adjacent to a node in the I-state, it transitions to the E-state with probability α .
  • Transition from S a -state to I-state: When a node in the S a -state is adjacent to a node in the I-state, it transitions to the I-state with probability β , thereby initiating the dissemination of information.
  • Transition from E-state to I-state or R-state: A node in the E-state transitions to the I-state with probability θ and begins to disseminate information. Additionally, the node may also transition directly to the R-state with probability γ , becoming immune to the information.
  • Transition from I-state to R-state: A node in the I-state transitions to the R-state with probability ε , thereby ceasing the dissemination of information. Furthermore, the node may forget the information at a rate v, resulting in a transition to the R-state and termination of the spreading process.
The S i S a E I R model demonstrates strong modeling advantages and generalizability in characterizing the process of information diffusion within online social hypernetworks. When the parameters γ , v, and β are set to zero, the model degenerates into the classical S E I R model. Furthermore, when the parameters α , γ , θ , and v are all set to zero, it further simplifies to the classical S I R model. Therefore, this model can more accurately describe the user state transition process in complex information diffusion scenarios, highlighting its distinctive structural adaptability and theoretical extensibility.

2.2. Pontryagin’s Maximum (Or Minimum) Principle

Pontryagin’s Maximum (or Minimum) Principle ( P M P ) is one of the foundational results in optimal control theory and is applicable to solving optimization problems with dynamic constraints [34,35]. Consider a simple dynamical system where the state of the system is denoted as x ( t ) R n and the control variable as u ( t ) R m . The system evolves according to a first-order differential equation:
d x ( t ) d t = f ( x ( t ) , u ( t ) , t ) ,
Here, u ( t ) is the control variable, which belongs to a permissible control set U. The objective is to find an optimal control u * ( t ) such that a given performance index (i.e., the objective functional) is maximized(or minimized). This objective functional is typically defined in the Bolza form:
J = 0 T L ( x ( t ) , u ( t ) , t ) d t + Φ ( x ( T ) , T ) ,
Here, L ( x ( t ) , u ( t ) , t ) is the running cost function, referred to as the Lagrangian, which measures the instantaneous cost during the control process. It is commonly used to reflect real-time performance metrics such as energy consumption, resource usage, or time cost. The terminal term Φ ( x ( T ) , T ) represents the cost associated with the terminal state and can be interpreted as a penalty or reward corresponding to the system’s final objective.
To solve this optimization problem, P M P introduces a costate variable (Conjugate variable) λ ( t ) R n , and constructs the Hamiltonian function as follows:
H ( x ( t ) , u ( t ) , λ ( t ) , t ) = λ T f ( x ( t ) , u ( t ) , t ) + L ( x ( t ) , u ( t ) , t ) .
If u * ( t ) is an optimal control and the corresponding optimal state trajectory is x * ( t ) , then there exists a costate trajectory λ ( t ) such that the following necessary conditions are simultaneously satisfied:
Condition 1: State Equation
x ˙ * ( t ) = H λ = f ( x * ( t ) , u * ( t ) , t ) .
Condition 2: Costate Equation (Conjugate Equation)
λ ˙ ( t ) = H x .
Condition 3: Optimality Condition At any time t [ 0 , T ] , the optimal control u * ( t ) must satisfy:
u * ( t ) = arg min u U H ( x * ( t ) , u , λ ( t ) , t ) , for minimization problems , arg max u U H ( x * ( t ) , u , λ ( t ) , t ) , for maximization problems .
Condition 4: Terminal Condition
λ ( T ) = Φ x ( x ( T ) ) .
P M P integrates the state variables, control variables, and costate variables into a hybrid dynamical system, thereby transforming the original optimization problem into a boundary value problem defined by a set of necessary conditions. In practical applications, such as information diffusion control in online social networks, P M P can be employed to design optimal intervention strategies. For instance, by steering control variables to achieve the desired target state at minimal cost, the spread of false information can be effectively suppressed while enhancing the coverage of positive information diffusion, thereby enabling strong guidance and positive regulation of online public opinion [36].
Recent works such as [37,38] have extended Pontryagin’s principle to networked control systems with asymmetric or unreliable communication. These studies provide valuable insights into distributed and decentralized optimization, which inspire our approach. Differing from them, this paper applies Pontryagin’s principle to information diffusion in hypernetworks, incorporating cost and triggering constraints, thus expanding the applicability of optimal control theory in complex social systems.

3. Our Control Model

Information diffusion in online social hypernetworks is characterized by indirect transmission, wide reach, and rapid propagation [39,40]. Traditional models often neglect the heterogeneity in user behavior, limiting their ability to capture fine-grained diffusion dynamics. To address this, we extend the S i S a E I R model by incorporating three key influencing factors—user attributes, environmental attributes, and information attributes—each corresponding to a targeted control strategy.
The rationale behind this mapping is grounded in behavioral network theory. User attributes, such as interest and cognitive ability, influence initial engagement, aligning with the focus of Promotion Control. Environmental factors, including peer influence and social conformity, shape collective behavior, which is addressed through Regulation Control. Lastly, Guidance Control targets the intrinsic features of information—such as novelty or emotional valence—that govern its virality.

3.1. Information Diffusion Model with Control Strategies

We observe that in online social hypernetworks, users’ behaviors in receiving and diffusing information are influenced not only by their individual characteristics, but also by the surrounding public opinion environment and the intrinsic value of the information itself, as illustrated in Figure 2. Based on this observation, we consider the impact of three categories of factors—user attributes, environmental attributes, and information attributes—on the information diffusion process.
User attributes refer to individual features and subjective judgment factors during information exposure [41], such as the level of interest in the information or the user’s ability to assess its credibility. Environmental attributes capture the influence of the overall public opinion climate within the social network [42]. For example, the diffusion of negative public opinion may stimulate uninformed users to participate in the diffusion of negative information, while the widespread dissemination of positive information can help curb the diffusion of negativity. Information attributes reflect the inherent diffusivity and timeliness of the content itself [43]. For instance, topics related to public livelihood issues tend to trigger more extensive and sustained dissemination than personal or routine information.
To design targeted control strategies based on attribute factors, we define the influence of various attribute factors on state transitions within the online social hypernetwork as follows:
  • Users in the S i -stateand S a -state primarily undergo state transitions upon initial exposure to information under the influence of user attributes, such as individual judgment ability and interest in the information.
  • Users in the E-state, regarded as swing users who may transition to either the I-state or R-state, are influenced by a broader range of factors, including user attributes, environmental attributes, and information attributes.
  • Users in the I-state, as active disseminators of information, exhibit varying levels of enthusiasm for diffusing information, which are affected by both information attributes and environmental attributes.
Considering the influence of attribute factors on user state transitions, this paper introduces modified transition probabilities α 0 , β 0 , θ 0 , γ 0 , and ε 0 on the basis of the original transition probabilities, to reflect the impact of attribute factors. The optimized dynamical system is defined by the following differential equations:
d S i d t = α 0 · S i · I d S a d t = β 0 · S a · I d E d t = α 0 · S i · I θ 0 · E γ 0 · E d I d t = β 0 · S a · I + θ 0 · E ν · I ε 0 · I d R d t = γ 0 · E + ν · I + ε 0 · I ,
Here, α 0 , β 0 , θ 0 , γ 0 , and ε 0 denote the state transition probabilities influenced by attribute factors. The initial conditions satisfy S i ( 0 ) 0 , S a ( 0 ) 0 , E ( 0 ) 0 , I ( 0 ) 0 , and R ( 0 ) 0 , and the system obeys the constraint:
S i ( t ) + S a ( t ) + E ( t ) + I ( t ) + R ( t ) = 1 .
Based on the above analysis, we propose three information control strategies to achieve precise control over information diffusion. The mechanisms and expected effects of applying these control strategies to the S i S a E I R model are illustrated in Figure 3.
Promotion Control Strategy: The Promotion Control Strategy, denoted as u 1 ( t ) , is applied to both positive and negative information through user-level interventions based on user attributes. For positive information, this strategy focuses on optimizing content presentation during the initial dissemination phase. By delivering information through more engaging formats, it aims to enhance user interest, thus facilitating wider diffusion across the network. It primarily affects users in the S i -, S a -, and E-states. For negative information, the strategy targets E-state users who have received but not disseminated the content. Through targeted educational campaigns, it enhances users’ critical literacy toward negative content, reducing its propagation probability. This approach achieves effective control during early and intermediate stages of positive information diffusion. However, since negative public opinion in online social networks often emerges unexpectedly, interventions for negative information are primarily concentrated in the intermediate diffusion stage.
Regulation Control Strategy: The Regulation Control Strategy, denoted by u 2 ( t ) , modulates positive and negative information diffusion by leveraging environmental attributes within the public opinion ecosystem. Research indicates that herd behavior significantly influences information diffusion in real-world social networks. When users observe widespread adoption of specific viewpoints in their communities, they tend to rely less on independent judgment and are more likely to follow majority participation patterns. For positive information, this strategy implements virtual incentives (e.g., point systems and honorary badges) to encourage R-state users to re-enter the I-state, expanding diffusion scope and prolonging active periods. For negative information, account restrictions (suspensions or posting limitations) are applied to I-state users, prompting their transition to the R-state. This approach effectively mitigates misinformation spread within online environments.
Guidance Control Strategy: The Guidance Control Strategy, denoted by the control function u 3 ( t ) , regulates the diffusion of positive and negative information at the information layer, accounting for the influence of information attributes on the dissemination process. Information diffusion in online social networks can be abstracted as a process of information energy propagation, where high-quality information typically exhibits a higher energy level, facilitating wider dissemination. Building on this concept, this strategy primarily performs optimization targeting the information content itself, focusing on influencing user groups in the E-state and I-state. For positive information, content optimization enhances quality to increase its energy level and promote its diffusion. For negative information, the energy level is reduced by limiting the exposure of related content, thus suppressing its spread.
In online social hypernetworks, u 1 ( t ) , u 2 ( t ) , and u 3 ( t ) are adjusted by administrators at any time t. Considering the current technological limitations, especially under constrained intervention costs, the intensity of control cannot be infinite. Moreover, in practical operations, control strategies are not triggered in a fully real-time manner throughout the entire process. Since the implementation of control strategies typically depends on the current state of the system and administrative decision-making, their activation is subject to specific conditions. For example, in certain scenarios, when the number of disseminators of negative information becomes excessive, additional intervention may be required; whereas in other cases, when the diffusion of negative information remains at a low level, the control strategies may not be activated immediately. Therefore, the control strategies are dynamically triggered during implementation according to the evolving real-time state of the system.
To achieve efficient intervention and control of the positive and negative information diffusion process, two types of constraints are introduced for the control variables u 1 ( t ) , u 2 ( t ) , and u 3 ( t ) in this study:
  • Cost Constraint: Reflects the limits imposed by available resources and intervention costs, expressed as upper and lower bounds on the control variables.
  • Triggering Constraint: A mechanism whereby control strategies are activated only when specific diffusion state conditions are satisfied, formally represented as complementarity conditions.
  • Cost Constraint
To ensure the rationality of control intensity, it is assumed that at any time t [ 0 , T ] , the three types of control strategies must satisfy the following upper and lower bound restrictions, with their value ranges governed by the cost coefficients n ^ , c ^ , s ^ [ 0 , 1 ] .
0 u 1 ( t ) n ^ · Λ 1 ( t ) ,
0 u 2 ( t ) c ^ · Λ 2 ( t ) ,
0 u 3 ( t ) s ^ · Λ 3 ( t ) .
Here, Λ 1 ( t ) , Λ 2 ( t ) , and Λ 3 ( t ) are upper bound regulation variables associated with the diffusion variables.
  • Positive information
    Λ 1 ( t ) = S i ( t ) + S a ( t ) + E ( t ) ,
    Λ 2 ( t ) = R ( t ) ,
    Λ 3 ( t ) = E ( t ) + I ( t ) .
  • Negative information
    Λ 1 ( t ) = E ( t ) ,
    Λ 2 ( t ) = I ( t ) ,
    Λ 3 ( t ) = E ( t ) + I ( t ) .
2.
Triggering Constraint
To represent the constraint concept that control strategies can only be activated under specific conditions, a triggering function g i ( t ) is further introduced, and the following standard complementarity constraint is imposed on each control variable:
u 1 ( t ) 0 , g 1 ( t ) 0 , u 1 ( t ) · g 1 ( t ) = 0 ,
u 2 ( t ) 0 , g 2 ( t ) 0 , u 2 ( t ) · g 2 ( t ) = 0 .
For the Guidance Control Strategy u 3 ( t ) , since its activation is driven by two independent triggering conditions, the complementarity constraint can be expressed as:
u 3 ( t ) 0 , g 3 1 ( t ) 0 , g 3 2 ( t ) 0 , u 3 ( t ) · g 3 1 ( t ) = 0 or u 3 ( t ) · g 3 2 ( t ) = 0 .
The above complementarity conditions reflect the following logic:
  • When g i ( t ) < 0 , the triggering condition is not satisfied, and the control intensity u i ( t ) = 0 .
  • When g i ( t ) = 0 , the control variable is free to take values within its defined upper bound.
  • When g i ( t ) > 0 , the triggering condition is not met; this case falls outside the feasible domain of the constraint and need not be considered in the model.
The specific forms of the triggering functions are as follows (taking positive information as an example):
g 1 ( t )   : = τ 1 S i ( t ) + S a ( t ) + E ( t ) 0 ,
g 2 ( t )   : = τ 2 S i ( t ) + S a ( t ) + E ( t ) 0 ,
g 3 1 ( t )   : = τ 3 E ( t ) 0 ,
g 3 2 ( t )   : = R ( t ) 1 0 .
Here, τ 1 , τ 2 , τ 3 [ 0 , 1 ] are the threshold values for control activation.
By integrating the constraints with the diffusion model, a constrained positive and negative information diffusion control framework is established for online social networks. The differential dynamic equations of this framework differ for positive and negative information control, and can be reformulated as follows:
For the control of positive information, its differential dynamic equations are expressed as follows:
d S i d t = α ( t ) · S i · I d S a d t = β ( t ) · S a · I d E d t = α ( t ) · S i · I θ ( t ) + γ ( t ) · E d I d t = β ( t ) · S a · I + θ ( t ) · E ν · I ε ( t ) · I + σ 1 · u 2 ( t ) · R d R d t = γ ( t ) · E + ν · I + ε ( t ) · I σ 1 · u 2 ( t ) · R .
Here, α ( t ) , β ( t ) , θ ( t ) , γ ( t ) , and ϵ ( t ) are time-varying diffusion parameters influenced by the control strategies, with their expressions given as follows:
α ( t ) = α 0 + φ 1 · u 1 ( t ) ,
β ( t ) = β 0 + φ 2 · u 1 ( t ) ,
θ ( t ) = θ 0 + φ 3 · u 1 ( t ) + ξ 1 · u 3 ( t ) ,
γ ( t ) = γ 0 φ 4 · u 1 ( t ) ξ 2 · u 3 ( t ) ,
ε ( t ) = ε 0 ξ 3 · u 3 ( t ) .
For the control of negative information, its differential dynamic equations are expressed as follows:
d S i d t = α 0 · S i · I d S a d t = β 0 · S a · I d E d t = α 0 · S i · I θ ( t ) + γ ( t ) · E d I d t = β · S a · I + θ ( t ) · E ν · I ε ( t ) · I σ 2 · u 2 ( t ) · I d R d t = γ ( t ) · E + ν · I + ε ( t ) · I + σ 2 · u 2 ( t ) · I .
Here, θ ( t ) , γ ( t ) , and ϵ ( t ) are time-varying diffusion parameters influenced by the control strategies, with their expressions given as follows:
θ ( t ) = θ 0 φ 5 · u 1 ( t ) ξ 4 · u 3 ( t ) ,
γ ( t ) = γ 0 + φ 6 · u 1 ( t ) + ξ 5 · u 3 ( t ) ,
ε ( t ) = ε 0 + ξ 6 · u 3 ( t ) .
Here, φ 1 φ 6 represent the success rates of the Promotion Control Strategy under different conditions, σ 1 and σ 2 represent the success rates of the Regulation Control Strategy under different conditions, and ξ 1 ξ 6 represent the success rates of the Guidance Control Strategy under different conditions. The value range of all these coefficients is [ 0 , 1 ] .

3.2. System Benefit Analysis

To achieve maximum benefit for the information diffusion system at minimal cost, a system objective function is defined for the control of positive information, and a system loss function is defined for the control of negative information. The system’s overall benefit is divided into two components: the benefit or loss generated by informed individuals, and the cost incurred by the implementation of control strategies. For the sake of analytical tractability and solvability, the control cost functions are assumed to take a quadratic form [44,45,46,47]. The cost function of the Promotion Control Strategy is denoted as C 1 [ u 1 ( t ) ] , that of the Regulation Control Strategy as C 2 [ u 2 ( t ) ] , and that of the Guidance Control Strategy as C 3 [ u 3 ( t ) ] . The cost weights of the three control strategies are denoted by k 1 , k 2 , and k 3 , respectively.
C 1 [ u 1 ( t ) ] = 1 2 · k 1 · u 1 2 ( t ) C 2 [ u 2 ( t ) ] = 1 2 · k 2 · u 2 2 ( t ) C 3 [ u 3 ( t ) ] = 1 2 · k 3 · u 3 2 ( t ) ,
Over the time interval [ 0 , T ] , the system objective function brought by positive information can be expressed as:
J P = 0 T B ( I ( t ) , E ( t ) , R ( t ) ) C 1 [ u 1 ( t ) ] C 2 [ u 2 ( t ) ] C 3 [ u 3 ( t ) ] d t ,
B ( I ( t ) , E ( t ) , R ( t ) ) = b I · I ( t ) + b E · E ( t ) + b R · R ( t ) .
Here, B ( I ( t ) , E ( t ) , R ( t ) ) denotes the benefit brought to the system by the three information-aware states, and b I , b E , and b R represent the benefit weights of each state. The system benefit is obtained by subtracting the control costs from the benefit of positive information.
Over the time interval [ 0 , T ] , the system loss function caused by negative information can be expressed as:
J N = 0 T D ( I ( t ) , E ( t ) , R ( t ) ) + C 1 [ u 1 ( t ) ] + C 2 [ u 2 ( t ) ] + C 3 [ u 3 ( t ) ] d t
D ( I ( t ) , E ( t ) , R ( t ) ) = c I · I ( t ) + c E · E ( t ) + c R · R ( t )
Here, D ( I ( t ) , E ( t ) , R ( t ) ) denotes the loss brought to the system by the three information-aware states, and c I , c E , and c R represent the loss weights of each state. The system loss is calculated as the sum of the loss caused by negative information and the control costs.
In summary, the optimal control problem of information diffusion with constraints in an online social hypernetwork can be formulated, with the cases of positive and negative information denoted as P P and P N , respectively.
P P J P ( u 1 * ( t ) , u 2 * ( t ) , u 3 * ( t ) ) = max u 1 ( t ) , u 2 ( t ) , u 3 ( t ) J P ( u 1 ( t ) , u 2 ( t ) , u 3 ( t ) ) , subject to constraints ( 26 ) ( 31 ) ; P N J N ( u 1 * ( t ) , u 2 * ( t ) , u 3 * ( t ) ) = min u 1 ( t ) , u 2 ( t ) , u 3 ( t ) J N ( u 1 ( t ) , u 2 ( t ) , u 3 ( t ) ) , subject to constraints ( 32 ) ( 35 ) .

4. Optimal Control of Positive and Negative Information

In this section, a theoretical analysis is conducted on the constrained optimal control problem of information diffusion proposed in the previous section. The existence and uniqueness of the optimal solution are proved, and the optimal control solution is ultimately derived.

4.1. Optimal Control Intensity Analysis

Due to the high similarity between the optimal control solution processes for positive and negative information, the analysis of optimal control for positive information is presented as a representative example. Firstly, with the aid of optimal control theory, the existence and uniqueness of the solution to the model-based control problem are analyzed. The proof is provided in Appendix A and Appendix B. For the control systems given by Equations (11) and (13) with specified initial values, there exists a unique optimal control pair ( u 1 * ( t ) , u 2 * ( t ) , u 3 * ( t ) ) such that:
J P u 1 * ( t ) , u 2 * ( t ) , u 3 * ( t ) = max u 1 ( t ) , u 2 ( t ) , u 3 ( t ) J P u 1 ( t ) , u 2 ( t ) , u 3 ( t ) ,
After proving the existence and uniqueness of the solution, the Pontryagin Maximum Principle is applied to derive the optimal control in detail, and the unconstrained Hamiltonian function H is constructed:
H = b I · I ( t ) + b E · E ( t ) + b R · R ( t ) 1 2 k 1 u 1 2 ( t ) 1 2 k 2 u 2 2 ( t ) 1 2 k 3 u 3 2 ( t ) + λ S i ( t ) ( α 0 + ϕ 1 u 1 ( t ) ) S i I + λ S a ( t ) ( β 0 + ϕ 2 u 1 ( t ) ) S a I + λ E ( t ) ( α 0 + ϕ 1 u 1 ( t ) ) S i I θ 0 + ϕ 3 u 1 ( t ) + ξ 1 u 3 ( t ) + γ 0 ϕ 4 u 1 ( t ) ξ 2 u 3 ( t ) E + λ I ( t ) ( θ 0 + ϕ 3 u 1 ( t ) + ξ 1 u 3 ( t ) ) E + ( β 0 + ϕ 2 u 1 ( t ) ) S a I ν I ( ϵ 0 ξ 3 u 3 ( t ) ) I + σ 1 u 2 ( t ) R + λ R ( t ) ( γ 0 ϕ 4 u 1 ( t ) ξ 2 u 3 ( t ) ) E + ν I + ( ϵ 0 ξ 3 u 3 ( t ) ) I σ 1 u 2 ( t ) R .
Subsequently, considering control constraints, the Karush–Kuhn–Tucker ( K K T ) conditions are employed. For each control variable u i ( t ) , Lagrange multipliers μ i ( t ) and η i ( t ) are introduced to handle the inequality constraints. Furthermore, to incorporate a control-triggering mechanism, additional multipliers ς i ( t ) are introduced to construct the complementarity conditions. Among them, μ i ( t ) and η i ( t ) are the K K T multipliers corresponding to the lower and upper bounds of the controls, respectively, while ς i ( t ) serves as the Lagrange multiplier for the complementary triggering constraint. By integrating the constraint conditions into the Hamiltonian function, an extended Hamiltonian H ˜ is obtained:
H ˜ = H + μ 1 ( t ) · u 1 ( t ) n ^ S i ( t ) + S a ( t ) + E ( t ) + η 1 ( t ) · 0 u 1 ( t ) + μ 2 ( t ) · u 2 ( t ) c ^ · R ( t ) + η 2 ( t ) · 0 u 2 ( t ) + μ 3 ( t ) · u 3 ( t ) s ^ · E ( t ) + I ( t ) + η 3 ( t ) · 0 u 3 ( t ) + ς 1 ( t ) · u 1 ( t ) · g 1 ( t ) + ς 2 ( t ) · u 2 ( t ) · g 2 ( t ) + ς 3 1 ( t ) · u 3 ( t ) · g 3 1 ( t ) + ς 3 2 ( t ) · u 3 ( t ) · g 3 2 ( t ) .
According to the P M P , the optimal control solution ( u 1 * ( t ) , u 2 * ( t ) , u 3 * ( t ) ) should make H ˜ attain a maximum at all times. In this framework, the costate variables λ ( t ) serve as dynamic analogs of Lagrange multipliers. More specifically, each component λ i ( t ) represents the marginal value or sensitivity of the system’s objective function with respect to changes in the corresponding state variable x i ( t ) at time t In other words, the costate variables quantify how variations in the system states (e.g., the densities of S i -state or I-state users) influence the total system benefit or loss over time. The evolution of the costate variables is governed by the following set of differential equations:
λ ˙ S i = ( λ S i λ E ) · I · ( α 0 + ϕ 1 u 1 ) + μ 1 n ^ + ς 1 ( t ) · u 1 ( t ) + ς 2 ( t ) · u 2 ( t ) ,
λ ˙ S a = ( λ S a λ I ) · I · ( β 0 + ϕ 2 u 1 ) + μ 1 n ^ + ς 1 ( t ) · u 1 ( t ) + ς 2 ( t ) · u 2 ( t ) ,
λ ˙ E = b E + ( θ 0 + ϕ 3 u 1 + ξ 1 u 3 ) ( λ E λ I ) + ( γ 0 ϕ 4 u 1 ξ 2 u 3 ) ( λ E λ R ) + μ 1 n ^ + μ 3 s ^ + ς 1 ( t ) · u 1 ( t ) + ς 2 ( t ) · u 2 ( t ) + ς 3 1 ( t ) · u 3 ( t ) ,
λ ˙ I = b I + ( α 0 + ϕ 1 u 1 ) S i ( λ S i λ E ) + ( β 0 + ϕ 2 u 1 ) S a ( λ S a λ I ) + ( ϵ 0 ξ 3 u 3 ) ( λ I λ R ) + ν ( λ I λ R ) + μ 3 s ^ ,
λ ˙ R = b R + σ 1 u 2 ( λ R λ I ) + μ 2 c ^ ς 3 2 ( t ) · u 3 ( t ) .
No additional terminal cost is considered in this system, and therefore, the following boundary conditions hold:
λ S i ( T ) = λ S a ( T ) = λ E ( T ) = λ I ( T ) = λ R ( T ) = 0 .
According to the P M P , the optimal control solution ( u 1 * ( t ) , u 2 * ( t ) , u 3 * ( t ) ) should satisfy that the partial derivative of the extended Hamiltonian function H ˜ with respect to each control variable u i ( t ) is equal to zero. By taking the partial derivatives of H ˜ with respect to u i ( t ) , the following equations are obtained:
H ˜ u 1 = k 1 u 1 + ϕ 1 S i I ( λ E λ S i ) ϕ 2 S a I ( λ S a λ I ) ϕ 3 E ( λ E λ I ) + ϕ 4 E ( λ E λ R ) + μ 1 η 1 + ς 1 ( t ) g 1 ( t ) = 0 ,
H ˜ u 2 = k 2 u 2 + σ 1 R ( λ I λ R ) + μ 2 η 2 + ς 2 ( t ) g 2 ( t ) = 0 ,
H ˜ u 3 = k 3 u 3 + ξ 1 E ( λ I λ E ) + ξ 2 E ( λ R λ E ) + ξ 3 I ( λ I λ R ) + μ 3 η 3 + ς 3 1 ( t ) g 3 1 ( t ) + ς 3 2 ( t ) g 3 2 ( t ) = 0 .
Considering the constrained nature of the optimal control solution ( u 1 * ( t ) , u 2 * ( t ) , u 3 * ( t ) ) , and in conjunction with the K K T conditions, the symbols Ψ 1 , Ψ 2 , and Ψ 3 are introduced to represent the functions associated with the control variables,
Ψ 1 = ϕ 1 S i I ( λ E λ S i ) ϕ 2 S a I ( λ S a λ I ) ϕ 3 E ( λ E λ I ) + ϕ 4 E ( λ E λ R ) + μ 1 η 1 + ς 1 ( t ) g 1 ( t ) ,
Ψ 2 = σ 1 R ( λ I λ R ) + μ 2 η 2 + ς 2 ( t ) g 2 ( t ) ,
Ψ 3 = ξ 1 E ( λ I λ E ) + ξ 2 E ( λ R λ E ) + ξ 3 I ( λ I λ R ) + μ 3 η 3 + ς 3 1 ( t ) g 3 1 ( t ) + ς 3 2 ( t ) g 3 2 ( t ) .
u 1 * ( t ) = 0 , Ψ 1 < 0 Ψ 1 k 1 , 0 Ψ 1 k 1 n ^ ( S i ( t ) + S a ( t ) + E ( t ) ) n ^ ( S i ( t ) + S a ( t ) + E ( t ) ) , Ψ 1 k 1 > n ^ ( S i ( t ) + S a ( t ) + E ( t ) ) .
u 2 * ( t ) = 0 , Ψ 2 < 0 Ψ 2 k 2 , 0 Ψ 2 k 2 c ^ R ( t ) c ^ R ( t ) , Ψ 2 k 2 > c ^ R ( t ) .
u 3 * ( t ) = 0 , Ψ 3 < 0 Ψ 3 k 3 , 0 Ψ 3 k 3 s ^ ( E ( t ) + I ( t ) ) s ^ ( E ( t ) + I ( t ) ) , Ψ 3 k 3 > s ^ ( E ( t ) + I ( t ) ) .
The expression for the optimal control solution is rewritten as follows:
u 1 * ( t ) = min max 0 , Ψ 1 k 1 , n ^ S i ( t ) + S a ( t ) + E ( t ) ,
u 2 * ( t ) = min max 0 , Ψ 2 k 2 , c ^ R ( t ) ,
u 3 * ( t ) = min max 0 , Ψ 3 k 3 , s ^ E ( t ) + I ( t ) ,
Up to this point, the derivation of the optimal control solution for the constrained optimal control problem of positive information diffusion in the online social hypernetwork has been completed. Similarly, the optimal control solution for negative information is given by:
u 1 * ( t ) = min max 0 , Ψ 1 k 1 , n ^ E ( t ) ,
u 2 * ( t ) = min max 0 , Ψ 2 k 2 , c ^ I ( t ) ,
u 3 * ( t ) = min max 0 , Ψ 3 k 3 , s ^ I ( t ) + E ( t ) ,
Ψ 1 = E ( t ) · ϕ 6 · ( λ E λ R ) + E ( t ) · ϕ 5 · ( λ I λ E ) ς 1 ( t ) · g 1 ( t ) ,
Ψ 2 = σ 2 · I · ( λ I λ R ) ς 2 ( t ) · g 2 ( t ) ,
Ψ 3 = E ( t ) · ξ 4 · ( λ I λ E ) + E ( t ) · ξ 5 · ( λ E λ R ) + I ( t ) · ξ 6 · ( λ I λ R ) ς 3 1 ( t ) · g 3 1 ( t ) ς 3 2 ( t ) · g 3 2 ( t ) .
To verify the reliability of the proposed optimal control strategy, we employ Lyapunov stability theory to analyze the global asymptotic stability of the controlled information diffusion system. Consider the closed-loop system under optimal control u * ( t ) = [ u 1 * ( t ) , u 2 * ( t ) , u 3 * ( t ) ] T :
x ˙ = F ( x , u * ( x ) , t ) ,
where x = [ S i , S a , E , I , R ] T denotes the state vector. The following theorem guarantees system stability:
The controlled information diffusion system (26) for positive information (resp. (32) for negative information) is globally asymptotically stable at the equilibrium point x e q under the optimal control law u * ( x ) . See Appendix C for the complete proof.

4.2. Definition of System Performance Metrics

In the control problem of the information diffusion system, in order to accurately evaluate the improvement in system performance under different control strategies, a control effectiveness metric is defined based on the area under the curve derived from the state transition equations. This metric not only considers the effect of information diffusion but also integrates the state transition process of the system and the actual impact of the control strategies. Unlike traditional objective functions or loss functions, the currently defined control effectiveness metric is not directly used as a measure of system gain or loss. Instead, it serves to quantify the relative effectiveness of a control strategy, that is, the improvement brought by the strategy compared to the uncontrolled scenario.
For the positive information diffusion process, the control effectiveness is measured based on the temporal evolution of the state variables S i -state, S a -state, E-state, I-state, and R-state. Specifically, it can be expressed as:
π i = 0 T f ρ S i , t f ρ S a , t + f ρ E , t + f ρ I , t + f ρ R , t d t .
Here, f ( ρ S i , t ) , f ( ρ S a , t ) quantify the negative contribution of the S i -state and S i -state to the overall control effectiveness, as indicated by their negative signs in the integral. Conversely, f ( ρ E , t ) , f ( ρ I , t ) , and f ( ρ R , t ) quantify the positive contribution of the E-state, I-state and R-state reflected by their positive signs. The symbol ρ denotes the density of the corresponding state variable, and T is the time horizon of the control strategy. In the absence of control, the system effectiveness is denoted by π 0 . Therefore, the improvement in effectiveness due to control is measured by the following difference:
Δ π = π i π 0 .
This difference represents the improvement in system effectiveness brought by the control strategy through intervention in the positive information diffusion process, compared to the uncontrolled scenario.
For the diffusion of negative information, the method for calculating effectiveness is similar to that of positive information, but the signs of the considered state variables differ. The control effectiveness metric for negative information can be expressed as:
π i = 0 T f ρ S i , t + f ρ S a , t f ρ E , t f ρ I , t + f ρ R , t d t .
Similar to the case of positive information, the system effectiveness without control is denoted by π 0 , and the improvement brought by the control is also represented by Δ π .
This difference quantifies the improvement in system effectiveness resulting from the intervention of control strategies in the diffusion of negative information. Through the defined control effectiveness metric, the impact of different control strategies on both positive and negative information diffusion can be quantitatively evaluated. This control effectiveness metric is not a "objective function" or "loss function" in the traditional sense, but rather a measure of the change in system effectiveness before and after the implementation of a control strategy, specifically reflecting the actual improvement brought by the strategy.

5. Performance Analysis

In this study, the fourth-order Runge–Kutta method is employed to solve the optimal control solution. The initial state is set by selecting 0.005% of the nodes in the online social network as informed nodes, while the remaining nodes are assigned to the S i -state and S a -state in a ratio of 7:3. To mitigate the effect of randomness, each group of simulation experiments is independently repeated 100 times under identical initial conditions, and the average results are reported. The main parameters related to the experiments in this section are shown in Table 1:

5.1. Effectiveness Analysis of Control Strategies

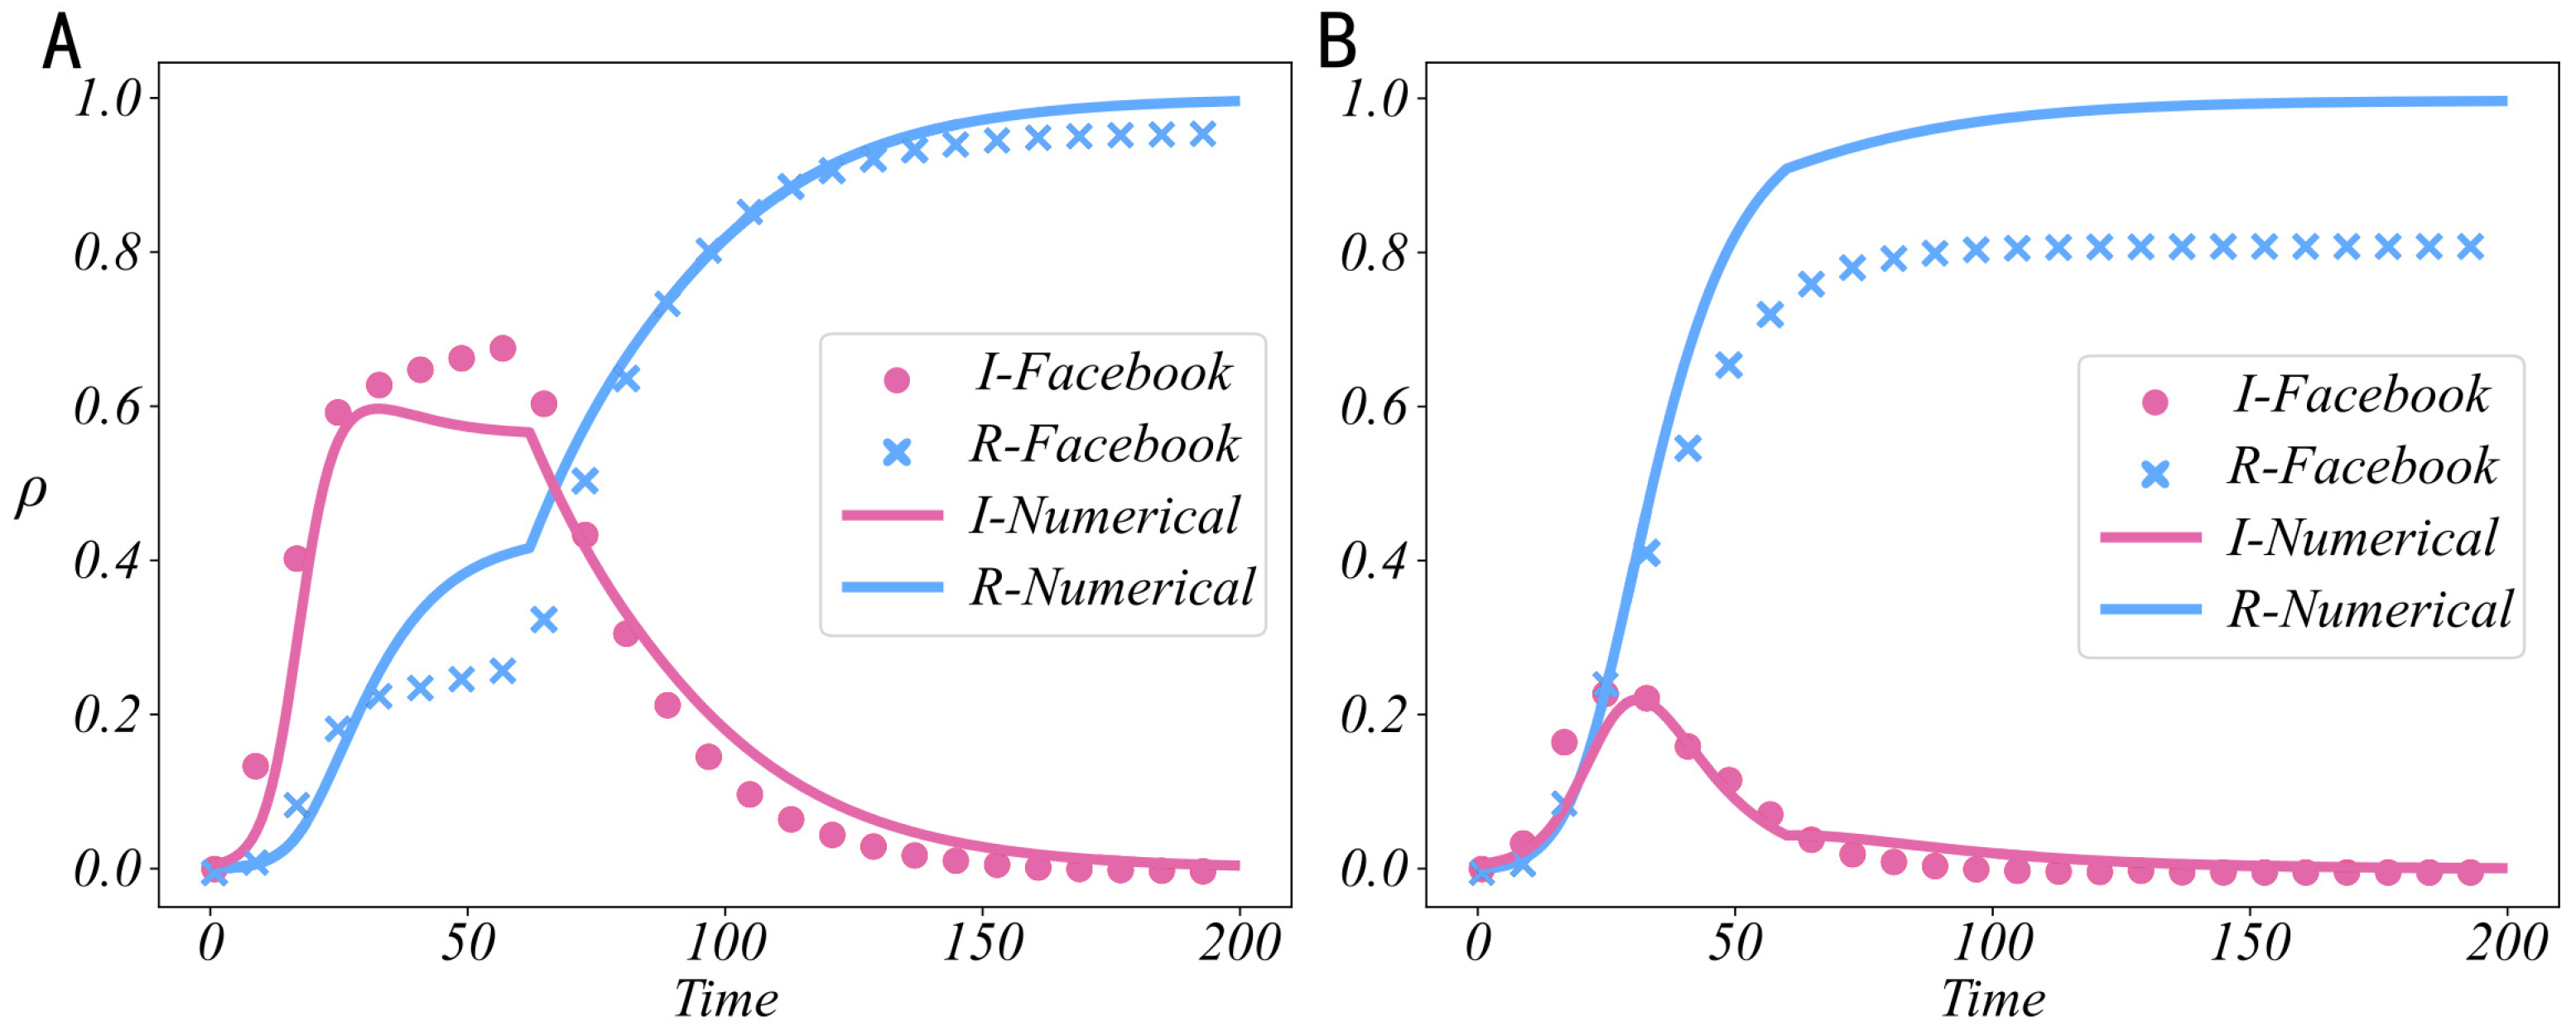
To verify the effectiveness of the proposed control strategies, the actual impact of the strategies on the information diffusion process is evaluated by comparing the dynamics of positive and negative information before and after the implementation of control interventions. To intuitively illustrate the intervention effects of different control strategies, three control strategies u 1 ( t ) , u 2 ( t ) , and u 3 ( t ) are simultaneously activated in the experiments. A real-world Facebook [48] social network dataset provided by Stanford University is adopted as the experimental foundation for systematic empirical analysis and validation. The experimental results are shown in Figure 4.
Figure 4A presents the variation curves of the I-state and R-state after applying control during the diffusion of positive information. The figure shows that, after implementing control in the empirical network, the peak value of the I-state is slightly higher than the theoretical value, while the inflection point of the R-state is slightly lower. This phenomenon is related to the structural characteristics of the Facebook social network dataset. In real social networks, some "celebrity nodes" possess high social influence. Unlike the theoretical model, which assumes all nodes are equally positioned, high-influence nodes generate more pronounced diffusion effects after receiving control, resulting in a higher peak in the I-state and a lower inflection point in the R-state. Similarly, Figure 4B shows that the control effect on negative information in the empirical network outperforms the theoretical prediction. This is because a large number of peripheral nodes exist in social networks; these nodes are less responsive to information diffusion and can be quickly isolated after control is applied, thereby reducing the impact of negative information. This results in a lower steady-state value of the R-state. The experimental results based on the empirical network clearly demonstrate the effectiveness of the control strategies, and also confirm the feasibility of the proposed control framework for positive and negative information in real-world online social networks.

5.2. Benefit Analysis of Control Strategies

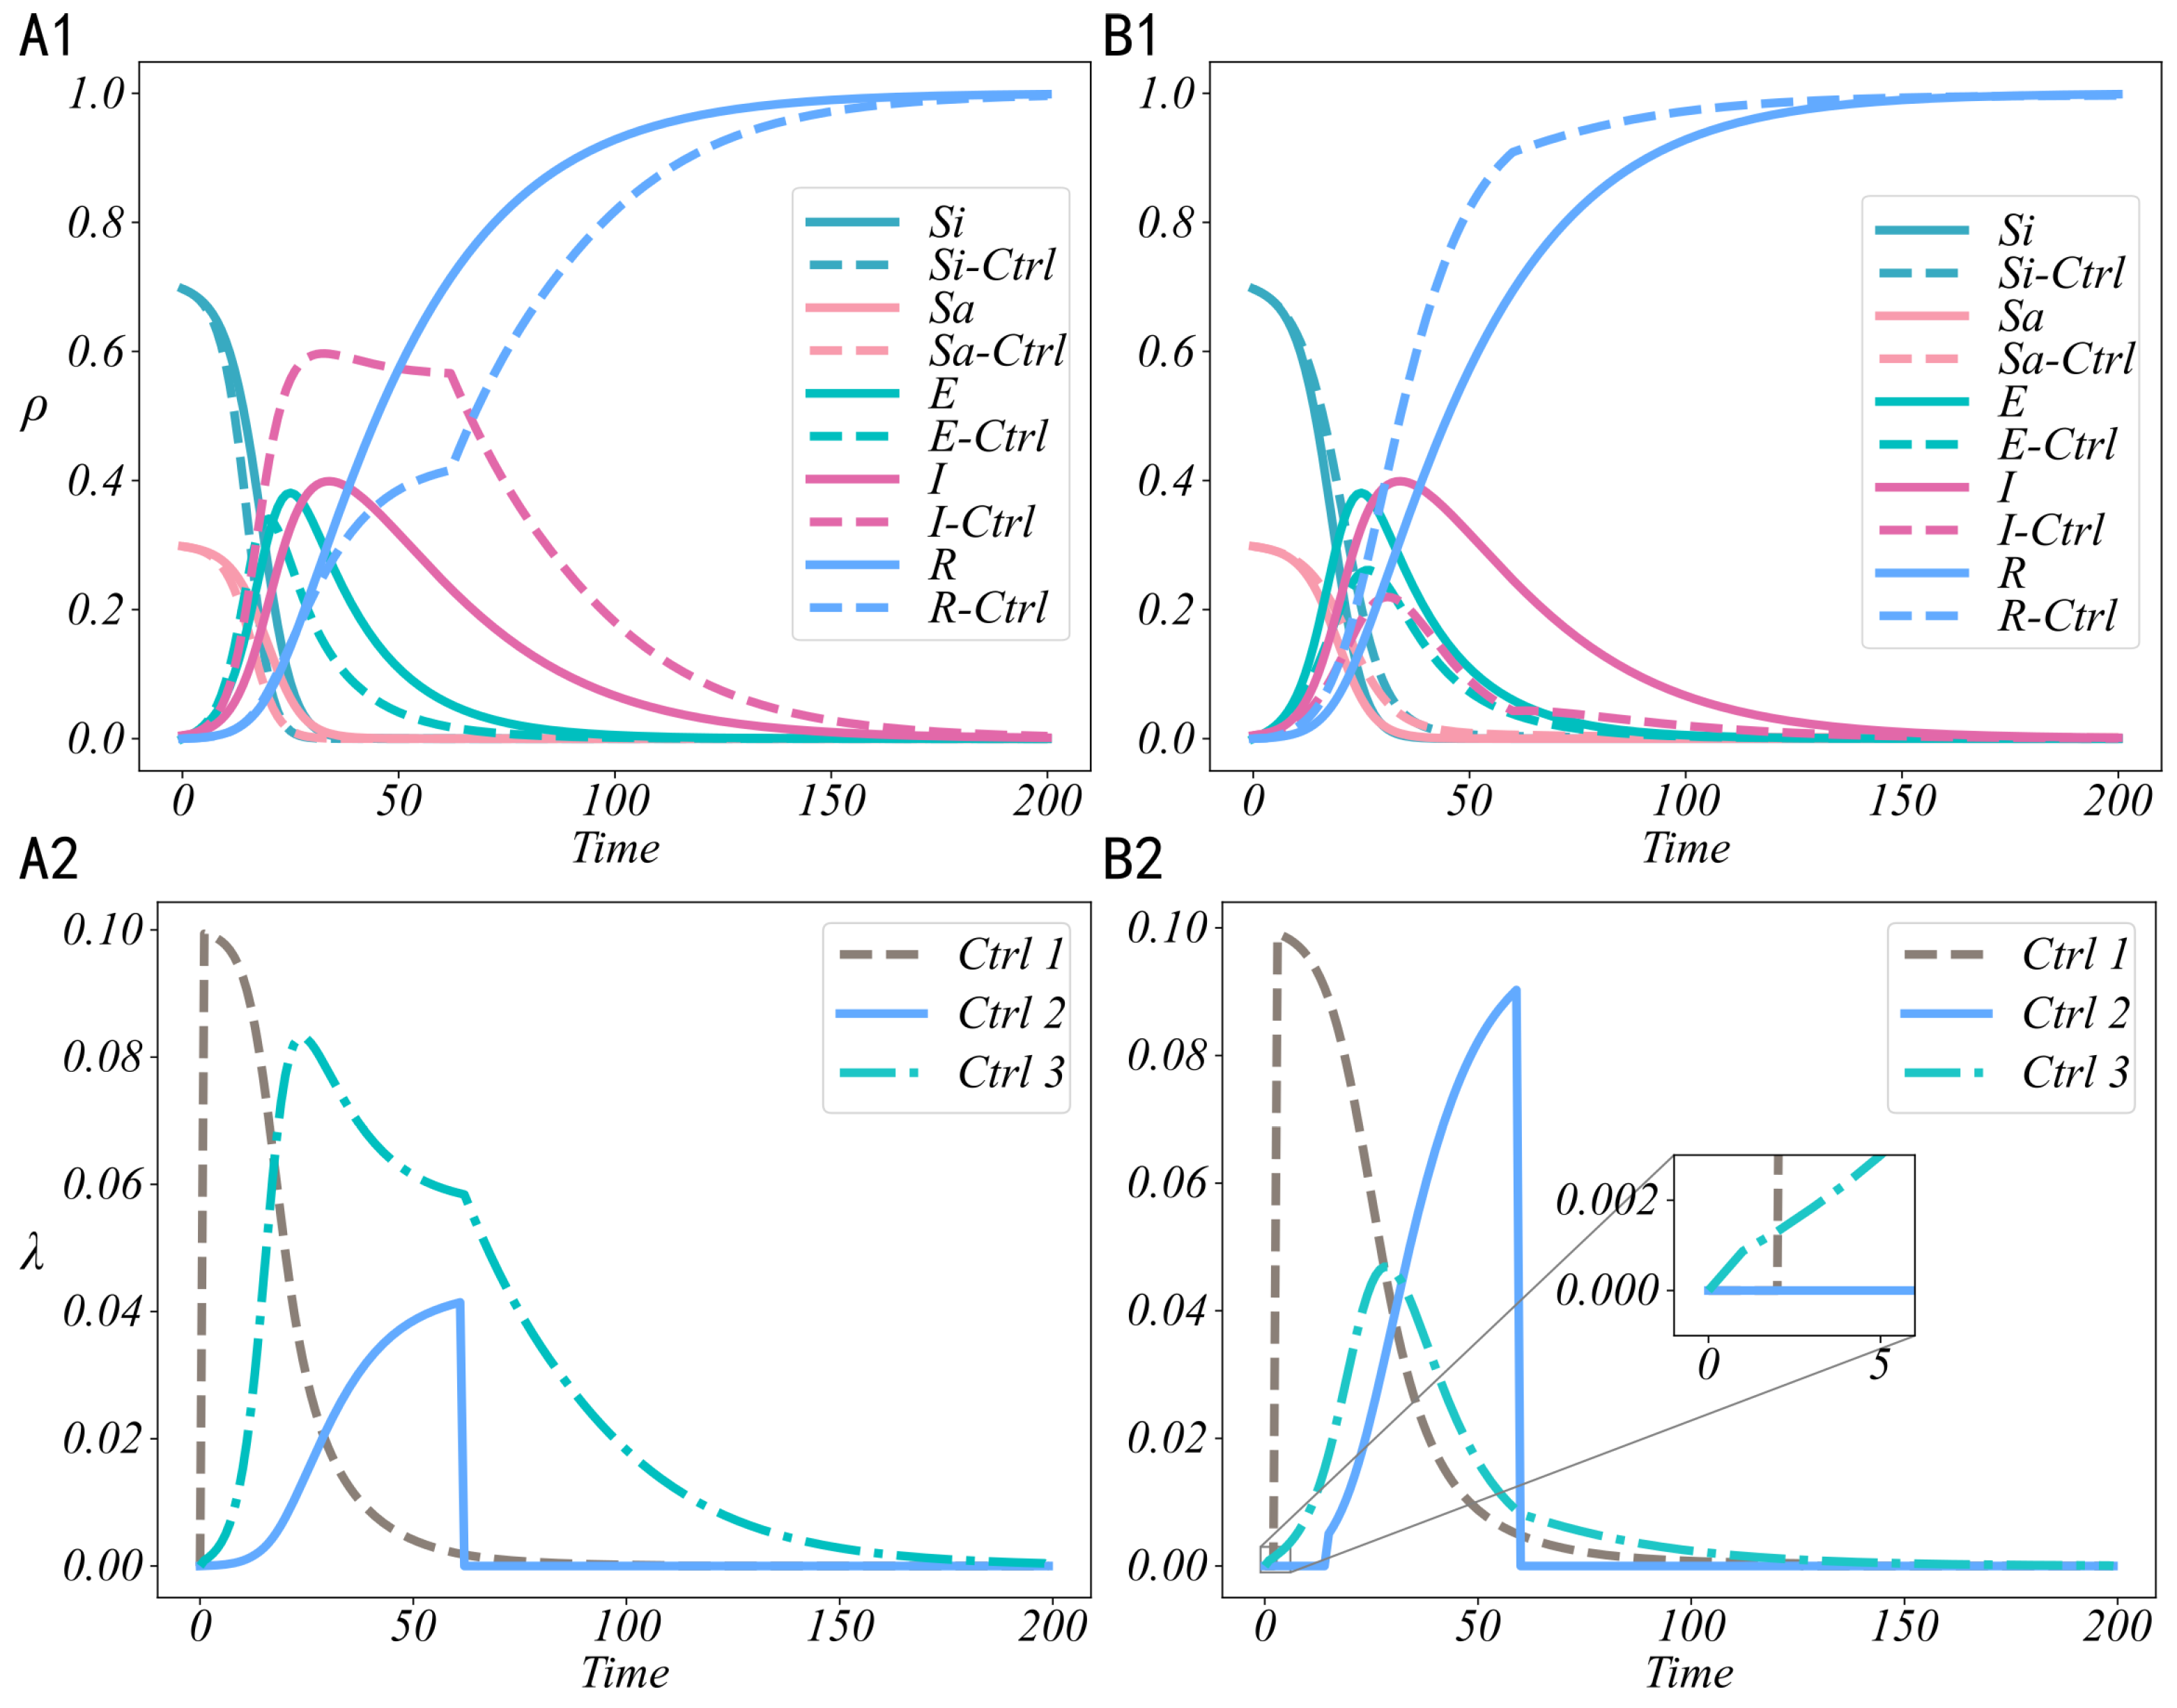
To intuitively demonstrate the improvement in system effectiveness brought by control strategies in the diffusion of positive and negative information, three control strategies are combined to construct seven strategy combination schemes. During the experimental design, both the triggering constraints and cost constraints of control were comprehensively considered, and control effectiveness analysis experiments were conducted. To maintain conciseness and highlight the key findings, Figure 5 only presents the control effectiveness when all three control strategies are activated. The experimental results for the remaining strategy combinations are provided in tabular form to facilitate a direct comparison of their impacts on system effectiveness.
Figure 5(A1) and Figure 5(A2), respectively, illustrate the dynamic evolution of each state variable in the system and the corresponding control intensities over time under the control of positive information. As shown in Figure 5(A1), after the implementation of control strategies, the peak of the I-state increases significantly, and its subsequent decline becomes more gradual. Meanwhile, the growth rate of the R-state slows down compared to the uncontrolled scenario. For the uninformed states S i -state and S a -state, their quantities decrease more rapidly after control intervention, indicating that positive information diffuses more quickly and effectively under the influence of the control strategies. According to the control intensity variations shown in Figure 5(A2), a notable inflection point appears in the curves of the I-state and R-state at the 62nd time step. This is because the u 2 control strategy ceases to be applied at this point due to no longer satisfying the triggering condition, which leads to a sudden change in the evolution trend of the system states.
Figure 5(B1,B2) depict the dynamic evolution of each system state variable and the time-varying characteristics of control intensities under the background of negative information control. As observed from Figure 5(B1), after the implementation of control strategies, the peak of the I-state decreases significantly, with a faster rate of decline; simultaneously, the growth rate of the R-state increases notably compared to the uncontrolled scenario. Following the control intervention, the decreasing trends of the S i -state and S a -state become more gradual, indicating that the diffusion of negative information is effectively suppressed and the control strategies have exerted significant influence. In Figure 5(B2), the red curve reflects the evolution of the u 1 control strategy’s intensity. Unlike the case of positive information control shown in Figure 5(A2), negative information has not yet reached the activation threshold for the u 1 strategy in the early stages of diffusion, and thus this strategy is not triggered initially. Similarly, the u 2 control strategy also remains inactive in the early-stage due to unmet activation conditions, resulting in a sustained zero control intensity during the initial phase.
In the process of controlling the diffusion of both positive and negative information, the three types of control strategies exhibit distinct patterns of intensity variation: the u 1 strategy, once its triggering condition is satisfied, rapidly reaches the upper bound of control intensity and subsequently demonstrates a gradual attenuation trend; the u 2 strategy shows a progressive increase in control intensity upon activation, but at a certain point, due to the triggering condition no longer being met, the control intensity abruptly drops to zero, resulting in control interruption; the u 3 strategy exhibits a pattern in which the control intensity first increases and then gradually weakens, forming a typical rise-and-fall trajectory.
To investigate the enhancement of system effectiveness under different combinations of control strategies for both positive and negative information, experiments were conducted for all strategy combinations. The results are presented in Table 2.
Table 2 presents the variation in system effectiveness under different combinations of control strategies. Specifically, Table A corresponds to the improvement in system effectiveness under the control of positive information, while Table B reflects the change in effectiveness resulting from the control of negative information. It can be directly observed from the table that, based on the defined evaluation metric of system effectiveness, all combinations of control strategies contribute to varying degrees of improvement in the overall system effectiveness. A comprehensive analysis of both positive and negative information cases reveals that the intervention effect of the u 2 control strategy is the most significant, followed by the u 3 control strategy, while the u 1 control strategy exhibits relatively weaker effectiveness. Moreover, by comparing the experimental results of information diffusion control for both positive and negative information, it is evident that the improvement in effectiveness under negative information control is generally superior to that under positive information control, further indicating that the control strategies possess a more substantial practical impact in suppressing the diffusion of negative information in social networks.

5.3. Sensitivity Analysis of Control Strategies

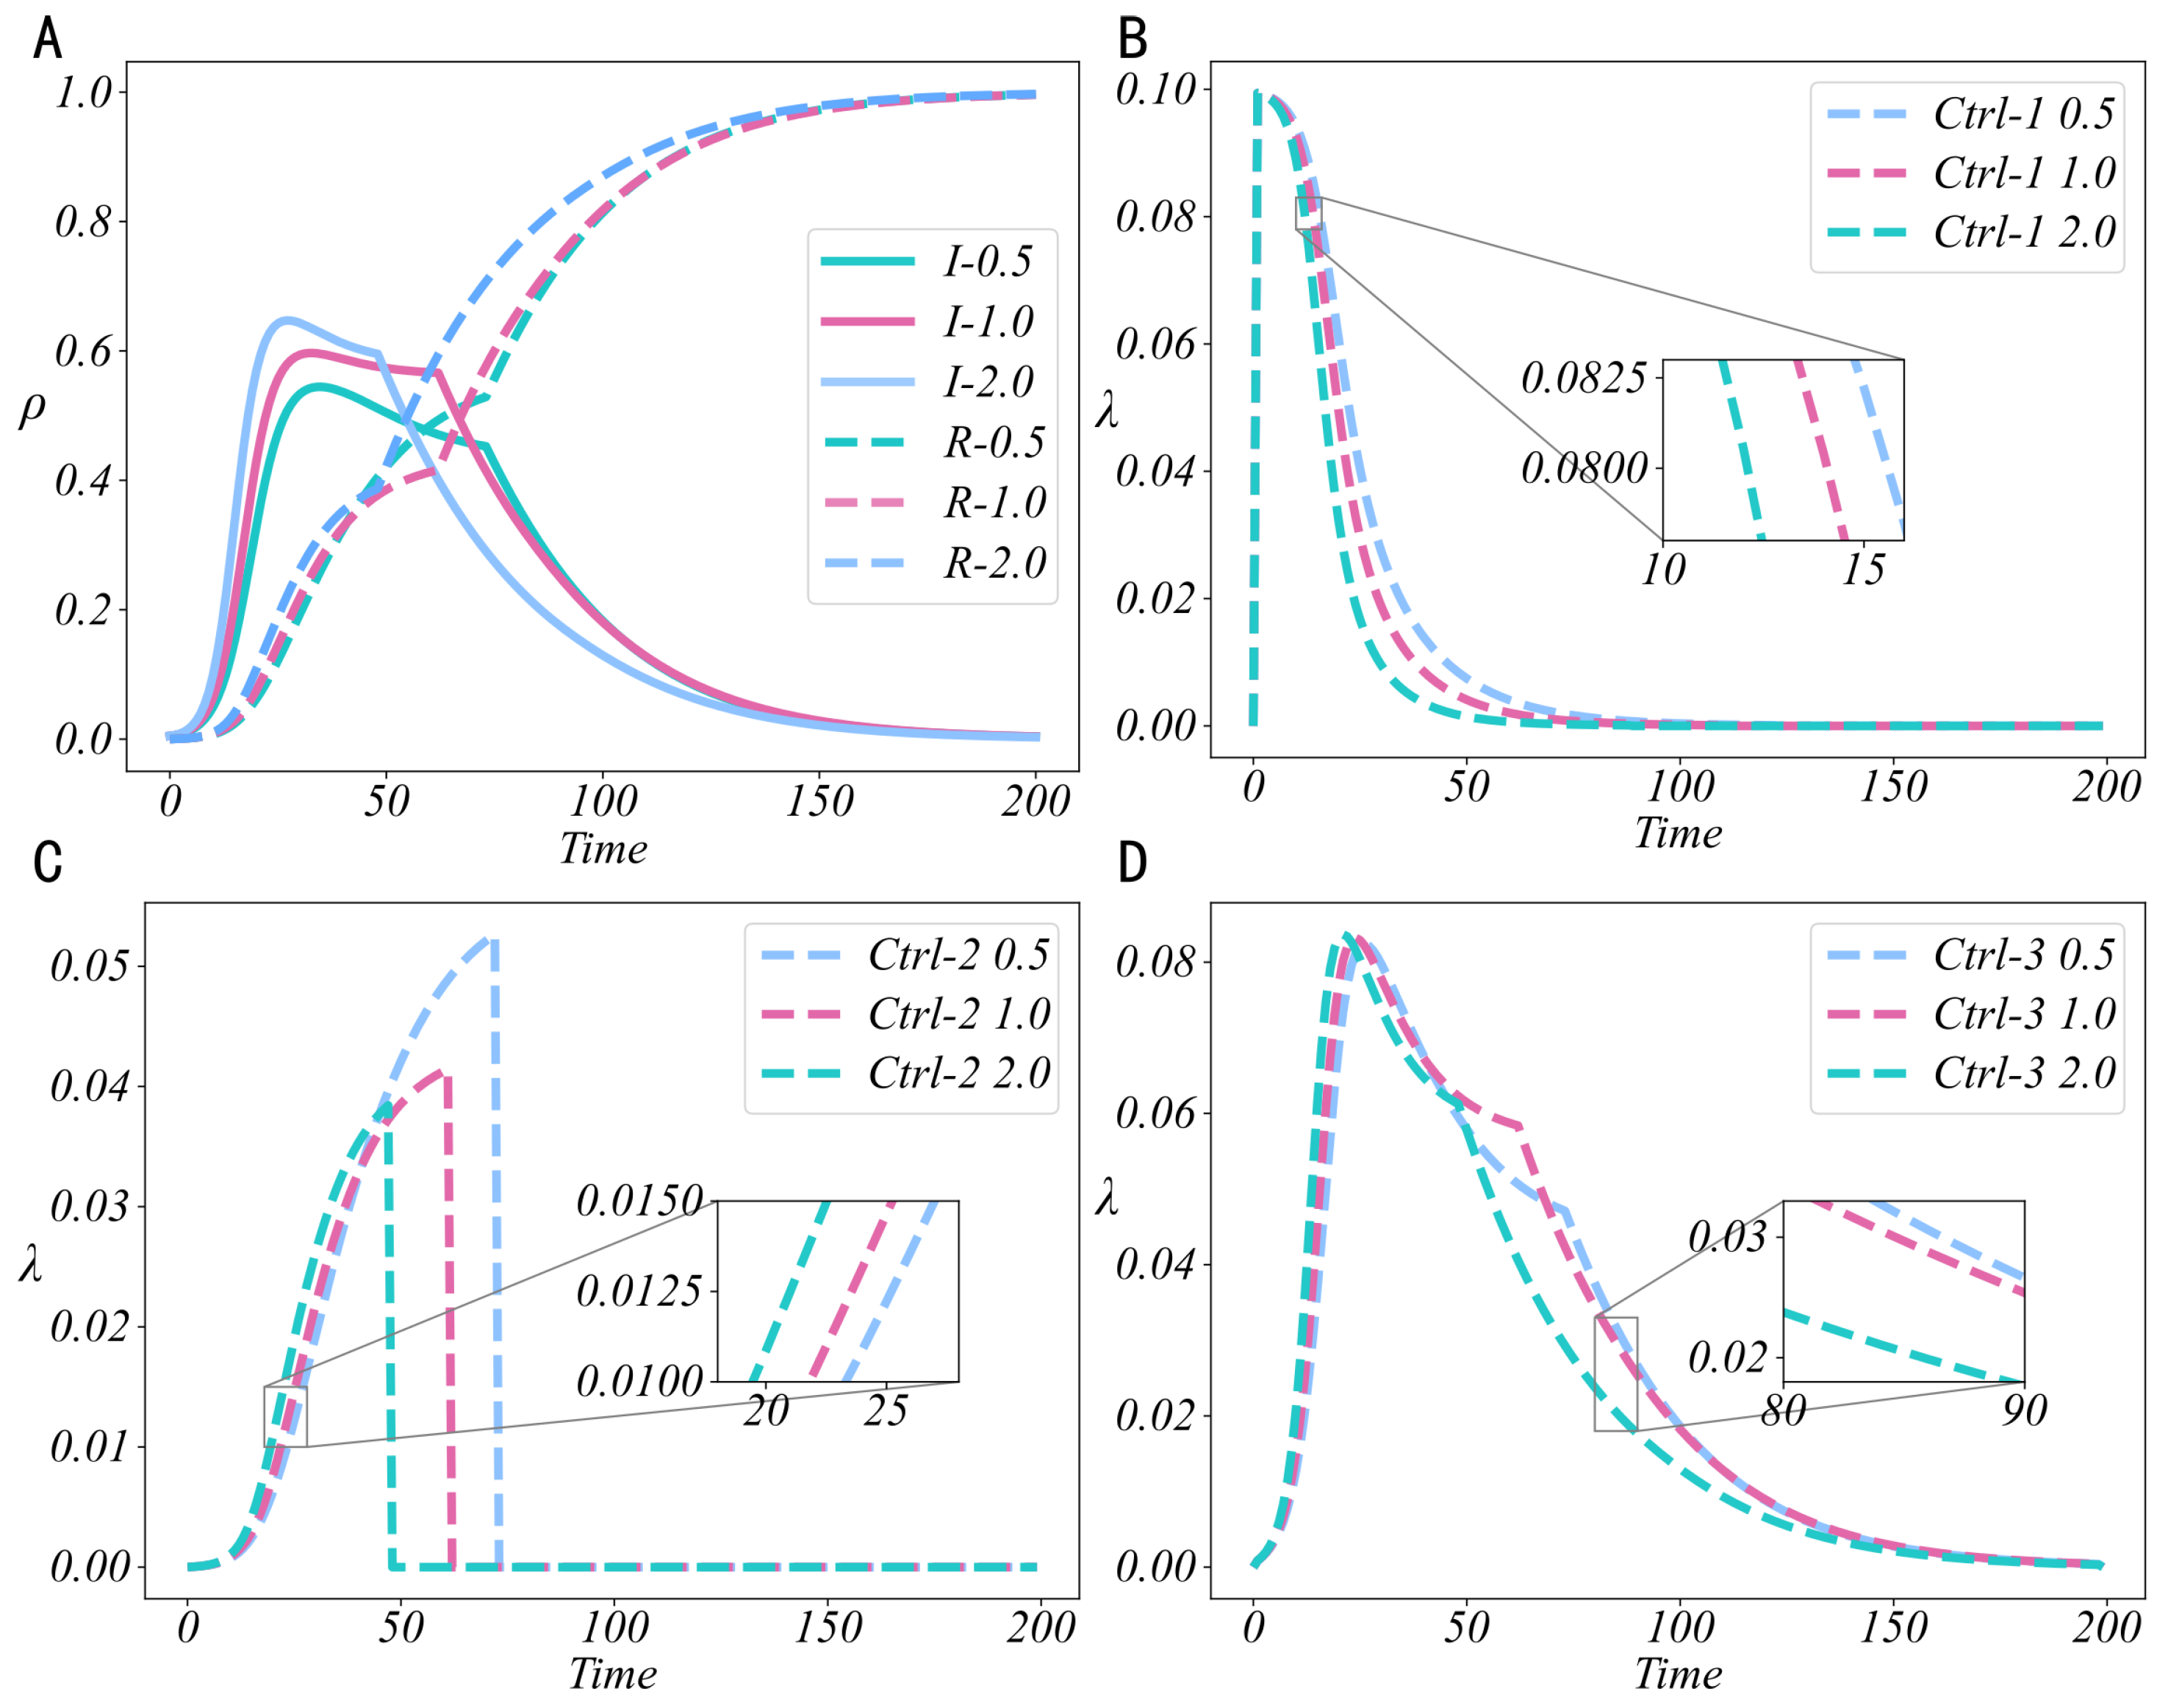
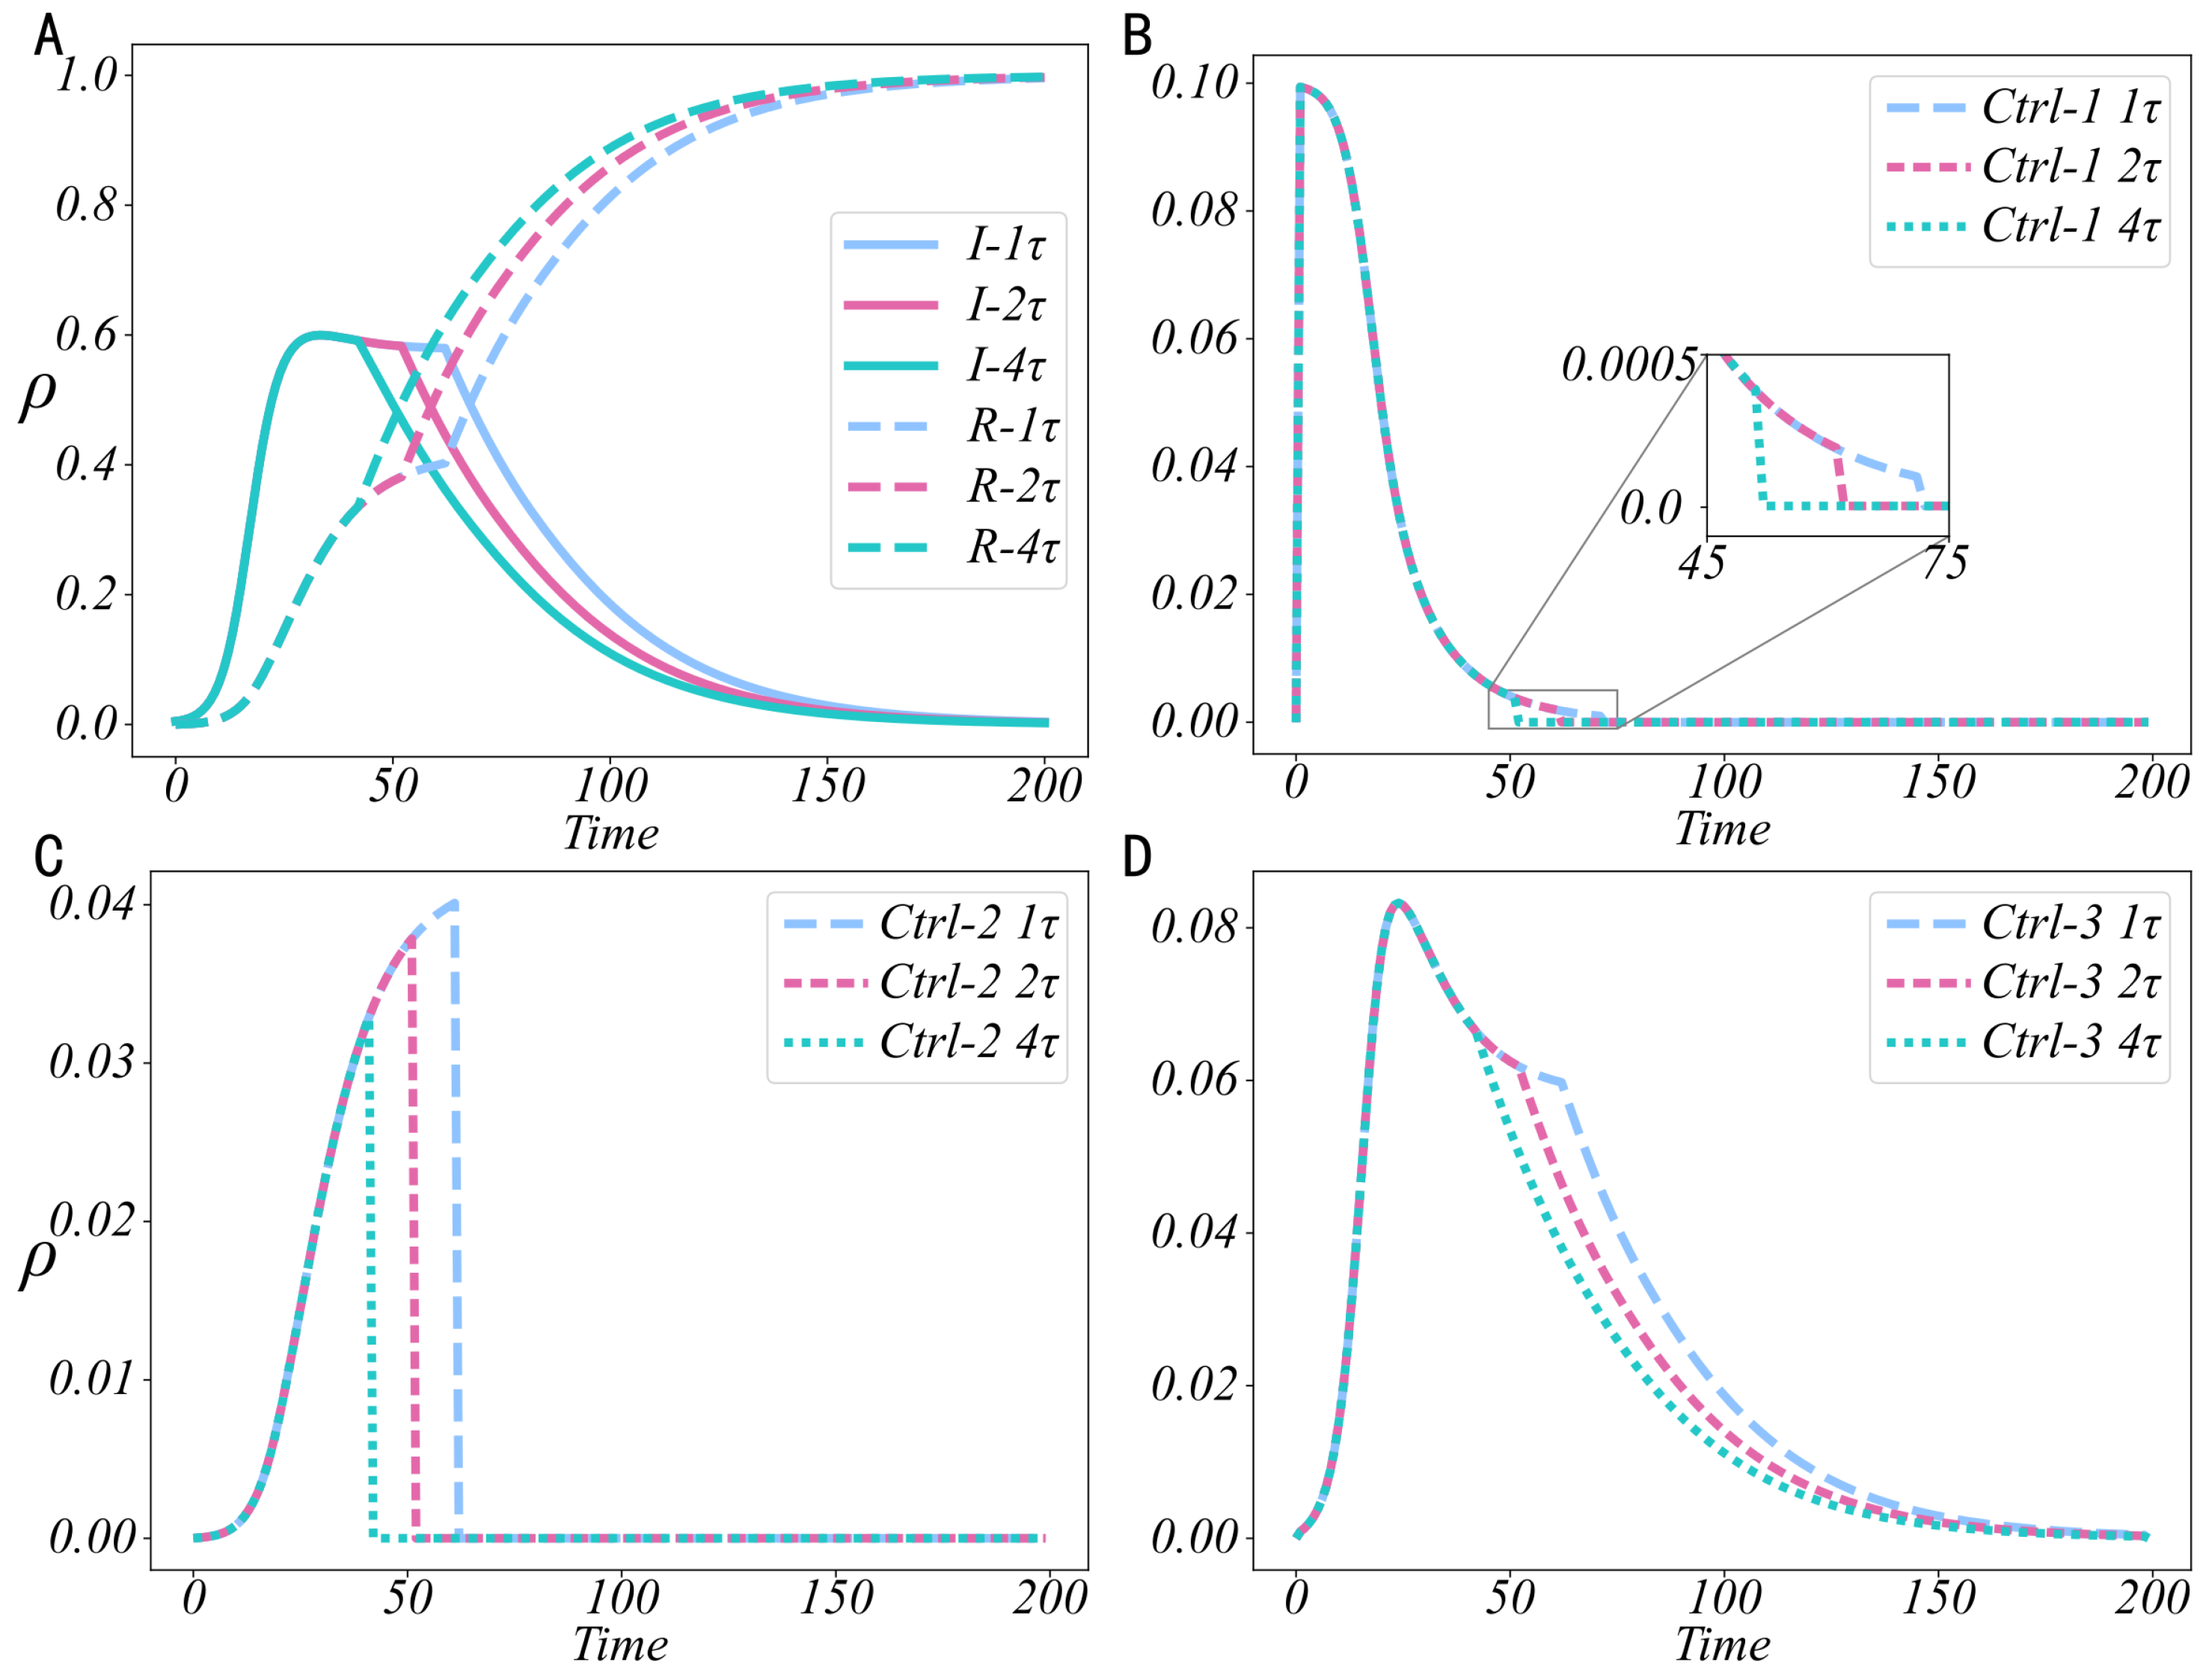
In the aforementioned experiments, considering the differences in implementation approaches of the three information control strategies in real social networks, different control success rates were assigned to each strategy. Nevertheless, due to practical factors such as network latency, the actual success rates of control strategies may exhibit more diverse combinations. Based on this, a supplementary comparative experiment was further designed. Building upon the baseline configuration, the success rates of all three control strategies were systematically scaled to 0.5 × and 2 × the original values. This parametric variation enabled assessment of strategy efficacy across extended operational ranges for both positive and negative information diffusion dynamics. To maintain the conciseness of the overall structure of the paper, the case of positive information control is selected as a representative example for analysis. The experimental results are shown in Figure 6.
Figure 6A shows that higher control success rates raise the I-state peak and accelerate its decline. Correspondingly, the R-state growth rate increases, and its inflection point occurs earlier. This indicates that enhanced control efficacy accelerates the overall diffusion process via more effective interventions, albeit at higher inherent system costs. To optimize overall effectiveness, the framework strategically reduces control intensity as success rates increase, balancing intervention impact against resource use (Figure 6B–D). Higher success rates decrease the required control intensity per strategy, demonstrating resource-efficient objective attainment. Specifically: Figure 6B shows accelerated intensity decline, enabling faster goal achievement. Figure 6C exhibits an earlier, shorter-lived intensity peak, indicating rapid response and convergence. Figure 6D confirms this adaptive strategy through a sharp intensity reduction, minimizing redundant interventions. Furthermore, the accelerated ascent to peak intensity in Figure 6C,D under higher success rates highlights the system’s early-stage rapid response capability. This maximizes the marginal benefit of resources, reflecting high intervention sensitivity and strategic flexibility through rapid intensity escalation and subsequent convergence.
To further analyze the sensitivity of experimental parameters and their impact on the results, we conducted a sensitivity analysis of the triggering thresholds for the control strategies. Based on the original threshold values, we expanded the thresholds by 2 × and 4 × to investigate the activation conditions of the control strategies under different thresholds and their dynamic effects on the diffusion of both positive and negative information. For the sake of brevity, we focus on the control of positive information as a representative case, and the experimental results are presented in Figure 7.
From the curve of the I-state in Figure 7A, we observe that as the threshold value increases, the decay rate of the I-state and the increase rate of the R-state both accelerate. In Figure 7B–D, which show the intensity changes in the control strategies, we can see that larger thresholds lead to a reduction in both the duration and intensity of the control. This suggests that, in the context of positive information control, if the control requirements for information diffusion are not strict, increasing the triggering threshold can save control costs. However, this comes at the expense of a reduced control effect.

5.4. Universality Analysis of Optimal Control Strategies

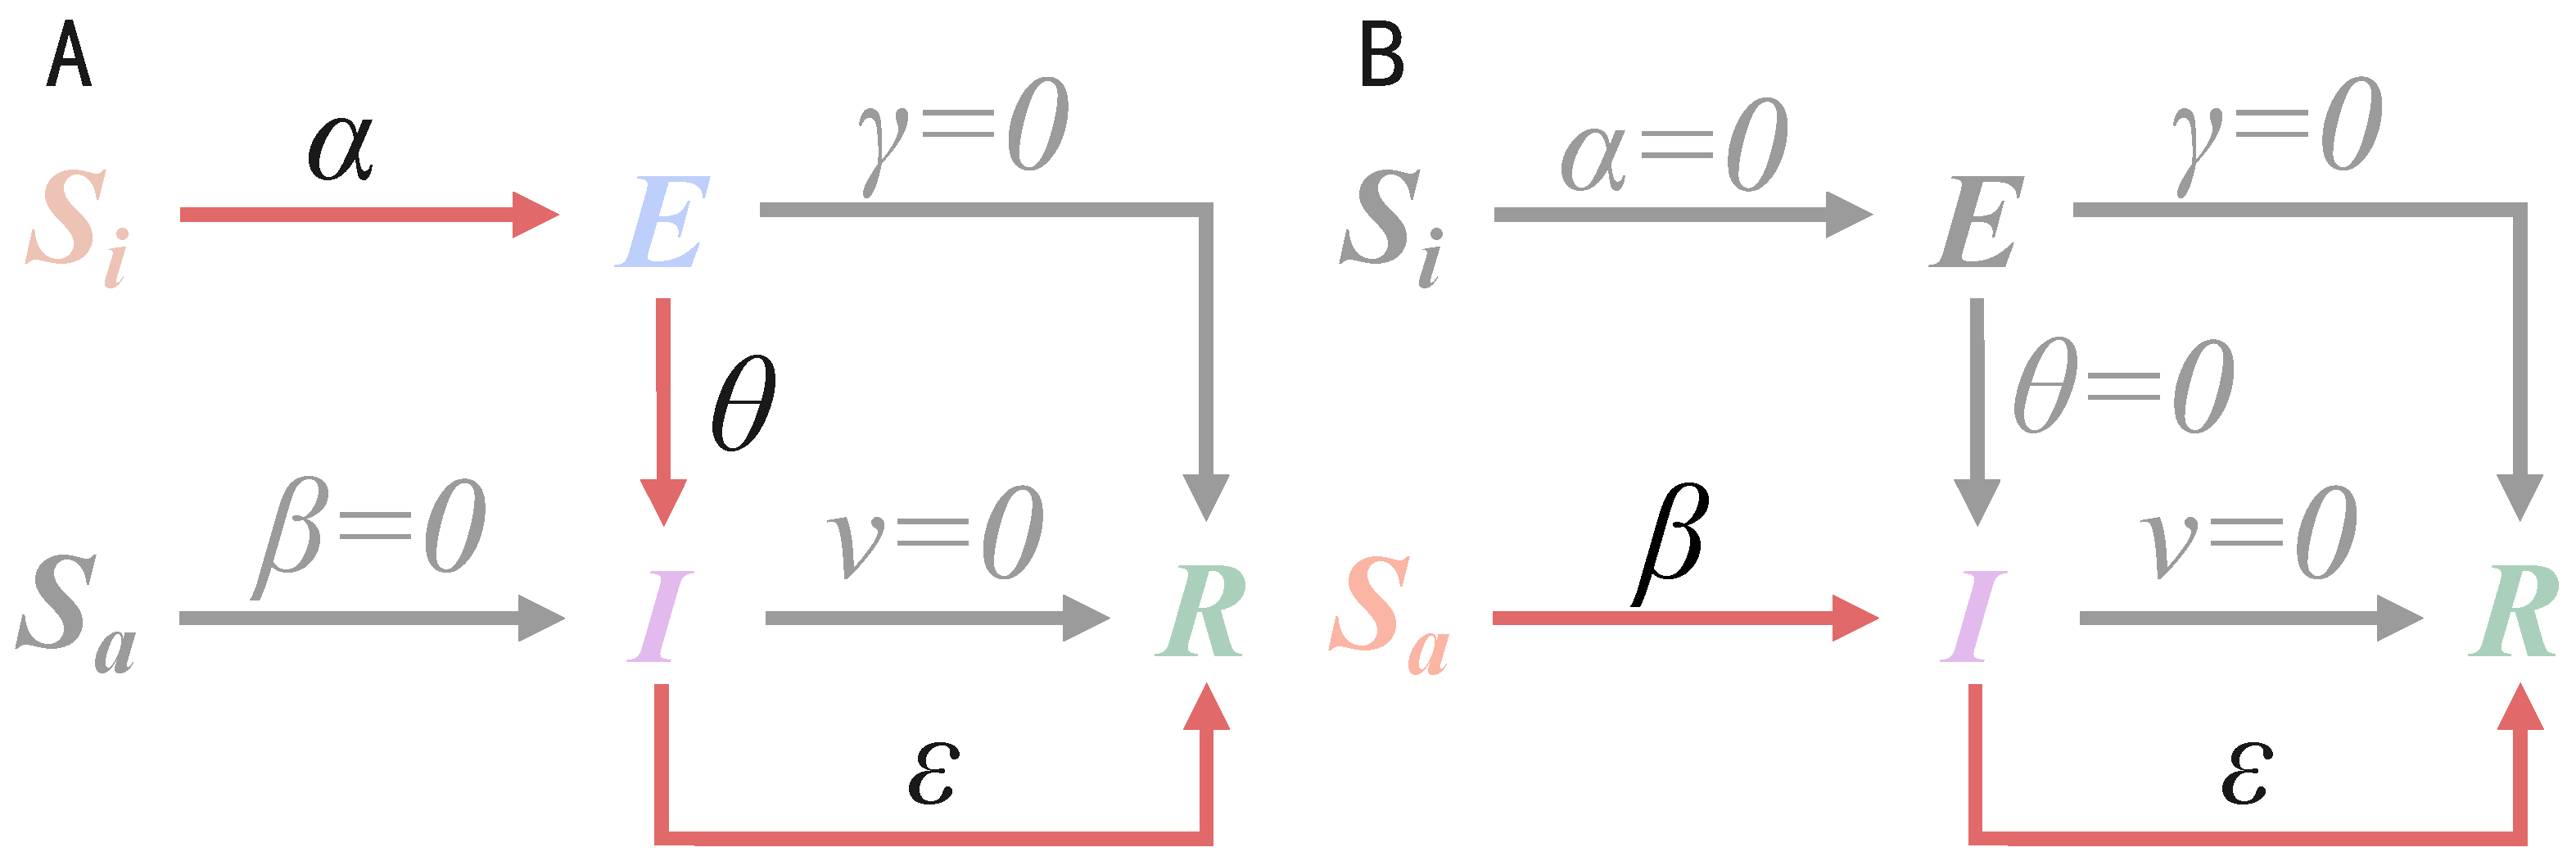
By leveraging the structural flexibility of the S i S a E I R model, it can be reduced to two classical diffusion models— S E I R and S I R . The specific degradation process is illustrated in Figure 8. A further question arises: Is the proposed optimal control strategy equally applicable to these two models? Does this strategy exhibit universality? To address this, we continue to explore the universality of the optimal control strategy.
Specifically, the S i S a E I R model degrades into S E I R by setting β = 0 , γ = 0 , and assuming the S a -state density is negligible, while it reduces to S I R by setting α = 0 , γ = 0 , θ = 0 and ignoring the S i -state. These settings ensure that the state transition equations align structurally with the classical models.
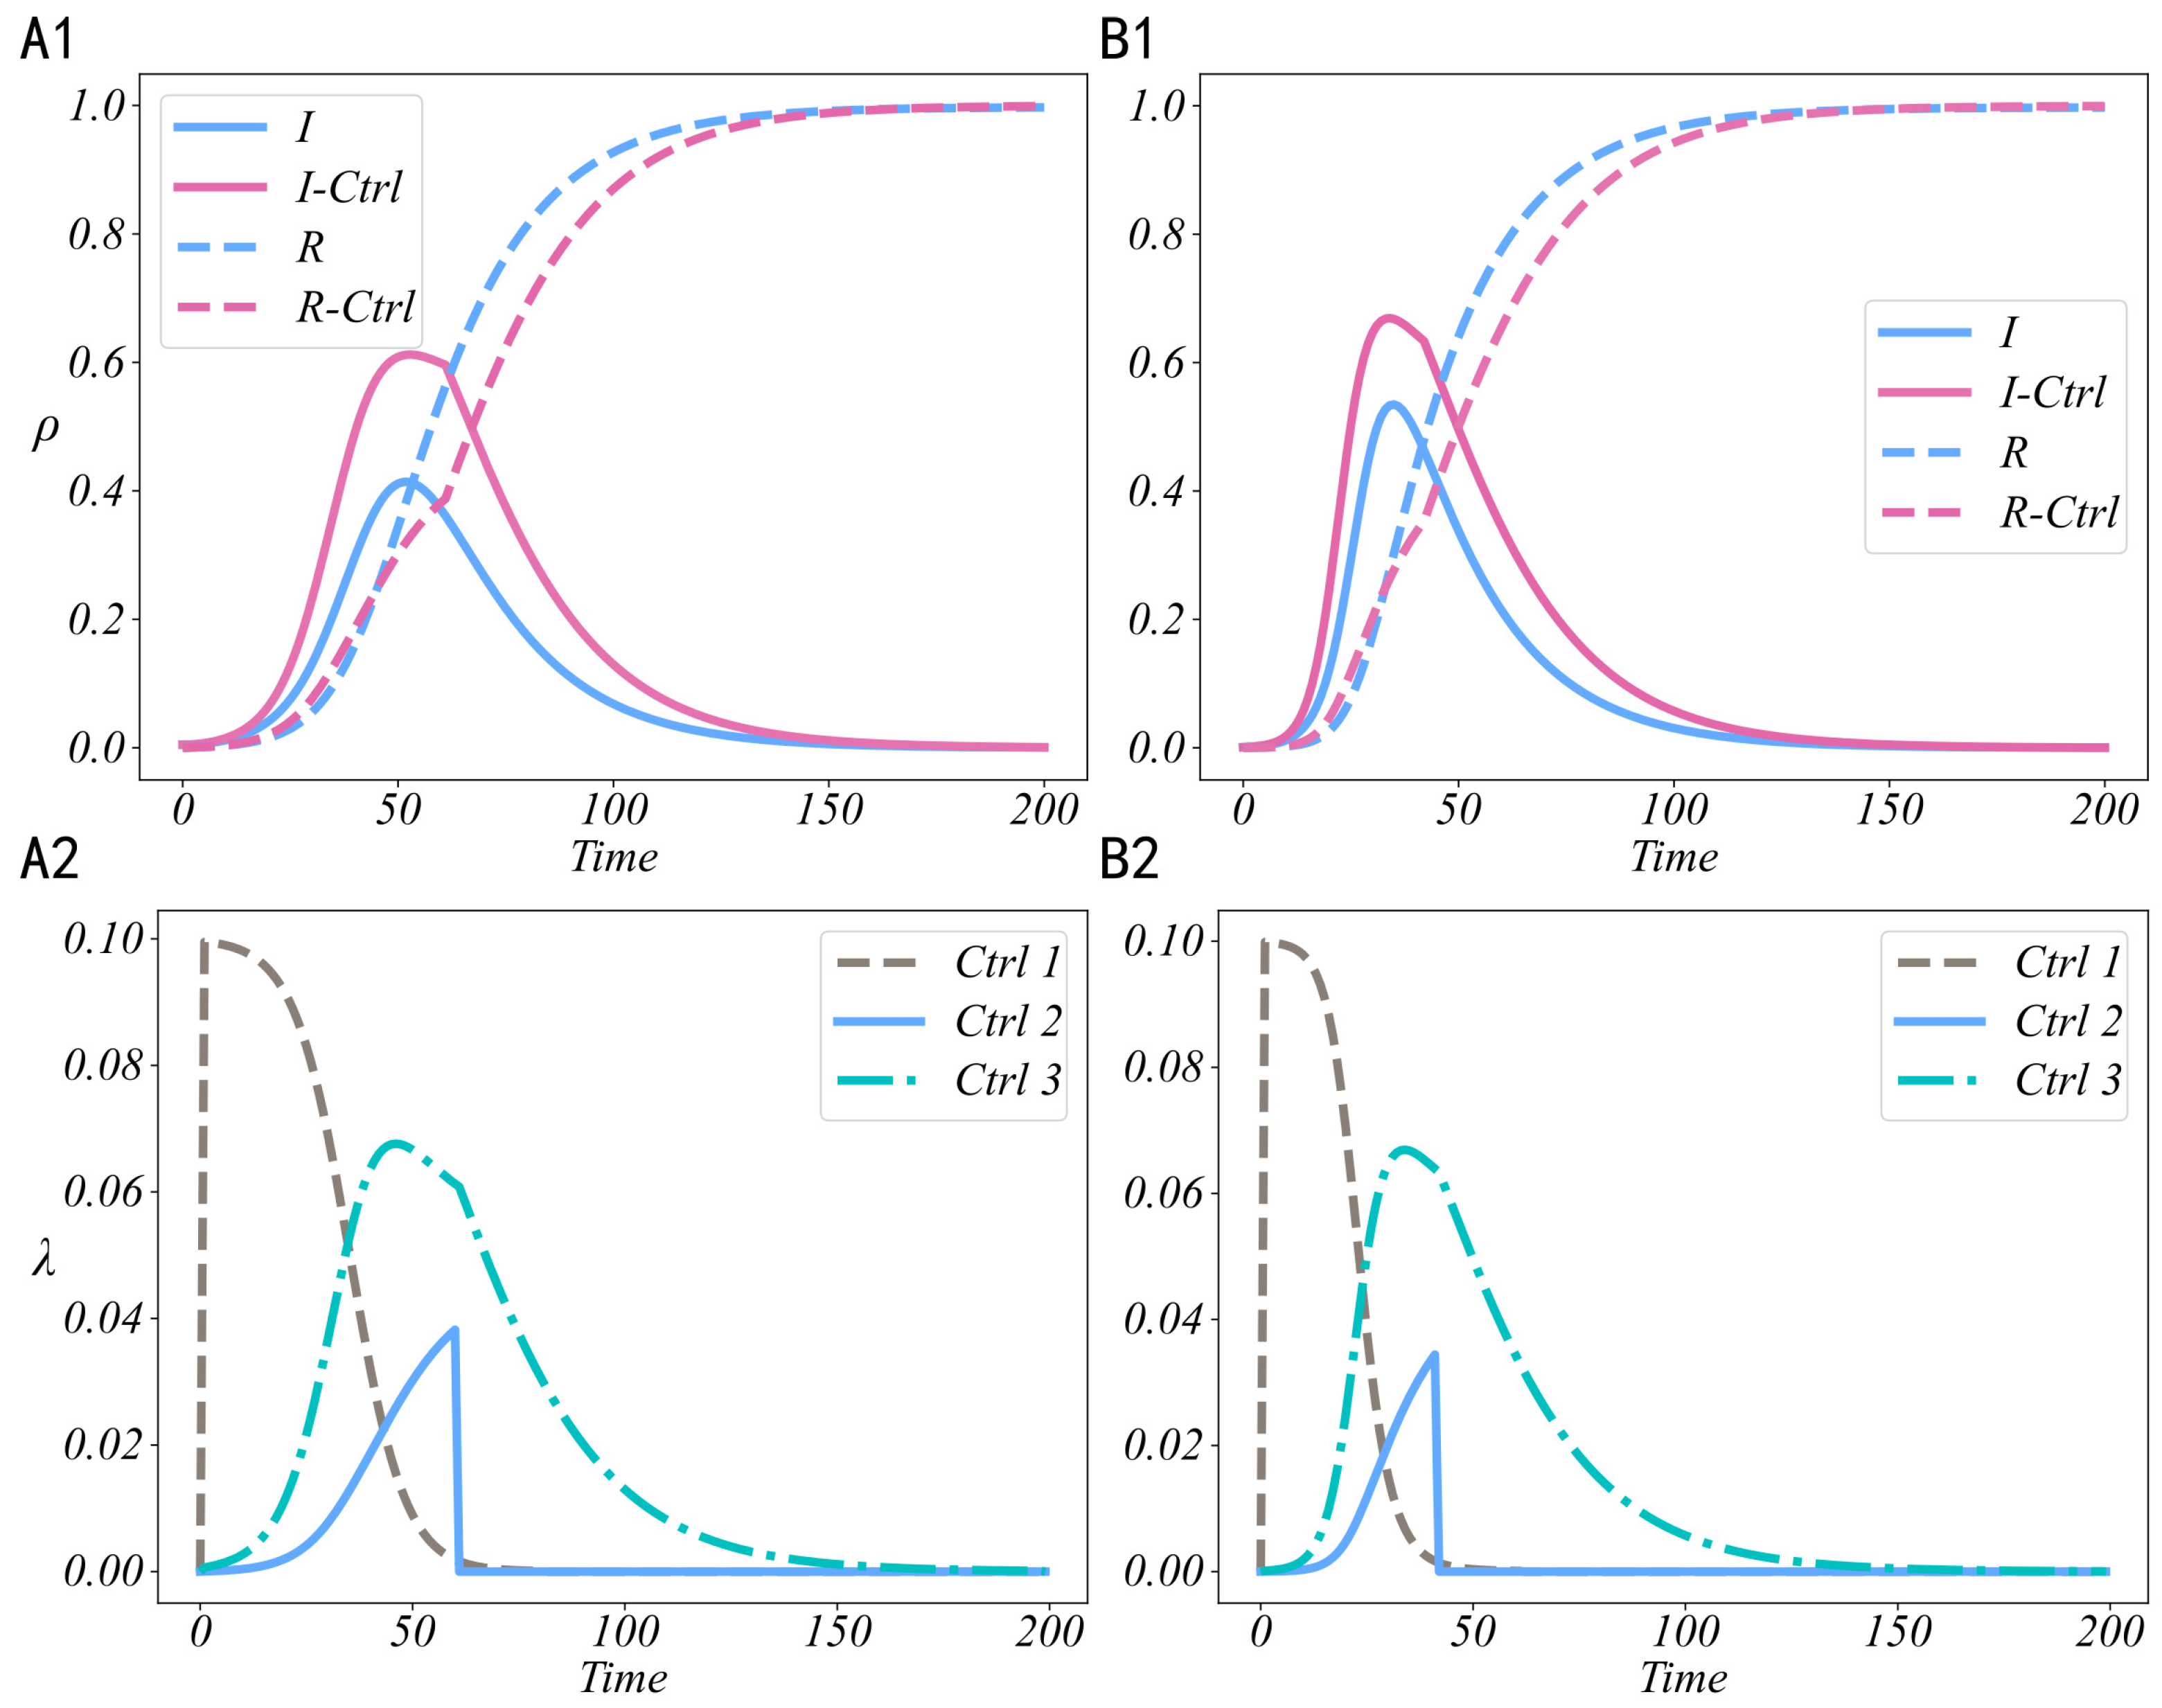
Based on the model degradation paths shown in Figure 8, the relevant parameters were reset accordingly, and the proposed optimal control strategy was applied to the S E I R model and the S I R model, respectively, in order to verify its applicability under traditional classical models. The resulting control effects are presented in Figure 9, demonstrating the universality of the optimal control strategy across different classical models. In this study, the case of positive information control is selected as a representative example for analysis.
Figure 9 illustrates the impact of applying the optimal control strategy on the changes in user states after the S i S a E I R model is reduced to two classical information diffusion models—the S E I R model and the S I R model. Specifically, Figure 9(A1,A2) reflect the temporal changes in the densities of the I-state and R-state in the S E I R model under the optimal control strategy, along with the corresponding control intensity curve shown in Figure 9(A2); Figure 9(B1,B2) present the corresponding experimental results for the S I R model. It is clearly observed from the results that, in both degraded models, the optimal control strategy significantly alters the evolution trajectories of the I-state and R-state. The peak of the I-state appears earlier and is reduced under control, while the R-state increases more rapidly, indicating strong stability and high efficiency of the intervention. This not only further confirms the structural degradation compatibility of the proposed S i S a E I R model, but also fully demonstrates the good model universality of the optimal control strategy developed in this study. It can be adapted to various diffusion scenarios, thereby providing theoretical support for its further application in different social network diffusion structures.

6. Conclusions and Discussion

This study focuses on the diffusion of positive and negative information in online social hypernetworks, constructing a systematic optimal control strategy framework based on the S i S a E I R information diffusion model. To address the multifaceted factors affecting information diffusion in real-world social networks, three types of attributes are introduced, embodied in the Promotion, Regulation, and Guidance Control Strategies, to effectively intervene in the diffusion of both positive and negative information. During model construction, we fully consider both triggering and cost constraints during strategy implementation, resulting in an optimal control framework that incorporates realistic applicability and constraints. Using PMP, we theoretically derive the optimal control solution. Combined with actual social network scenarios, we propose quantitative performance indicators to evaluate strategy effectiveness. Using Facebook data, the experimental section first validates the effectiveness of the proposed strategies in complex real-world networks. Compared to traditional unconstrained methods, our framework exhibits enhanced robustness by incorporating constraints, resulting in more effective intervention in simulated scenarios. Subsequently, via a benefit analysis of multiple strategy combinations, we systematically evaluate the intervention effects of different strategies on positive and negative information diffusion. Furthermore, to account for possible fluctuations in implementation success rates, we conduct a sensitivity analysis to investigate strategy stability and robustness. Finally, leveraging the degradable structure of the S i S a E I R model, we simplify it into the classical S E I R and S I R models to verify the adaptability of the control strategies under these classical frameworks, thus demonstrating their broad applicability.
Although this study has conducted initial investigations in theoretical modeling and experimental validation, future work could focus on the three types of attribute factors presented to enable more in-depth and detailed modeling analyses of information diffusion mechanisms, thereby enriching the theoretical framework and practical applications of this field.

Author Contributions

Formal analysis, Investigation, Writing—original draft preparation, H.-B.X. and Y.-F.Z.; Resources, Supervision, Validation, Methodology, F.H. and Y.-R.S. All authors have read and agreed to the published version of the manuscript.

Funding

This work was supported by the National Natural Science Foundation of China (Grant Nos. 62466049), the Basic Research Program of Qinghai Province (Grant No. 2023-ZJ-916M).

Data Availability Statement

The data and codes used for this study are available at: https://github.com/HaiBingXiao/Constrained-Optimal-Control-of-Information-Diffusion-in-Online-Social-Hypernetworks.git (accessed on 26 June 2025).

Conflicts of Interest

The authors declare no conflicts of interest.

Appendix A. Existence of Optimal Solution

The intervention system is reformulated as follows:
d x ( t ) d t = F ( x ( t ) , u ( t ) , t ) = f ( x ( t ) ) + B ( x ( t ) ) u ( t ) ,
where
x ( t ) = S i ( t ) S a ( t ) E ( t ) I ( t ) R ( t ) , u ( t ) = u 1 ( t ) u 2 ( t ) u 3 ( t ) ,
f ( x ( t ) ) = f 1 f 2 f 3 f 4 f 5 , with f 1 = α 0 S i I , f 2 = β 0 S a I , f 3 = α 0 S i I θ 0 E γ 0 E , f 4 = β 0 S a I + θ 0 E v I ε 0 I , f 5 = γ 0 E + v I + ε 0 I .
The control coefficient matrix is defined as,
B ( x ( t ) ) = φ 1 S i I 0 0 φ 2 S a I 0 0 φ 1 S i I φ 3 E + φ 4 E 0 ξ 1 E + ξ 2 E φ 3 E + φ 2 S a I σ 1 R ξ 1 E + ξ 3 I φ 4 E σ 1 R ξ 2 E ξ 3 I .
According to Filippov’s theorem, the following conditions must be verified:
  • The first-order partial derivatives of the function F are continuous, and there exists a constant C such that: | F ( 0 , 0 , t ) | C , | F u ( x ( t ) , u ( t ) , t ) | C , | F x ( x ( t ) , u ( t ) , t ) | C ( 1 + | u | ) .
  • The system (26) as well as the control set and the set of feasible solutions are non-empty.
  • The function satisfies the form: F ( x ( t ) , u ( t ) , t ) = a ( x ( t ) , t ) + b ( x ( t ) , t ) u ( t ) .
  • The control set U is closed and compact.
  • The integrand of the objective function J is concave over the control set.
Then, we verify the above conditions one by one. It is evident that the first-order partial derivatives of F ( x ( t ) , u ( t ) , t ) are continuous, and there exists a constant such that | F ( 0 , 0 , t ) | = | ( 0 , 0 , 0 , 0 ) T | C .
Next, we calculate the partial derivatives of F ( x ( t ) , u ( t ) , t ) with respect to x ( t ) :
F x ( x ( t ) , u ( t ) , t ) = F 1 0 0 F 4 0 0 F 7 0 F 9 0 F 11 0 F 13 F 14 0 0 F 17 F 18 F 19 F 20 0 0 F 23 F 24 F 25 C ,
where
F 1 = α 0 I φ 1 I u 1 ( t ) , F 4 = α 0 S i φ 1 S i u 1 ( t ) , F 7 = β 0 I φ 2 I u 1 ( t ) , F 9 = β 0 S a φ 2 S a u 1 ( t ) , F 11 = α 0 I + φ 1 I u 1 ( t ) , F 14 = α 0 S i + φ 1 S i u 1 ( t ) , F 13 = θ φ 3 u 1 ( t ) ξ 1 u 3 ( t ) γ 0 + φ 4 u 1 ( t ) + ξ 2 u 3 ( t ) , F 17 = β 0 I + φ 2 I u 1 ( t ) , F 18 = θ + φ 3 u 1 ( t ) + ξ 1 u 3 ( t ) , F 19 = β 0 S a + φ 2 S a u 1 ( t ) v s . ε 0 + ξ 3 u 3 ( t ) , F 20 = σ 1 u 2 ( t ) , F 23 = γ 0 φ 4 u 1 ( t ) ξ 2 u 3 ( t ) , F 24 = v s . + ε 0 ξ 3 u 3 ( t ) , F 25 = σ 1 u 2 ( t ) .
Similarly, we calculate the partial derivatives of F ( x ( t ) , u ( t ) , t ) with respect to u ( t ) :
F u ( x ( t ) , u ( t ) , t ) = φ 1 S i I 0 0 φ 2 S a I 0 0 φ 1 S i I φ 3 E + φ 4 E 0 ξ 1 E + ξ 2 E φ 3 E + φ 2 S a I σ 1 R ξ 1 E + ξ 3 I φ 4 E σ 1 R ξ 2 E ξ 3 I C ,
hence Condition 1 is satisfied.
The control set is given as u ( t ) = u 1 ( t ) u 2 ( t ) u 3 ( t ) T , and the system admits a constant equilibrium solution. Therefore, the system, the control set, and the feasible solution set are all non-empty, satisfying Condition 2.
Let a ( x ( t ) , t ) = f ( x ( t ) ) , b ( x ( t ) , t ) = B ( x ( t ) ) , then the system can be rewritten in the form F ( x ( t ) , u ( t ) , t ) = a ( x ( t ) , t ) + b ( x ( t ) , t ) u ( t ) , which verifies Condition 3.
By definition, the control set U is closed. In a finite-dimensional space, any closed set is also compact. Thus, Condition 4 holds.
The integrand of the objective function J is defined as
G ( x ( t ) , u ( t ) , t ) = b I I ( t ) + b E E ( t ) + b R R ( t ) 1 2 k 1 u 1 2 ( t ) 1 2 k 2 u 2 2 ( t ) 1 2 k 3 u 3 2 ( t ) .
For convenience, let B ( x , t ) = b I I ( t ) + b E E ( t ) + b R R ( t ) .
To verify concavity, we apply Jensen’s inequality:
G ( x ( t ) , ( 1 Ω ) u ( t ) + Ω u ( t ) , t ) = B ( x , t ) 1 2 k 1 [ ( 1 Ω ) u 1 ( t ) + Ω u 1 ( t ) ] 2 1 2 k 2 [ ( 1 Ω ) u 2 ( t ) + Ω u 2 ( t ) ] 2 1 2 k 3 [ ( 1 Ω ) u 3 ( t ) + Ω u 3 ( t ) ] 2 ( 1 Ω ) G ( x ( t ) , u ( t ) , t ) + Ω G ( x ( t ) , u ( t ) , t ) ,
leading to
G ( x ( t ) , ( 1 Ω ) u ( t ) + Ω u ( t ) , t ) [ ( 1 Ω ) G ( x ( t ) , u ( t ) , t ) + Ω G ( x ( t ) , u ( t ) , t ) ] 0 .
Therefore, the integrand G ( x ( t ) , u ( t ) , t ) is concave over the control set, and Condition 5 is satisfied.

Appendix B. Uniqueness of Optimal Solution

Before proving the uniqueness of the optimal solution, we introduce the following lemma, which will be used in the proof.
Lemma A1.
Given constants a , b with 0 < a < b , the function α * ( x ) = min { max { x , a } , b } satisfies the Lipschitz condition.
Proof. 
We first prove that the function max { x , a } is Lipschitz continuous. For any x 1 , x 2 X , we consider the following cases:
  • If a x 1 , x 2 , then
    | max { x 1 , a } max { x 2 , a } | = | x 1 x 2 | .
  • If 0 x 1 , x 2 a , then
    | max { x 1 , a } max { x 2 , a } | = | a a | = 0 .
  • If 0 x 1 a x 2 , then
    | max { x 1 , a } max { x 2 , a } | = | a x 2 | | x 1 x 2 | .
  • If 0 x 2 a x 1 , then
    | max { x 1 , a } max { x 2 , a } | = | x 1 a | | x 1 x 2 | .
Therefore, for all x 1 , x 2 X , the function max { x , a } satisfies | max { x 1 , a } max { x 2 , a } | | x 1 x 2 | , indicating that max { x , a } is 1-Lipschitz continuous (with Lipschitz constant K = 1 ). Similarly, min { x , b } is also 1-Lipschitz. Since the composition of Lipschitz functions is also Lipschitz, it follows that α * ( x ) = min { max { x , a } , b } is Lipschitz continuous.
Now we proceed to prove the uniqueness of the optimal solution. Assume that the problem has two optimal solutions: ( u 1 * , u 2 * , u 3 * ) and ( u 1 , u 2 , u 3 ) . These correspond to the respective state and adjoint variables:
( S i * , S a * , E * , I * , R * , λ S i * , λ S a * , λ E * , λ I * , λ R * ) and ( S i , S a , E , I , R , λ S i , λ S a , λ E , λ I , λ R ) . We define the following substitutions,
S i * = e λ t p 1 , S i = e λ t p 1 , λ S i * = e λ t q 1 , λ S i = e λ t q 1 , S a * = e λ t p 2 , S a = e λ t p 2 , λ S a * = e λ t q 2 , λ S a = e λ t q 2 , E * = e λ t p 3 , E = e λ t p 3 , λ E * = e λ t q 3 , λ E = e λ t q 3 , I * = e λ t p 4 , I = e λ t p 4 , λ I * = e λ t q 4 , λ I = e λ t q 4 , R * = e λ t p 5 , R = e λ t p 5 , λ R * = e λ t q 5 , λ R = e λ t q 5 .
where λ > 0 , Then put them into (26), (45)–(49) and (60)–(62), we have:
u 1 ( t ) = 1 k 1 [ ϕ 1 e λ t p 1 p 4 ( q 3 q 1 ) ϕ 2 e λ t p 2 p 4 ( q 2 q 4 ) ϕ 4 p 3 ( q 3 q 4 ) + ϕ 4 p 3 ( q 3 q 5 ) + μ 1 η 1 + ς 1 g 1 ] ,
u 2 ( t ) = 1 k 2 [ σ 1 p 5 ( q 4 q 5 ) + μ 2 η 2 + ς 2 g 2 ] ,
u 3 ( t ) = 1 k 3 [ ξ 1 p 3 ( q 4 q 3 ) + ξ 2 p 3 ( q 5 q 3 ) + ξ 3 p 4 ( q 4 q 5 ) + μ 3 η 3 + ς 3 1 g 3 1 + ς 3 2 g 3 2 ] .
λ p 1 + d p 1 d t = α 0 p 1 p 4 e λ t ϕ 1 u 1 ( t ) p 1 p 4 e λ t ,
λ p 2 + d P 2 d t = β 0 p 2 p 4 e λ t ϕ 2 u 1 ( t ) p 2 p 4 e λ t ,
λ p 3 + d p 3 d t = α 0 p 1 p 4 e λ t ( θ 0 + γ 0 ) p 3 + ϕ 1 u 1 ( t ) p 1 p 4 e λ t ϕ 3 u 1 ( t ) p 3 ξ 1 u 3 ( t ) p 3 + ϕ 4 u 1 ( t ) p 3 + ξ 2 u 3 ( t ) p 3 ,
λ p 4 + d p 4 d t = β 0 p 2 p 3 e λ t + θ 0 p 3 v s . p 4 ϵ 0 p 4 + ϕ 2 u 1 ( t ) p 2 p 4 e λ t + ϕ 3 u 1 ( t ) p 3 + ξ 1 u 3 ( t ) p 3 + ξ 3 u 3 ( t ) p 4 + σ 1 u 2 ( t ) p 5 ,
λ p 5 + d p 5 d t = γ 0 p 3 + v s . p 4 + ϵ 0 p 4 ϕ 4 u 1 ( t ) p 3 ξ 2 u 3 ( t ) p 3 ξ 3 u 3 ( t ) p 4 σ 1 u 2 ( t ) p 5 ,
d q 1 d t λ q 1 = ( q 1 q 3 ) e 2 λ t p 4 ( α 0 + ϕ 1 u 1 ( t ) ) + μ 1 ( t ) n ^ + ς 1 ( t ) u 1 ( t ) + ς 2 ( t ) u 2 ( t ) ,
d q 2 d t λ q 2 = ( q 2 q 4 ) e 2 λ t p 4 ( β 0 + ϕ 2 u 1 ( t ) ) + μ 1 ( t ) n ^ + ς 1 ( t ) u 1 ( t ) + ς 2 ( t ) u 2 ( t ) ,
d q 3 d t λ q 3 = b E e λ t + ( θ 0 + ϕ 3 u 1 ( t ) + ξ 1 u 3 ( t ) ) ( q 3 q 4 ) + ( γ 0 ϕ 4 u 1 ( t ) ξ 2 u 3 ( t ) ) ( q 3 q 5 ) + μ 1 ( t ) n ^ + μ 3 ( t ) S ^ + ς 1 ( t ) u 1 ( t ) + ς 2 ( t ) u 2 ( t ) + ς 3 1 ( t ) u 3 1 ( t ) ,
d q 4 d t λ q 4 = b I e λ t + ( α 0 + ϕ 1 u 1 ( t ) ) e λ t p 1 ( q 1 q 3 ) + ( β 0 + ϕ 2 u 1 ( t ) ) e λ t p 2 ( q 2 q 4 ) + ( ϵ 0 ξ 3 u 3 ( t ) ) ( q 4 q 5 ) + v ( q 4 q 5 ) + μ 3 ( t ) S ^ ,
d q 5 d t λ q 5 = b R e λ t + σ 1 u 2 ( t ) ( q 5 q 4 ) + μ 2 ( t ) C ^ ς 3 2 ( t ) u 3 1 ( t ) .
Combining the above expressions and applying Gronwall’s integral inequality, we obtain:
1 2 i = 1 5 ( p i p i ) 2 ( T ) + 1 2 i = 1 5 ( q i q i ) 2 ( 0 ) + λ 0 T i = 1 5 ( p i p i ) 2 + ( q i q i ) 2 d t K ¯ 1 + K ¯ 2 e 5 λ t 0 T i = 1 5 ( p i p i ) 2 + ( q i q i ) 2 d t .
where K ¯ 1 and K ¯ 2 are the constants relying on p 1 , p 2 , p 3 , p 4 , p 5 , q 1 , q 2 , q 3 , q 4 , q 5 and (A28) can be rewritten as follows,
λ K ¯ 1 K ¯ 2 e 5 λ t 0 T i = 1 5 ( p i p i ) 2 + ( q i q i ) 2 d t 0 .
When T 1 5 λ ln λ K ¯ 1 K ¯ 2 , we have: p 1 = p 1 , p 2 = p 2 , p 3 = p 3 , p 4 = p 4 , p 5 = p 5 , q 1 = q 1 , q 2 = q 2 , q 3 = q 3 , q 4 = q 4 , q 5 = q 5 . In other words, the optimal control solution is unique over a sufficiently short time interval. □

Appendix C. Stability Analysis of the Controlled System

Consider the controlled dynamics for the spread of positive information. The corresponding analysis for the negative information model is analogous and will be discussed at the end of this appendix. The controlled system is given by:
d S i d t = α ( t ) · S i · I d S a d t = β ( t ) · S a · I d E d t = α ( t ) · S i · I θ ( t ) + γ ( t ) · E d I d t = β ( t ) · S a · I + θ ( t ) · E ν · I ε ( t ) · I + σ 1 · u 2 * ( t ) · R d R d t = γ ( t ) · E + ν · I + ε ( t ) · I σ 1 · u 2 * ( t ) · R .
Here, α ( t ) , β ( t ) , θ ( t ) , γ ( t ) , and ε ( t ) are time-varying parameters determined by the optimal control laws in Equations (27)–(31). The control inputs u 1 * ( t ) , u 2 * ( t ) , and u 3 * ( t ) are constrained within [ 0 , u i max ] to ensure the controllability and physical feasibility of the system. Define the Diffusion-Free Equilibrium (DFE) as
x e q = ( S i * , S a * , 0 , 0 , R * ) , with S i * + S a * + R * = 1 .
which represents the fully suppressed state of information diffusion.
To analyze the stability of the system around x e q , consider the Lyapunov function candidate
V ( x ) = 1 2 ( S i S i * ) 2 + 1 2 ( S a S a * ) 2 + 1 2 E 2 + 1 2 I 2 + 1 2 ( R R * ) 2 .
which satisfies the following properties: (i) V ( x e q ) = 0 ; (ii) V ( x ) > 0 for all x x e q ; and (iii) V ( x ) as x . Thus, V ( x ) is positive definite and radially unbounded.
Taking the derivative of V ( x ) along the system trajectories yields:
V ˙ = ( S i S i * ) S i ˙ + ( S a S a * ) S a ˙ + E E ˙ + I I ˙ + ( R R * ) R ˙ = ( S i S i * ) [ α ( t ) S i I ] + ( S a S a * ) [ β ( t ) S a I ] + E [ α ( t ) S i I ( θ ( t ) + γ ( t ) ) E ] + I [ β ( t ) S a I + θ ( t ) E ( ν + ε ( t ) ) I + σ 1 u 2 * ( t ) R ] + ( R R * ) [ γ ( t ) E + ( ν + ε ( t ) ) I σ 1 u 2 * ( t ) R ] .
We apply Young’s inequality to the cross terms (e.g., S i I E ) and use the boundedness of both control inputs and system parameters. Then, the derivative satisfies the inequality:
V ˙ α ( t ) S i 2 I β ( t ) S a 2 I ( θ ( t ) + γ ( t ) ) E 2 ( ν + ε ( t ) ) I 2 + H ( u * , x ) ,
where H ( u * , x ) contains bounded cross-terms from the interaction of state variables and control inputs. According to the optimal control structure derived in the main text (Equations (60)–(62)), we further bound H as:
H ( u * , x ) k 1 Ψ 1 2 + k 2 Ψ 2 2 + k 3 Ψ 3 2 Γ ( x ) ,
where Γ ( x ) is a positive definite function in E, I, and ( R R * ) . Consequently, the total derivative of V satisfies:
V ˙ Q ( x ) ,
where Q ( x ) is a continuous, positive semi-definite function. Since V is radially unbounded and non-increasing, all system trajectories are bounded.
Applying LaSalle’s invariance principle, the system trajectories converge to the largest invariant set within { x R + 5 : V ˙ = 0 } , which implies E = 0 and I = 0 . Substituting these into the dynamics yields:
d S i d t = 0 , d S a d t = 0 , d E d t = 0 , d I d t = σ 1 u 2 * ( t ) R , d R d t = σ 1 u 2 * ( t ) R .
As u 2 * ( t ) 0 , I 0 and R R * , the system approaches the unique equilibrium x e q . Therefore, the system is globally asymptotically stable under the proposed optimal control strategy.
For the negative information dynamics (Equation (32)), we define a similar Lyapunov function as:
V N ( x ) = 1 2 ( S i S i * ) 2 + 1 2 ( S a S a * ) 2 + 1 2 E 2 + 1 2 I 2 + 1 2 ( R R * ) 2 .
Using the same steps as above, it can be shown that the system converges to the equilibrium x e q = ( S i * , S a * , 0 , 0 , R * ) . This confirms the global asymptotic stability of both the positive and negative information control models.

References

  1. Brady, W.J.; McLoughlin, K.; Doan, T.N.; Crockett, M.J. How social learning amplifies moral outrage expression in online social networks. Sci. Adv. 2021, 7, eabe5641. [Google Scholar] [CrossRef] [PubMed]
  2. Yu, X.; Yuan, C.; Kim, J.; Wang, S. A new form of brand experience in online social networks: An empirical analysis. J. Bus. Res. 2021, 130, 426–435. [Google Scholar] [CrossRef]
  3. Park, S.; Zhong, R.R. Pattern recognition of travel mobility in a city destination: Application of network motif analytics. J. Travel Res. 2022, 61, 1201–1216. [Google Scholar] [CrossRef]
  4. Zhang, R.; Hu, Z. Access control method of network security authentication information based on fuzzy reasoning algorithm. Measurement 2021, 185, 110103. [Google Scholar] [CrossRef]
  5. Tang, Z.; Miller, A.S.; Zhou, Z.; Warkentin, M. Does government social media promote users’ information security behavior towards COVID-19 scams? Cultivation effects and protective motivations. Gov. Inf. Q. 2021, 38, 101572. [Google Scholar] [CrossRef]
  6. Song, C.; Shu, K.; Wu, B. Temporally evolving graph neural network for fake news detection. Inf. Process. Manag. 2021, 58, 102712. [Google Scholar] [CrossRef]
  7. Goffman, W.; Newill, V. Generalization of epidemic theory: An application to the transmission of ideas. Nature 1964, 204, 225–228. [Google Scholar] [CrossRef]
  8. Zhu, L.; Yang, F.; Guan, G.; Zhang, Z. Modeling the dynamics of rumor diffusion over complex networks. Inf. Sci. 2021, 562, 240–258. [Google Scholar] [CrossRef]
  9. Pan, W.; Yan, W.; Hu, Y.; He, R.; Wu, L. Dynamic analysis of a SIDRW rumor propagation model considering the effect of media reports and rumor refuters. Nonlinear Dyn. 2023, 111, 3925–3936. [Google Scholar] [CrossRef]
  10. Zino, L.; Cao, M. Analysis, prediction, and control of epidemics: A survey from scalar to dynamic network models. IEEE Circ. Syst. Mag. 2021, 21, 4–23. [Google Scholar] [CrossRef]
  11. Yan, Y.; Yu, S.; Yu, Z.; Jiang, H. Dynamics analysis and control of positive–negative information propagation model considering individual conformity psychology. Nonlinear Dyn. 2024, 112, 16613–16638. [Google Scholar] [CrossRef]
  12. Wang, X.; Li, Y.; Li, J.; Liu, Y.; Qiu, C. A rumor reversal model of online health information during the COVID-19 epidemic. Inf. Process. Manag. 2021, 58, 102731. [Google Scholar] [CrossRef] [PubMed]
  13. Yin, F.; Jiang, X.; Qian, X.; Xia, X.; Pan, Y.; Wu, J. Modeling and quantifying the influence of rumor and counter-rumor on information propagation dynamics. Chaos Solitons Fractals 2022, 162, 112392. [Google Scholar] [CrossRef]
  14. Zhang, J.; Wang, X.; Chen, S. Study on the interaction between information dissemination and infectious disease dissemination under government prevention and management. Chaos Solitons Fractals 2023, 173, 113601. [Google Scholar] [CrossRef]
  15. Zhang, H.; Yao, Y.; Tang, W.; Zhu, J.; Zhang, Y. Opinion-aware information diffusion model based on multivariate marked Hawkes process. Knowl.-Based Syst. 2023, 279, 110883. [Google Scholar] [CrossRef]
  16. Battiston, F.; Amico, E.; Barrat, A.; Bianconi, G.; Ferraz de Arruda, G.; Franceschiello, B.; Iacopini, I.; Kefi, S.; Latora, V.; Moreno, Y.; et al. The physics of higher-order interactions in complex systems. Nat. Phys. 2021, 17, 1093–1098. [Google Scholar] [CrossRef]
  17. Xing, Y.; Wang, X.; Qiu, C.; Li, Y.; He, W. Research on opinion polarization by big data analytics capabilities in online social networks. Technol. Soc. 2022, 68, 101902. [Google Scholar] [CrossRef]
  18. Wang, J.; Wang, Z.; Yu, P.; Xu, Z. The impact of different strategy update mechanisms on information dissemination under hyper network vision. Commun. Nonlinear Sci. Numer. Simul. 2022, 113, 106585. [Google Scholar] [CrossRef]
  19. Berge, C. Graphs and Hypergraphs; Elsevier: New York, NY, USA, 1973. [Google Scholar]
  20. Xiao, H.B.; Hu, F.; Li, P.Y.; Song, Y.R.; Zhang, Z.K. Information propagation in hypergraph-based social networks. Entropy 2024, 26, 957. [Google Scholar] [CrossRef]
  21. Cheng, Y.; Huo, L.; Zhao, L. Stability analysis and optimal control of rumor spreading model under media coverage considering time delay and pulse vaccination. Chaos Solitons Fractals 2022, 157, 111931. [Google Scholar] [CrossRef]
  22. Wang, X.; Pang, N.; Xu, Y.; Huang, T.; Kurths, J. On State-Constrained Containment Control for Nonlinear Multiagent Systems Using Event-Triggered Input. IEEE Trans. Syst. Man Cybern. Syst. 2024, 54, 2530–2538. [Google Scholar] [CrossRef]
  23. Wang, Z.; Mu, C.; Hu, S.; Chu, C.; Li, X. Modelling the Dynamics of Regret Minimization in Large Agent Populations: A Master Equation Approach. In Proceedings of the Thirty-First International Joint Conference on Artificial Intelligence, IJCAI-22, Vienna, Austria, 23–29 July 2022; pp. 534–540. [Google Scholar]
  24. Wang, X.; Guang, W.; Huang, T.; Kurths, J. Optimized Adaptive Finite-Time Consensus Control for Stochastic Nonlinear Multiagent Systems with Non-Affine Nonlinear Faults. IEEE Trans. Autom. Sci. Eng. 2024, 21, 5012–5023. [Google Scholar] [CrossRef]
  25. Luo, H.; Meng, X.; Zhao, Y.; Cai, M. Exploring the impact of sentiment on multi-dimensional information dissemination using COVID-19 data in China. Comput. Hum. Behav. 2023, 144, 107733. [Google Scholar] [CrossRef] [PubMed]
  26. Dabija, D.C.; Câmpian, V.; Pop, A.R.; Băbuț, R. Generating loyalty towards fast fashion stores: A cross-generational approach based on store attributes and socio-environmental responsibility. Oeconom. Copernic. 2022, 13, 891–934. [Google Scholar] [CrossRef]
  27. Zhang, J.; Zhang, Q.; Wu, L.; Zhang, J. Identifying influential nodes in complex networks based on multiple local attributes and information entropy. Entropy 2022, 24, 293. [Google Scholar]
  28. Ma, N.; Yu, G.; Jin, X. Dynamics of competing public sentiment contagion in social networks incorporating higher-order interactions during the dissemination of public opinion. Chaos Solitons Fract. 2024, 182, 114753. [Google Scholar]
  29. You, X.; Zhang, M.; Ma, Y.; Tan, J.; Liu, Z. Impact of higher-order interactions and individual emotional heterogeneity on information disease coupled dynamics in multiplex networks. Chaos Solitons Fract. 2023, 177, 114186. [Google Scholar]
  30. Li, M.; Huo, L. Influences of individual interaction validity on coupling propagation of information and disease in a two-layer higher-order network. Chaos 2025, 35, 2. [Google Scholar]
  31. Bretto, A. Hypergraph Theory: An Introduction; Springer: Berlin/Heidelberg, Germany, 2013. [Google Scholar]
  32. Gong, Y.C.; Wang, M.; Liang, W.; Hu, F.; Zhang, Z.K. UHIR: An effective information dissemination model of online social hypernetworks based on user and information attributes. Inf. Sci. 2023, 644, 119284. [Google Scholar] [CrossRef]
  33. Luo, L.; Nian, F.; Cui, Y.; Li, F. Fractal information dissemination and clustering evolution on social hypernetwork. Chaos 2024, 34, 093101. [Google Scholar] [CrossRef]
  34. Boscain, U.; Sigalotti, M.; Sugny, D. Introduction to the Pontryagin maximum principle for quantum optimal control. PRX Quantum 2021, 2, 030203. [Google Scholar] [CrossRef]
  35. Ma, Z.; Zou, S. Optimal Control Theory; Springer: Singapore, 2021. [Google Scholar]
  36. Lin, C.; Ma, Y.; Sels, D. Application of Pontryagin’s maximum principle to quantum metrology in dissipative systems. Phys. Rev. A 2022, 105, 042621. [Google Scholar] [CrossRef]
  37. Liang, X.; Xu, J. Control for networked control systems with remote and local controllers over unreliable communication channel. Automatica 2018, 98, 86–94. [Google Scholar] [CrossRef]
  38. Liang, X.; Qi, Q.; Zhang, H.; Xie, L. Decentralized control for networked control systems with asymmetric information. IEEE Trans. Autom. Control 2022, 67, 2076–2083. [Google Scholar] [CrossRef]
  39. Yan, G.; Zhang, X.; Pei, H.; Li, Y. An emotion-information spreading model in social media on multiplex networks. Commun. Nonlinear Sci. Numer. Simul. 2024, 138, 108251. [Google Scholar] [CrossRef]
  40. Dong, Y.; Huo, L. A multi-scale mathematical model of rumor propagation considering both intra- and inter-individual dynamics. Chaos Solitons Fractals 2024, 185, 115065. [Google Scholar] [CrossRef]
  41. Liu, Q.; Yao, Y.; Jia, M.; Li, H.; Pan, Q. An opinion evolution model for online social networks considering higher-order interactions. PLoS ONE 2025, 20, e0321718. [Google Scholar] [CrossRef]
  42. Wang, J.; Wang, Z.; Yu, P.; Wang, P. The SEIR dynamic evolutionary model with Markov chains in hyper networks. Sustainability 2022, 14, 13036. [Google Scholar] [CrossRef]
  43. Han, Z.M.; Liu, Y.; Zhang, S.Q.; An, Y.Q. A topic dissemination model based on hypernetwork. Sci. Rep. 2025, 15, 1–18. [Google Scholar] [CrossRef]
  44. Liang, Y.; Wang, B.C.; Zhang, H. Discrete-time indefinite linear-quadratic mean field games and control: The finite-population case. Automatica 2024, 162, 111518. [Google Scholar] [CrossRef]
  45. Yaghmaie, F.A.; Gustafsson, F.; Ljung, L. Linear quadratic control using model-free reinforcement learning. IEEE Trans. Autom. Control 2022, 68, 737–752. [Google Scholar] [CrossRef]
  46. Ganjian-Aboukheili, M.; Shahabi, M.; Shafiee, Q.; Guerrero, J.M. Linear quadratic regulator based smooth transition between microgrid operation modes. IEEE Trans. Smart Grid 2021, 12, 4854–4864. [Google Scholar] [CrossRef]
  47. Abdullah, M.A.; Al-Shetwi, A.Q.; Mansor, M.; Hannan, M.A.; Tan, C.W.; Yatim, A.H.M. Linear quadratic regulator controllers for regulation of the DC-bus voltage in a hybrid energy system: Modeling, design and experimental validation. Sustain. Energy Technol. Assess. 2022, 50, 101880. [Google Scholar] [CrossRef]
  48. McAuley, J.; Leskovec, J. Learning to discover social circles in ego networks. In Proceedings of the 26th International Conference on Neural Information Processing Systems (NIPS’12), Lake Tahoe, NV, USA, 3–6 December 2012; Curran Associates Inc.: Red Hook, NY, USA; pp. 539–547. [Google Scholar]
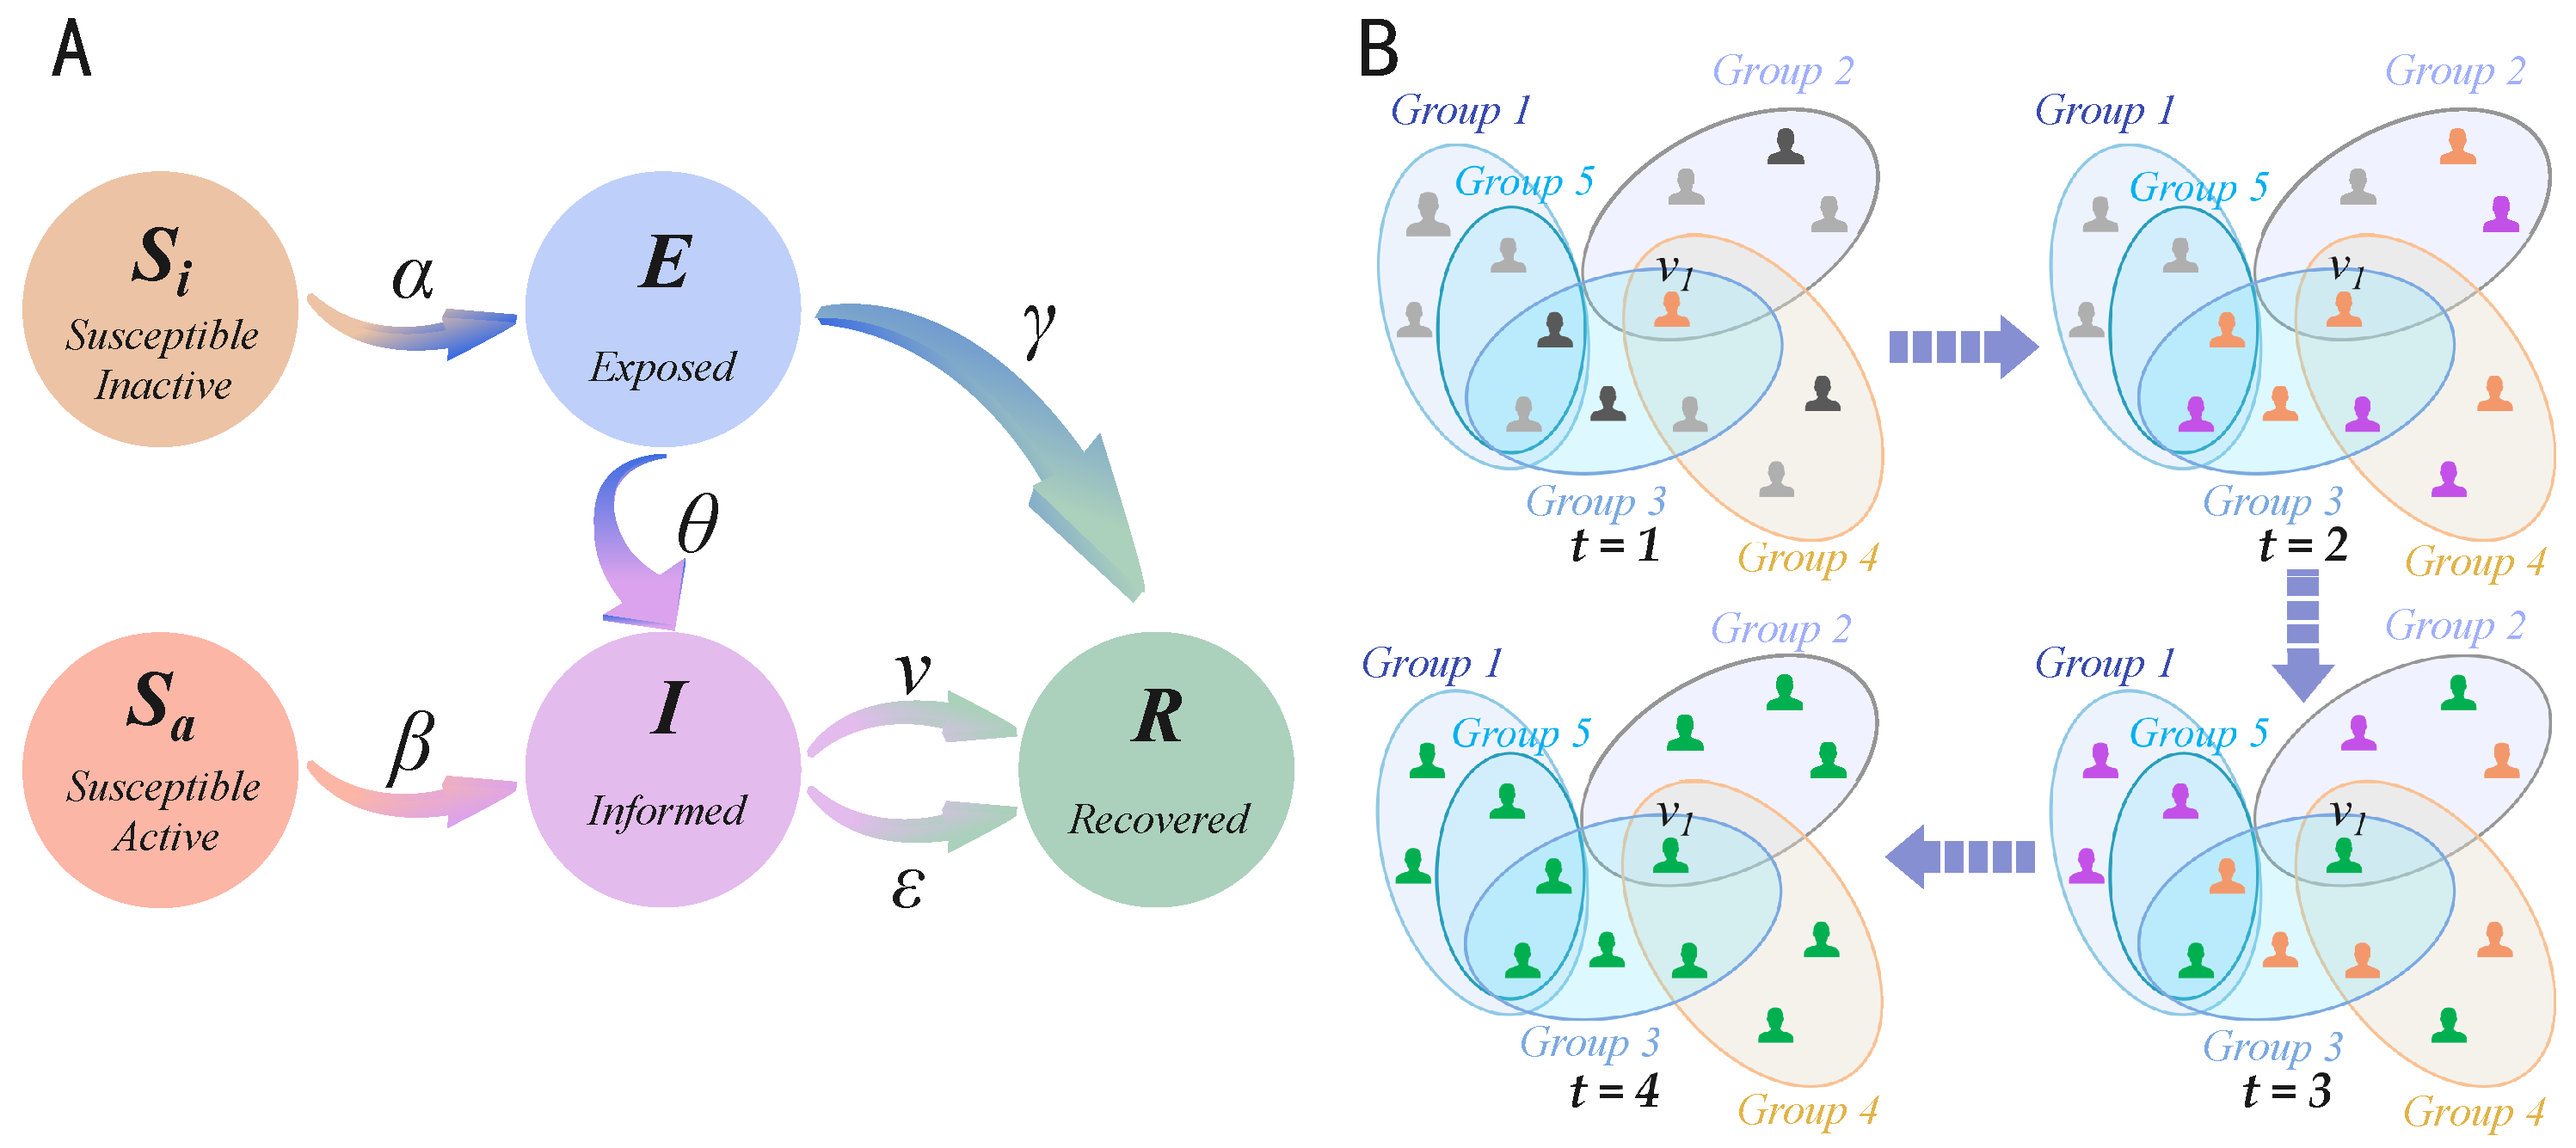
Figure 1. Illustrates the state transitions of the S i S a E I R model and its application within a social hypernetwork. (A) The state transition diagram of the S i S a E I R model, where icons in different colors represent users in different states, and arrows indicate the transition rules between these states. (B) The application of the model within a social hypernetwork, where different elliptical regions represent distinct social groups. At the first time step, the orange user V 1 in the I-state begins to disseminate information to users in the dark gray S a -state and the light gray S i -state. At the second time step, the users who have received the information transition to the purple E-state. At the third time step, the information diffuses throughout the entire network, and some users transition to the green R-state. By the fourth time step, all users in the network have transitioned to the R-state, and the information diffusion reaches a steady state.
Mathematics 13 02751 g001
Figure 2. Factors influencing information diffusion. During the information reception stage, a user’s attitude toward the information is determined by user attributes, environmental attributes, and information attributes. After receiving the information, the user makes a decision based on a comprehensive consideration of these three types of factors. If the user chooses to disseminate the information, it will be further propagated across the network, thereby influencing other users.
Mathematics 13 02751 g002
Figure 3. A schematic diagram of the working principles of the information control strategies. (A) The state transition probabilities under the influence of the three control strategies in the context of positive information; (B) the state transition probabilities under the influence of the three control strategies in the context of negative information. The green upward arrows indicate an increased probability under the effect of control, while the red downward arrows indicate a decreased probability under the effect of control.
Mathematics 13 02751 g003
Figure 4. Empirical validation of control strategies. (A) The comparison between the numerical solution of the differential equations and the empirical results on Facebook for positive information diffusion under control. (B) The comparison between the numerical solution of the differential equations and the empirical results on Facebook for negative information diffusion under control. In the figure, the discrete points represent the results validated on the Facebook social network dataset, while the continuous curves represent the theoretical values obtained through derivation and calculation. The horizontal axis represents the time steps, and the vertical axis represents the density of the state nodes.
Mathematics 13 02751 g004
Figure 5. Time-evolution diagrams of state densities and control intensities when all three control strategies are activated. (A1,B1) The comparison of state changes in the diffusion of positive and negative information with and without control interventions, respectively. In these figures, dashed lines represent the scenarios with control, while solid lines denote those without control. (A2,B2) The variations in the intensities of the three control strategies during the control of positive and negative information, respectively.
Mathematics 13 02751 g005
Figure 6. Presents the sensitivity analysis of control strategies. (A) The impact of different control success rates on the I-state and R-state when all control strategies are activated. (BD) The variations in the intensity of the u 1 , u 2 , and u 3 control strategies under different implementation success rates, respectively. In the figures, the blue curve represents an implementation success rate of 0.5, the red curve represents the standard implementation success rate of 1.0, and the green curve represents an implementation success rate of 2.0.
Mathematics 13 02751 g006
Figure 7. Sensitivity analysis of control thresholds. (A) The effect of different control thresholds on the I-state and R-state when all control strategies are activated. (BD) The variations in the intensity of control strategies u 1 , u 2 , and u 3 under different threshold settings. The blue curve represents the initial threshold value, the red curve represents the threshold doubled, and the green curve represents the threshold quadrupled.
Mathematics 13 02751 g007
Figure 8. The degradation process of the S i S a E I R model. In (A), when the user density in the S a -state is zero and γ = 0 , β = 0 , and v = 0 , the S i S a E I R model degrades into the S E I R model. In (B), when the user density in the S i -state is zero and α = 0 , γ = 0 , θ = 0 , and v = 0 , the S i S a E I R model degrades into the S I R model.
Mathematics 13 02751 g008
Figure 9. Universality verification results. (A1,A2) The changes in the densities of the I-state and R-state, as well as the variations in control intensity, after applying the optimal control strategy when the S i S a E I R model is reduced to the classical S E I R model. (B1,B2) The corresponding changes when the S i S a E I R model is reduced to the classical S I R model. In (A1,B1), the red curves represent the state changes under control, while the blue curves represent the uncontrolled state changes.
Mathematics 13 02751 g009
Table 1. Experimental parameter settings.
ParameterValueParameterValue
α 0 0.8 φ 1 φ 6 0.5
β 0 0.6 ξ 1 ξ 6 0.3
θ 0 0.05 σ 1 , σ 2 0.9
γ 0 0.01 n ^ 0.1
ν 0.03 c ^ 0.1
ε 0 0.01 s ^ 0.1
Table 2. System benefit improvements under different control strategy combinations.
AB
Strategy Δ π Improvement Rate Strategy Δ π Improvement Rate
u 1 16.6859.76% u 1 28.46722.76%
u 2 38.96922.79% u 2 37.36629.87%
u 3 21.04912.31% u 3 31.18124.93%
u 1 , u 2 50.22129.37% u 1 , u 2 60.16948.10%
u 1 , u 3 32.48919.00% u 1 , u 3 46.49837.17%
u 2 , u 3 50.77929.70% u 2 , u 3 55.23244.15%
u 1 , u 2 , u 3 57.85533.84% u 1 , u 2 , u 3 69.55755.60%
Note: Δ π represents system benefit increment under given strategies.
Disclaimer/Publisher’s Note: The statements, opinions and data contained in all publications are solely those of the individual author(s) and contributor(s) and not of MDPI and/or the editor(s). MDPI and/or the editor(s) disclaim responsibility for any injury to people or property resulting from any ideas, methods, instructions or products referred to in the content.