Abstract
Facing the global competitive market and ever-changing customer demands, manufacturers must navigate intense competition and uncertain demand while striving to enhance customer satisfaction. As a result, the demand for customized products has become a crucial design consideration. To respond accurately and swiftly in a competitive market, manufacturers must focus on customer needs, analyze market trends and competitor information, and leverage data analysis as a reference for new product development and design. This study presents a new product development model by integrating quality function deployment (QFD), decision-making trial and evaluation laboratory (DEMATEL), analytic network process (ANP), and fuzzy set theory. It first uses a 2-tuple fuzzy DEMATEL to identify significant interrelationships among factors. A revised house of quality (HOQ) is then constructed to map relationships among customer requirements (CRs), engineering requirements (ERs), and the influences of CRs on ERs. To address uncertainty in human judgment, fuzzy set theory is incorporated into the ANP. The integrated model can determine the relative importance of the ERs. The proposed model is applied to touch panel development, and the results are recommended to the R&D team for new product development.
Keywords:
touch panel; 2-tuple fuzzy linguistic variables; fuzzy analytic network process; quality function deployment MSC:
94D05
1. Introduction
Due to the rapid changes in customer demand, product life cycles have become shorter. If the research and development (R&D) process takes too long, a product may no longer align with updated customer needs by the time it is launched, resulting in a loss of market competitiveness. Therefore, efficiency and speed are essential in the product development process to seize market opportunities. Companies are increasingly focusing on gathering and analyzing customer information and market data to respond to rapid market changes. This includes tracking the performance of their own products as well as that of competitors, enabling them to make informed decisions and stay competitive. By integrating and analyzing these data, the obtained information can serve as a valuable reference for new product development and design, enabling the R&D team to understand customer expectations and current market trends better. This proactive approach allows companies to develop new products that align with customer needs, rather than reacting only after their existing products are phased out by the market, thereby maintaining their competitive edge. New product development faces two main challenges. The first is the company’s R&D and process technology limitations, which result in prolonged lead times from product development to mass production. The second is the rapidly changing and often ambiguous nature of customer demands, making it difficult to define their expectations clearly. To overcome these challenges and avoid difficulties in product development, many companies have adopted quality function deployment (QFD) as an effective tool to support new product development, leading to significant improvements in the process.
This study proposes a new product development (NPD) model by integrating quality function deployment (QFD), decision-making trial and evaluation laboratory (DEMATEL), analytic network process (ANP), and fuzzy set theory to overcome the limitations of conventional QFD and ANP. For example, QFD does not consider the direction of relationships between customer requirements (CRs) and assumes engineering requirements (ERs) to be independent. The DEMATEL is employed here to examine the influence of CRs on ERs and the interrelationships among CRs and among ERs, with 2-tuple fuzzy linguistic variables applied to address imprecision and ambiguity in human judgment. The results are used to construct a revised house of quality (HOQ) that depicts these interdependencies. Fuzzy set theory is incorporated into ANP, forming the fuzzy analytic network process (FANP), to evaluate the HOQ network. Through expert input and FANP supermatrix calculations, the relative importance of ERs is determined, enabling the most critical ERs to be emphasized in NPD. This integrated approach facilitates collaboration among team members to align design strategies and prioritize requirements effectively during the product development stage.
Touch panels are crucial in integrating advanced electronics across various aspects of daily life, from home appliances and entertainment systems to banking, commercial, and industrial applications. Compared to traditional input methods such as keyboards, mice, or dedicated keypads, touch panels offer a more convenient, flexible, and cost-effective interface, seamlessly combining sophisticated hardware with algorithmic software to enhance user experience and functionality. A touch panel is an intuitive and engaging technology, making it accessible even to untrained users. These advantages enable designers and system integration engineers to continuously expand product features, functions, and applications, further enhancing the demand and added value of electronic technology in the global market. Thus, the proposed model is implemented in the case study of touch panel development.
The study is structured as follows. A review of relevant methodologies and recent literature is presented in Section 2. The proposed model is presented in Section 3. A case study is performed to demonstrate the adoption of the model in Section 4. Conclusions based on the study’s findings are given in Section 5.
2. Literature Review
2.1. Fuzzy Set Theory and 2-Tuple Fuzzy Linguistic Variables
Fuzzy set theory, first introduced by Zadeh in 1965, provides a framework for addressing problems where criteria are not sharply defined [1]. Since its inception, this theory has been widely applied across various fields, evolving in multiple directions. Two primary approaches have emerged: one treats fuzzy sets as precisely defined mathematical objects governed by classical logic, while the other follows a linguistic perspective. The linguistic approach operates on the principle that truth values are represented as fuzzy sets, and inference rules are approximate rather than exact [2].
In a universe of discourse , , a fuzzy subset A of can be characterized by a membership function and the set of ordered pairs is , where each element in is a real number in the interval of [0, 1] [3,4]. Because represents the grade of membership of in , a larger value indicates a stronger degree of belongingness for in . Triangular fuzzy numbers and trapezoidal fuzzy numbers are the most popularly used fuzzy numbers.
The 2-tuple fuzzy linguistic representation model was proposed by Herrera and Martínez [5] to improve the fuzzy linguistic approach. The linguistic information is represented by a pair of values , where s is a linguistic label and is a numerical value of the symbolic translation [6]. Let be a linguistic term set and be a value representing the result of a symbolic aggregation operation. The 2-tuple with the equivalent information to is [7]:
where round is the standard round operation, has the closest index label to , is the value of the symbolic translation, and g is the number of linguistic terms less one.
The inverse function transforms a 2-tuple to a non-integer value [7]:
To compare the linguistic information of 2 tuples, an ordinary lexicographic order is applied. Let and be two 2-tuples, if i < j, then is smaller than [6,8]. If i = j, then [6,8]:
- if > , then is bigger than ;
- if < , then is smaller than ;
- if = , then and represent the same information.
The addition of two 2-tuples and is [7]:
The arithmetic mean of 2-tuples , , …, and is [7]:
The normalization of each 2-tuple with , , …, and is:
2.2. Quality Function Deployment (QFD)
Quality function deployment (QFD) is a structured methodology designed to translate customer needs into specific technical features to enhance product or service quality [9]. QFD uses the house of quality (HOQ) as its primary analytical tool to systematically capture and prioritize customer needs and align them with engineering and production capabilities [9]. QFD typically unfolds across four interconnected phases: product planning, part deployment, process planning, and production planning [10,11,12,13]. Each phase is represented by a corresponding HOQ, which visually resembles the shape of a house and serves as a roadmap for quality planning and decision-making [9].
In the first phase, product planning, the HOQ plays a central role by integrating customer requirements (CRs), engineering requirements (ERs), and their interrelationships. This phase identifies gaps between customer expectations and company objectives, helping organizations prioritize design efforts [14,15,16,17]. Figure 1 presents the basic structural diagram of the HOQ. The development of the HOQ generally follows seven systematic steps [9,18]:
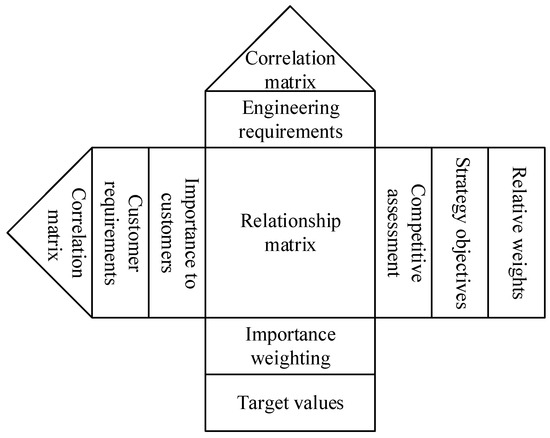
Figure 1.
HOQ structure.
- Identify customer requirements (CRs).
- Define corresponding engineering requirements (ERs).
- Establish the relationship matrix between CRs and ERs.
- Conduct a competitive analysis and compute the relative importance of CRs.
- Perform technical benchmarking against competitors.
- Determine the relationships among ERs.
- Calculate the weighted importance of ERs and consider additional design goals.
2.3. Decision-Making Trial and Evaluation Laboratory (DEMATEL)
Decision-making trial and evaluation laboratory (DEMATEL) is a structural modeling technique used to identify and analyze complex causal relationships among decision criteria [19,20]. By applying matrix-based computations, the DEMATEL reveals both direct and indirect influences among criteria and quantifies the strength of these relationships [20,21]. The outcome is typically presented in the form of a matrix or an influence diagram, illustrating the contextual interdependencies among system elements [20,22]. The procedure of the DEMATEL includes the following steps [19,20,21,23]:
- Construct the initial direct relation matrix. For a set of criteria, conduct pairwise comparisons to assess the degree of influence one criterion exerts on another. This results in a matrix.
- Normalize the direct relation matrix by dividing each element by the maximum row sum of the matrix.
- Compute the total relation matrix. Calculate the total relation matrix, which includes both direct and indirect effects.
- Find the interrelationship among the criteria. Set an appropriate threshold value to filter out negligible relationships from the matrix. Only those relationships with influence values greater than the threshold are retained. The remaining significant relationships are then visualized in a network diagram, which illustrates the cause–effect structure among the criteria while maintaining clarity and interpretability.
2.4. Analytic Network Process (ANP)
The analytic network process (ANP), developed by Saaty [24,25], is a generalization of the analytic hierarchy process (AHP). While the AHP structures decision problems in a unidirectional hierarchical form, the ANP replaces the hierarchy with a network, enabling the modeling of complex interdependencies among elements at various levels and clusters. Both the ANP and AHP are widely used multiple-criteria decision-making (MCDM) methodologies, but the ANP provides greater flexibility in capturing feedback and interrelationships among criteria and alternatives.
The ANP involves the following key steps [9,17,20,25,26]:
- Problem definition and network construction. Define the decision problem clearly and decompose it into a network of interrelated decision elements, such as criteria, sub-criteria, and alternatives.
- Pairwise comparisons and priority vector calculation. Conduct pairwise comparisons of elements within each cluster as well as across clusters, based on their influence on one another. The resulting judgments are used to compute eigenvectors, which represent the relative priorities of the elements.
- Supermatrix construction and limit supermatrix calculation. Organize the priority vectors into an unweighted supermatrix, reflecting the influence of each element on others. Normalize the supermatrix columns to form a weighted supermatrix, ensuring column stochasticity. Raise the weighted supermatrix to successive powers until it converges to a limit supermatrix, which captures the long-term stable influence weights among all elements.
- Selection of the optimal alternative. From the limit supermatrix, the final priority weights of the decision alternatives are found. The alternative with the highest weight is considered the most favorable option.
In situations involving vagueness or imprecision in expert judgments, fuzzy ANP (FANP) may be applied. The FANP integrates fuzzy set theory with the ANP by using linguistic terms for pairwise comparisons, which are then aggregated and defuzzified to yield crisp weights, allowing the methodology to better handle uncertainty in real-world decision-making contexts.
2.5. Relevant Past Works
QFD is a popular tool for the new product development process. To overcome the limitations of the conventional QFD, some improved QFD approaches or hybrid QFD methods have been developed by applying or integrating methodologies such as fuzzy set theory, interpretive structural modeling (ISM), DEMATEL, AHP, and ANP. Some recent works are reviewed here. Mistarihi et al. [27] integrated the FANP with the QFD to prioritize engineering characteristics (ECs) in wheelchair design. Using triangular fuzzy numbers to handle uncertainty, the approach captured interdependencies between customer needs (CNs) and ECs, and the inner dependence amongst them. The approach was effective and could support designers in developing high-quality, customer-centered products under uncertain conditions. Ocampo et al. [28] introduced a fuzzy QFD- multi-attribute decision-making (MADM) framework considering three aspects of sustainability, environmental stewardship, economic growth, and social well-being, known as the triple-bottom-line. By combining the AHP, DEMATEL, ANP, and fuzzy set theory, the framework could address interdependencies and uncertainties, and coordinate the transition of decisions across all four product development phases. Yazdani et al. [29] proposed an interval type-2 fuzzy sets DEMATEL-QFD model to evaluate and rank sustainable supply chain drivers. By navigating the customer value fuzziness and utilizing the group decision-making system, the technique could translate results into performance metrics and eliminate risks in the supply chain. The model was applied to an agricultural supply chain where risk and uncertainty existed. Chen et al. [30] presented an integrated MCDM method by combining the hesitant fuzzy linguistic term set (HFLTS), DEMATEL, and multi-objective optimization by ratio analysis plus full multiplicative form (MULTIMOORA) to prioritize quality characteristics (QCs) in the product design under uncertainty. The HFLTS addressed linguistic ambiguity, the fuzzy DEMATEL captured QC influence weights, and the extended MULTIMOORA incorporated both subjective and objective weights. A CNC machine tool case study validated the method’s feasibility and effectiveness. Deepu and Ravi [31] developed an integrated ANP-QFD model to identify and prioritize CRs and design requirements (DRs) for effective supply chain digitalization (SCD). By analyzing the interrelationships among the CRs and DRs and constructing an HOQ, the model could prioritize the CRs and DRs and support the decision-making in the supply chain digitalization process. Menon and Ravi [32] proposed an integrated ANP-QFD framework to enhance eco-efficiency in the electronics industry by identifying and prioritizing CRs and DRs. The ANP could capture interdependencies, and the QFD, via the HOQ, could translate customer needs into technical priorities. The approach could support sustainable product development by aligning design decisions with customer-driven eco-efficiency goals. Karasan et al. [33] proposed an approach that integrated the neutrosophic QFD, neutrosophic AHP, and DEMATEL for customer-oriented product design. The approach addressed uncertainty and indeterminacy in CRs and technical characteristics (TCs) by using neutrosophic numbers. The method effectively prioritized TCs, improving the incorporation of customer input, and strengthened the design process through a structured, multi-phase decision-making framework. A seat design of passenger cars was used to demonstrate the applicability of the approach. Lee and Kang [9] developed a model for developing a mobile payment service framework that was suitable for both consumers and businesses by integrating the Delphi method, ISM, QFD, ANP, and fuzzy set theory. Nisha et al. [34] constructed an integrated ANP-QFD framework to implement Quality 4.0 in the electronics industry by identifying and prioritizing interdependent CRs and DRs. While the QFD was used to build an HOQ, the ANP was applied to address the interdependency and prioritize the DRs. The model could support better decision-making, enhance product and service quality, and offer flexibility for Industry 4.0-based companies across the product life cycle.
To address the limitations of conventional QFD in handling imprecision, ambiguity, and interrelationships among factors and conventional ANP in completing lengthy and unclear questionnaires, this paper proposes an integrated model for an NPD framework by combining DEMATEL, QFD, and FANP with fuzzy set theory. Fuzzy set theory is applied to capture the uncertainty in experts’ judgments when completing questionnaires, while the DEMATEL identifies the impacts of CRs on ERs and the interrelationships within CRs and within ERs, distinguishing between one- and two-directional influences. This process reduces the number of pairwise comparisons in FANP by eliminating insignificant relationships. The FANP-QFD model is then constructed to calculate the priority of ECs, enabling systematic pairwise comparisons, ensuring consistency in expert opinions, and simultaneously accounting for interdependencies among factors. While some past works have integrated methodologies, such as QFD and AHP, QFD and ANP, QFD and DEMATEL, QFD and TOPSIS, and QFD and TOPSIS, this is the first work that proposes a framework with three phases: DEMATEL, QFD, and ANP, adopting the fuzzy set theory. As a result, the proposed model offers a more holistic and accurate prioritization of ECs compared to the linear point-scoring method in traditional QFD.
3. Proposed Model
The new product development model integrates DEMATEL, QFD, ANP, and fuzzy set theory. A flowchart of the model with three phases, DEMATEL, QFD, and ANP, is shown in Figure 2. Phase 1, DEMATEL, is to determine if there are significant interrelationships among the factors, i.e., the inner dependence among the CRs, the inner dependence among the ERs, and the influences of the CRs on the ERs. Phase 2, QFD, is to construct the HOQ. Phase 3, ANP, is to determine the relative importance of ERs. The steps are as follows.
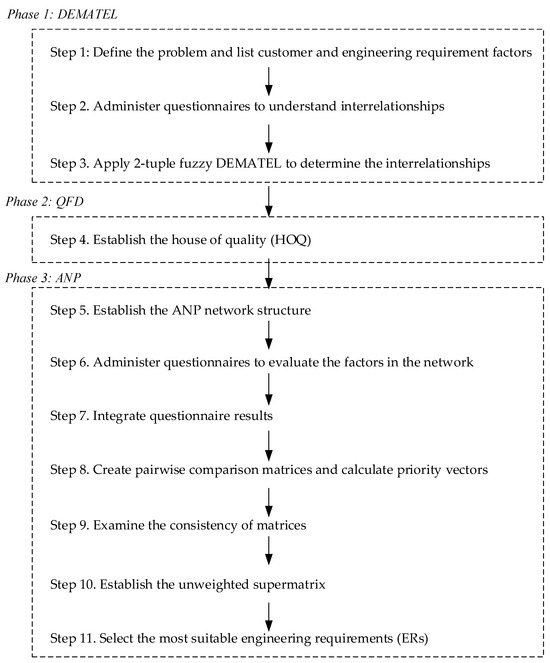
Figure 2.
Flowchart of the proposed model.
- Phase 1: DEMATEL
In this phase, a 2-tuple fuzzy DEMATEL is applied to identify significant interrelationships among factors, including the inner dependence among the CRs, the inner dependence among the ERs, and the influences of the CRs on the ERs. Three network relationship maps can be constructed as a result.
- Step 1: Define the problem and list customer and engineering requirement factors.
The sales team first identifies and compiles a list of customer requirement factor candidates relevant to the product. Then, customers evaluate these factors based on their importance, allowing the team to filter out and select the most critical customer requirement (CR) factors for further analysis. The design team identifies key engineering requirement (ER) factors for developing the product. Methods, such as interviews, questionnaires, and the Delphi method, can be used to collect the information and select the CRs and ERs.
- Step 2. Administer questionnaires to understand interrelationships.
A 2-tuple fuzzy linguistic variable questionnaire is designed based on the network to understand if there is inner dependence among the CRs, inner dependence among the ERs, and the influences of the CRs on the ERs. The linguistic variable scales can be found in Figure 3 and Table 1. The questionnaires are based on feedback from the experts in the design team.
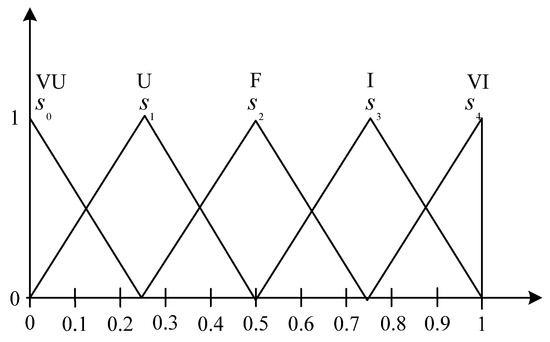
Figure 3.
Linguistic variable scales.

Table 1.
Linguistic variables for the influence weights.
- Step 3. Apply 2-tuple fuzzy DEMATEL to determine the interrelationships.
The inner dependence among the CRs, the inner dependence among the ERs, and the influences of the CRs on the ERs are determined by the 2-tuple fuzzy DEMATEL. Use the inner dependence among the CRs as an example; the steps of the 2-tuple fuzzy DEMATEL are as follows:
- Step 3.1.
- Obtain the linguistic matrix for CRs from each expert. Based on the feedback of the questionnaires, the linguistic variables, VI, I, F, U, and VU, are used to form a matrix for each expert. With the number of CRs being n, an n × n matrix is formed, and each cell represents the direct influence of CRi on CRj.
- Step 3.2.
- Calculate the aggregated initial direct relation matrix for CRs. The interrelationship of each pair of CRs evaluated by the experts is aggregated using the 2-tuple fuzzy arithmetic mean approach, and an n × n matrix S is obtained, where represents the direct influence of CRi to CRj. The diagonal elements of in the matrix are set to .
- Step 3.3.
- Calculate the normalized direct relation matrix. By multiplying to the initial direct relation matrix, the normalized direct relation matrix is obtained:where
- Step 3.4.
- Calculate the total relation matrix. The total relation matrix is:where I is the identity matrix.
- Step 3.5.
- Find the interrelationship among the CRs. Set a threshold value and obtain the network relationship map [17,20,35]. To illustrate the structural relationships among the criteria while maintaining the overall complexity of the system at a manageable level and avoiding the risks of misidentifying or oversimplifying influential criteria, it is essential to introduce a threshold value, denoted as to filter out negligible influence values from the total relation matrix T. A CR whose influence on another CR exceeds this threshold is deemed to have an influence on that CR in the network relationship map. Specifically, only those relationships in which the influence value exceeds the threshold are considered significant. To determine whether the CRs are interrelated, the threshold is first established by calculating the average of all values in the matrix, after which the experts may, at their discretion, set the threshold equal to, higher than, or lower than this average. Consequently, a network relationship map is constructed to represent the significant influences among the CRs visually. Another way to determine the interrelationship among the CRs can be performed using the Delphi method or the fuzzy Delphi method. The results of the total relation matrix T and the individual questionnaire are given to the experts for confirmation and changes of opinions, and several rounds may be necessary to obtain a consensus among the experts.
After determining the inner dependence among the CRs, the inner dependence among the ERs, and the influences of the CRs on the ERs, a complete network can be constructed.
- Phase 2: QFD
In this phase, a revised house of quality (HOQ) is constructed to include the inner dependence among the CRs, the inner dependence among the ERs, and the influences of the CRs on the ERs. Compared to the conventional HOQ, a triangle is added on the left-hand side of the HOQ to reflect the inner dependence among the CRs. In addition, while the conventional HOQ only considers if there is a relationship between two ERs, the direction of the influence is determined in this revised HOQ between every two CRs and every two ERs.
- Step 4. Establish the house of quality (HOQ)
The design team identifies key ER factors and, using the CRs gathered in Step 1, constructs the HOQ. This framework helps determine the relationship between CRs and ERs, forming a relationship matrix within the HOQ. An example of the HOQ is depicted in Figure 4. The inner dependence among the CRs is shown in the left-hand triangle, the inner dependence among the ERs is shown in the roof (top triangle), and the influences of the CRs on the ERs are shown in the rectangle on the right-hand side.
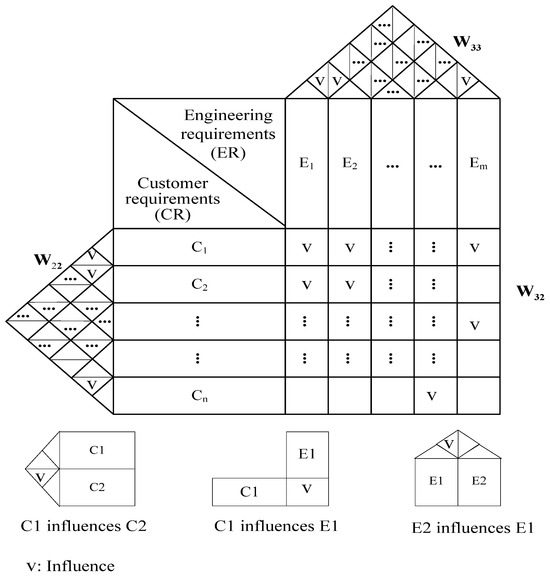
Figure 4.
A HOQ example.
- Phase 3: ANP
In this phase, the HOQ is used to construct a network, and the FANP is applied to calculate the relative importance of ERs.
- Step 5. Establish the ANP network structure.
The information in the HOQ is used to construct a network, as shown in Figure 5. The inner dependence among the CRs, as shown in the left-hand triangle in Figure 4, can be represented as a matrix , in Figure 5. The inner dependence among the ERs, as shown in the roof in Figure 4, can be represented as a matrix , in Figure 5. The influences of the CRs on the ERs, as shown in the rectangle on the right-hand side in Figure 4, can be represented as a matrix , in Figure 5.
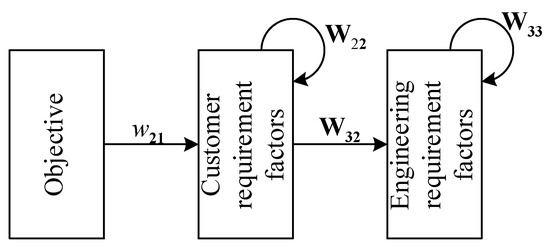
Figure 5.
Network for ANP.
- Step 6. Administer questionnaires to evaluate the factors in the network.
The questionnaire is designed based on the relationships in the network. While Saaty’s nine-point scale [24] is for discrete values, the experts’ judgments usually involve vagueness or imprecision. Thus, FANP is often applied by using linguistic terms for pairwise comparisons. There are different ways of defining linguistic variables and using fuzzy numbers in past works [9,17,35]. The linguistic variables for the importance weights are shown in Table 2 [35]. Customers assess the relative importance of the CRs, and the results are used to calculate . Other aspects in the network are assessed by experts from the design and development team, whose responsibilities include product development, design development, process improvement, etc. The results are used to calculate , and .
Table 2.
Triangular fuzzy numbers.
- Step 7. Integrate questionnaire results.
After performing fuzzy linguistic variable operations, represents the influence of factor i to factor j in questionnaire k, and the results of k questionnaires are integrated into a fuzzy pairwise comparison value .
where .
- Step 8. Create pairwise comparison matrices and calculate priority vectors.
After obtaining values such as , a pairwise comparison matrix is constructed. By applying the center of gravity (COG) method for defuzzification, a crisp value can be derived.
where .
Based on the pairwise comparison values, the pairwise comparison matrix is formed.
A priority vector is calculated for each pairwise comparison matrix by the following equation [24,25]:
where is the pairwise comparison matrix, w is the eigenvector, and is the largest eigenvalue of .
- Step 9. Examine the consistency of matrices.
The pairwise comparison matrices must be validated to ensure consistency. This involves calculating the consistency index (C.I.) and the consistency ratio (C.R.). If C.R. is below 0.1, the matrix is considered consistent. However, if it exceeds 0.1, the questionnaire must be re-evaluated by the experts to enhance consistency. The process may need several rounds until consistency is met.
where n represents the number of factors in the matrix, is the maximum eigenvalue of the matrix, and R.I. is the random index of the matrix. The values of R.I. vary depending on n, as shown in Table 3 [24].
Table 3.
Random index (R.I.).
- Step 10. Establish the unweighted supermatrix
After completing the consistency evaluation, the priority vectors are used to develop an unweighted supermatrix. The importance of the CRs, the interrelationships among the CRs, the impacts of the CRs on the ERs, and the interrelationships among the ERs are used to establish the unweighted supermatrix, as shown below:
where is a vector that represents the importance of CRs with respect to the goal, is a matrix that indicates the impact of CRs on ERs, shows the interrelationship of the CRs, and is the identity matrix.
- Step 11. Select the most suitable engineering requirements (ERs)
Convert the unweighted supermatrix into a weighted supermatrix. Raise the weighted supermatrix to obtain a limit supermatrix. The priority weights of the ERs can be found in the limit supermatrix. The higher the weight, the greater the priority for adoption. This method can select the optimal ERs based on their ranking.
4. Case Study
In the proposed model, the 2-tuple fuzzy DEMATEL first employs 2-tuple fuzzy linguistic variables to understand if there are interrelationships among CRs and among ERs, and if there are influences of CRs on ERs. The HOQ is constructed next based on the results, and the FANP then calculates the importance weights of the ERs. This approach provides concrete decision-making support for the R&D team during the new product development process. The empirical results of a case study in a touch panel manufacturer are presented here.
- Phase 1: DEMATEL
- Step 1: Define the problem and list customer and engineering requirement factors.
For the touch panel product problem to be studied, the sales team, based on current industry trends and customer interactions, compiles a list of candidate CR factors. Current customers and potential customers are invited to evaluate the importance of the factors. The most important CRs are selected, and they are transmittance (C1), linearity (C2), reliability (C3), surface hardness (C4), glass strength (C5), reasonable price (C6), touch sensitivity (C7), and low power consumption (C8). The ER factors are identified by the design team experts, who are responsible for analyzing and improving aspects such as materials, specifications, process parameters, and reliability issues. The most important ERs are substrate utilization (E1), indium tin oxide (ITO) impedance (E2), silver electrode impedance (E3), insulation layer impedance (E4), electrode impedance (E5), product yield rate (E6), product dimensions (E7), substrate properties (E8), shipment quality (E9), touch sensing technology (E10), and power control technology (E11).
- Step 2. Administer questionnaires to understand interrelationships.
To assess the interrelationships among CRs, the influence of CRs on ERs, and the interrelationships among ERs, this study employs a questionnaire-based approach incorporating the 2-tuple fuzzy DEMATEL method. Experts, as listed in Table 4, are invited to complete the questionnaire, using a five-point linguistic scale to rate the level of influence, as listed in Table 1.
Table 4.
Expert information.
- Step 3. Apply 2-tuple fuzzy DEMATEL to determine the interrelationships.
After the questionnaires are collected, the 2-tuple fuzzy DEMATEL is used to determine the interrelationships. The calculations of the interrelationships among CRs are performed here as an example. For instance, expert 1 assesses that the influence of linearity (C2) on transmittance (C1) is very important (VI), represented as , and the triangular fuzzy number is (0.75, 1, 1). The linguistic matrix for CRs from expert 1 is shown in Table 5. With five experts, an aggregated initial direct relation matrix S can be calculated as in Table 6. For example, the influences of linearity (C2) on transmittance (C1) assessed by the experts are VI, I, I, VI, and VI. Thus, they are represented by , , , and . The arithmetic mean using Equation (6) is calculated as follows:
Table 5.
Linguistic matrix for CRs from expert 1.
Table 6.
Aggregated initial direct relation matrix S for CRs.
The normalized direct relation fuzzy matrix is calculated using Equation (8), and the result is shown in Table 7. For example, is calculated as follows:
Table 7.
Normalized direct relation matrix for CRs.
The total relation matrix is calculated using Equation (10), and the result is shown in Table 8. To evaluate the interrelationships among CRs, a threshold value must first be established. This is determined based on the total-relation matrix. The average of all values within the matrix is calculated, yielding a mean value of 0.51. The threshold can be set at, above, or below this average, depending on the discretion of the expert committee. For instance, if the committee considers that even a moderate relationship between two factors warrants inclusion, a threshold lower than 0.51 may be adopted; conversely, a higher threshold can be set to emphasize only strong relationships. In this study, the committee sets 0.5 as the threshold. Accordingly, any value, in bold, in Table 8 that is equal to or greater than 0.5 indicates a significant relationship between the two CRs. The finalized interrelationships among the CRs are illustrated in Figure 6. For example, C2 (row) to C1 (column), C5 to C1, and C8 to C1 are bolded. These indicate that C2, C5, and C8 influence C1. These are shown in the arrows from C2, C5, and C8 to C1. The same procedures in Steps 2 and 3 are applied to assess the influence of CRs on ERs and the interrelationships among ERs. These results are depicted in Figure 7 and Figure 8, respectively. Note that another approach to determining the interrelationships among CRs is to use the Delphi method or the fuzzy Delphi method, in which the total relation matrix T and individual questionnaire results are provided to experts for review, allowing them to confirm or revise their opinions over multiple rounds until a consensus is reached.
Table 8.
Total relation matrix for CRs.
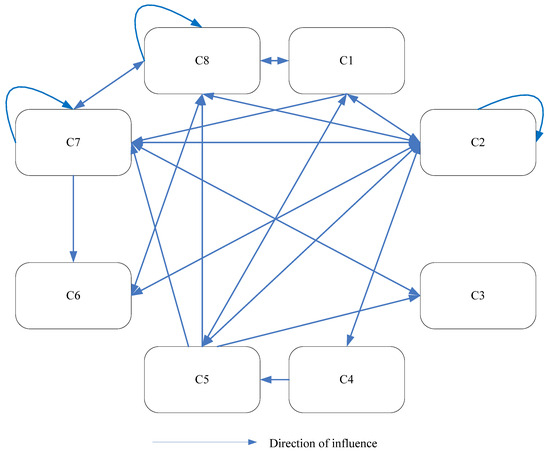
Figure 6.
The relationship among CRs.
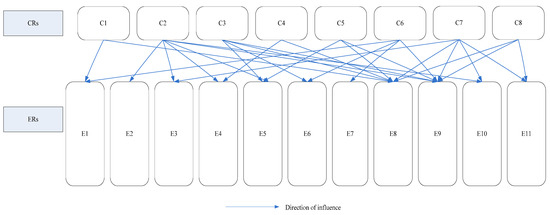
Figure 7.
The influences of CRs on ERs.
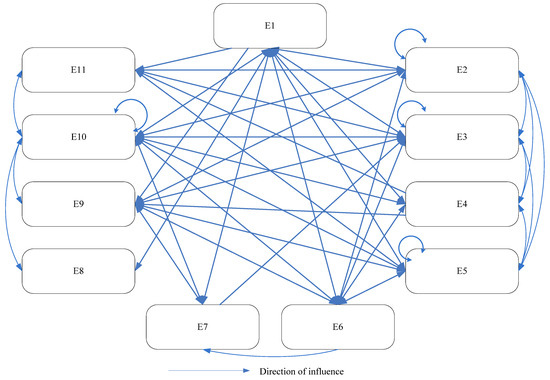
Figure 8.
The relationship among ERs.
- Phase 2: QFD
- Step 4: Establish the house of quality (HOQ).
Based on the interrelationships determined by the 2-tuple fuzzy DEMATEL, as shown in Figure 6, Figure 7 and Figure 8, the HOQ is constructed, as illustrated in Figure 9. Within this HOQ, the interrelationships among CRs and among ERs are evaluated, as are the influences of CRs on ERs. If no relationship exists between a pair of factors, the corresponding cell is left blank. The relationships among CRs in Figure 6 are shown in the left-hand triangle in the house of quality in Figure 9. For example, since C2, C5, and C8 influence C1, as shown in Table 8 and Figure 6 and described before, there are three checks from C2, C5, and C8, respectively, to C1 in the left-hand triangle in Figure 9. The influences of the CRs on the ERs in Figure 7 are shown in the rectangle on the right-hand side in Figure 9. The relationships among ERs in Figure 8 are shown in the roof (top triangle) in Figure 9.
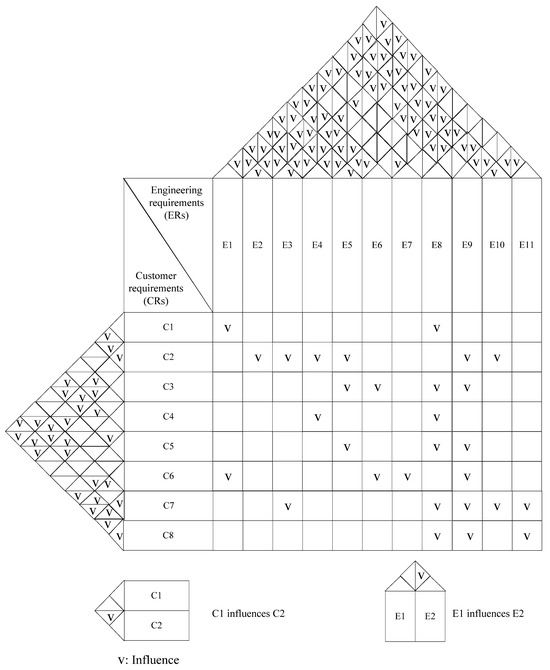
Figure 9.
House of quality for the touch panel.
- Phase 3: ANP
- Step 5. Establish the ANP network structure.
Based on the relationships in the HOQ in Figure 9, the ANP network can be developed, as illustrated in Figure 10.
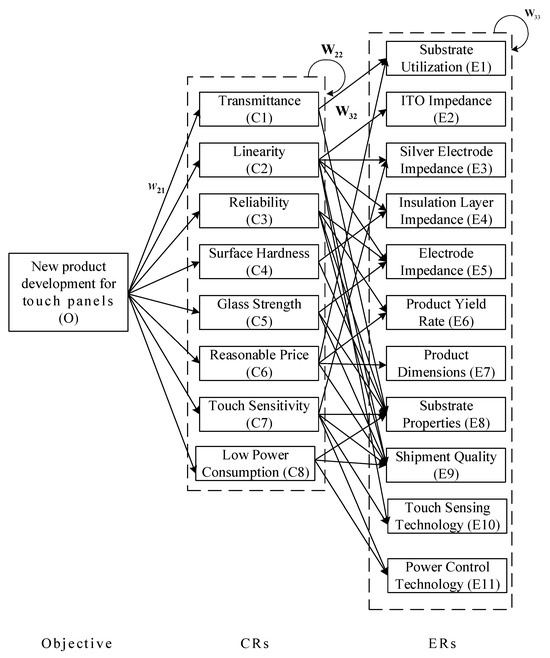
Figure 10.
ANP network for the touch panel.
- Step 6. Administer questionnaires to evaluate the factors in the network.
After establishing the network in Figure 10, a questionnaire is developed. The target respondents are professionals from a panel manufacturing plant located in central Taiwan. The five experts include two product developers, one design engineer, and two researchers, each with over seven years of experience in their respective fields. An example of a question in the questionnaire is “What is the relative importance of transmittance (C1) compared to linearity (C2) in a touch panel product,” and the linguistic variables are shown in Table 2.
- Step 7. Integrate questionnaire results.
The questionnaire results from the experts are integrated into matrices. For example, the responses of the five experts regarding the relative importance of C1 compared to C2 are as follows: moderately important (MI), moderately important (MI), weakly important (WI), weakly important (WI), moderately important (MI). A fuzzy pairwise comparison value C1 to C2 is:
The center of gravity (COG) method is applied to defuzzify , and is:
- Step 8. Create pairwise comparison matrices and calculate priority vectors.
Based on the defuzzified pairwise comparison values, pairwise comparison matrices can be developed. For example, the pairwise comparison matrix for CRs, , is:
The priority vector of the pairwise comparison matrix is calculated using Equation (14), and it is:
This indicates that C1 has a priority weight of 0.169, C2 has a priority weight of 0.078, etc. The most important customer requirement is touch sensitivity (C7), followed by transmittance (C1), reliability (C3), surface hardness (C4), and glass strength (C5). Touch sensitivity (C7) is important to customers because they expect a touch panel to respond quickly and accurately to their finger or stylus input, and high touch sensitivity ensures smooth and intuitive interactions. Transmittance (C1) ensures the screen remains bright and clear, and the readability and image quality of the panels can be improved with less power consumption. Reliability (C3) ensures consistent performance over a long period of time, even under frequent use or exposure to dust, moisture, or temperature changes. Lower risk of malfunction or downtime can lead to less maintenance and replacement costs. Surface hardness (C4) protects the touch panel from scratches, abrasions, and other physical damage during use, and it preserves touch accuracy and visual clarity. Glass strength (C5) ensures that the screen can withstand potential mechanical stress such as drops, impacts, bending, or pressure without cracking or breaking, and as a result, internal components can be protected and the overall service life of the device can be extended.
- Step 9. Examine the consistency of matrices.
The consistency of the pairwise comparison matrices is verified using the consistency index (C.I.) and the consistency ratio (C.R.). All calculated C.R. values need to fall within the acceptable threshold of 0.1 or less, indicating that the matrices are consistent and do not require revision or reevaluation. The consistency test of the pairwise comparison matrix using Equations (15) and (16) for CRs, , is:
Since C.R. is less than 0.1, the experts’ judgment is consistent. If the consistency test fails, the experts are required to fill out the specific part of the questionnaire again until a consensus is met.
- Step 10. Establish the unweighted supermatrix.
Based on the priority vectors of matrices, the importance of CRs (), the interrelationships among the CRs (), the impacts of CRs on ERs (), and the interrelationships among the ERs () are developed. These vectors and matrices are then used to construct the unweighted supermatrix using Equation (18), as shown in Table A1 in the Appendix A. For instance, , calculated in Step 8, is entered in the (2, 1) block of the unweighted supermatrix.
- Step 11. Select the most suitable engineering requirements (ERs)
The unweighted supermatrix is first transformed into a weighted supermatrix. By raising the weighted supermatrix to powers, a convergence can be met, and the result is a limit supermatrix (as shown in Table A2). From this final matrix, the priority weights of ERs can be determined, which are shown in the (3, 1) block of the limit supermatrix:
According to the results, the ERs are ranked in descending order of importance as follows: E10, E3, E6, E2, E9, E11, E4, E1, E5, E7, and E8. Touch sensing technology (E10) is a core functional technology that determines touch accuracy, delay, and sensitivity, and it affects the final user experience. Silver electrode impedance (E3) is the electrode layer bonded to ITO, and it determines the impedance stability of ITO and affects the accuracy of the sensing signal. Product yield rate (E6) is a key quality indicator representing overall yield and manufacturing stability, and it directly affects costs and shipments. ITO impedance (E2) is also important since ITO is a key layer of sensing conductor, and its impedance affects signal conduction and sensitivity.
5. Conclusions
Product innovation is a vital tool for the survival and competitiveness of companies. Companies that fail to design products aligned with customer needs and market demands often face the fate of being phased out or acquired. Understanding how to design products that truly meet customer needs before entering the new product development phase is one of the most crucial insights a company should possess. This study develops an integrated new product development model that applies quality function deployment (QFD), decision-making trial and evaluation laboratory (DEMATEL), analytic network process (ANP), and fuzzy set theory. The 2-tuple fuzzy linguistic variables are applied to convert vague opinions of the experts, and the DEMATEL is used to determine the interrelationships among the customer requirements (CRs), engineering requirements (ERs), and the influences of CRs on ERs. A revised house of quality (HOQ) is then developed, and the fuzzy analytic network process (FANP) is adopted to calculate the relative priorities of the ERs. This approach can assist the R&D team in obtaining solid decision-making support throughout the new product development process. A case study is carried out in a touch panel manufacturer. Based on the analytical results, touch sensing technology emerges as the most critical factor, followed by silver electrode impedance (E3) and product yield rate (E6), ITO impedance (E2), and touch sensing technology (E10). These key factors should be prioritized and incorporated into the design team’s evaluation framework for new product development, as they have the greatest influence on product performance and customer satisfaction. The research results are presented to the design team of the manufacturer, and the recommendations are well-received and are taken into consideration in their future design of touch panels. A future study can be carried out to examine the implementation of the integrated model in the R&D process, and to validate and verify the outcomes by both the customers and engineers.
The evaluation model proposed in this study can effectively validate the engineering requirements for new product development. It offers a practical decision-making reference for industry professionals, particularly when assessing improvements to manufacturing processes or evaluating the feasibility of new engineering design developments. The proposed model can be tailored and applied to the new product development in manufacturers in related sectors. A design team and personnel, by following the three phases and eleven steps in the proposed model and the detailed descriptions in the case study, should be able to proceed with the process and develop a suitable NPD model for a specific product.
In this study, questionnaires are applied to collect information from the experts individually, and methods such as the arithmetic mean and the geometric mean are used in different stages to simplify the process. Different weights for different experts may be applied, such as different weights for design vs. R&D experts, or different weights for different expertise. In addition, for reaching consensus among participating experts, the Delphi method or the fuzzy Delphi method may be adopted.
Additional experiments may be implemented to verify the superiority of the proposed model by comparing it with existing approaches, such as the traditional QFD, AHP, ANP, or other hybrid methods. In this research, the first phase, i.e., product planning, in the QFD is studied. The coordination of the transition of decisions across all four product development phases, that is, from product planning, part deployment, process planning, to production planning, can be our future research direction.
Author Contributions
Conceptualization, A.H.I.L. and H.-Y.K.; methodology, A.H.I.L. and H.-Y.K.; software, C.-J.L. and H.-Y.K.; validation, A.H.I.L.; formal analysis, A.H.I.L.; investigation, H.-Y.K.; resources, A.H.I.L. and C.-J.L.; data curation, C.-C.W. and H.-Y.K.; writing—original draft preparation, A.H.I.L. and H.-Y.K.; writing—review and editing, A.H.I.L. and H.-Y.K.; visualization, C.-C.W. and H.-Y.K.; supervision, A.H.I.L. and H.-Y.K.; project administration, A.H.I.L. and H.-Y.K.; funding acquisition, A.H.I.L. All authors have read and agreed to the published version of the manuscript.
Funding
This research was funded by the National Science and Technology Council in Taiwan, grant number NSTC 112-2410-H-216-003.
Data Availability Statement
The data presented in this study are available on request from the corresponding author.
Conflicts of Interest
The authors declare no conflicts of interest.
Appendix A
Table A1.
Unweighted supermatrix.
Table A1.
Unweighted supermatrix.
| O | C1 | C2 | C3 | C4 | C5 | C6 | C7 | C8 | E1 | E2 | E3 | E4 | E5 | E6 | E7 | E8 | E9 | E10 | E11 | |
|---|---|---|---|---|---|---|---|---|---|---|---|---|---|---|---|---|---|---|---|---|
| O | 0 | 0 | 0 | 0 | 0 | 0 | 0 | 0 | 0 | 0 | 0 | 0 | 0 | 0 | 0 | 0 | 0 | 0 | 0 | 0 |
| C1 | 0.169 | 0 | 0 | 0 | 0 | 0.216 | 0 | 0 | 0.269 | 0 | 0 | 0 | 0 | 0 | 0 | 0 | 0 | 0 | 0 | 0 |
| C2 | 0.078 | 0.143 | 0.115 | 0 | 0 | 0.112 | 0 | 0.119 | 0.126 | 0 | 0 | 0 | 0 | 0 | 0 | 0 | 0 | 0 | 0 | 0 |
| C3 | 0.165 | 0 | 0 | 0 | 0.625 | 0.259 | 0 | 0.319 | 0 | 0 | 0 | 0 | 0 | 0 | 0 | 0 | 0 | 0 | 0 | 0 |
| C4 | 0.116 | 0 | 0.180 | 0 | 0 | 0 | 0 | 0 | 0 | 0 | 0 | 0 | 0 | 0 | 0 | 0 | 0 | 0 | 0 | 0 |
| C5 | 0.116 | 0.249 | 0.163 | 0 | 0.375 | 0 | 0 | 0 | 0 | 0 | 0 | 0 | 0 | 0 | 0 | 0 | 0 | 0 | 0 | 0 |
| C6 | 0.097 | 0 | 0.087 | 0 | 0 | 0 | 0 | 0.123 | 0.114 | 0 | 0 | 0 | 0 | 0 | 0 | 0 | 0 | 0 | 0 | 0 |
| C7 | 0.176 | 0.403 | 0.320 | 1 | 0 | 0.298 | 0 | 0.322 | 0.359 | 0 | 0 | 0 | 0 | 0 | 0 | 0 | 0 | 0 | 0 | 0 |
| C8 | 0.082 | 0.205 | 0.134 | 0 | 0 | 0.116 | 1 | 0.117 | 0.132 | 0 | 0 | 0 | 0 | 0 | 0 | 0 | 0 | 0 | 0 | 0 |
| E1 | 0 | 0.375 | 0 | 0 | 0 | 0 | 0.157 | 0 | 0 | 0 | 0.051 | 0.261 | 0.055 | 0.051 | 0.074 | 0.107 | 0.156 | 0 | 0.051 | 0 |
| E2 | 0 | 0 | 0.237 | 0 | 0 | 0 | 0 | 0 | 0 | 0.111 | 0.095 | 0.000 | 0.10761 | 0.097 | 0.136 | 0 | 0 | 0.166 | 0.096 | 0.236 |
| E3 | 0 | 0 | 0.427 | 0 | 0 | 0 | 0 | 0.144 | 0 | 0.087 | 0.090 | 0.262 | 0.08775 | 0.085 | 0.124 | 0.172 | 0.255 | 0.143 | 0.080 | 0.231 |
| E4 | 0 | 0 | 0.000 | 0 | 0.5 | 0 | 0 | 0 | 0 | 0.079 | 0.077 | 0.260 | 0 | 0.074 | 0.103 | 0 | 0 | 0 | 0.067 | 0 |
| E5 | 0 | 0 | 0.098 | 0.189 | 0 | 0.442 | 0 | 0 | 0 | 0.072 | 0.070 | 0.000 | 0.06428 | 0.062 | 0.089 | 0 | 0 | 0.106 | 0.063 | 0.140 |
| E6 | 0 | 0 | 0 | 0.370 | 0 | 0 | 0.394 | 0 | 0 | 0.126 | 0.132 | 0.162 | 0.13636 | 0.130 | 0 | 0 | 0 | 0.208 | 0.120 | 0 |
| E7 | 0 | 0 | 0 | 0 | 0 | 0 | 0.102 | 0 | 0 | 0.038 | 0 | 0 | 0 | 0 | 0.054 | 0 | 0 | 0.070 | 0.037 | 0 |
| E8 | 0 | 0.625 | 0 | 0.117 | 0.5 | 0.192 | 0 | 0.137 | 0.131 | 0.043 | 0 | 0 | 0 | 0 | 0 | 0 | 0 | 0 | 0.040 | 0 |
| E9 | 0 | 0 | 0.237 | 0.325 | 0 | 0.366 | 0.347 | 0.140 | 0.345 | 0.111 | 0.125 | 0.054 | 0.125 | 0.118 | 0.152 | 0.284 | 0 | 0 | 0.106 | 0 |
| E10 | 0 | 0 | 0.000 | 0 | 0 | 0 | 0 | 0.296 | 0 | 0.175 | 0.201 | 0.000 | 0.240 | 0.215 | 0.269 | 0.437 | 0.589 | 0.308 | 0.181 | 0.393 |
| E11 | 0 | 0 | 0 | 0 | 0 | 0 | 0 | 0.283 | 0.524 | 0.156 | 0.158 | 0.000 | 0.184 | 0.167 | 0 | 0 | 0 | 0 | 0.159 | 0 |
Table A2.
Limit supermatrix.
Table A2.
Limit supermatrix.
| O | C1 | C2 | C3 | C4 | C5 | C6 | C7 | C8 | E1 | E2 | E3 | E4 | E5 | E6 | E7 | E8 | E9 | E10 | E11 | |
|---|---|---|---|---|---|---|---|---|---|---|---|---|---|---|---|---|---|---|---|---|
| O | 0 | 0 | 0 | 0 | 0 | 0 | 0 | 0 | 0 | 0 | 0 | 0 | 0 | 0 | 0 | 0 | 0 | 0 | 0 | 0 |
| C1 | 0 | 0 | 0 | 0 | 0 | 0 | 0 | 0 | 0 | 0 | 0 | 0 | 0 | 0 | 0 | 0 | 0 | 0 | 0 | 0 |
| C2 | 0 | 0 | 0 | 0 | 0 | 0 | 0 | 0 | 0 | 0 | 0 | 0 | 0 | 0 | 0 | 0 | 0 | 0 | 0 | 0 |
| C3 | 0 | 0 | 0 | 0 | 0 | 0 | 0 | 0 | 0 | 0 | 0 | 0 | 0 | 0 | 0 | 0 | 0 | 0 | 0 | 0 |
| C4 | 0 | 0 | 0 | 0 | 0 | 0 | 0 | 0 | 0 | 0 | 0 | 0 | 0 | 0 | 0 | 0 | 0 | 0 | 0 | 0 |
| C5 | 0 | 0 | 0 | 0 | 0 | 0 | 0 | 0 | 0 | 0 | 0 | 0 | 0 | 0 | 0 | 0 | 0 | 0 | 0 | 0 |
| C6 | 0 | 0 | 0 | 0 | 0 | 0 | 0 | 0 | 0 | 0 | 0 | 0 | 0 | 0 | 0 | 0 | 0 | 0 | 0 | 0 |
| C7 | 0 | 0 | 0 | 0 | 0 | 0 | 0 | 0 | 0 | 0 | 0 | 0 | 0 | 0 | 0 | 0 | 0 | 0 | 0 | 0 |
| C8 | 0 | 0 | 0 | 0 | 0 | 0 | 0 | 0 | 0 | 0 | 0 | 0 | 0 | 0 | 0 | 0 | 0 | 0 | 0 | 0 |
| E1 | 0.072 | 0.072 | 0.072 | 0.072 | 0.072 | 0.072 | 0.072 | 0.072 | 0.072 | 0.072 | 0.072 | 0.072 | 0.072 | 0.072 | 0.072 | 0.072 | 0.072 | 0.072 | 0.072 | 0.072 |
| E2 | 0.105 | 0.105 | 0.105 | 0.105 | 0.105 | 0.105 | 0.105 | 0.105 | 0.105 | 0.105 | 0.105 | 0.105 | 0.105 | 0.105 | 0.105 | 0.105 | 0.105 | 0.105 | 0.105 | 0.105 |
| E3 | 0.135 | 0.135 | 0.135 | 0.135 | 0.135 | 0.135 | 0.135 | 0.135 | 0.135 | 0.135 | 0.135 | 0.135 | 0.135 | 0.135 | 0.135 | 0.135 | 0.135 | 0.135 | 0.135 | 0.135 |
| E4 | 0.080 | 0.080 | 0.080 | 0.080 | 0.080 | 0.080 | 0.080 | 0.080 | 0.080 | 0.080 | 0.080 | 0.080 | 0.080 | 0.080 | 0.080 | 0.080 | 0.080 | 0.080 | 0.080 | 0.080 |
| E5 | 0.067 | 0.067 | 0.067 | 0.067 | 0.067 | 0.067 | 0.067 | 0.067 | 0.067 | 0.067 | 0.067 | 0.067 | 0.067 | 0.067 | 0.067 | 0.067 | 0.067 | 0.067 | 0.067 | 0.067 |
| E6 | 0.110 | 0.110 | 0.110 | 0.110 | 0.110 | 0.110 | 0.110 | 0.110 | 0.110 | 0.110 | 0.110 | 0.110 | 0.110 | 0.110 | 0.110 | 0.110 | 0.110 | 0.110 | 0.110 | 0.110 |
| E7 | 0.023 | 0.023 | 0.023 | 0.023 | 0.023 | 0.023 | 0.023 | 0.023 | 0.023 | 0.023 | 0.023 | 0.023 | 0.023 | 0.023 | 0.023 | 0.023 | 0.023 | 0.023 | 0.023 | 0.023 |
| E8 | 0.012 | 0.012 | 0.012 | 0.012 | 0.012 | 0.012 | 0.012 | 0.012 | 0.012 | 0.012 | 0.012 | 0.012 | 0.012 | 0.012 | 0.012 | 0.012 | 0.012 | 0.012 | 0.012 | 0.012 |
| E9 | 0.093 | 0.093 | 0.093 | 0.093 | 0.093 | 0.093 | 0.093 | 0.093 | 0.093 | 0.093 | 0.093 | 0.093 | 0.093 | 0.093 | 0.093 | 0.093 | 0.093 | 0.093 | 0.093 | 0.093 |
| E10 | 0.216 | 0.216 | 0.216 | 0.216 | 0.216 | 0.216 | 0.216 | 0.216 | 0.216 | 0.216 | 0.216 | 0.216 | 0.216 | 0.216 | 0.216 | 0.216 | 0.216 | 0.216 | 0.216 | 0.216 |
| E11 | 0.088 | 0.088 | 0.088 | 0.088 | 0.088 | 0.088 | 0.088 | 0.088 | 0.088 | 0.088 | 0.088 | 0.088 | 0.088 | 0.088 | 0.088 | 0.088 | 0.088 | 0.088 | 0.088 | 0.088 |
References
- Zadeh, L.A. Fuzzy sets. Inf. Control 1965, 8, 338–353. [Google Scholar] [CrossRef]
- Gupta, M.M.; Saridis, G.N.; Gaines, B.R. Fuzzy Automata and Decision Processes; Elsevier North-Holland: New York, NY, USA, 1977. [Google Scholar]
- Klir, G.I.; Yuan, B. Fuzzy Sets and Fuzzy Logic: Theory and Applications; Prentice-Hall International: London, UK, 1995. [Google Scholar]
- Chen, S.M. Evaluating weapon systems using fuzzy arithmetic operations. Fuzzy Sets Syst. 1996, 77, 265–276. [Google Scholar] [CrossRef]
- Herrera, F.; Martínez, L. A 2-tuple fuzzy linguistic representation model for computing with words. IEEE Trans. Fuzzy Syst. 2000, 8, 746–752. [Google Scholar] [CrossRef]
- Herrera, F.; Herrera-Viedma, E.; Martínez, L. A fuzzy linguistic methodology to deal with unbalanced linguistic term sets. IEEE Trans. Fuzzy Syst. 2008, 16, 354–370. [Google Scholar] [CrossRef]
- Tai, W.-S.; Chen, C.-T. A new evaluation model for intellectual capital based on computing with linguistic variable. Expert Syst. Appl. 2009, 36, 3483–3488. [Google Scholar] [CrossRef]
- Herrera, F.; Martínez, L.; Sánchez, P.J. Managing non-homogeneous information in group decision making. Eur. J. Oper. Res. 2005, 166, 115–132. [Google Scholar] [CrossRef]
- Lee, A.H.I.; Kang, H.Y. A model for developing a mobile payment service framework. Mathematics 2024, 12, 2052. [Google Scholar] [CrossRef]
- Zhang, X.; Bode, J.; Ren, S. Neural networks in quality function deployment. Comput. Ind. Eng. 1999, 31, 669–673. [Google Scholar] [CrossRef]
- Chen, Y.; Tang, J.; Fung, R.Y.K.; Ren, Z. Fuzzy regression-based mathematical programming model for quality function deployment. Int. J. Prod. Res. 2004, 42, 1009–1027. [Google Scholar] [CrossRef]
- Chen, K.-S.; Chen, H.T. Applying importance-performance analysis with simple regression model and priority indices to assess hotels’ service performance. J. Test. Eval. 2014, 42, 455–466. [Google Scholar] [CrossRef]
- Yu, C.-M.; Lai, K.-K.; Chen, K.-S.; Chang, T.-C. Process-quality evaluation for wire bonding with multiple gold wires. IEEE Access 2020, 8, 106075–106082. [Google Scholar] [CrossRef]
- Chan, L.K.; Kao, H.P.; Wu, M.L. Rating the importance of customer needs in quality function deployment by fuzzy and entropy methods. Int. J. Prod. Res. 1999, 37, 2499–2518. [Google Scholar] [CrossRef]
- Wang, J. Fuzzy outranking approach to prioritize design requirements in quality function deployment. Int. J. Prod. Res. 1999, 37, 899–916. [Google Scholar] [CrossRef]
- Chen, J.P.; Chen, K.-S. Comparing the capability of two processes using Cpm. J. Qual. Technol. 2004, 36, 329–335. [Google Scholar] [CrossRef]
- Lee, A.H.I.; Lin, C.-Y. An integrated fuzzy QFD framework for new product development. Flex. Serv. Manuf. 2011, 23, 26–47. [Google Scholar] [CrossRef]
- Lin, C.-Y.; Lee, A.H.I.; Kang, H.-Y. An integrated new product development framework—An application on green and low-carbon products. Int. J. Syst. Sci. 2015, 46, 733–753. [Google Scholar] [CrossRef]
- Liou, J.J.H.; Tzeng, G.H.; Chang, H.C. Airline safety measurement using a hybrid model. J. Air Transp. Manag. 2007, 13, 243–249. [Google Scholar] [CrossRef]
- Lee, A.H.I.; Kang, H.Y.; Lin, C.Y.; Chen, J.S. A novel fuzzy quality function deployment framework. Qual. Technol. Quant. Manag. 2017, 14, 44–73. [Google Scholar] [CrossRef]
- Chen, F.-H.; Hsu, T.-S.; Tzeng, G.-H. A balanced scorecard approach to establish a performance evaluation and relationship model for hot spring hotels based on a hybrid MCDM model combining DEMATEL and ANP. Int. J. Hosp. Manag. 2011, 30, 908–932. [Google Scholar] [CrossRef]
- Jassbi, J.; Mohamadnejad, F.; Nasrollahzadeh, H. A fuzzy DEMATEL framework for modeling cause and effect relationships of strategy map. Expert Syst. Appl. 2011, 38, 5967–5973. [Google Scholar] [CrossRef]
- Yang, J.L.; Tzeng, G.-H. An integrated MCDM technique combined with DEMATEL for a novel cluster-weighted with ANP method. Expert Syst. Appl. 2011, 38, 1417–1424. [Google Scholar] [CrossRef]
- Saaty, T.L. The Analytic Hierarchy Process; McGraw-Hill: New York, NY, USA, 1980. [Google Scholar]
- Saaty, T.L. Decision Making with Dependence and Feedback: The Analytic Network Process; RWS Publications: Pittsburgh, PA, USA, 1996. [Google Scholar]
- Kang, M.-S.; Chen, C.-S.; Ku, T.-T.; Lee, A.H.I.; Ku, T.-T.; Kang, H.-Y. Applications of FANP and BOCR in renewable energy study on the choice of the sites for wind farms. IEEE Trans. Ind. Appl. 2013, 49, 982–989. [Google Scholar] [CrossRef]
- Mistarihi, M.Z.; Okour, R.A.; Mumani, A.A. An integration of a QFD model with fuzzy-ANP approach for determining the importance weights for engineering characteristics of the proposed wheelchair design. Appl. Soft Comput. 2020, 90, 106136. [Google Scholar] [CrossRef]
- Ocampo, L.A.; Labrador, J.J.T.; Jumao-as, A.M.B.; Rama, A.M.O. Integrated multiphase sustainable product design with a hybrid quality function deployment—Multi-attribute decision-making (QFD-MADM) framework. Sustain. Prod. Consum. 2020, 24, 62–78. [Google Scholar] [CrossRef]
- Yazdani, M.; Wang, Z.X.; Chan, F.T.S. A decision support model based on the combined structure of DEMATEL, QFD and fuzzy values. Soft Comput. 2020, 24, 12449–12468. [Google Scholar] [CrossRef]
- Chen, Y.; Ran, Y.; Huang, G.; Xiao, L.; Zhang, G. A new integrated MCDM approach for improving QFD based on DEMATEL and extended MULTIMOORA under uncertainty environment. Appl. Soft Comput. 2021, 105, 107222. [Google Scholar] [CrossRef]
- Deepu, T.S.; Ravi, V. An integrated ANP–QFD approach for prioritization of customer and design requirements for digitalization in an electronic supply chain. Benchmarking 2021, 28, 1213–1246. [Google Scholar]
- Menon, R.R.; Ravi, V. Using ANP and QFD methodologies to analyze eco-efficiency requirements in an electronic supply chain. Clean. Eng. Technol. 2021, 5, 100350. [Google Scholar] [CrossRef]
- Karasan, A.; Ilbahar, E.; Cebi, S.; Kahraman, C. Customer-oriented product design using an integrated neutrosophic AHP & DEMATEL & QFD methodology. Appl. Soft Comput. 2022, 118, 108445. [Google Scholar] [CrossRef]
- Nisha, G.R.; Ravi, V. Implementation of Quality 4.0 framework in the electronics sector using ANP and QFD methodologies. Int. J. Qual. Reliab. Manag. 2025, 42, 1041–1080. [Google Scholar] [CrossRef]
- Lee, A.H.I.; Kang, H.Y.; Yang, C.Y.; Lin, C.Y. An evaluation framework for product planning using FANP, QFD and multi-choice goal programming. Int. J. Prod. Res. 2010, 48, 3977–3997. [Google Scholar] [CrossRef]
Disclaimer/Publisher’s Note: The statements, opinions and data contained in all publications are solely those of the individual author(s) and contributor(s) and not of MDPI and/or the editor(s). MDPI and/or the editor(s) disclaim responsibility for any injury to people or property resulting from any ideas, methods, instructions or products referred to in the content. |
© 2025 by the authors. Licensee MDPI, Basel, Switzerland. This article is an open access article distributed under the terms and conditions of the Creative Commons Attribution (CC BY) license (https://creativecommons.org/licenses/by/4.0/).