Article

A Swarm-Based Multi-Objective Framework for Lightweight and Real-Time IoT Intrusion Detection

by
Hessah A. Alsalamah
1,*,† and
Walaa N. Ismail
2,3,*,†
1
Deapatment of Information Systems, College of Computer and Information Sciences, King Saud University, Riyadh 11543, Saudi Arabia
2
Department of Management Information Systems, College of Business Administration, Al Yamamah University, Riyadh 11512, Saudi Arabia
3
Faculty of Computers and Information, Minia University, Minia 61519, Egypt
*
Authors to whom correspondence should be addressed.
These authors contributed equally to this work.
Mathematics 2025, 13(15), 2522; https://doi.org/10.3390/math13152522
Submission received: 3 July 2025 / Revised: 27 July 2025 / Accepted: 29 July 2025 / Published: 5 August 2025

Abstract

Internet of Things (IoT) applications and services have transformed the way people interact with their environment, enhancing comfort and quality of life. Additionally, Machine Learning (ML) approaches show significant promise for detecting intrusions in IoT environments. However, the high dimensionality, class imbalance, and complexity of network traffic—combined with the dynamic nature of sensor networks—pose substantial challenges to the development of efficient and effective detection algorithms. In this study, a multi-objective metaheuristic optimization approach, referred to as MOOIDS-IoT, is integrated with ML techniques to develop an intelligent cybersecurity system for IoT environments. MOOIDS-IoT combines a Genetic Algorithm (GA)-based feature selection technique with a multi-objective Particle Swarm Optimization (PSO) algorithm. PSO optimizes convergence speed, model complexity, and classification accuracy by dynamically adjusting the weights and thresholds of the deployed classifiers. Furthermore, PSO integrates Pareto-based multi-objective optimization directly into the particle swarm framework, extending conventional swarm intelligence while preserving a diverse set of non-dominated solutions. In addition, the GA reduces training time and eliminates redundancy by identifying the most significant input characteristics. The MOOIDS-IoT framework is evaluated using two lightweight models—MOO-PSO-XGBoost and MOO-PSO-RF—across two benchmark datasets, namely the NSL-KDD and CICIoT2023 datasets. On CICIoT2023, MOO-PSO-RF obtains 91.42% accuracy, whereas MOO-PSO-XGBoost obtains 98.38% accuracy. In addition, both models perform well on NSL-KDD (MOO-PSO-RF: 99.66% accuracy, MOO-PSO-XGBoost: 98.46% accuracy). The proposed approach is particularly appropriate for IoT applications with limited resources, where scalability and model efficiency are crucial considerations.

1. Introduction

According to the most recent IoT Analytics study, “State of IoT—Spring 2025”, approximately 14.4 billion active Internet connections were registered in 2022, representing an 18% increase in the number of IoT devices. The Internet of Things (IoT) refers to physical objects, sensors, and actuators that can communicate and interact with each other, as well as gather and share data online. Millions of applications and industries rely on these networked devices to transmit vital data [1]. Due to their advantages in enabling numerous innovative features through their network for remote monitoring and automation, as well as their connectivity to the cyber world, Industrial Control Systems (ICSs) and the IoT have become intimately related to the 4.0 and 5.0 Industrial Revolutions [2,3]. Many attacks, security flaws, and vulnerabilities cannot be detected by conventional security tools and practices such as access control, firewalls, and intrusion detection systems [4,5]. IoT infrastructure is becoming increasingly vulnerable to cyberattacks, prompting the identification of new threats and the development of methods to mitigate them. Such attacks exploit the robust capabilities of IoT services, utilizing high data rates, low latency, and dense device networks to overwhelm systems with a massive amount of traffic [6,7]. The computing and energy capabilities of many IoT devices are limited, making them more vulnerable to exploitation. Implementing lightweight intrusion detection systems (IDSs) is crucial to combating these attacks effectively.
Internet of Things (IoT) devices, also known as sensor nodes, serve as the primary sources of data collection through embedded sensors. Machine learning (ML) models have successfully addressed cybersecurity issues by learning from data and extracting relevant information. A sophisticated intrusion detection framework tailored to the Internet of Things (IoT) context begins with the preprocessing of data from sensor nodes to utilize modern ML techniques, such as ensemble models and hybrid models [8,9]. However, uncontrollable operational and environmental factors may adversely affect the data-gathering process, thereby introducing noise and inaccuracy, as well as increasing the computational load associated with the preprocessing of the data. Utilizing the best techniques for data refinement and selection is crucial for developing resilient, flexible, and real-time cybersecurity models that can effectively respond to the ever-evolving threat landscape [8,10]. ML and deep learning (DL) models encounter significant difficulties in detecting cyberattacks due to their high computational load and the need for massive training datasets with a large number of samples that contain redundant (highly correlated or duplicative) and even unrelated features (with no significant relationship) [10,11]. For any computational resource to be practical, it must be efficient for both training and operation, which may not be feasible in all settings. Furthermore, the sophisticated methods employed by ML models increase their computational complexity [12]. These high computing demands may compromise the ability to detect attacks in real time [13]. Furthermore, ML models may be vulnerable to sophisticated malicious attacks, underscoring the need for more robust defenses.
The tuning of classifiers’ hyperparameters has an additional profound influence on the efficacy of ML models. Hyperparameters serve as configuration settings for learning algorithms, and optimizing them is crucial for improving the overall performance and adaptability of intrusion detection mechanisms [2,5]. An improved detection rate and accuracy can be achieved by simultaneously detecting multiple attack classes. The increased training time and complexity of classification, however, will adversely affect performance. This results in a more complex system when hybrid intrusion detection techniques are employed to enhance accuracy and minimize false positives [13]. The example illustrates the trade-off between different goals. Hence, intrusion detection methods require multi-objective optimization algorithms to model multiple decision variables for the deployed classifiers, such as classification accuracy, model complexity, and convergence rate [6,14]. When various decision objective functions are available, the effectiveness of each function often depends on the choice of hyperparameters that affect the prediction model, allowing for the determination of the most effective set of parameters [6]. Additionally, it enhances the model’s ability to generalize across diverse landscapes and scenarios, thereby improving its adaptability in simulating sensor environments, aiming for accuracy, lightweight deployment, and ease of use [12,13].
The current study proposes a novel application of swarm-based multi-objective optimization in a real-world sensor environment using a hybrid model, the MOOIDS-IoT framework, which enhances IoT security by implementing a robust and adaptive threat detection mechanism. The proposed integrated approach combines parameter tuning and feature selection within a single optimization pipeline, as opposed to conventional methods that handle these tasks separately or overlook computational limitations. This stage is often omitted or ignored in publications, which limits their reproducibility and utility. This study fills a gap in the literature by combining feature selection with model parameter optimization and detailing the entire setup of the top-performing model. The benefits of this approach include improved performance, as well as ease of benchmarking and deployment in real-world environments. The contributions of this work are outlined as follows:
  • A unified hybrid, robust, and adaptive framework named MOOIDS-IoT is presented, combining Genetic Algorithm (GA)-based feature selection with Multi-Objective Particle Swarm Optimization (MOO-PSO). In contrast to traditional methods, the proposed methodology enhances model complexity, training time, classification accuracy, and convergence speed simultaneously within a single pipeline. Furthermore, an improved multi-objective particle swarm optimization algorithm (MOO-PSO) is utilized to fine-tune the hyperparameters of the machine learning models. The suggested approach automatically identifies and extracts the optimal model parameters (such as weights, thresholds, and specific features) from the Pareto-optimal front, thereby providing the best possible trade-off between performance measures.
  • The developed framework integrates two novel, optimized, practical, efficient, and lightweight machine learning-based models, MOO-PSO-XGBoost and MOO-PSO-RF, for detecting malicious traffic in the complex, high-dimensional, and dynamic landscape of IoT networks. The developed classifiers use regularized boosting and incremental training to handle evolving threat patterns. Additionally, their parallel processing capability and ensemble significantly improve classification accuracy and efficiency by focusing on the most relevant features, making them suitable for high-dimensional and complex traffic patterns. Several factors, such as accuracy, optimization time, and complexity, are extensively explored and presented.
  • A novel MOO-PSO algorithm is presented that integrates Pareto-based multi-objective optimization directly into the particle swarm framework, extending conventional swarm intelligence while preserving a diverse set of non-dominated solutions. Unlike standard PSO, which employs dimension-wise learning or relies on a single objective to select the best candidates, this algorithm directly optimizes multiple objectives. MOO-PSO is particularly well-suited for tasks such as model selection, where multiple performance criteria must be evaluated simultaneously. It offers a balanced trade-off between interpretability, multi-objective handling, and computational efficiency.
  • Two benchmark datasets are used to validate the framework: CICIoT2023, which provides a deeper and more realistic representation of the IoT threat landscape, and NSL-KDD, which is commonly used as a baseline. Performance evaluations demonstrate robustness against a variety of attacks, low false-positive rates, and high accuracy. Reduced redundancy and multi-objective parameter adjustment improve the effectiveness and interpretability of lightweight models for deployment on edge devices.

2. Related Work

Intrusion detection systems (IDSs) for the Internet of Things (IoT) have evolved through various approaches that utilize metaheuristics, machine learning, deep learning, and privacy-preserving mechanisms. This section outlines the major research themes relevant to the design of efficient IDSs in IoT environments, as described in Figure 1, categorized as feature optimization, hybrid learning models, graph-based approaches, and privacy-aware frameworks.
Metaheuristics have proven effective in selecting optimized features and enhancing detection performance. Subramani et al. combined multi-objective particle swarm optimization (MOPSO) with support vector machines, reducing the feature set from 41 to 11 while achieving 99.72% accuracy [15]. An optimized, heterogeneous, context-aware graph convolutional network was proposed in [16] to improve performance in 5G wireless networks. In this approach, the Giant Trevally Optimizer (GTO) is incorporated to efficiently optimize resource allocation, thereby overcoming the shortcomings of traditional algorithms in determining the optimal allocation of model parameters in sensor networks. The proposed model demonstrated notable improvements, achieving a 30.18% increase in throughput and a 31.28% reduction in energy consumption. Wei et al. proposed a multi-objective immune algorithm (MOIA) that utilizes elite selection to enhance accuracy across multiple attack types [17]. Capuchin search and horse herd optimization were similarly integrated for classification on the NSL-KDD and TON-IoT datasets [8,18]. Shanbhag et al. evaluated metaheuristic combinations (GA, PSO, and GWO) with various ML classifiers, reporting trade-offs in performance and complexity [19]. Li et al. further examined feature selection and extraction methods, identifying autoencoders with Random Forest as a high-performing pair [20].
Swarm intelligence, combined with deep learning, has gained traction in intrusion detection. Shi et al. developed a practical intrusion detection framework for IoT security by combining metaheuristic (MH) optimization algorithms with machine learning methods [21]. The framework is composed of three primary components: data preprocessing, feature selection, and ensemble classification. A new version of the Artificial Hummingbird Algorithm (AHA) has been introduced, featuring three substantial improvements over the original HA algorithm. By leveraging the suggested EAHA, the optimized ensemble system reduced the feature-set size by at least 69% across all datasets while maintaining or improving classification performance compared to models that use the entire set of features. A novel Bidirectional Gaussian Hummingbird Optimized End-to-End Blockchain (BGHO-E2EB) model was presented in [22] to identify and categorize cyberattacks in IoT contexts. To enhance the security and integrity of data transfer within IoT networks, the approach utilizes Ethereum-based smart contracts. The Gaussian Artificial Hummingbird Algorithm is applied to select features, reducing data dimensionality and processing time efficiently. Furthermore, a Bidirectional Long Short-Term Memory (Bi-LSTM) network is implemented to improve the accuracy of detection and classification. BGHO-E2EB was verified using widely used IoT security datasets, including UNSW-NB15, BOT-IoT, and NSL-KDD, achieving 98.7% accuracy, 96.3% precision, and a 99.5% security level compared to conventional methods.
Amin et al. proposed a hybrid Chaotic Zebra Optimization and LSTM model (CZOLSTM), outperforming several deep learning models on binary and multiclass tasks [23]. Elsedimy et al. integrated an Improved Grey Wolf Optimizer with Quantum SVM (QSVM-IGWO), reducing false positives while improving precision and recall [24]. Benmalek et al. employed PSO for feature optimization and used CatBoost, CNN, and other ML models to achieve superior performance on the RT_IoT2022 dataset [14]. Liu et al. optimized SDN-based detection using improved binary GWO with Random Forest [9].
Graph-based learning methods enhance contextual awareness in intrusion detection. Wu et al. proposed an attention-based Graph Neural Network (GNN) that constructs graphs based on log density and integrates a federated graph attention network mechanism, achieving privacy-preserving detection [25]. Karpagavalli et al. developed an edge implicit weighting and an aggregated graph Transformer, achieving 98.87% accuracy across four datasets [26].
With increasing concerns about privacy in IoT systems, blockchain and differential privacy mechanisms are emerging. Kumar et al. introduced a Federated Active Meta-Learning (FedAMLrn) framework with contextual anonymization-aware differential privacy and blockchain-based consensus, reaching 96.7% accuracy [27]. Alsadhan et al. conducted a comprehensive PRISMA-based review of blockchain-based privacy approaches in the IoMT [28] and proposed a hybrid model combining HIPAA and SDAIA identifiers with homomorphic encryption [29].
Salem et al. reviewed 60+ studies, identifying AI-based techniques—particularly ML, DL, and metaheuristics—as increasingly central to robust cybersecurity strategies [30]. Elahi et al. presented MOGCO-II, a novel optimizer benchmarked on ZDT functions, although not directly applied to IDS [31].
Table 1 summarizes the various objectives considered by different algorithms for intrusion detection. Despite the significant advancements in IoT intrusion detection through swarm intelligence, metaheuristics, and deep learning, several key limitations persist across prior studies, summarized as follows:
  • Many approaches prioritize detection accuracy without addressing real-time deployment efficiency or model interpretability—two crucial requirements for resource-constrained IoT environments.
  • While feature selection and optimization techniques have been explored, they are often implemented independently, leading to increased model complexity and suboptimal tuning.
The proposed MOOIDS-IoT framework addresses these limitations by tightly integrating feature selection (using the GA) and hyperparameter optimization (via multi-objective PSO) into a single pipeline, achieving a robust trade-off between accuracy, complexity, and uncertainty. This unified, lightweight, and explainable approach fills a significant gap by enabling the deployment of accurate, efficient, and interpretable IDS models suitable for real-time IoT settings, which existing solutions have yet to accomplish fully.

3. Methodology and Proposed Solution

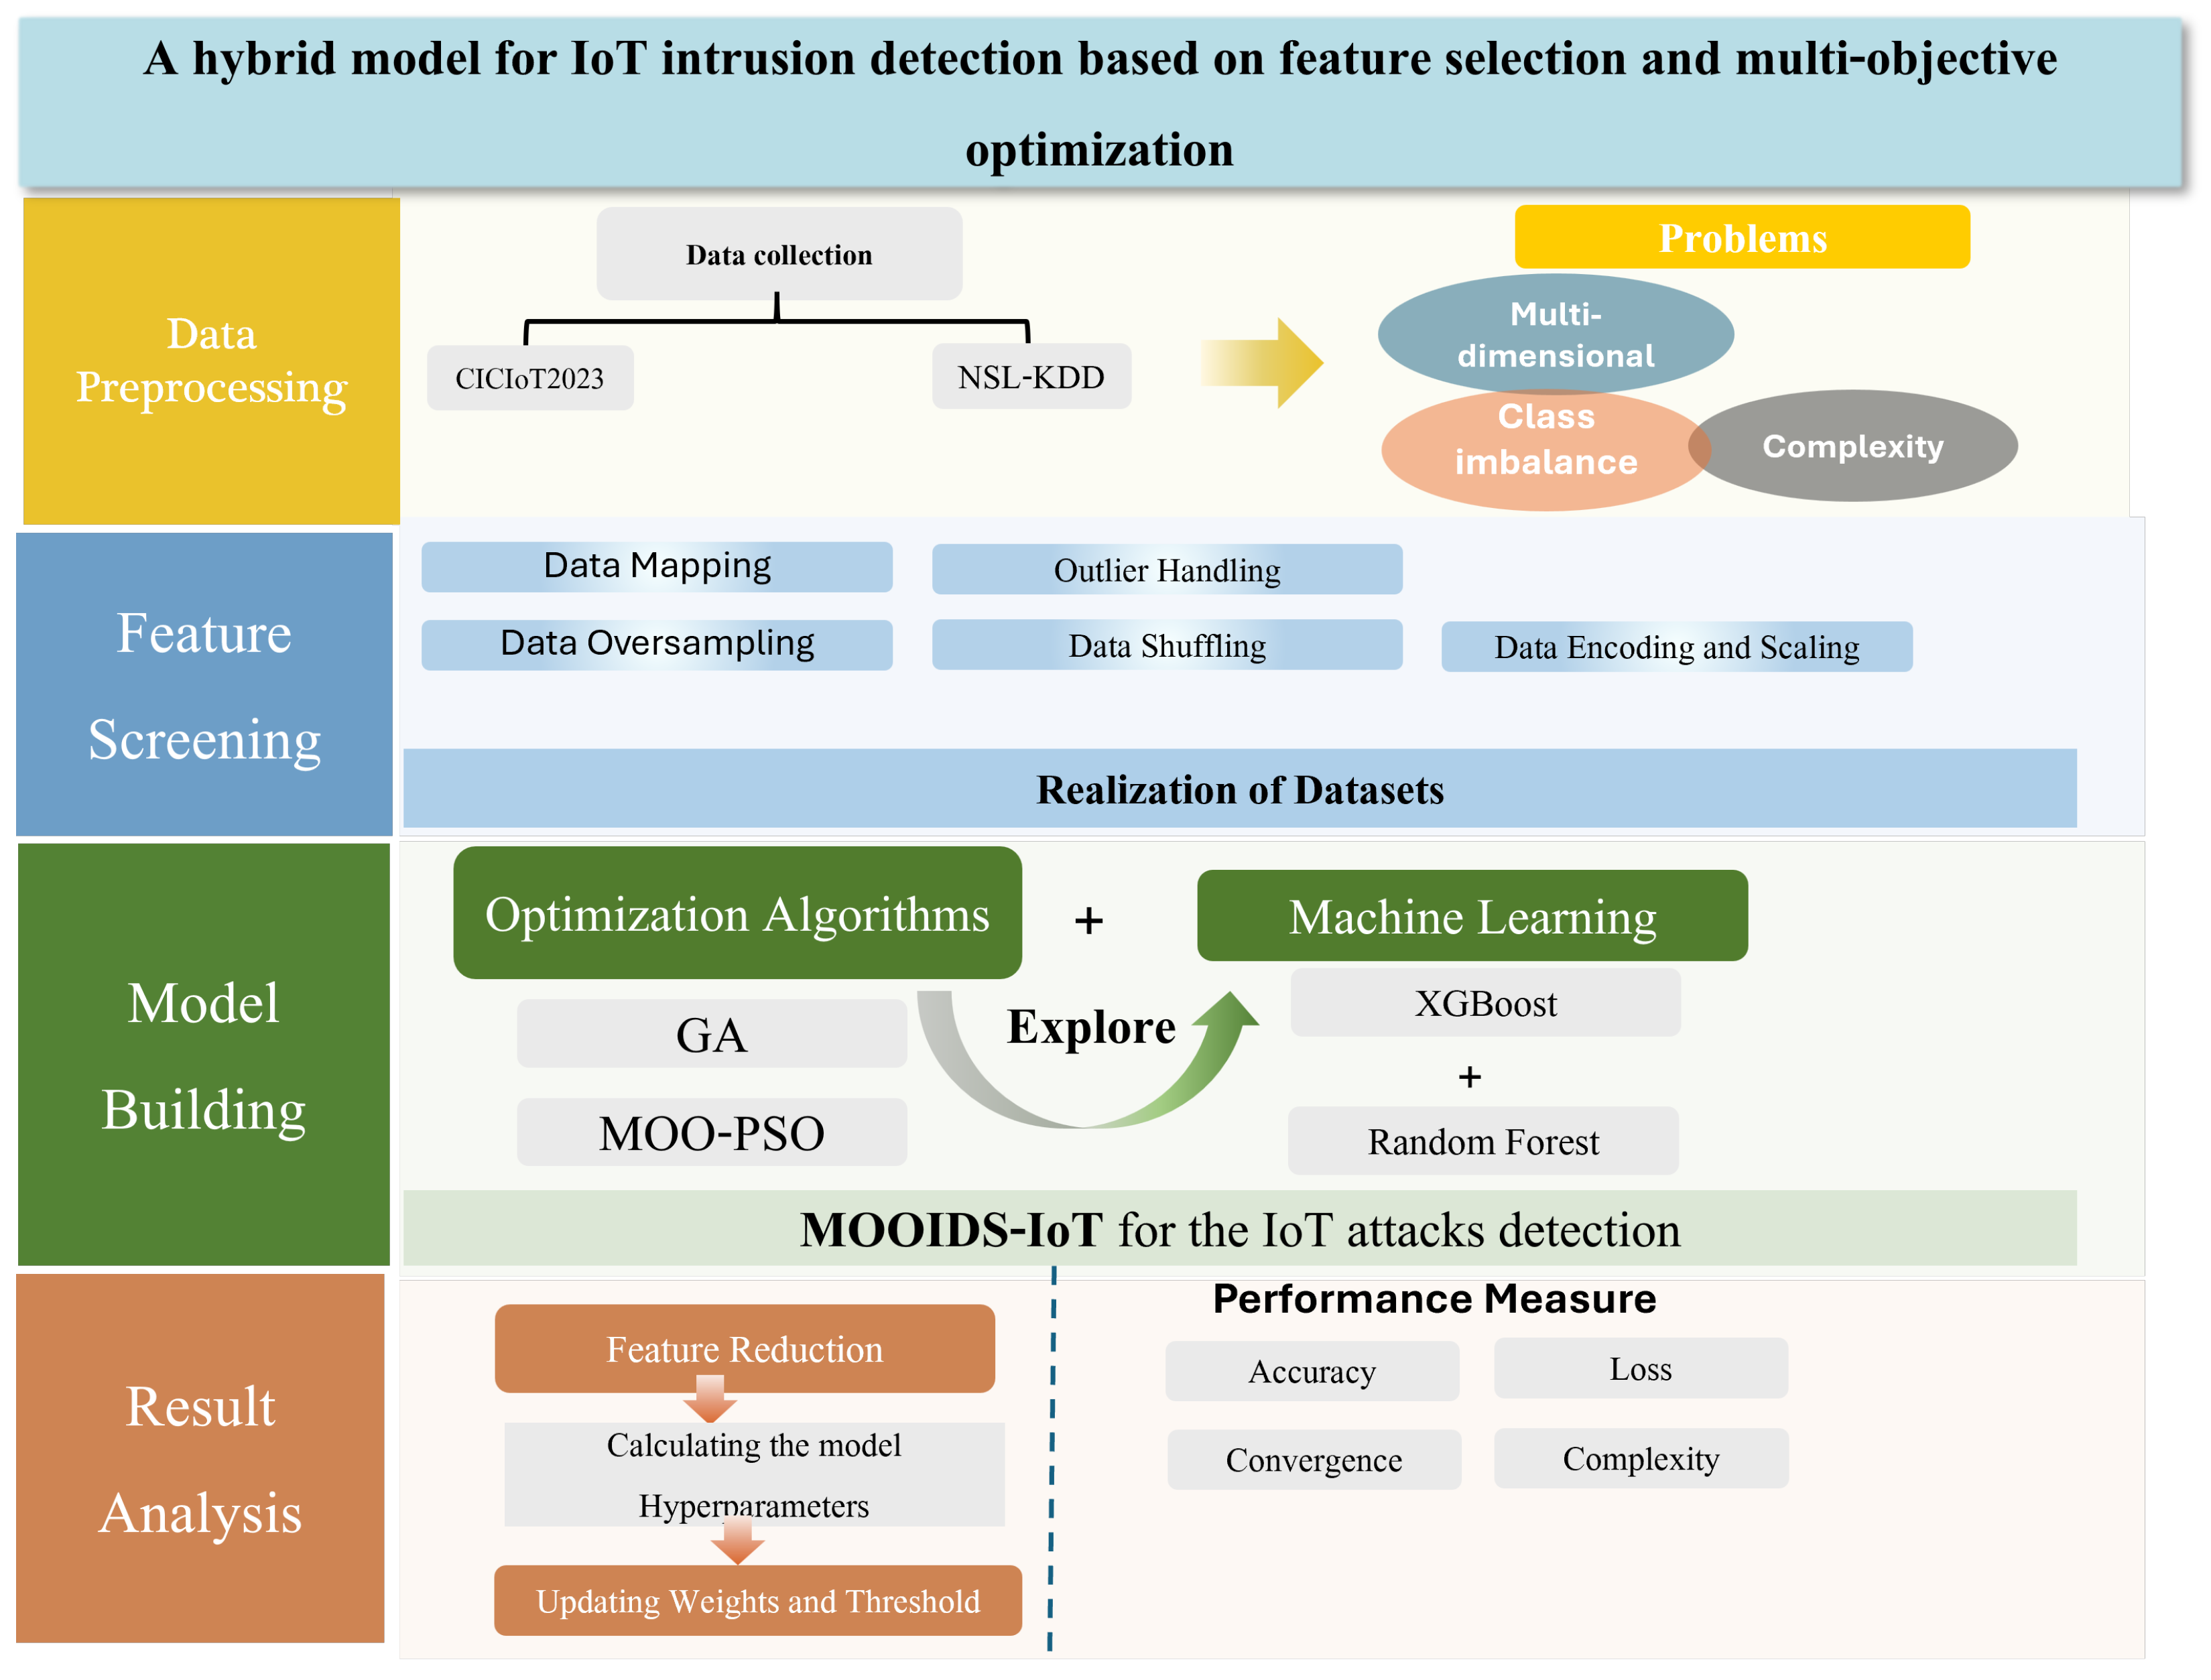
The proposed hybrid model (MOOIDS-IoT) framework, as demonstrated in Figure 2, with its main components listed in Table 2, enhances IoT security by implementing a robust and adaptive threat detection mechanism through a multi-objective optimization problem (MOO-PSO). MOO-PSO involves the simultaneous optimization of several objectives. In contrast to conventional multi-objective PSO variations that rely on fixed candidate selection and are prone to degeneration, MOO-PSO enhances exploration through noise injection and dynamically controls the Pareto archive to produce adaptable, varied solutions. This results in the optimization of conflicting goals becoming more flexible and robust. The preprocessing phase begins with data collection to address dynamic, multidimensional, imbalanced, and complex problems associated with sensor environments.
Afterwards, data encoding, scaling, shuffling, and normalization are performed, which standardize the data to improve accuracy, consistency, and processing efficiency. To identify the most relevant features, a genetic algorithm is employed, thereby reducing dimensionality and improving model performance. By removing redundant or noisy features, the model was able to avoid overfitting and gain from shorter trees and fewer boosting rounds. In contrast, feature reduction had even more significant effects on smaller datasets; by removing redundant or noisy features, the model was able to avoid overfitting. As a result of the optimizer’s efficient exploration of simpler configurations that converged more quickly, variance was reduced, and generalization was improved. The framework incorporates two new optimized XGBoost and Random Forest classifiers to detect and categorize cybersecurity threats. To evaluate the effectiveness of the proposed multilabel attack classification framework, the performance results were compared, both before and after feature reduction and multi-objective optimization processes. In the following subsection, the details of each step are explained.

3.1. Data Collection and Feature Screening

Machine learning (ML) models are highly dependent on the quality of the data used for training and evaluation.
This study utilizes two benchmark datasets:
  • CICIoT2023 [33] is a substantial dataset released in 2023, published by the Canadian Institute for Cybersecurity (CIC) for IoT intrusion detection. CICIoT2023 was based on a real-world configuration of 105 IoT devices. The collection comprises a total of 46 million network flow records, encompassing both malicious and benign traffic. It covers 33 scenarios in seven main categories, including DDoS, DoS, brute force, spoofing, Web attacks, reconnaissance, and Mirai-based attacks.
  • NSL-KDD [34] is a benchmark dataset developed based on the original KDD’99 to enhance both the quality of data and the fairness of the evaluation of intrusion detection research. The dataset captures four main types of attacks, including Denial of Service (DoS), probe, Remote to Local (R2L), and User to Root (U2R). Each record is defined by 41 attributes that reflect both fundamental and traffic-level behaviors.
    Despite NSL-KDD still being a commonly used baseline in intrusion detection research, CICIoT2023 offers a more contemporary and realistic perspective on IoT risks. Since it uniquely combines a wide range of complex attack vectors, many of which have never been combined in a single dataset, it is an excellent tool for assessing next-generation security solutions. However, CICIoT2023 has been largely neglected, despite its richness, particularly in terms of feature selection and swarm-based optimization.
There are many instances of data from various assaults in those datasets. As a result, processing the data samples stored there and combining them to incorporate every attack label is quite tricky and time-consuming.
To prepare the data for our algorithm, the following steps should be followed:
  • Outlier handling: The removal of NaNs and infinite values occurs at this stage.
  • Label encoding: At this stage, each instance of data associated with an attack is isolated. The LabelEncoder method is used to encode categorical labels.
  • Resampling and shuffling of data: The datasets have a problem with class imbalances that affects the distribution of classes. Resampling is performed using RandomOverSampler method to provide equal amounts of data from different attack categories, thereby balancing the distribution of data across all categories. This is necessary because overfitting occurs when one class has a relatively large number of samples compared to the others.
  • Normalization: Re-scaling data from its original range to a new range where all values fall between zero and one is known as data normalization. Therefore, all feature values were normalized to a range of zero to one using the min–max method.
Table 3 illustrates the differences between the developed optimized classifiers in terms of feature dimensionality and dataset size for the two datasets. The dimensions of the input features (X) and output labels (Y), as well as the number of samples, are provided for each dataset. As shown in NSL-KDD, MOO-PSO-RF utilizes 31 features, whereas MOO-PSO-XGBoost employs 30 features. This variation must be taken into account when analyzing classifier performance and generalization across datasets with varying scales and structures.

3.2. GA for Feature Selection

Data analysis using machine learning algorithms is significantly impacted by lengthy model construction procedures, redundant data, and reduced performance, all of which make data analysis extremely challenging. Feature selection (FS) is a crucial preprocessing step in resolving this problem. To select the best features, it removes distracting, noisy, and unclear data. FS algorithms primarily comprise two steps [35,36]: the search strategy and evaluation of subset quality. The search method selects subsets of features. Subsequently, a classifier is used to evaluate the quality of the subsets generated by the search strategy module. This paper presents a method for selecting features using the Genetic Algorithm (GA), which is employed to enhance the model’s accuracy while minimizing computational cost [35,36]. A genetic algorithm is a metaheuristic that is based on the principles of genetics and natural selection. By using it in feature selection, one can locate the most relevant and informative feature subsets, which, in turn, enhance the classifier’s performance.
Initially, following Algorithm 1, the features are ranked by their correlation with the target variable; features with higher correlation coefficients are frequently given the highest priority. The error rate measures the quality of a chosen feature subset during the optimization process. Lower mistake rates are associated with higher prediction accuracy and, therefore, improved fitness. Genetic algorithms employ biologically inspired processes, such as crossover, mutation, and selection, to iteratively evolve feature subsets.
A subset with a strong correlation and a low classification error is prioritized and passed on to the following generation, while a subgroup with poor performance is eventually eliminated. Feature selection using GA can be expressed as follows:
I i = α · error i + β · X i N
where α and β balance accuracy and feature reduction.
Algorithm 1 Genetic Algorithm for Attacks Feature Selection.
Require: 
A g e n t s , G e n e r a t i o n s , m u t a t i o n R a t e
Ensure: 
An optimal feature mask maximizes the correctness of a model.
  1:
SET self.num_agents = Agents
  2:
SET self.num_generations = Generations
  3:
SET self.mutation_rate = mutationRate
  4:
s e l f . p o p u l a t i o n Binary matrix with random shape ( s e l f . n u m _ a g e n t s , n u m F e a t u r e s )    ▹ Create initial population of agents (feature masks)
  5:
for  g e n e r a t i o n 1 to s e l f . n u m _ g e n e r a t i o n s  do
  6:
     f i t n e s s S c o r e s empty list
  7:
    for Each a g e n t in p o p u l a t i o n  do
  8:
        function Fitness Evaluation( N F e a t u r e s )
  9:
            s e l e c t e d _ f e a t u r e s { i f e a t u r e s i = 1 } ▹ Select indices with active features
10:
           if  l e n g t h ( s e l e c t e d _ f e a t u r e s ) = = 0  then return 0     ▹ Invalid individual: no features
11:
           end if
12:
            m o d e l InitializeClassificationModel()        ▹ e.g., XGBoost or RF
13:
            m o d e l . f i t ( X _ t r a i n _ s u b s e t [ s e l e c t e d _ f e a t u r e s ] , y _ t r a i n _ s u b s e t )
14:
            y _ p r e d m o d e l . p r e d i c t ( X _ t e s t [ s e l e c t e d _ f e a t u r e s ] ) ▹ Make predictions and calculate accuracy
15:
            a c c u r a c y CalculateAccuracy( y _ t e s t , y _ p r e d )
16:
           return  a c c u r a c y
17:
            f i t n e s s Fitness Evaluation( a g e n t )
18:
           Append f i t n e s s to f i t n e s s S c o r e s
19:
            p a r e n t s Top 50% of p o p u l a t i o n sorted by f i t n e s s S c o r e s     ▹ Select top half
20:
            n e x t P o p u l a t i o n empty list
21:
        end function
22:
        for  | n e x t P o p u l a t i o n | < s e l f . n u m _ a g e n t s  do
23:
            p a r e n t 1 , p a r e n t 2 Randomly select from p a r e n t s
24:
            p o i n t Random integer in [ 1 , l e n g t h ( p a r e n t 1 ) 1 ]
25:
            c h i l d Concatenate p a r e n t 1 [ : p o i n t ] and p a r e n t 2 [ p o i n t : ]
26:
           for  i 1 To l e n g t h ( c h i l d )  do
27:
               if  R a n d o m ( ) < s e l f . m u t a t i o n _ r a t e  then
28:
                    c h i l d [ i ] 1 c h i l d [ i ]                                                  ▹ Bit flip
29:
               end if
30:
           end for
31:
           Append c h i l d to n e x t P o p u l a t i o n
32:
        end for
33:
         p o p u l a t i o n n e x t P o p u l a t i o n
34:
    end for
35:
end for
36:
return Best agent in p o p u l a t i o n based on fitness

3.3. MOO-PSO Algorithm for Hyperparameter Tuning

In this paper, we present a multi-objective particle swarm optimization approach based on Pareto principles, inspired by the natural hunting behavior of animals. This paper proposes several competing objectives related to optimization issues, including improving accuracy, decreasing uncertainty, and reducing model complexity. A comparison of existing versions of PSO is shown in Table 4. The standard MOPSO may converge prematurely due to limited exploration strategies. Additionally, Pareto dominance may struggle with high computational costs in analyzing candidates and managing archives. This algorithm maintains an external archive of non-dominated solutions that comprise the Pareto front, enabling the selection of particle candidates and preserving variety, as described in Algorithm 2.
Algorithm 2 MOO-PSO Algorithm for Hyperparameter Tuning.
Require: 
Number of particles N, number of iterations T
Ensure: 
Pareto archive Solution A ( T )
  1:
Initialize particles { x i ( 0 ) , v i ( 0 ) } randomly
  2:
Initialize archive A ( 0 ) with non-dominated particles
  3:
for each iteration t = 1 to T do
  4:
    for each particle i = 1 to N do
  5:
        Select leader g i A ( t ) based on maximum crowding distance
  6:
        Calculate the fitness function of candidate solutions
  7:
        for each Agent f k  do ▹ Adjusts hyperparameters using a mix of personal best and global best positions from the Pareto front
  8:
           Sort solutions in A based on f k
  9:
           : Assign infinite distance to boundary solutions:
d i = if x i is at the boundary of the sorted list
10:
        end for                                                      ▹ MOO-PSO algorithm
11:
        function Update External Archive( S w a r m C a n d i d a t e x , S w a r m C a n d i d a t e y )
12:
           for each search vector or agent f k  do
13:
               Calculate the fitness of all search agents f k
14:
               Update intermediate solutions:
d i d i + f k ( i + 1 ) f k ( i 1 ) f k max f k min
15:
               Update velocity of current agent v i ( t ) :
v i ( t ) = w v i ( t 1 ) + c 1 r 1 ( p i x i ( t 1 ) ) + c 2 r 2 ( g i x i ( t 1 ) ) + α N ( 0 , σ 2 )
16:
               Update position of the current search agent x i ( t ) :
x i ( t ) = x i ( t 1 ) + v i ( t )
17:
               Combine current archive and new swarm solutions: C = A P
18:
               Identify non-dominated solutions in C
19:
               if  | C ND | N archive  then
20:
                   store all in the archive
21:
               end if
22:
               if  | C ND | > N archive  then
23:
                   Compute crowding distances
24:
                   Retain the top N archive most diverse solutions (highest d i values)
25:
               end if
26:
           end for
27:
           Evaluate objective vector f ( x i ( t ) )
28:
           if  x i ( t ) dominates p i  then
29:
               Update personal best: p i x i ( t )
30:
           end if
31:
            S w a r m C a n d i d a t e Update External Archive( x i ( t ) , y i ( t ) )
32:
           Append S w a r m C a n d i d a t e to A ( T )
33:
        end function
34:
    end for
35:
    Update archive A ( t ) with current non-dominated solutions and preserve diversity
36:
end for
37:
return Near-optimal Solution A ( T ) with high Convergence
Consider a search space (particle) in the swarm expressed as X R n and a multi-objective function, i.e.,
f ( x ) = f 1 ( x ) , f 2 ( x ) , f 3 ( x ) ,
where f 1 , f 2 , and f 3 are the set of m objective functions representing accuracy cost, uncertainty (log-loss), and model complexity.
The objective is to determine the set of Pareto-optimal solutions ( P ) such that
min x X f ( x ) .
For any two solutions ( x , y X ) with objectives of
f ( x ) = f 1 ( x ) , , f m ( x ) , f ( y ) = f 1 ( y ) , , f m ( y ) ,
x dominates y (denoted as x y ) if and only if
i { 1 , , m } , f i ( x ) f i ( y ) and j { 1 , , m } such that f j ( x ) < f j ( y ) .
The Pareto-optimal set P consists of all solutions in X that are not dominated by any other solution:
P = { x X y X : y x } .
Each particle (i) at iteration t is defined by position x i ( t ) X and velocity v i ( t ) R n .
Velocity is updated according to the following rule:
v i ( t + 1 ) = w v i ( t ) + c 1 r 1 p i x i ( t ) + c 2 r 2 g i x i ( t ) + α N ( 0 , σ 2 ) ,
where momentum is controlled by the weight of inertia (w), with c 1 , c 2 representing cognitive and social acceleration coefficients. The uniform random numbers r 1 , r 2 U ( 0 , 1 ) are defined for the best position ( p i ) of particle i. The best candidate ( g i ) is selected from the Pareto archive ( A ( t ) ), and α N ( 0 , σ 2 ) represents a Gaussian noise term that encourages exploration (prey scouting). The particle positions are updated as follows:
x i ( t + 1 ) = x i ( t ) + v i ( t + 1 ) ,
with bounding to keep x i ( t + 1 ) X .
Candidates ( g i ) are selected from the archive ( A ( t ) ) based on maximization of diversity metrics (distance):
g i = arg max x A ( t ) crowdingDistance ( x ) .
The N e x t a r c h i v e most varied solutions (with the highest d i values) are kept.
The prey-hunting analogy identifies three categories of swarm behavior: collaboration (sharing information via the Pareto archive), exploitation (moving toward personal and global bests), and exploration (random search). Through this equilibrium, challenging objective landscapes can be navigated effectively. To mimic prey hunting, the algorithm divides the swarm behavior into the following types:
  • Exploration (surveillance): Adding Gaussian noise to velocity updates, preventing premature convergence, i.e.,
    v i e x p l o r e ( t + 1 ) = α N ( 0 , σ 2 ) .
  • Exploitation (hunting): Searching for personal and global best solutions, i.e.,
    c 1 r 1 ( p i x i ( t ) ) + c 2 r 2 ( g i x i ( t ) ) .
  • Cooperation: The Pareto archive is used to exchange information that drives the movement of the swarms.
The following objective functions are used in the current study to update the swarm search space:
F1: 
Accuracy: Accuracy is a primary objective for ML classifiers.
F2: 
Log loss: Log loss is calculated to account for uncertainty in the predicted probabilities.
F3: 
Complexity (model size): Complexity is represented by the number of features (n_features) that the model uses, striking a balance between accuracy and simplicity.
The MOO-IoTDoS framework proposed in this study leverages Particle Swarm Optimization (PSO) and Multi-objective Optimization (MOO) to optimize the hyperparameters of two machine learning models: Random Forest (RF) and XGBoost (XGB). The main goal is to optimize for accuracy, log loss, and model complexity, generating a set of Pareto-optimal solutions that balance these objectives.

3.3.1. Optimized XGBoost (XGB) Model with PSO-MOO

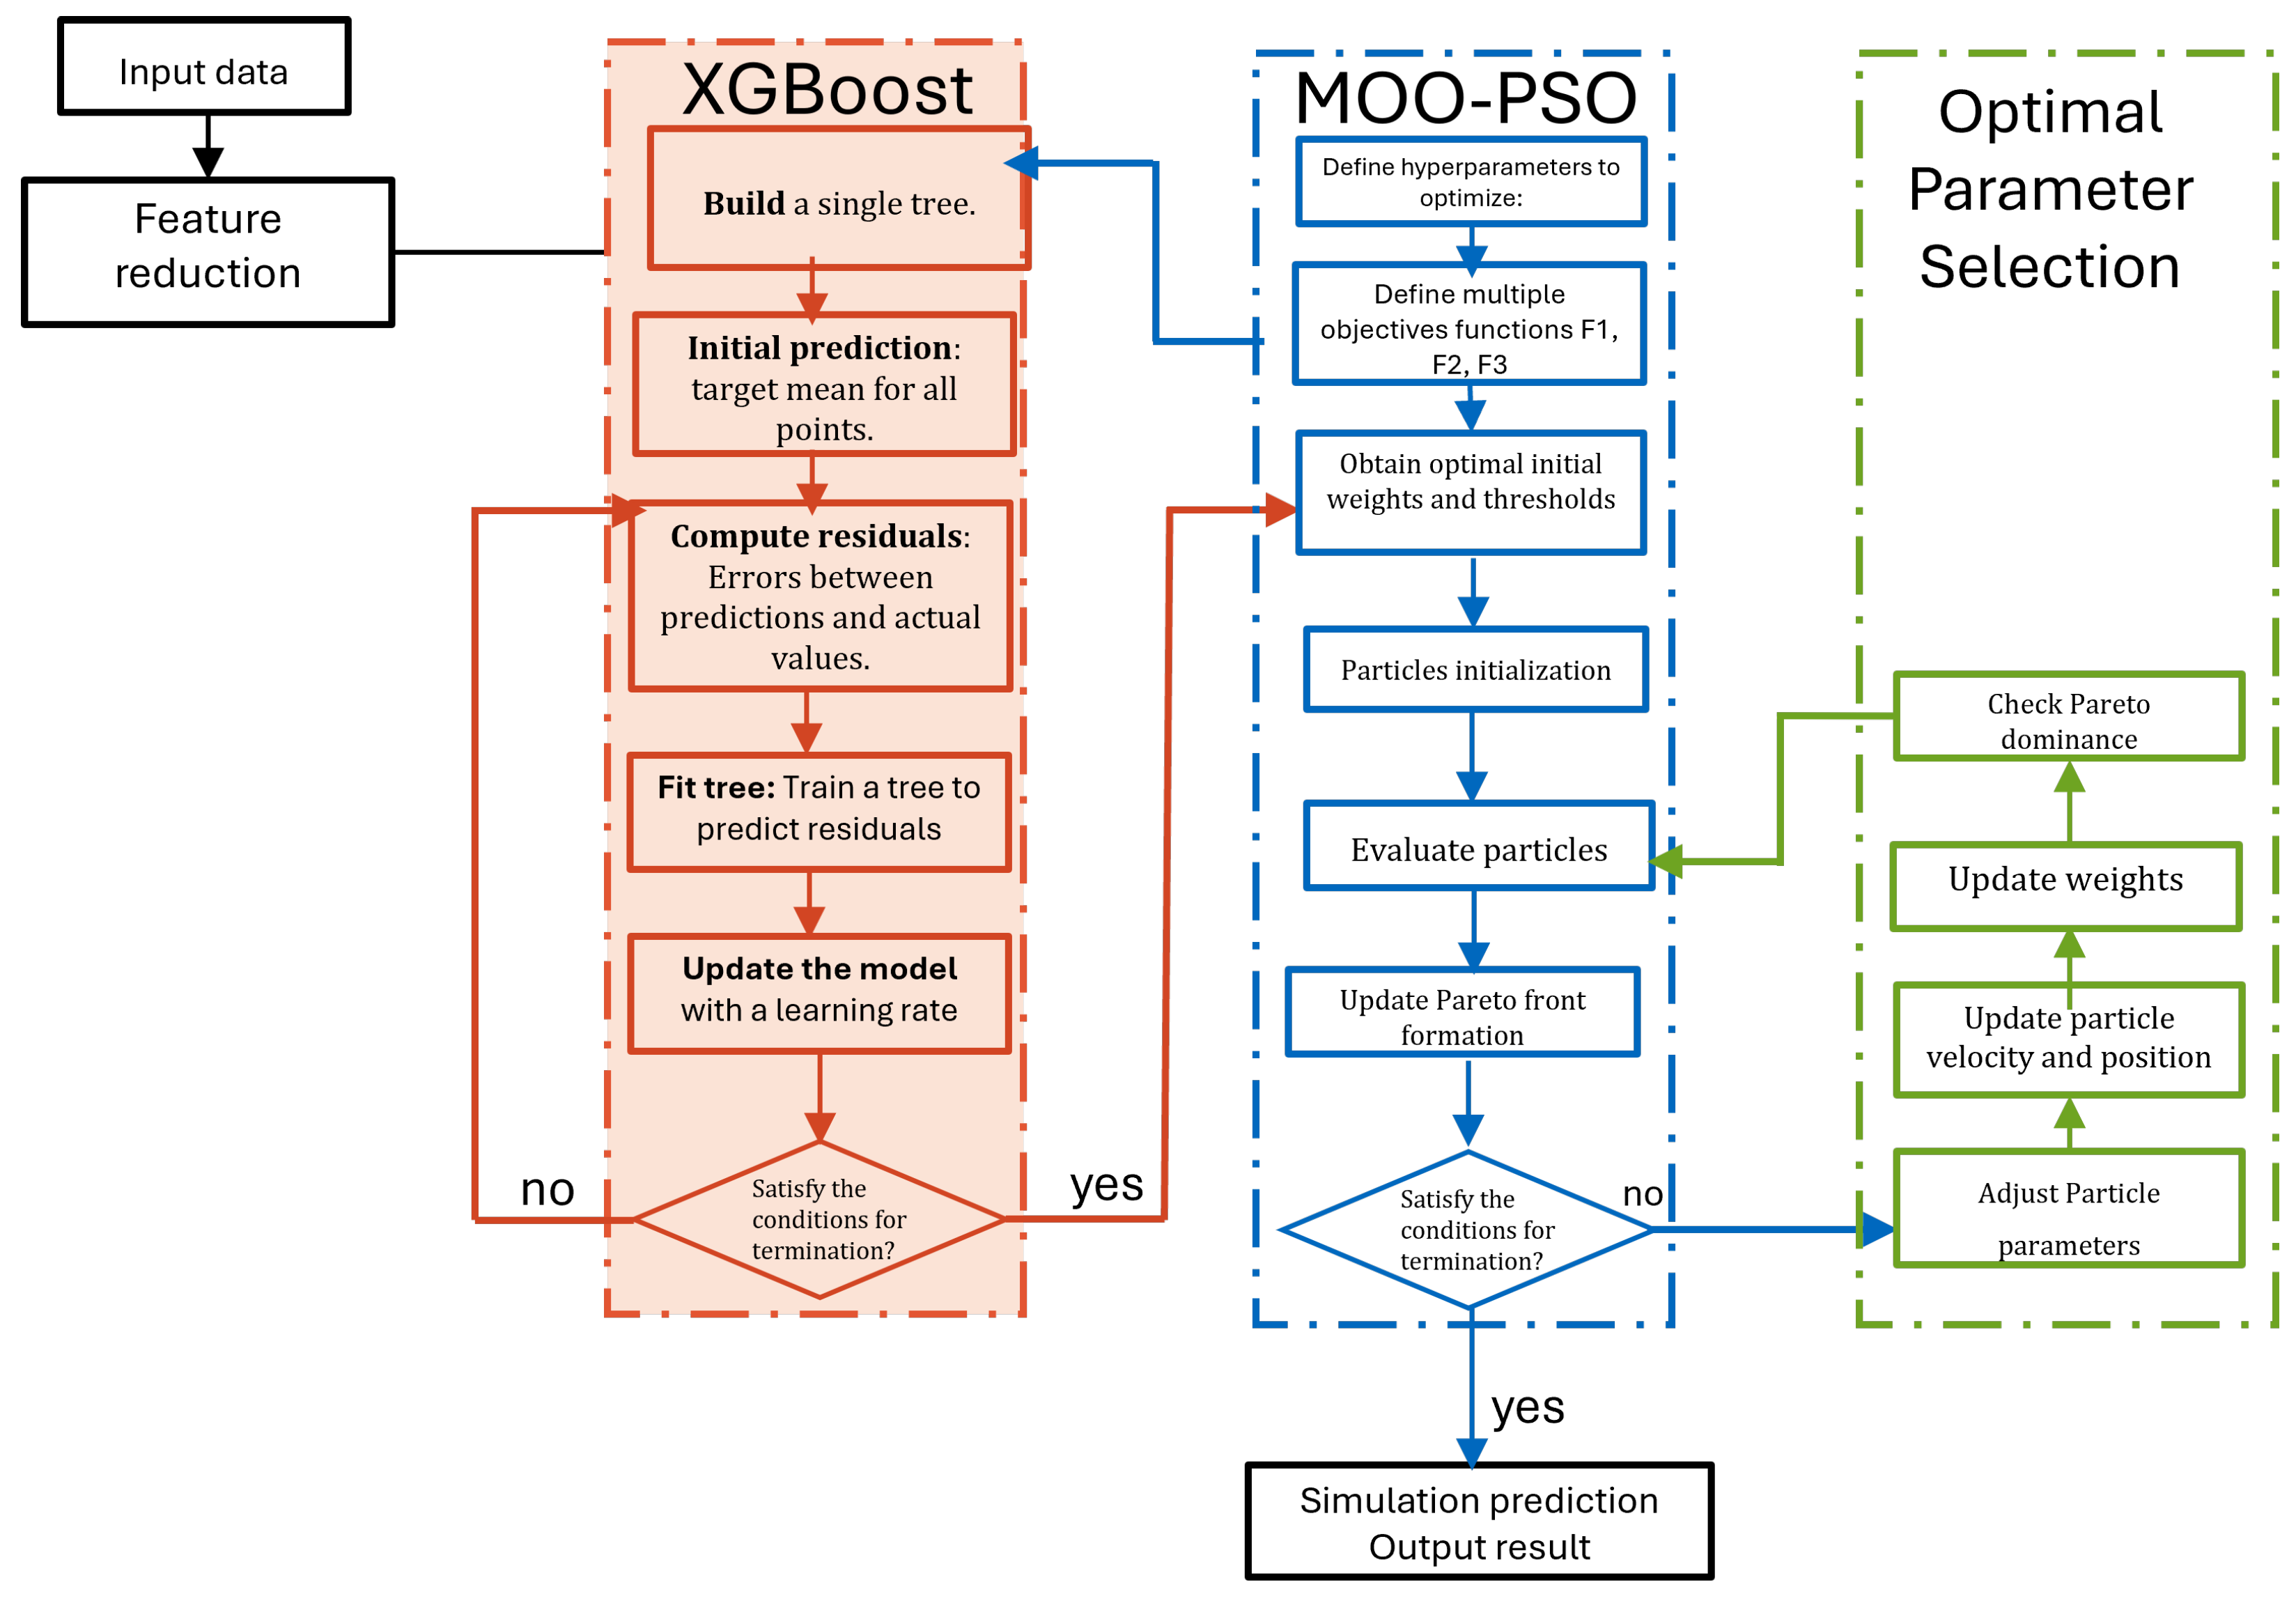
Friedman developed an iterative approach to decision trees known as gradient boosting decision trees (GBDTs). Using extreme gradient boosting, a model with hundreds or even thousands of trees can be generated. Each iteration of XGBoost provides profound insights into the collected data, and its predictive capabilities far exceed those of most traditional techniques. The XGBoost approach can also be used to implement flexible distributed and parallel computations. This results in the use of XGBoost in our present work to develop a generic prediction model for network attacks and prevent model overfitting on imbalanced data. XGBoost is composed of two components, as illustrated in Figure 3: the regression tree and gradient boosting, with the appropriate trimming. To learn from the k 1 regression trees, the method employs a sequential tree-building mechanism, similar to boosting, where the gradient of each tree decreases in size. XGBoost’s loss function includes an extra regularization term at the end of each iteration to prevent overfitting during the aggregation process. As a result, the final learned weights are smoothed.
y ^ i = k = 1 K f k ( x i , y i ) , f k D t
Using the total prediction score of all trees, it is possible to express the estimated output ( y ^ i ) of the XGBoost tree model in space D t as follows: If a training dataset includes ( x 1 , y 1 ) , , ( x m , y m ) , then the prediction score (leaf weight) is assigned by the k k-th model for input x i X , and label y i Y is assigned for a leaf node ( j j ). In a tree, each leaf node receives a score determined by the function expressed as f k ( x i ) , whereas T represents the entire collection of base tree models.
Obj = i L ( y ^ i , y i ) + k Ω ( f k )
where, in F1, L is the loss function, measuring the difference between predicted and actual values and in F2, Ω is the regularization term that controls model complexity:
Ω ( f ) = γ N + 1 2 λ w 2
where N is the number of leaves in the tree, w is the leaf weight vector, and γ and λ are regularization parameters. Each time a boosting step updates the prediction, the output of the newly learned tree is added to the prediction (t):
y ^ i ( t ) = y ^ i ( t 1 ) + f t ( x i )
The updated objective function for iteration t is then
Obj ( t ) = i L ( y ^ i ( t 1 ) + f t ( x i ) , y i ) + Ω ( f t ) .
Instances belonging to the same leaf node can be grouped. In this manner, the objective function can be restructured by summing over leaves. In iteration t, the goal for the j-th leaf is expressed as follows:
Obj ( t ) = i g i f t ( x i ) + 1 2 h i f t 2 ( x i ) + Ω ( f t )
Leaf nodes are grouped by objective as follows:
Obj ( t ) = j = 1 N i I j g i w j + 1 2 i I j h i + λ w j 2 + γ N
where: For N number of leaves, the set of instances I j in leaf j has a score of w j predicted using regularization parameters λ and γ .
When we set the multi-objective of w j to zero, we obtain the optimal value of w j , which is expressed as follows:
w j = i I j g i i I j h i + λ
A reduction in the objective function can be achieved by substituting the optimal weights ( w j ) back into Equation (4).
Obj ( t ) ( q ) = 1 2 j = 1 T i I j g i 2 i I j h i + λ + γ N
Hyperparameter optimization was performed using the fitness function defined in Section 3.3. Hyperparameters tuned in the study are illustrated in Table 5, including the learning rate to control the speed of learning and avoid overfitting. Gamma is used to penalize overly complex trees, providing regularization. Additionally, m a x d e p t h limits the depth of trees, preventing overfitting on training data.
The following objective functions are used to optimize the mentioned parameters:
F1: 
Accuracy: Accuracy is a primary objective for XGBoost.
F2: 
Log loss: Log loss is calculated to account for uncertainty in the predicted probabilities.
F3: 
Complexity (model size) is represented by the number of features (n_features) that the model uses, striking a balance between accuracy and simplicity.

3.3.2. Optimized Random Forest (RF) Model with PSO-MOO

A random forest provides an additional level of unpredictability to bagging. Furthermore, random forests alter the way the classification is constructed by building a tree based on a different bootstrap sample of the data. A random forest does not use gradients or Hessians to maximize a second-order objective function, unlike boosting models such as XGBoost. The trees are constructed separately by selecting splits that are diverse enough to minimize error metrics (such as mean squared error or Gini impurity).
In random forests, instances that fall into the same leaf node are still grouped for voting (classification) or averaging (regression), even though gradients are not used as grouping factors or optimal leaf weights are calculated analytically. A leaf (j) can be forecasted by applying the following formula: f j:
w j = 1 | I j | i I j y i
where the set of instances ( I j ) is assigned to leaf j, the true target labels are represented by y i , and w j is the average (regression).
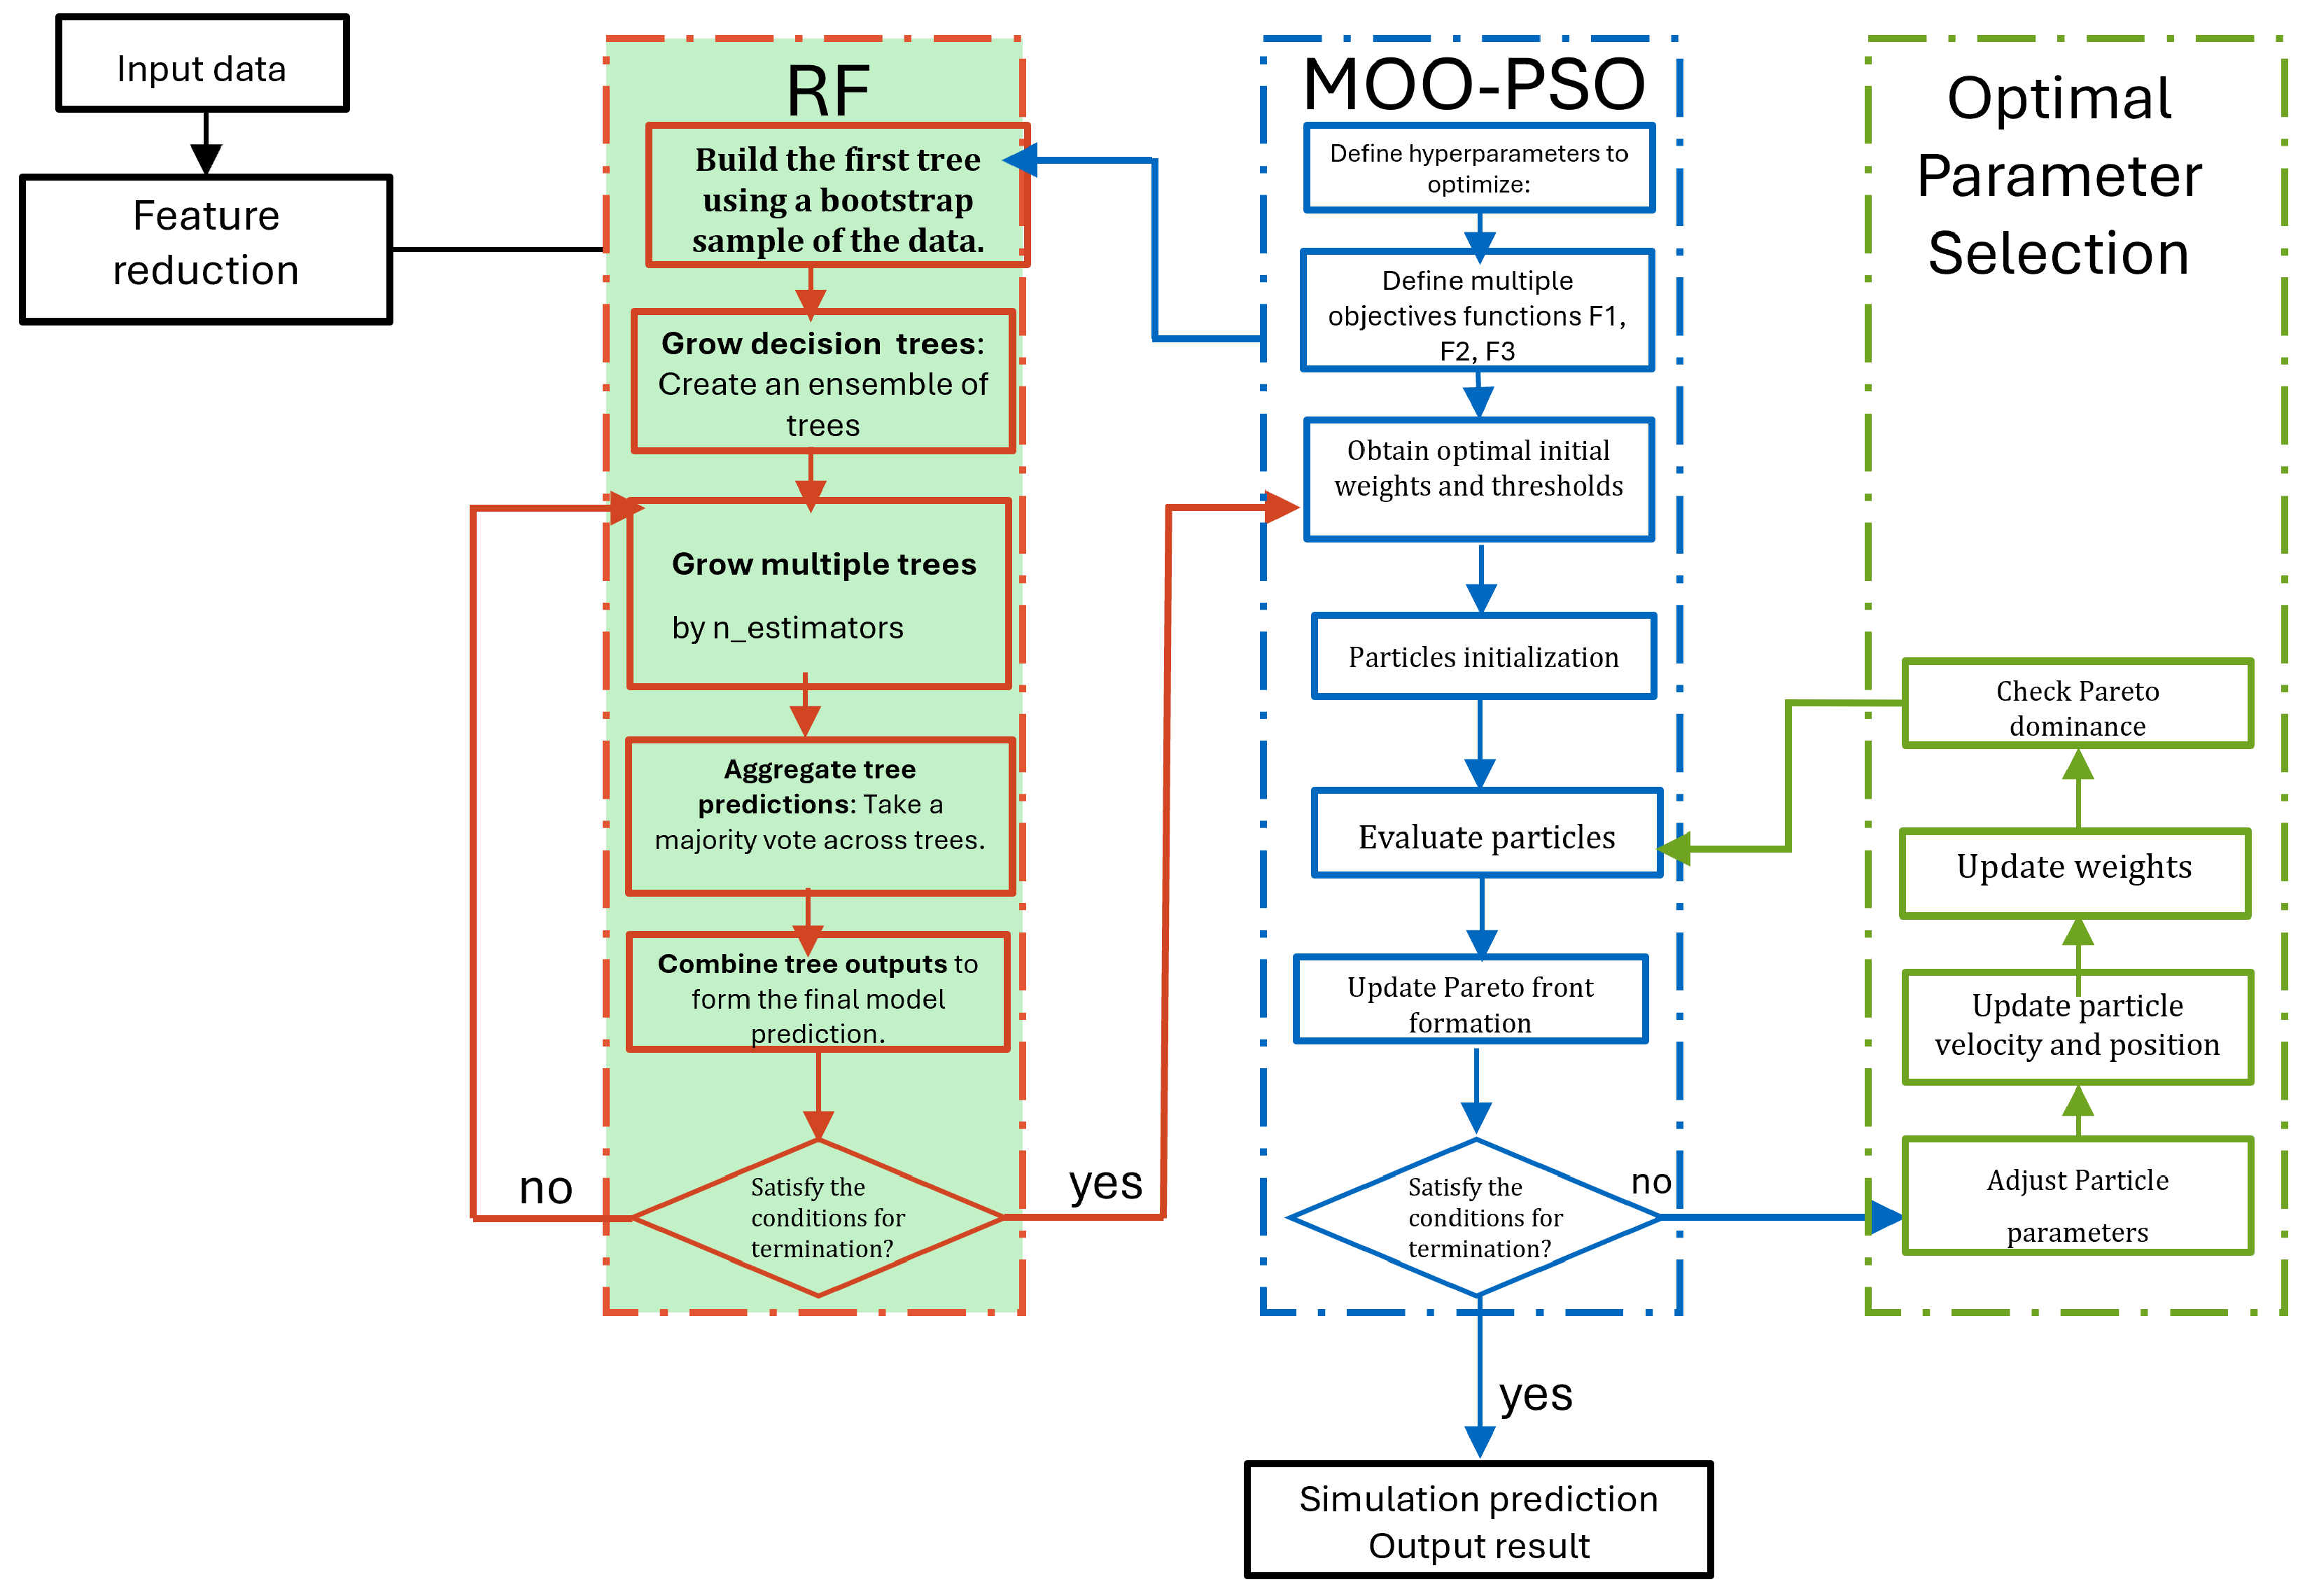
In the random forest classification algorithm, as shown in Figure 4, there are several decision trees. Models created by decision trees are similar to those made by real trees. As a result, the algorithm first divides the IoT dataset into smaller subsets, then simultaneously adds branches to these subsets. The completed tree has two or more decision nodes and leaf nodes (target values). Decision trees are represented as h _ 1 ( x ) , h _ 2 ( x ) , , etc. XGBoost evaluates splits using gradient-based gain, whereas random forests use impurity reduction. For a split at node (i) that results in left and right child nodes, the split gain is expressed as follows:
Gain RF = Impurity ( I ) | I L | | I | · Impurity ( I L ) + | I R | | I | · Impurity ( I R )
where Impurity (·) is a measure such as variance for a set of I instances before the split with left and right child instances ( I L and I R ). In classification tasks, Random Forest employs majority voting to combine predictions from multiple decision trees. Various trees ( f k ( x i ) ) are capable of returning either class labels or probabilistic distributions for all classes (C).
Consider that the “average predicted class probability” over all trees is the final prediction ( y ^ i ) for input x i :
y ^ i = 1 K k = 1 K f k ( x i ) , y ^ i R C
The multi-objective function is defined as follows:
Obj RF , class = A ( y ^ , y ) + α K · E [ C ( f k ) ]
where the multi-class cross-entropy loss is L ( y ^ i , y i ) .
L ( y ^ i , y i ) = c = 1 C 1 ( y i = c ) log y ^ i , c
Ω ( f k ) is a regularization term based on tree complexity:
Ω ( f k ) = γ N k + λ · depth ( f k )
where
  • is the averaged probability;
  • A is the classification accuracy;
  • α is the complexity penalty per tree.
Training data is created using vectors X and Y.
m g ( X , Y ) = a v ¯ k I ( h k ( X ) = Y ) max j Y a v ¯ k I ( h k ( X ) = j )
where I(·) is the indicator function with the following generalization error:
P E = P ( X , Y ) m g ( X , Y ) < 0
Due to the large numbers and tree structure, the number of classifiers in random forests is increased by approximately h_k ( x ) = h ( X , θ k ) for all tree sequences. P E converges to a probability, which is defined as follows:
P ( X , Y ) = P θ h ( X ; θ ) = Y max j Y P θ h ( X ; θ ) = j
Using a subset of randomly chosen data, the decision tree algorithm builds a forest and aggregates all the different classes of objects.
The hyperparameters are tuned based on a fitness function that balances model accuracy, complexity, and loss as follows: F1—accuracy; F2—log loss; F3—complexity (model size), represented by the number of trees ( n_estimators ). This provides a trade-off between computational complexity and model performance. Table 6 summarizes the selected parameters.

3.4. Performance Metrics

To assess the performance of an intrusion detection system (IDS) designed for Internet of Things (IoT) sensor networks, several key criteria must be evaluated. IDS detection performance can be significantly enhanced by selecting features closely related to intrusion patterns. Thus, the system is evaluated and enhanced using the metrics listed in Table 7.
Where:
  • T P = true positives (correctly identified attacks);
  • T N = true negatives (correctly identified normal traffic);
  • F P = false positives (normal traffic incorrectly identified as attacks);
  • F N = false negatives (attacks incorrectly identified as normal traffic);
  • Observed agreement ( P o ): Proportion of times the IDS agrees with the actual classifications.
  • Expected agreement ( P e ): Proportion of times the IDS would be expected to agree with the actual classifications by chance.

4. Results and Analysis

To fully evaluate the classification performance of both the MOO-PSO-RF and MOO-PSO-XGBoost models, a set of quantitative assessment measures was formulated. These include the F1 score, recall, accuracy, precision, and the Kappa coefficient, which provides information beyond random variability about the consistency. Through cross-validation, the models were tested on two benchmark datasets to ensure robustness, dependability, and generalization. This section presents and interprets the findings, with a particular focus on the impact of feature selection and classifier tuning on detection performance.

4.1. Performance Comparison Across Models and Datasets

To assess the model’s flexibility in response to various network conditions and attack patterns, a dynamic scoring mechanism is employed that adapts according to the input feature distribution. By using GA, different feature subsets were generated based on the unique distribution and characteristics of each dataset, with 16 features for CICIoT2023 and 20 features for NSL-KDD, classified using MOO-PSO-XGBoost. Additionally, MOO-PSO-RF trained 12 and 15 features for CICIoT2023 and NSL-KDD, respectively.
As shown in Table 8, the optimized XGBoost model achieved a Cohen’s Kappa of 99.85% and 99.91% accuracy on a smaller dataset. The Optimized RF model, on the other hand, achieved a significantly higher level of accuracy on low-dimensional data, with a score of 97.94%. As a result of incorporating the feature reduction mechanism (Table 9), on the NSL-KDD dataset, RF performance gains of 3% (accuracy), 3.09% (precision), 3.08% (recall), and 3.89% (F1 score) and a significant increase in Kappa were achieved. The GA-selected feature subsets resulted in significantly shorter training times but at the expense of substantially lower accuracy. For instance, MOO-PSO-XGBoost’s accuracy decreased from 99.28% to 98.38% in high-dimensional data and from 99.91% to 98.46% in low-dimensional data. This behavior is technically justified by the nature of GA-based feature selection, which utilizes stochastic search to identify feature subsets that optimize a fitness function, typically accuracy or composite scores. Nevertheless, a GA may lead to locally optimal feature sets, leaving out key relevant traits that are essential for capturing complex feature interactions. However, the decreased input dimensionality results in lower tree-building costs, resulting in a faster training process (as explored in Section 4.3) and reduced model complexity. Real-time deployability and computational efficiency are frequently more critical than slight accuracy gains in Internet of Things applications.
To provide a thorough comparative analysis of the classifiers, we analyzed precision, recall, and F1 score using a heatmap representation. In Figure 5a–d, the columns correspond to the assessment metrics from both models, while the rows represent the attack types (DoS, Normal, Probe, R2L, and U2R). Both models demonstrated their ability to generalize successfully under multi-objective optimization by achieving perfect scores (1.00) for most classes, particularly for U2r and R2l. Compared to MOO-PSO-XGBoost, the Probe class exhibits significant improvements in MOO-PSO-RF.
In each attack class in the CICIOT2023 dataset, MOO-PSO-XGBoost consistently outperformed RF in terms of accuracy, recall, and F1 score, as shown in (Figure 5c,d). It is more noticeable in complicated and minority classes, where MOO-PSO-XGBoost maintained higher F1 scores. As a result, label imbalance and interclass relationships are effectively handled. On the smaller dataset (Figure 5a,b), MOO-PSO-RF performed marginally better than MOO-PSO-XGBoost across most metrics after reduction due to its use of ensemble bagging, which is more robust to small-sample variance and has a lower dimensionality in low-data conditions. However, MOO-PSO-XGBoost demonstrated its built-in regularization and resistance to overfitting both before and after feature selection, even with a smaller feature set. The performance gap between the two classifiers declined considerably with a larger dataset.
Following GA-based reduction, the two classifiers performed about equally on the larger dataset (CICIoT2023). This convergence can be explained by the fact that both models are capable of learning discriminative patterns from the optimal feature subset when sufficient data is available. Additionally, the GA was successful at eliminating noisy and redundant features, improving model convergence, and shortening training times, particularly in situations involving high-dimensional data.
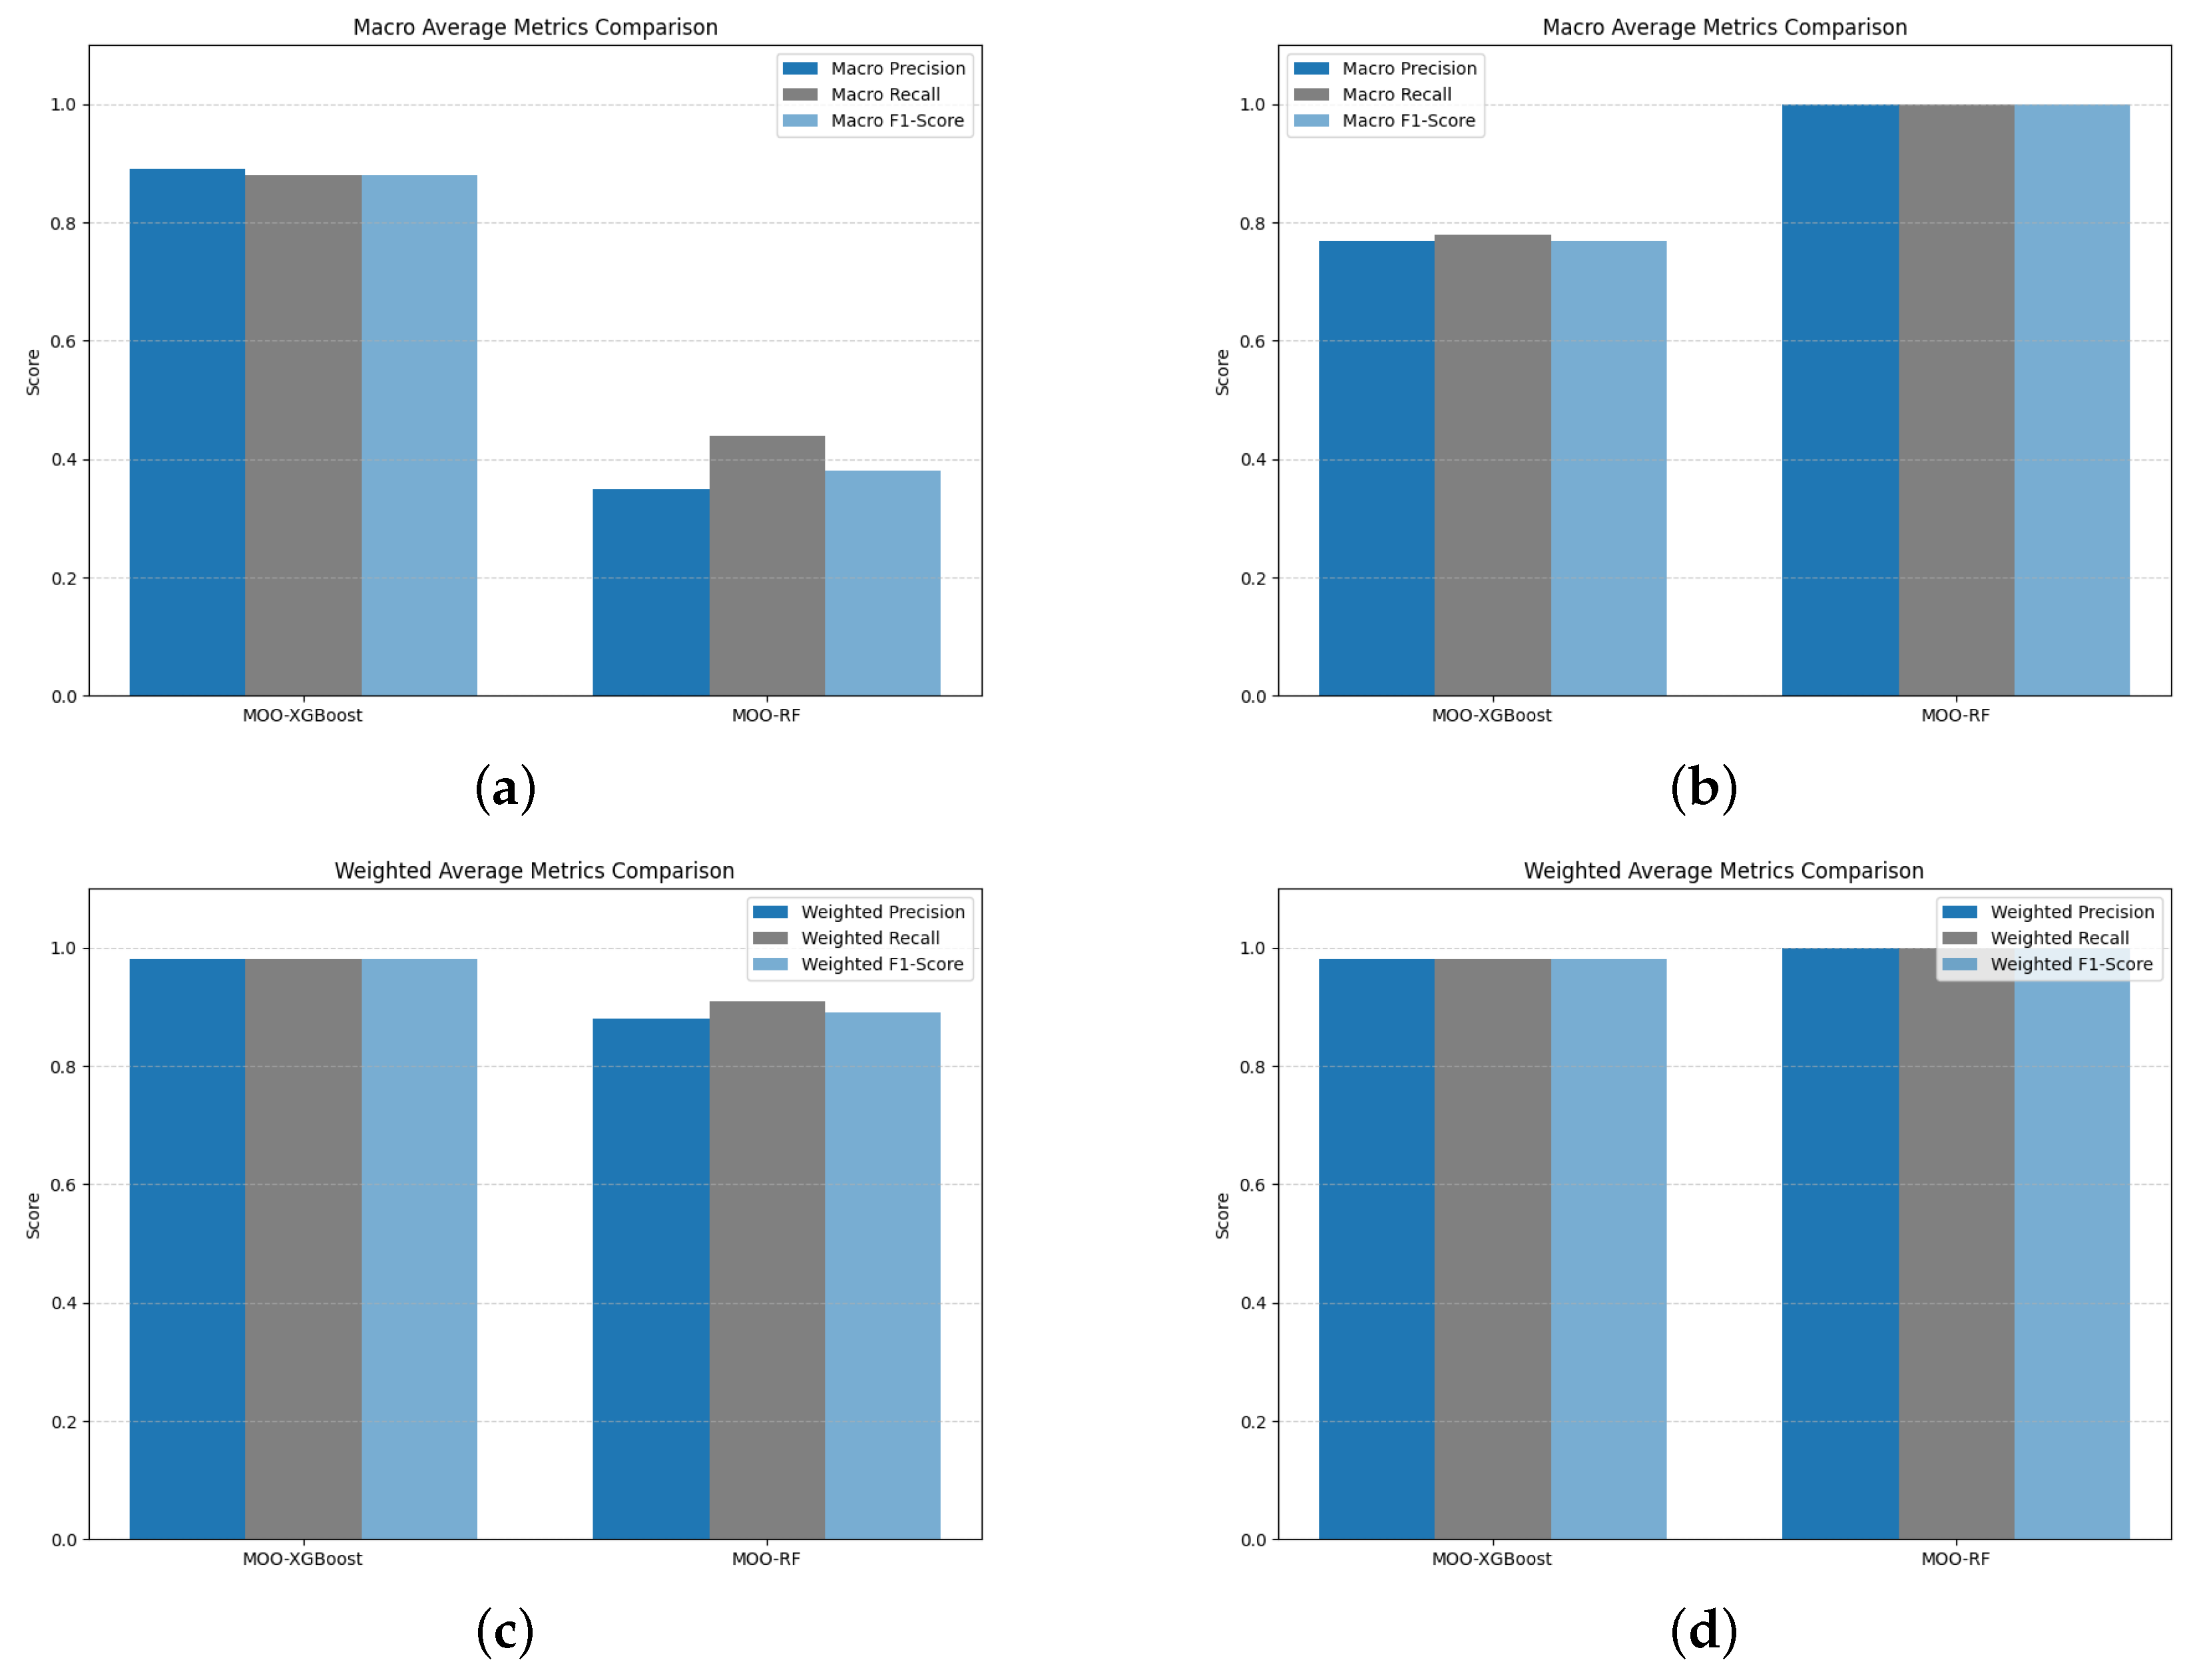
Figure 6a,b compare the macro-averaged precision, recall, and F1 score of the MOO-PSO-XGBoost and MOO-PSO-RF models. Regardless of the frequency of classes, macro averages provide a balanced perspective across classes, emphasizing the overall balance of performance. A comparison of weighted accuracy, recall, and F1 scores between MOO-PSO-RF and MOO-PSO-XGBoost is shown in Figure 6c,d. By taking into account the relative size of each class, weighted averages reflect the overall performance on unbalanced datasets. According to the macro average metrics plot, MOO-PSO-XGBoost performs noticeably better than MOO-PSO-RF in terms of macro precision, recall, and F1 score on a larger dataset. The macro performance of MOO-PSO-RF is much worse, especially in terms of F1 score (0.38) and accuracy (0.35), indicating a less balanced performance across all classes. MOO-PSO-XGBoost maintains high precision, recall, and F1 scores (all around 0.98). The MOO-PSO-RF algorithm performs well on the majority classes but struggles with minority classes, as evidenced by the fact that its weighted scores (0.88 precision, 0.91 recall, and 0.89 F1 score) are significantly higher than its macro scores.
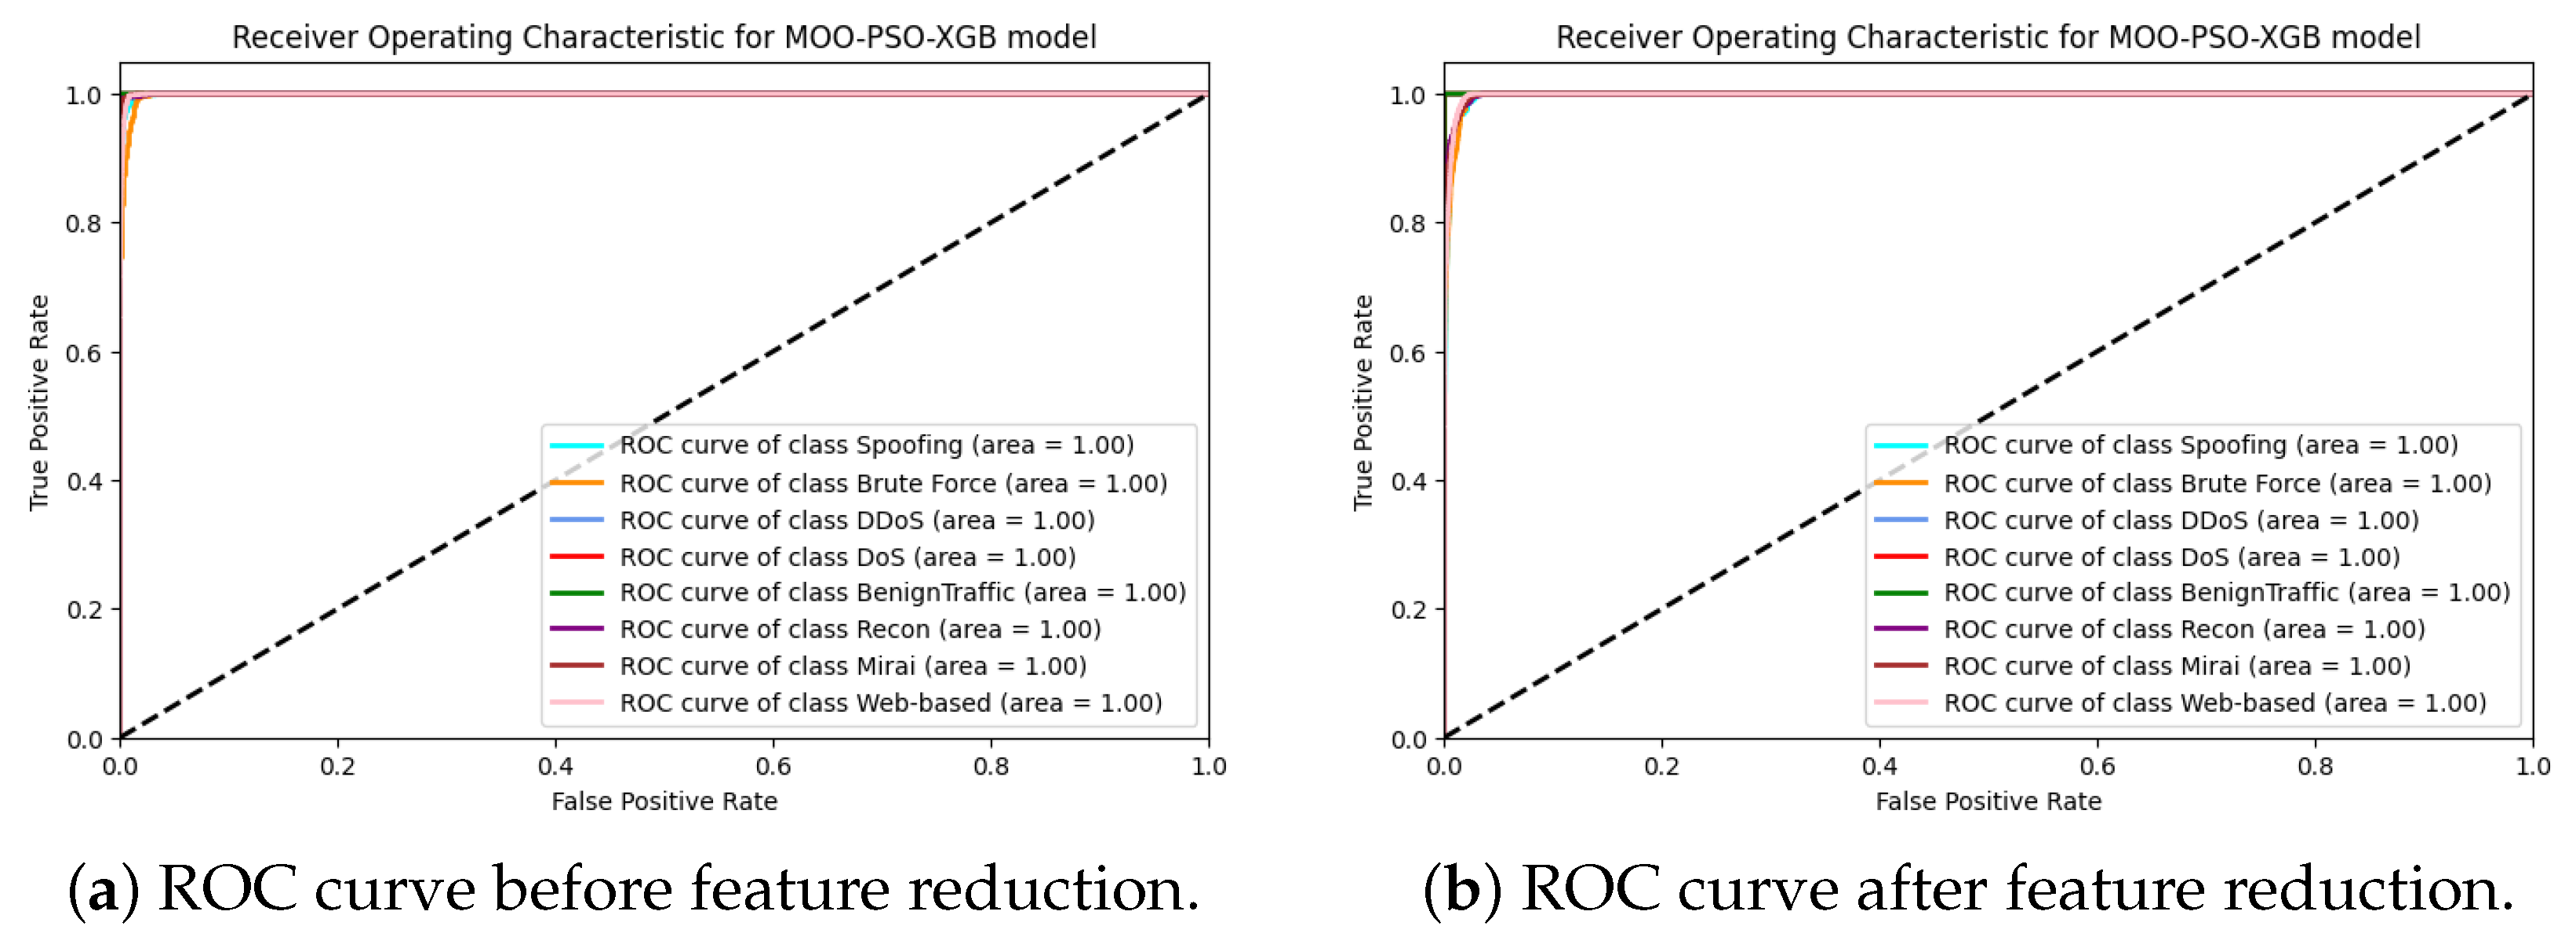
During the feature reduction process, several duplicate and irrelevant features were identified, resulting in a reduction in the distinction between the ROC curves for MOO-PSO-XGBoost, as illustrated in Figure 7 and Figure 8, particularly for a smaller dataset (i.e., the NSL-KDD dataset). After feature reduction, both large and small datasets showed improved classification performance, as indicated by the ROC curves. The large dataset (i.e., the CICIoT2023 dataset) demonstrated excellent class separation, with high sensitivity and specificity, as indicated by the substantial increase in the ROC curve towards the top-left corner.
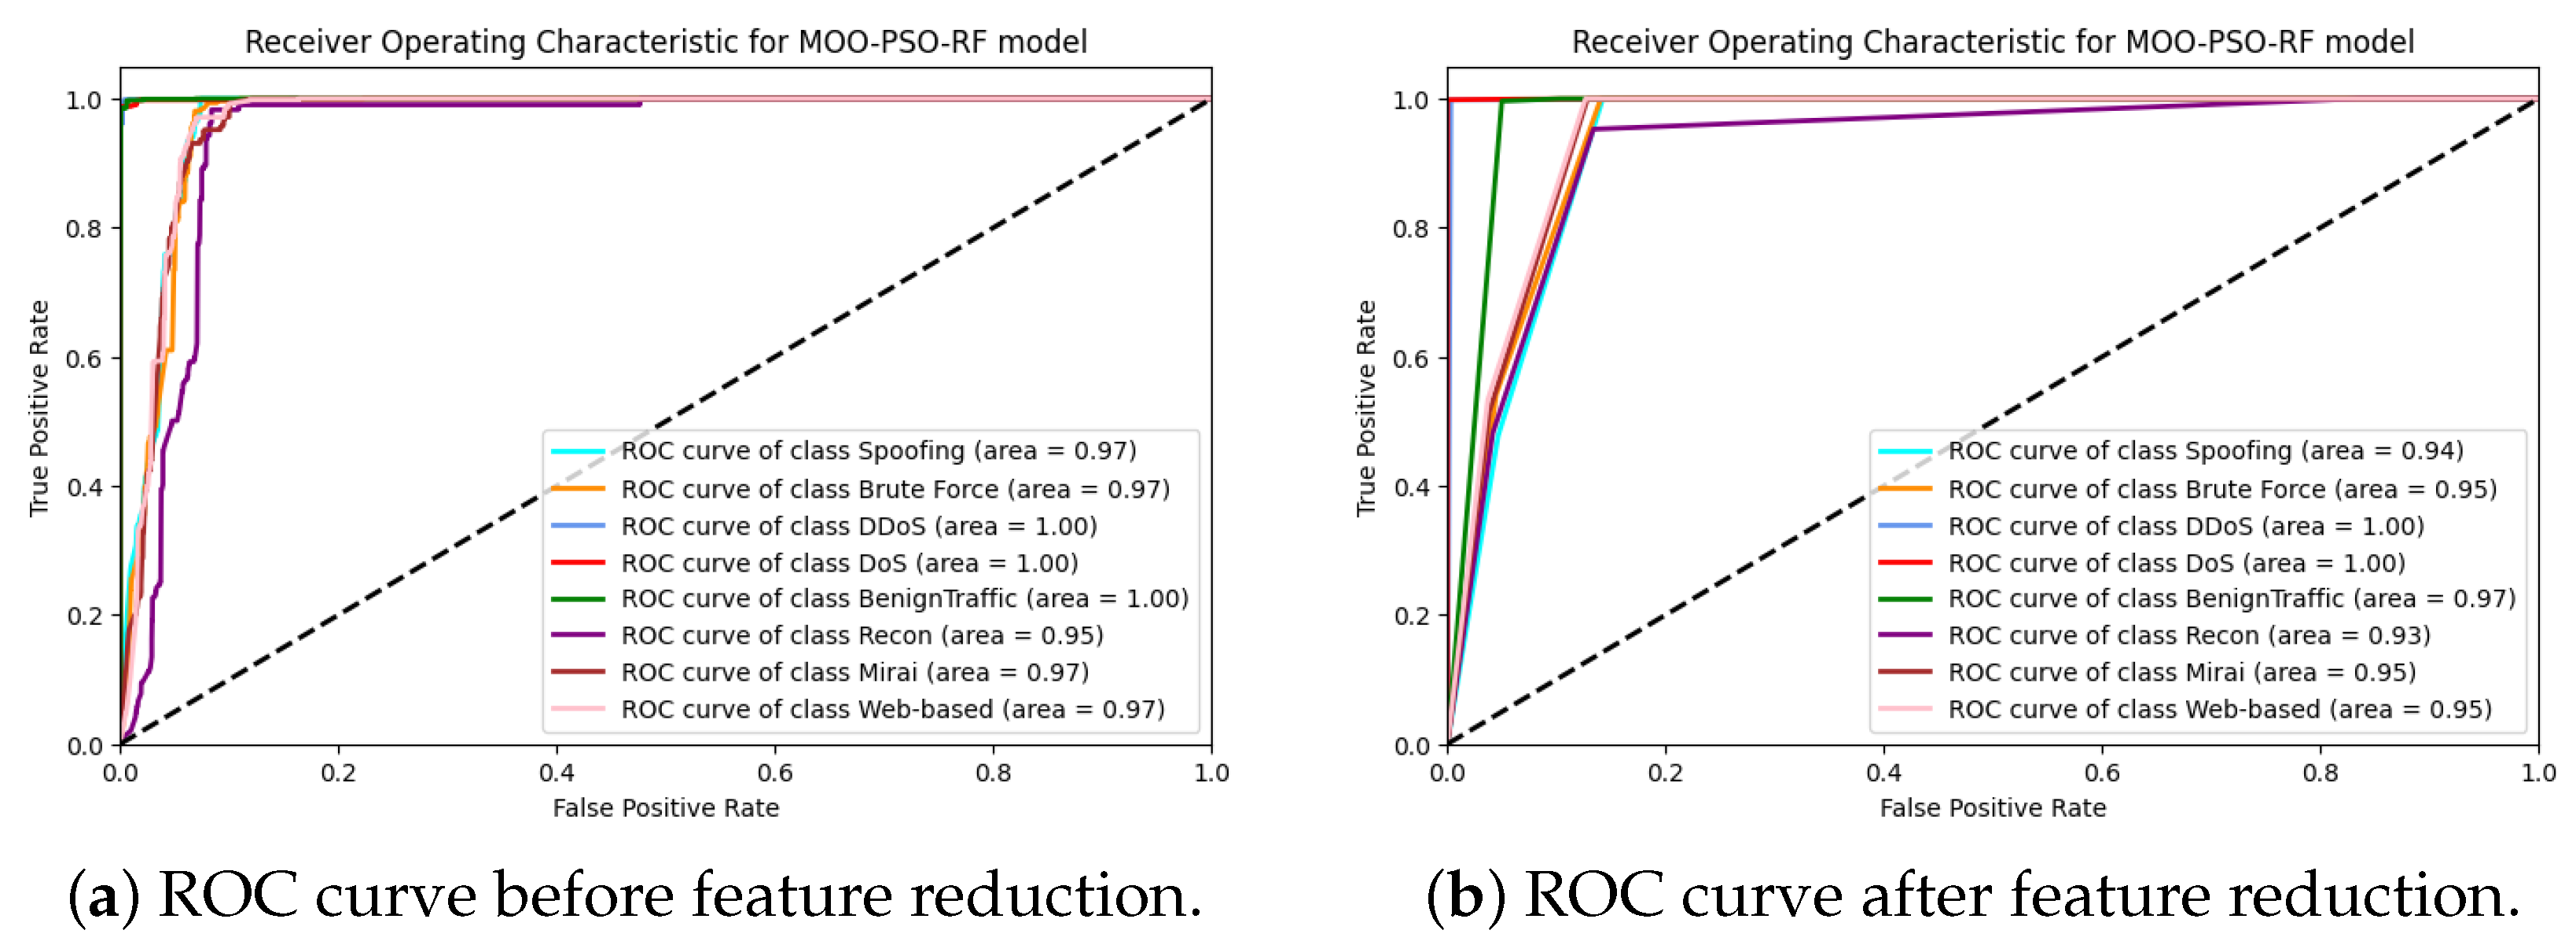
Before feature reduction, MOO-PSO-RF generated slightly more cluttered ROC curves with lower AUCs and greater overlap between class predictions, as illustrated in Figure 9 and Figure 10. A particularly significant effect was observed in small datasets, where an increase in the number of features led to an increase in variance. The ROC values were also improved following the application of feature reduction. In large datasets, the ROC curves become sharper and steeper, indicating improved discriminatory power and fewer classification errors.
To validate the statistical superiority of the proposed MOOIDS-IoT framework, comprising MOO-PSO-XGBoost and MOO-PSO-RF models, over baseline models, we conducted paired statistical tests on the performance metrics obtained from the CICIoT2023 and NSL-KDD datasets. The baseline models used for comparison are standard XGBoost and Random Forest (RF) with default hyperparameters, as commonly employed in prior IoT intrusion detection studies. The analysis focuses on the accuracy metric, derived from 10-fold cross-validation experiments, to ensure robustness and consistency. We employed both paired t-tests and Wilcoxon signed-rank tests to assess the statistical significance of performance differences between MOOIDS-IoT models and their respective baselines. The Shapiro–Wilk test was used to evaluate the normality of the performance data, revealing a non-normal distribution (p < 0.05). Consequently, the Wilcoxon signed-rank test was included as a non-parametric alternative to complement the paired t-test, ensuring reliable results, regardless of data distribution. The tests were conducted on the accuracy scores obtained from 10-fold cross-validation runs for both datasets. The results of the statistical tests are summarized in Table 10 below. For MOO-PSO-XGBoost compared to the baseline XGBoost, a t-statistic of 13.7472 and a p-value of 0.0000 indicate a statistically significant improvement at the 0.05 significance level. In the Wilcoxon signed-rank test, a statistic of 0.0000 and a p-value of 0.0020 confirm the considerable superiority of MOO-PSO-XGBoost, even under non-parametric assumptions.
For MOO-PSO-RF compared to the baseline Random Forest model, a t-statistic of 14.5000 and a p-value of 0.0000 demonstrate a statistically significant improvement at the 0.05 significance level. Additionally, a statistic of 0.0000 and a p-value of 0.0015 further validate the superior performance of MOO-PSO-RF, particularly after feature reduction, where it outperformed MOO-PSO-XGBoost on the NSL-KDD dataset due to its stability in low-dimensional settings.
The statistical tests confirm that both MOO-PSO-XGBoost and MOO-PSO-RF significantly outperform their respective baseline models (XGBoost and Random Forest) across both datasets, with p-values well below the 0.05 threshold. Significantly, MOO-PSO-RF demonstrates superior performance on the NSL-KDD dataset after feature reduction, leveraging the effectiveness of MOO-PSO optimization and GA-based feature selection to achieve higher accuracy and stability in low-dimensional settings. These results underscore the robustness of the MOOIDS-IoT framework for lightweight and real-time IoT intrusion detection, making it well-suited for resource-constrained environments.

4.2. Optimization Strategy and Tuned Hyperparameters

In this section, the performance of MOO-PSO is evaluated using the following standards:
  • Convergence: The degree of similarity between the obtained solutions and the Pareto Front (PF).
  • Loss: The value of the optimization objective that represents the deviation from the intended results.
For large data, the MOO-PSO-XGBoost model convergence metric steadily declined over time, as illustrated in Figure 11, tarting at 85% with 0.0245 loss and reaching a maximum of 98% convergence with 0.023 loss, indicating steady progress toward the optimal Pareto front. Despite dealing with massive amounts of data, complexity was kept under control with MOO-PSO-XGBoost’s regularized learning approach, which penalizes unnecessary exponential expansion. As shown in Figure 12, despite the smaller feature space, the model was able to be trained more effectively while maintaining a rich representational capacity, achieving a loss value of less than 0.003 after four iterations. On the other hand, the convergence plot displays a more dynamic trend, from 45 at iteration 1 to 98 at iteration 3, with the convergence metric gradually declining afterwards; the optimization process either introduced or explored new solution candidates that temporarily increased convergence, even if they were advantageous for other purposes. This is a typical and often consciously chosen strategy in multi-objective particle swarm optimization, where striking a balance between convergence and diversity is essential.
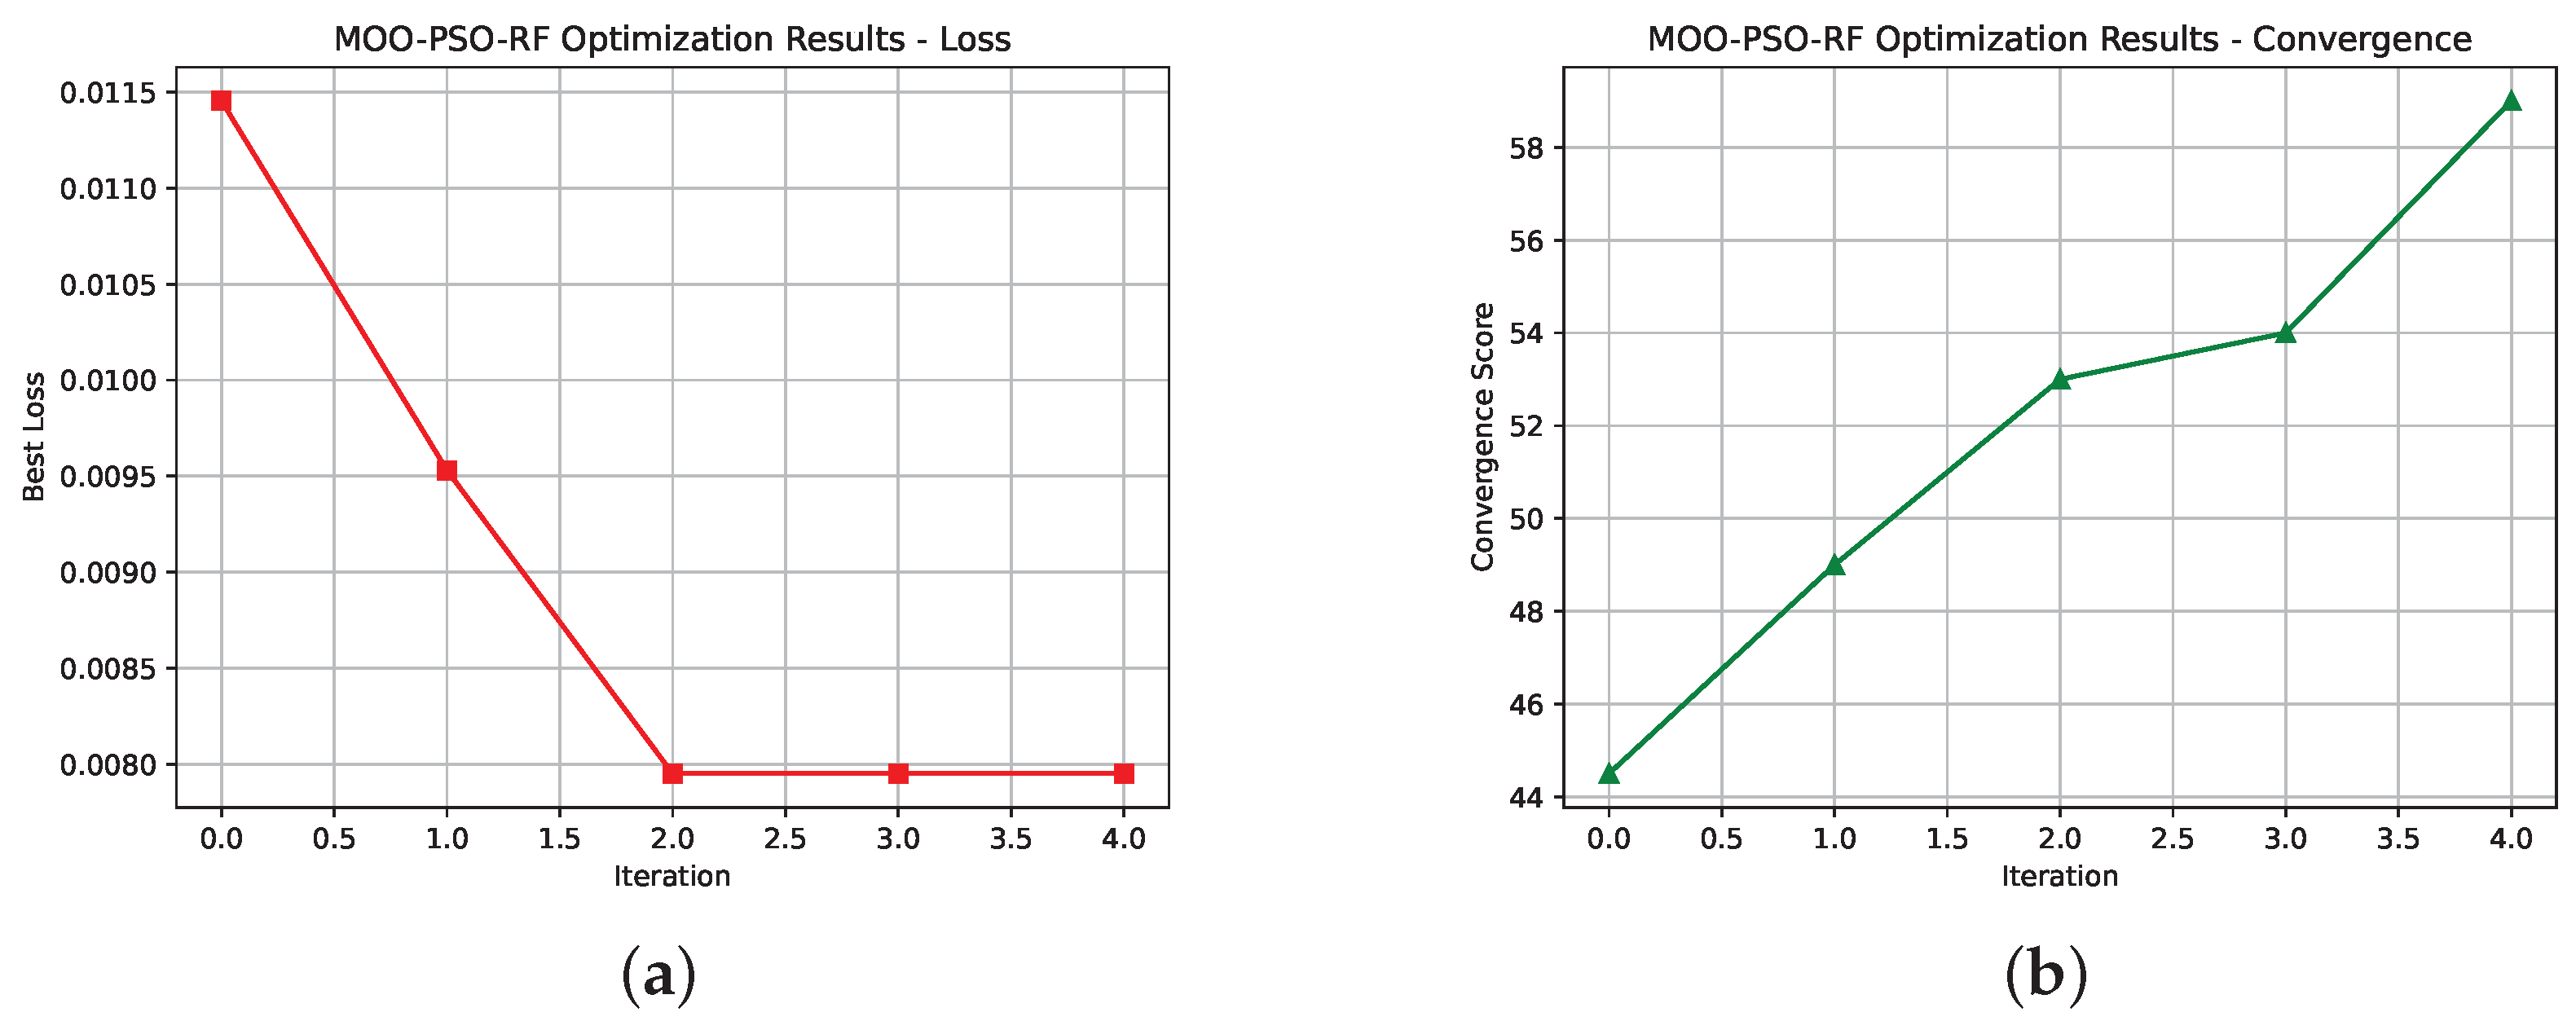
MOO-PSO-RF models (Figure 13 and Figure 14) exhibit unique optimization characteristics on both small and large datasets. By consistently improving the convergence metric, the optimizer successfully refined the forest structure toward well-balanced solutions, achieving a fixed loss of 0.018 and convergence of over 72% across four iterations. There are slight variations in the final repetitions, however, which indicate planned exploration to ensure diversity within the ensemble. When compared with large datasets, the benefits of feature reduction were significantly greater. With a smaller feature space, there was less chance of overfitting, allowing the optimizer to produce simpler forests while maintaining excellent accuracy.
Overall, these findings support the incorporation of GA-based feature reduction into multilabel classification pipelines, demonstrating competitive and scalable performance across various classifiers and dataset sizes, as well as improved computational efficiency.
Particle swarm optimization (PSO) techniques exhibit fundamental differences when applied to single-objective versus multi-objective situations. Figure 15 illustrates the difference between single-objective PSO (SOPSO) and multi-objective PSO (MOO-PSO) search dynamics. As illustrated in Figure 15a, all particles in single-objective PSO (SOPSO) collectively converge toward a single optimal solution (such as loss), a tightly clustered set of positions in the decision space, and a single point in the objective space is obtained. As convergence occurs, the behavior is primarily motivated by the need to efficiently exploit the optimal solution, with little attention paid to preserving diversity. During the early stages of the process, particles are dispersed and investigated for their possibilities. The particles begin to cluster under the influence of the global best. In the final stage, when the particles have nearly converged, the optimal solution is exploited. Figure 15b illustrates the convergence progress in the multi-objective PSO model, which represents a Pareto front in objective space, showing trade-offs between loss (f1), accuracy (f2), and complexity (f3) through a color gradient. Due to the multiplicity of options available, MOPSO supports the decision-making process for various design goals by preserving diversity to accommodate a range of trade-offs. MOPSO offers a variety of solutions, each of which balances objectives in a manner different from SOPSO, where all particles converge on a single optimum.

4.3. Model Scalability Analysis

This section examines the computational complexity and performance characteristics of the optimized RF and MOO-PSO-XGBoost models after implementing the suggested multi-objective and feature reduction approach. By focusing on training time, model simplicity, and the effects of lower hyperparameter configurations, the advantages of the best-tuned models are demonstrated.
To assess the effectiveness of the suggested feature reduction technique, Table 11 provides pre- and post-reduction parameter measurements for each classifier (RF and MOO-PSO-XGBoost). A significant finding is that essential hyperparameters consistently decrease after feature selection. Both MOO-PSO-RF and MOO-PSO-XGBoost showed a downward trend in parameters such as max_depth , n_estimators , g a m m a , and min_samples_leaf . The reduction indicates a higher signal-to-noise ratio for the chosen features, suggesting that shallower trees, fewer estimators, and less regularization complexity were required to achieve similar or better performance. Due to the reduced input space’s higher discriminative potential, MOO-PSO-XGBoost, for example, requires less extensive pruning and regularization, as evidenced by the lower g a m m a and max_depth values. Furthermore, MOO-PSO-RF’s lower min_samples_leaf and n_estimators indicate better data separation, resulting in fewer splits and trees that accurately model class boundaries.
Furthermore, both models demonstrated reduced training and optimization times, as shown in Table 12, resulting in a much smaller computational footprint. In contexts where resource limits are crucial, such as edge computing and the Internet of Things, this is particularly advantageous. The PSO-MOO-XGBoost model takes 28.2 s to train after feature reduction and 1 h and 47 min to optimize on the CICIoT2023 dataset. MOO-PSO-RF achieved a training time of 55 s and an optimization time of 2 h and 33 min on the same dataset. When it comes to the computational overhead or resources required for intrusion detection systems, longer training times and larger models can result in a sluggish system response, especially in real-time monitoring environments. Although the model training procedure is complex and time-consuming, MOO-PSO-XGBoost’s reduced training time suggests that it can respond rapidly to real-world situations and is suitable for situations requiring prompt decision-making.
Generally, the best parameter configurations resulting from feature reduction confirm the method’s strength and generalizability, thereby demonstrating its applicability in high-dimensional and security-sensitive environments.
On the NSL-KDD dataset, MOO-PSO-RF demonstrated comparatively long optimization and training times of 3 h, 59 min, and 37 s, and 25 s, respectively. Therefore, the model may be effective for training, but it may require longer analysis times for real-time detection, which could limit its use in high-speed network environments. The MOO-PSO-RF and MOO-PSO-XGBoost datasets have relatively moderate sizes (116 estimators and a maximum depth of 4.8), suggesting that these models may be appropriate in contexts with limited resources. The advent of genetic algorithms (GAs) for feature selection and multi-objective optimization approaches for the optimization of Random Forest (RF) hyperparameters has resulted in additional processing overhead. The overhead is primarily evident in longer training times (due to repeated training of RF models under different setups) and longer optimization times (due to recurrent search operations spanning generations of particles).

4.4. Comparison

To evaluate the performance of our proposed method, we compare it to state-of-the-art (SOTA) studies that have evaluated different machine learning methods using the CICIoT2023 dataset, as illustrated in Table 13, and the NSL-KDD dataset, as illustrated in Table 14. The CICIoT2023 dataset features a diverse range of IoT devices and a comprehensive network design, which collectively contribute to the current state of IoT security research. Although the CICIoT2023 dataset is extensive and rich, it has been utilized in only a limited number of studies in the literature, particularly in the context of swarm-based intelligence. Some research has examined full-feature models without dimensionality reduction, while others employed feature reduction strategies to improve model efficiency and performance [6,10,33]. By comparing our suggested strategy to these various approaches, we seek to demonstrate its accuracy and computational efficiency.
In comparison with these neural models, the proposed optimized conventional MOO-PSO-XGBoost is significantly more accurate and simpler. It is usually more effective with tabular data and can be trained with a high level of accuracy in a shorter time.
Using the low-dimensional NSL-KDD dataset as a benchmark, we further evaluated the efficacy of the proposed framework model on this dataset. Based on the results of our evaluation, we compared our model to three cutting-edge approaches. Despite the incredible complexity of the attention-based model, MOO-PSO-XGBoost ranks second, after the attention-based GNN, in terms of key parameters including F1 score, accuracy, and precision. Compared to CNN, VLSTM, and MIX-CNN-LSTM, this model achieves the lowest false-alarm rate, indicating a slight compromise in the recognition of all positive cases. Based on the NSL-KDD dataset, these results suggest that MOO-PSO-RF achieves a high level of success in reducing false positives and providing balanced, trustworthy classification results within 25 s.

5. Conclusions, Limitations, and Future Work

The rapid expansion of Internet of Things (IoT) applications in critical areas, including healthcare, smart homes, transportation, and industrial automation, has made ensuring their security and reliability a top priority. Cyber threats targeting geographically dispersed and resource-constrained IoT devices have recently attracted a great deal of research attention, especially since they are becoming more frequent and sophisticated. Several issues are associated with this field, including the high dimensionality of sensor and network data; unequal class distributions; and the need for real-time, interpretable, and lightweight detection models that can operate effectively in dynamic, data-rich environments. To overcome these limitations, the present study proposes an integrated method for optimizing Random Forest and XGBoost classifiers using multi-objective hyperparameter optimization. By methodically examining the hyperparameter space, an innovative MOO-PSO algorithm enabled us to identify Pareto-optimal configurations that balance multiple conflicting objectives, including convergence rate, model complexity, and predictive accuracy. Multi-objective tuning significantly enhances generalization while maintaining computational efficiency for both MOO-PSO-XGBoost and MOO-PSO-RF.
The experimental study demonstrated the strengths of both models under different data dimensionalities. MOO-PSO-XGBoost has shown exceptional performance in high-dimensional environments due to its gradient-based optimization and regularization capabilities. Alternatively, MOO-PSO-RF’s simplicity, robustness, and low variance behavior make it more effective in low-dimensional settings. Considering that dimensionality may have a significant impact on model behavior and optimization dynamics, our findings underscore the importance of evaluating models both before and after feature selection. Furthermore, we determined the optimal hyperparameter configuration for each model, enabling reproducible deployment under different data conditions. To increase the transparency of the model, feature contributions were analyzed using SHAP analysis, which provides insight into the model’s behavior and reasoning.
One of the key limitations of this study is that the PSO and GA-based optimization procedures are inherently stochastic, requiring numerous iterations and substantial computing power to achieve a high-quality Pareto front, particularly in noisy or high-dimensional search spaces. To overcome the inherent stochasticity and premature convergence of classical PSO, future research will incorporate probabilistic position updates based on wave function models rather than deterministic velocity-based motions. By maintaining diversity and exploring the search space more comprehensively, particles enhance convergence stability and reduce the likelihood of becoming stuck in local optima. Additionally, the method assumes that objective weights or assessment criteria are stable, which may not account for changing system priorities or real-time application limitations. The suggested methodology provides practitioners looking to implement optimized ensemble models in practical settings with a strong framework. In future studies, this concept may be applied to high-dimensional and streaming data domains, incorporating interpretability and fairness as optimization objectives and incorporating adaptive or dynamic optimization algorithms.

Author Contributions

Conceptualization, H.A.A. and W.N.I.; methodology, H.A.A. and W.N.I.; software, W.N.I.; validation, H.A.A. and W.N.I.; formal analysis, H.A.A. and W.N.I.; investigation, H.A.A. and W.N.I.; resources, H.A.A.; data curation, H.A.A. and W.N.I.; writing—original draft preparation, H.A.A. and W.N.I.; writing—review and editing, H.A.A. and W.N.I.; visualization, W.N.I.; supervision, H.A.A. and W.N.I.; project administration, H.A.A. and W.N.I. All authors have read and agreed to the published version of the manuscript.

Funding

The authors are grateful to King Saud University, Riyadh, Saudi Arabia, for funding this work through the Ongoing Research Funding Program (ORF-2025-1206).

Data Availability Statement

The data presented in this study are available in NSL-KDD & CICIoT2023 at: https://www.unb.ca/cic/datasets/nsl.html; https://www.kaggle.com/datasets/hassan06/nslkdd (accessed on 11 June 2025).

Conflicts of Interest

The authors declare no conflicts of interest.

References

  1. IoT Analytics. State of IoT Spring 2025. Market Report. 2025. Available online: https://iot-analytics.com/state-of-iot-spring-2025 (accessed on 11 June 2025).
  2. Ismail, S.; Dandan, S.; Qushou, A. Intrusion Detection in IoT and IIoT: Comparing Lightweight Machine Learning Techniques Using TON_IoT, WUSTL-IIOT-2021, and EdgeIIoTset Datasets. IEEE Access 2025, 13, 73468–73485. [Google Scholar] [CrossRef]
  3. Aslam, M.M.; Kalinaki, K.; Tufail, A.; Naim, A.G.H.; Khan, M.Z.; Ali, S. Social Engineering Attacks in Industrial Internet of Things and Smart Industry: Detection and Prevention. In Emerging Threats and Countermeasures in Cybersecurity; Scrivener Publishing LLC: Salem, MA, USA, 2025; pp. 389–412. [Google Scholar]
  4. Mathina, P.; Valarmathi, K. Advancing IoT security: A novel intrusion detection system for evolving threats in industry 4.0 using optimized convolutional sparse Ficks law graph point trans-Net. Comput. Secur. 2025, 148, 104169. [Google Scholar] [CrossRef]
  5. Ismail, W.N. A Novel Metaheuristic-Based Methodology for Attack Detection in Wireless Communication Networks. Mathematics 2025, 13, 1736. [Google Scholar] [CrossRef]
  6. Abbas, S.; Bouazzi, I.; Ojo, S.; Al Hejaili, A.; Sampedro, G.A.; Almadhor, A.; Gregus, M. Evaluating deep learning variants for cyber-attacks detection and multi-class classification in IoT networks. PeerJ Comput. Sci. 2024, 10, e1793. [Google Scholar] [CrossRef]
  7. Chen, F.; Liu, Y.; Yang, J.; Liu, J.; Zhang, X. A multi-objective particle swarm optimization with a competitive hybrid learning strategy. Complex Intell. Syst. 2024, 10, 5625–5651. [Google Scholar] [CrossRef]
  8. Ghanbarzadeh, R.; Hosseinalipour, A.; Ghaffari, A. A novel network intrusion detection method based on metaheuristic optimisation algorithms. J. Ambient. Intell. Humaniz. Comput. 2023, 14, 7575–7592. [Google Scholar] [CrossRef]
  9. Liu, Z.; Wang, Y.; Feng, F.; Liu, Y.; Li, Z.; Shan, Y. A DDoS detection method based on feature engineering and machine learning in software-defined networks. Sensors 2023, 23, 6176. [Google Scholar] [CrossRef] [PubMed]
  10. Khan, M.M.; Alkhathami, M. Anomaly detection in IoT-based healthcare: Machine learning for enhanced security. Sci. Rep. 2024, 14, 5872. [Google Scholar] [CrossRef]
  11. Alhashmi, A.; Idwaib, H.; Avci, S.A.; Rahebi, J.; Ghadami, R. Distributed denial-of-service (DDoS) on the smart grids based on VGG19 deep neural network and Harris Hawks optimization algorithm. Sci. Rep. 2025, 15, 18243. [Google Scholar] [CrossRef]
  12. Priyadarshi, R. Exploring machine learning solutions for overcoming challenges in IoT-based wireless sensor network routing: A comprehensive review. Wirel. Netw. 2024, 30, 2647–2673. [Google Scholar] [CrossRef]
  13. Iqal, Z.M.; Selamat, A. A Comprehensive Analysis of Risk-Based Access Control Models for IoT: Balancing Security, Adaptability, and Resource Efficiency. In Proceedings of the 2024 IEEE International Conference on Computing (ICOCO), Kuala Lumpur, Malaysia, 12–14 December 2024; IEEE: Piscataway, NJ, USA, 2024; pp. 344–349. [Google Scholar]
  14. Benmalek, M.; Seddiki, A. Particle swarm optimization-enhanced machine learning and deep learning techniques for Internet of Things intrusion detection. Data Sci. Manag. 2025. [Google Scholar] [CrossRef]
  15. Subramani, S.; Selvi, M. Multi-objective PSO based feature selection for intrusion detection in IoT based wireless sensor networks. Optik 2023, 273, 170419. [Google Scholar] [CrossRef]
  16. Godi, R.K.; Panchal, S.M.; Agarwal, S. Cooperative Resource Allocation Using Optimized Heterogeneous Context-Aware Graph Convolutional Networks in 5G Wireless Networks. Int. J. Commun. Syst. 2025, 38, e70002. [Google Scholar] [CrossRef]
  17. Wei, W.; Chen, S.; Lin, Q.; Ji, J.; Chen, J. A multi-objective immune algorithm for intrusion feature selection. Appl. Soft Comput. 2020, 95, 106522. [Google Scholar] [CrossRef]
  18. Asgharzadeh, H.; Ghaffari, A.; Masdari, M.; Gharehchopogh, F.S. Anomaly-based intrusion detection system in the Internet of Things using a convolutional neural network and multi-objective enhanced Capuchin Search Algorithm. J. Parallel Distrib. Comput. 2023, 175, 1–21. [Google Scholar] [CrossRef]
  19. Shanbhag, A.; Vincent, S.; Gowda, S.B.B.; Kumar, O.P.; Francis, S.A.J. Leveraging Metaheuristics for Feature Selection With Machine Learning Classification for Malicious Packet Detection in Computer Networks. IEEE Access 2024, 12, 21745–21764. [Google Scholar] [CrossRef]
  20. Li, J.; Chen, H.; Shahizan, M.O.; Yusuf, L.M. Enhancing IoT security: A comparative study of feature reduction techniques for intrusion detection system. Intell. Syst. Appl. 2024, 23, 200407. [Google Scholar] [CrossRef]
  21. Shi, L.; Yang, Q.; Gao, L.; Ge, H. An ensemble system for machine learning IoT intrusion detection based on enhanced artificial hummingbird algorithm. J. Supercomput. 2025, 81, 110. [Google Scholar] [CrossRef]
  22. Dhanushkodi, K.; Venkataramani, K.; K R, N.P.; Sethuraman, R. BGHO-E2EB Model: Enhancing IoT Security with Gaussian Artificial Hummingbird Optimization and Blockchain Technology. Trans. Emerg. Telecommun. Technol. 2025, 36, e70037. [Google Scholar] [CrossRef]
  23. Amin, R.; El-Taweel, G.; Ali, A.F.; Tahoun, M. Hybrid Chaotic Zebra Optimization Algorithm and Long Short-Term Memory for Cyber Threats Detection. IEEE Access 2024, 12, 93235–93260. [Google Scholar] [CrossRef]
  24. Elsedimy, E.I.; Elhadidy, H.; Abohashish, S.M.M. A novel intrusion detection system based on a hybrid quantum support vector machine and improved Grey Wolf optimizer. Clust. Comput. 2024, 27, 9917–9935. [Google Scholar] [CrossRef]
  25. Jianping, W.; Guangqiu, Q.; Chunming, W.; Weiwei, J.; Jiahe, J. Federated learning for network attack detection using attention-based graph neural networks. Sci. Rep. 2024, 14, 19088. [Google Scholar] [CrossRef]
  26. Karpagavalli, C.; Kaliappan, M. Edge Implicit Weighting with graph transformers for robust intrusion detection in Internet of Things network. Comput. Secur. 2025, 150, 104299. [Google Scholar] [CrossRef]
  27. Kumar, K.; Khari, M. Federated active meta-learning with blockchain for zero-day attack detection in industrial IoT. Peer-to-Peer Netw. Appl. 2025, 18, 199. [Google Scholar] [CrossRef]
  28. Alsadhan, A.; Alhogail, A.; Alsalamah, H. Blockchain-Based Privacy Preservation for the Internet of Medical Things: A Literature Review. Electronics 2024, 13, 3832. [Google Scholar] [CrossRef]
  29. Alsadhan, A.; Alsalamah, H.; Alhogail, A. A Blockchain-Based Privacy-Preserving Model for IoMT Medical Systems. In Proceedings of the 2024 6th International Conference on Blockchain Computing and Applications (BCCA), Dubai, United Arab Emirates, 26–29 November 2024; pp. 16–21. [Google Scholar] [CrossRef]
  30. Salem, A.H.; Azzam, S.M.; Emam, O.E.; Abohany, A.A. Advancing cybersecurity: A comprehensive review of AI-driven detection techniques. J. Big Data 2024, 11, 105. [Google Scholar] [CrossRef]
  31. Elahi, I.; Ali, H.; Asif, M.; Iqbal, K.; Ghadi, Y.; Alabdulkreem, E. An evolutionary algorithm for multi-objective optimization of freshwater consumption in textile dyeing industry. PeerJ Comput. Sci. 2022, 8, 24. [Google Scholar] [CrossRef] [PubMed]
  32. Dai, C.; Wang, Y.; Ye, M. A new multi-objective particle swarm optimization algorithm based on decomposition. Inf. Sci. 2015, 325, 541–557. [Google Scholar] [CrossRef]
  33. Neto, E.C.P.; Dadkhah, S.; Ferreira, R.; Zohourian, A.; Lu, R.; Ghorbani, A.A. CICIoT2023: A real-time dataset and benchmark for large-scale attacks in IoT environment. Sensors 2023, 23, 5941. [Google Scholar] [CrossRef]
  34. Tavallaee, M.; Bagheri, E.; Lu, W.; Ghorbani, A.A. A Detailed Analysis of the KDD CUP 99 Data Set. NSL-KDD Dataset. Canadian Institute for Cybersecurity (CIC). 2009. Available online: https://www.unb.ca/cic/datasets/nsl.html (accessed on 11 June 2025).
  35. Siedlecki, W.; Sklansky, J. A note on genetic algorithms for large-scale feature selection. Pattern Recognit. Lett. 1989, 10, 335–347. [Google Scholar] [CrossRef]
  36. Leardi, R. Genetic algorithms in feature selection. In Genetic Algorithms in Molecular Modeling; Elsevier: Amsterdam, The Netherlands, 1996; pp. 67–86. [Google Scholar]
  37. Wang, L.; Hong, L.; Fu, H.; Cai, Z.; Zhong, Y.; Wang, L. Adaptive distance-based multi-objective particle swarm optimization algorithm with simple position update. Swarm Evol. Comput. 2025, 94, 101890. [Google Scholar] [CrossRef]
  38. Chen, Z.; Li, Z.; Huang, J.; Liu, S.; Long, H. An effective method for anomaly detection in industrial Internet of Things using XGBoost and LSTM. Sci. Rep. 2024, 14, 23969. [Google Scholar] [CrossRef] [PubMed]
Figure 1. Taxonomy of mathematical optimization techniques in IoT intrusion detection.
Mathematics 13 02522 g001
Figure 2. The proposed MOO workflow for IoT.
Mathematics 13 02522 g002
Figure 3. The MOO-PSO-XGBoost optimization framework.
Mathematics 13 02522 g003
Figure 4. The MOO-PSO-RF optimization framework.
Mathematics 13 02522 g004
Figure 5. MOO-PSO-XGBoost vs. MOO-PSO-RF: Class-wise metric comparison.
Mathematics 13 02522 g005
Figure 6. MOO-PSO-XGBoost vs. MOO-PSO-RF: Class-wise metric comparison. (a) Macro average metric comparison on CICIOT2023; (b) macro average metric comparison on NSL-KDD; (c) weighted average metric comparison on CICIOT2023; (d) weighted average metric comparison on NSL-KDD.
Mathematics 13 02522 g006
Figure 7. Comparative evaluation of classification performance for MOO-PSO-XGBoost before and after feature reduction across the CICIoT2023 dataset.
Mathematics 13 02522 g007
Figure 8. Comparative evaluation of classification performance for MOO-PSO-XGBoost before and after feature reduction across the NSL-KDD dataset.
Mathematics 13 02522 g008
Figure 9. Comparative evaluation of classification performance for RF before and after feature reduction across the CICIoT2023 dataset.
Mathematics 13 02522 g009
Figure 10. Comparative evaluation of classification performance for RF before and after feature reduction across the NSL-KDD dataset.
Mathematics 13 02522 g010
Figure 11. Performance evaluation of Optimized MOO-PSO-XGBoost trained with feature reduction on the CICIoT2023 Dataset. (a) Validation loss over epochs; (b) convergence toward the true Pareto front (PF).
Mathematics 13 02522 g011
Figure 12. Performance evaluation of Optimized MOO-PSO-XGBoost trained with feature reduction on NSL-KDD. (a) Validation loss over epochs; (b) convergence toward the true Pareto front (PF).
Mathematics 13 02522 g012
Figure 13. Performance evaluation of Optimized RF trained with feature reduction on the CICIoT2023 dataset. (a) Validation loss over epochs; (b) convergence toward the true Pareto front (PF).
Mathematics 13 02522 g013
Figure 14. Performance evaluation of Optimized RF trained with feature reduction on NSL-KDD. (a) Validation loss over epochs; (b) convergence toward the true Pareto front (PF).
Mathematics 13 02522 g014
Figure 15. Comparison between single-objective PSO and multi-objective PSO trained on the CICIIOT2023 dataset.
Mathematics 13 02522 g015
Table 1. Summary of reviewed intrusion detection techniques.
Ref.MethodDatasetKey Outcomes/
Contributions
Liu et al. (2023) [9]Binary GWO + MLCSE-CIC-IDS2018RF achieved the best results; the model was deployed in SDN for DDoS detection.
Benmalek et al. (2025) [14]PSO + ML/DL (CatBoost, CNN, SVM)RT_IoT2022PSO reduced overhead; CatBoost—99.85% binary accuracy.
Subramani et al. (2023) [15]MOPSO + SVMNSL-KDD, CIDD99.72% accuracy; reduced features from 41 to 11.
Wei et al. (2020) [17]Multi-objective immune algorithm with NNNSL-KDD, UNSW-NB15Improved classification via elite selection; high accuracy on multi-class attacks.
Li et al. (2024) [20]FS (Chi-square) vs. FE (PCA, AE)TON-IoT, BoT-IoTAutoencoders + RF yielded best performance; FE preferred for complex data.
Amin et al. (2024) [23]CZOLSTM: Chaotic Zebra Optimization + LSTMCSE-CIC-IDS2018Outperformed six DL models in binary classification; 99.83% accuracy.
Elsedimy et al. (2024) [24]QSVM + Improved GWOCustom datasetEnhanced precision and detection through optimized feature selection.
Jianping et al. (2024) [25]Attention-based GNN in FLNSL-KDD, KDD Cup 99Maintained accuracy and privacy using graph modeling.
Karpagavalli et al. (2025) [26]Graph Transformer + Edge WeightingToN-IoT, UNSWNB15, othersAchieved 98.87% accuracy; handled class imbalance with SMOTE.
Kumar et al. (2025) [27]Blockchain + FL with Active Meta-LearningCIC-ToN-IoT, Bot-IoTPrivacy preserved via contextual DP; achieved 96.7% accuracy.
Alsadhan et al. (2024) [28]Blockchain privacy review using PRISMA60+ studiesClassified blockchain-based IoMT privacy solutions.
Alsadhan et al. (2024) [29]Homomorphic encryption + blockchainConceptual (Saudi healthcare)Hybrid classification using HIPAA and SDAIA; privacy enhancement focus.
Salem et al. (2024) [30]Review of ML/DL/metaheuristic methods60+ IDS studiesProposed unified AI evaluation framework for IDSs.
Elahi et al. (2022) [31]MOGCO-II for schedulingZDT benchmarksOutperformed MOPSO/NSGA-II; not applied to IDS.
Cai et al. (2015) [32]Decomposition-based multi-objective PSOBenchmark test casesEnhanced convergence/diversity; not evaluated on IDS.
Table 2. Summary of the components of the proposed method.
ComponentDescriptionJustification
DatasetCICIoT2023 and NSL-KDDProvides a comprehensive, high-dimensional, and realistic IoT attack scenario.
Feature SelectionGenetic AlgorithmMaintains efficiency while reducing dimensionality by managing intricate search spaces.
Classifier ModelsCombination of optimized machine learning (XGBoost and Random Forest).Offers a fast, robust baseline for improved attack detection accuracy.
Optimization ObjectiveMulti-objective PSO fitness functionOptimizes convergence speed, model complexity, and classification accuracy to handle the resource-constrained IoT applications.
Table 3. Train and test feature-label shapes for each dataset and classifier.
ClassifierSplitFeatures (X)Labels (Y)
CICIoT2023
MOO-PSO-XGBoostTrain(200,889, 34)(200,889)
Test(50,223, 34)(50,223)
MOO-PSO-RFTrain(98,271, 34)(98,271)
Test(24,568, 34)(24,568)
NSL-KDD
MOO-PSO-XGBoostTrain(92,763, 30)(92,763)
Test(23,191, 30)(23,191)
MOO-PSO-RFTrain(108,360, 31)(108,360)
Test(27,091, 31)(27,091)
Table 4. Comparison of optimization approaches: Walaa-MOS, A-MOCLPSO, standard MOPSO, and standard PSO.
AlgorithmFitness FunctionRemarks and Limitations
MOO-PSO Pareto Front-basedMaintain an external collection of non-dominated solutions and select leaders from this collection to direct the particles.PSO combines multi-criteria decision-making with exploration and exploitation capabilities. It allows for flexible selection among conflicting goals, such as accuracy, uncertainty (measured by log loss), and model complexity.
Dimension-based PSO [7,32,37]In this variant, each particle learns from several exemplars across dimensions (attributes) rather than just learning from individual or global bests.A practical approach to solving multi-objective problems by assigning complete learning in high-dimensional search space, preventing premature convergence, and preserving diversity. The use of attribute management and dimension-wise learning leads to an increased level of computational complexity.
Standard Multi-Objective PSO [15]The conventional multi-objective PSO algorithm uses both global and local bests to coordinate particles and to maintain an external archive (the Pareto front).The Pareto archive is used to select candidates to balance several objectives. These variations may struggle to maintain diversity and tend to converge too quickly.
Standard PSO [14]A single-objective particle swarm optimization algorithm. The particle’s velocity is adjusted following its local and global optimal positions.Simple and effective for problems with only one objective but incapable of managing several competing goals without making adjustments. Landscapes with complex characteristics have a limited ability to preserve diversity and are prone to premature convergence.
Table 5. Comparison of optimization parameters.
Parameter NameDescriptionValue
learning_rate The rate at which each new constructed tree contributes to the fixing of errors caused by earlier trees.(0.01 to 0.3)
max_depth The number of layers that can be added to each decision tree.(3 to 10)
n_estimators The number of trees that the model constructs.(50 to 300)
g a m m a The minimum accuracy increase necessary to consider further splitting at a node.
Min_Child_Weight The minimum weight in a child node that triggers a split, thereby preventing excessive overfitting.(1 to 10)
Table 6. Comparison of optimization parameters.
Parameter NameDescriptionValue
n_estimators The total number of decision trees in the random forest(10 to 100)
min_samples_split Minimum number of data points to split.(2 to 20)
max_depth The maximum number of levels that each tree may reach.(2 to 10)
min_samples_leaf Minimum number of data points per leaf.(1 to 10)
max_ features The most significant number of factors that can be considered when choosing how to split at a node.(0.1 to 1.0)
Table 7. Performance metrics for optimized 5G IDS.
MetricDefinitionFormula
AccuracyProportion of correctly identified instances (attacks and normal traffic) among all evaluated cases. T P + T N T P + T N + F P + F N
F1 ScoreAverage mean of precision and recall. 2 × Precision × Recall Precision + Recall
Kappa (Cohen’s Kappa)Measures agreement between predicted and actual classifications. κ = P o P e 1 P e
SpecificityProportion of normal traffic correctly identified by the IDS. T N T N + F P
SensitivityProportion of actual attacks correctly identified by the IDS. T P T P + F N
PrecisionProportion of correctly identified attacks among all instances identified as attacks by the IDS. T P T P + F P
Table 8. Performance evaluation metrics before feature reduction.
ModelAccuracyRecallF1 ScorePrecisionKappa Score
CICIoT2023 Dataset
MOO-PSO-XGBoost0.99280.94410.94700.95070.9855
MOO-PSO-RF0.91180.42050.40740.46370.8095
NSL-KDD Dataset
MOO-PSO-XGBoost0.99910.99500.89620.86400.9985
MOO-PSO-RF0.97940.97260.96640.96060.9697
Table 9. Performance evaluation metrics after feature reduction.
ModelAccuracyRecallF1 ScorePrecisionKappa Score
CICIoT2023 Dataset
MOO-PSO-XGBoost0.98380.88300.88480.88810.9672
MOO-PSO-RF0.91420.43840.37940.34870.8262
NSL-KDD Dataset
MOO-PSO-XGBoost0.98460.77670.77110.76570.9732
MOO-PSO-RF0.99660.99530.99560.99600.9950
Table 10. Statistical comparison of MOOIDS-IoT models vs. baseline models.
ModelMean Performancep-Value (Paired t-Test)p-Value (Wilcoxon)Significance
CICIoT2023 Dataset
MOO-PSO-XGBoost0.98330.00000.0020Significant
XGBoost (Baseline)0.9118
MOO-PSO-RF0.92520.00000.0015Significant
RF (Baseline)0.8005
NSL-KDD Dataset
MOO-PSO-XGBoost0.84640.00000.0020Significant
XGBoost (Baseline)0.7694
MOO-PSO-RF0.99500.00000.0015Significant
RF (Baseline)0.9607
Table 11. Optimal parameters for both datasets before feature reduction.
CICIoT2023 Dataset
(Before Feature Reduction)
CICIoT2023 Dataset
(After Feature Reduction)
ParameterMOO-PSO-XGBoostMOO-PSO-RFMOO-PSO-XGBoostMOO-PSO-RF
Learning Rate0.0832 0.3
Max Depth9232
N Estimators3007911961
Gamma0.6909 1.9
Min Child Weight5.6238 3.3
Min Samples Split 2 1
Min Samples Leaf 3.3419 1
Max Features 0.4952 1
NSL-KDD Dataset
(After Feature Reduction)
NSL-KDD Dataset
(After Feature Reduction)
ParameterMOO-PSO-XGBoostMOO-PSO-RFMOO-PSO-XGBoostMOO-PSO-RF
Learning Rate0.2784 0.01
Max Depth454.8916.94
N Estimators164106110113
Gamma2.1278 3.78
Min Child Weight4.5141 1
Min Samples Split 10 5
Min Samples Leaf 1 10
Max Features 1.0 0.74
Table 12. Optimization and training times (both datasets). Times are given as Before Feature Selection (BFS) and After Feature Selection (AFS).
DatasetModelOptimization TimeTraining Time
BFSAFSBFSAFS
CICIoT2023MOO-PSO-XGBoost2 h 6 m1 h 46 m 47 s1 m 43 s28.2 s
MOO-PSO-RF1 h 24 m 26 s2 h 31 m 18 s1 m 50 s55 s
NSL-KDDMOO-PSO-XGBoost30 m28 m 50 s (CPU)11 s14.4 s
MOO-PSO-RF1 h 23 m 25 s3 h 59 m 37 s20 s25 s
Table 13. Performance comparison of machine learning methods on a multi-class classification task using the CICIoT2023 dataset. RF: Random Forest; LR: logistic regression; AB: AdaBoost; PER: perceptron,; DNN: deep neural network; RNN: recurrent neural network; CNN: convolutional neural network; DNN: deep neural network (standalone). MOO: multi-objective functions.
MethodObjective FunctionFeature ReductionEvaluation MetricsTraining Time (s)
ACCPrecRecF1 Score
LR [33]Cross-Entropy LossN/A0.83170.51240.69610.5394N/A
PER [33]Mean Squared ErrorN/A0.86640.52390.69780.5551N/A
AB [33]Exponential LossN/A0.53160.46490.48780.3687N/A
RF [33]Gini ImpurityN/A0.99440.70540.91010.7193N/A
DNN [33]Cross-Entropy LossN/A0.99110.67940.90660.6973N/A
RF [10]Gini ImpurityPCC0.95550.95560.95550.9552500
LR [10]Cross-Entropy LossPCC0.67650.69040.67650.6739100
AB [10]Exponential LossPCC0.45780.49850.45780.4224450
PER [10]Mean Squared ErrorPCC0.56610.58020.56560.563750
DNN [10]Cross-Entropy LossPCC0.83080.83630.83020.82843300
RNN [6]Cross-Entropy LossN/A0.96520.96250.96520.95733500
CNN [6]Cross-Entropy LossN/A0.96370.96150.96370.95513400
DNN [6]Cross-Entropy LossN/A0.87420.86940.87420.86262800
MOO-PSO-XGBoostMOON/A0.99280.95070.94410.947103
MOO-PSO-RFMOON/A0.91180.46370.42050.4074110
MOO-PSO-XGBoostMOOGA0.98380.88810.88300.884828.2
MOO-PSO-RFMOOGA0.91420.34830.43840.397455
Table 14. Multi-attack detection performance of NSL-KDD under different models. RF: Random Forest; LR: Logistic Regression; DNN: Deep Neural Network (standalone); GNB: Gaussian Naive Bayes; GWO: Grey Wolf Optimizer; CNN: Convolutional Neural Network; DT: Decision Tree; GA: Genetic Algorithm; PSO: Particle Swarm Optimization; MOO: Multi-Objective Functions; ACC: Accuracy; N/A: Not Applicable; endash (–): Data not reported or not available.
MethodObjective FunctionFeature ReductionEvaluation MetricsTraining Time (s)
ACCPrecRecF1 Score
DT [19]Gini ImpurityRF-GWO0.980.950.960.972900
DT [19]Gini ImpurityDT-PSO0.950.910.920.93100
GNB [19]Gaussian LikelihoodDT-GW00.960.920.930.94100
GNB [19]Cross-Entropy LossLR-GW00.940.880.890.915200
LR [19]Gini ImpurityRF-PS00.930.870.890.903700
LR [19]Cross-Entropy LossLR-GW00.920.860.880.891600
GNB [19]Gaussian LikelihoodDT-PSO0.910.850.870.88100
LR [19]Cross-Entropy LossDT-GA0.910.850.860.87300
GNB [19]Gaussian LikelihoodGNB-GA0.930.880.890.90100
LR [19]Gini ImpurityRF-GA0.920.870.880.892100
LR [19]Cross-Entropy LossGNB-PSO0.900.840.850.86100
GNB [19]Gaussian LikelihoodLR-GA0.890.830.840.85300
RF [19]Gaussian LikelihoodGNB-GW00.880.820.830.84100
RF [19]Gini ImpurityDT-GA0.900.840.850.86100
RF [19]Gaussian LikelihoodGNB-GA0.910.860.870.88100
Attention-based GNN [25]AccuracyGA0.99951.001.001.00N/A
MIX_LSTM [38]AccuracyMOO-PSO-XGBoost0.8230.9700.884748.371
MIXCNNLSTM [38]AccuracyXGBoost0.7931.000.807N/A
CNN_LSTM [38]AccuracyXGBoost0.7880.9920.870N/A
CNN [38]AccuracyXGBoost0.7720.9200.766N/A
MLP [38]AccuracyXGBoost0.4310.9000.000N/A
DNN [38]AccuracyXGBoost0.4360.9200.0N/A
MOO-PSO-XGBoostMOON/A0.99280.95070.94410.94711
MOO-PSO-RFMOON/A0.91180.46370.42050.407420
MOO-PSO-XGBoostMOOGA0.98460.76570.77670.771114.4
MOO-PSO-RFMOOGA0.99660.99600.99530.995625
Disclaimer/Publisher’s Note: The statements, opinions and data contained in all publications are solely those of the individual author(s) and contributor(s) and not of MDPI and/or the editor(s). MDPI and/or the editor(s) disclaim responsibility for any injury to people or property resulting from any ideas, methods, instructions or products referred to in the content.