1. Introduction
The process of operational risk management in organizations is a continuous and critical endeavor within organizations, encompassing the identification, analysis, and assessment of potential disruptions and their impacts, followed by strategic and operational responses [
1]. In the risk identification phase, potential causes of disruptions and their impacts are examined, considering external and internal factors. The subsequent risk analysis phase assesses each event’s risk based on its likelihood, consequences, and the effectiveness of control measures. In the current risk assessment process, the final stages involve evaluating potential adverse outcomes. A core challenge in this process lies in the evaluation of adverse outcomes, which often hinges on subjective assessments of likelihoods and consequences. This inherent subjectivity influenced by the assessor’s experience and viewpoint frequently leads to inconsistent risk evaluations, even when examining identical systems.
Recent years have seen a significant rise in the complexity of processes within projects and organizations [
2,
3], which has greatly increased the challenges of attaining an accurate assessment process. This is mainly due to the increased level of uncertainty in events [
4] as well as due to the lack of knowledge and insufficient information about the processes and interrelated factors, which together greatly impede the accuracy of the risk assessment stages [
5]. Moreover, the increased complexity of the process also increases the variance in the risk assessment matrices compiled by different human auditors. In other words, today, more than ever, two different human auditors might compile different results when providing their final assessment scores for the same process [
6]. Such inconsistencies directly impact strategic resource allocation and decision-making by management, potentially leading to misguided mitigation efforts or a false sense of security. An objective Risk Management model can help organizations reduce reliance on subjective evaluations, leading to more accurate risk assessments and better-informed decision-making within the organization [
7].
In contemporary risk management, several attempts have tackled the above-mentioned problem. For example, while the classical risk assessment tool for auditors is a 2-D risk matrix with the probability of event occurrence and the consequence of the event, the author [
8,
9] suggested adding a third dimension, the system’s knowledge, to better capture the uncertainty in the system’s complexity. In research by [
10], the author argued in his study that the prevalent use of risk matrices can lead to poor decision-making due to the auditors’ subjective assessments of uncertain outcomes. Another example that illustrates the challenges is by [
11], who suggested a taxonomy of uncertainties based on four levels of uncertainties and four levels of system outcomes. In [
12], the author deals with flaws in the risk matrix, such as ordinal scales, semi-quantitative arithmetic, range compression, risk inversion, ambiguity, and uncertainty neglection, which may cause misrepresentation of the objective risks.
These studies do highlight the challenges of subjective judgment and the lack of auditors’ knowledge that may increase variability in risk assessment; however, none of these suggested solutions investigated the practice of reducing the uncertainty instead of integrating it into their new models. In contrast, in our work we suggest a new methodology for the auditor that will reduce the uncertainty and thus reduce the variance in the outcomes of the risk assessment process. Specifically, this research aims to answer the following question: how can an integrated causal framework enhance the precision and objectivity of operational risk assessments by reducing subjective human judgment?
We suggest that integrating tools from system dynamics [
13], information systems analysis [
14], and graph theory [
15] offers a powerful method for understanding the structure and behavior of processes or complex system risks [
16]. We draw heavily from system dynamics, utilizing its core concepts of feedback loops, stocks, and flows to capture the dynamic interactions within complex systems. This allows us to model how risk factors influence each other over time and how these interactions contribute to the overall risk profile. Additionally, we incorporate elements from information systems analysis, particularly its focus on information flows and decision-making processes within organizations. This helps us understand how information about risks is gathered, processed, and used to inform risk management strategies. Finally, we leverage the power of graph theory, specifically employing Directed Acyclic Graphs (DAGs), to explicitly map the causal relationships between different risk factors. This graphical representation provides a clear and intuitive visualization of the risk landscape, facilitating a deeper understanding of the complex interplay between various risk drivers. By combining these established theoretical frameworks, our model offers a novel and comprehensive approach to operational risk assessment, addressing the limitations of traditional methods and providing a more robust and nuanced understanding of risk dynamics.
Traditional risk assessment models, often rooted in qualitative assessments or basic quantitative frameworks, have served as valuable tools for identifying and evaluating potential risks, yet they often encounter limitations when applied to increasingly complex systems. One key limitation is their inability to capture non-linear relationships between risk factors, frequently relying on linear assumptions and failing to adequately represent the intricate interplay and feedback loops that characterize complex systems. Furthermore, these models often struggle with handling uncertainty, particularly in situations where data is scarce or unreliable, relying on simplistic probability estimations or subjective expert judgments that can introduce significant biases and inaccuracies. While traditional risk assessment often relies on subjective judgments, recent advancements in actuarial science and risk modeling have introduced more quantitative approaches to handle uncertainty. For instance, studies on renewal dual risk models, such as that by [
17], delve into detailed probabilistic measures like ruin probability and dividend expectations, offering analytical frameworks for complex financial systems. Another common limitation is the oversimplification of complex interactions, as traditional models may reduce complex systems to a limited set of variables and interactions, neglecting the intricate web of interconnectedness that drives risk dynamics. This can lead to an incomplete understanding of risk pathways and an underestimation of potential cascading effects. Lastly, many traditional models exhibit a heavy reliance on subjective expert judgments, particularly in the qualitative assessment phase, which introduces variability and potential biases due to differing expert interpretations and risk perceptions. These limitations underscore the need for more sophisticated and robust risk assessment models, such as the one proposed in this paper, which aim to address these challenges and provide a more accurate and comprehensive understanding of risk in complex systems. Our proposed model offers several key advantages and novel features that address the limitations of traditional risk assessment approaches. By integrating system dynamics, information systems analysis, and graph theory, our framework provides an enhanced ability to capture complex causal relationships, particularly non-linear interactions and feedback loops often overlooked in simpler models. The use of DAGs enables a more precise and transparent representation of these relationships, facilitating a deeper understanding of risk pathways and potential cascading effects. This, in turn, leads to improved accuracy in quantifying risk probabilities, as the model can better account for the interplay of various risk factors and their influence on overall risk levels. Moreover, our model promotes a reduced reliance on subjective judgments by incorporating data-driven analysis and explicit causal modeling. This minimizes the potential for biases and inconsistencies that can arise from relying solely on expert opinions. Finally, our framework offers a more robust approach to handling uncertainty, allowing for the incorporation of probabilistic estimations and sensitivity analyses to explore the impact of uncertain variables on risk outcomes. Through these advancements, our model contributes to a more comprehensive and reliable risk assessment process, ultimately leading to better-informed decision-making and risk mitigation strategies.
This innovative framework aims to enhance clarity, reduce uncertainty in complex scenarios, and improve the accuracy of predictions regarding the system’s states or performance. The analytical approach of our framework, which consists of deconstructing the risk agents and risk transfer mechanisms, improves the mapping of the main risk factors in the process and the understanding of the natural forces and vectors that affect complex non-linear systems. The proposed framework seeks to simplify complex systems by using a DAG structure and logical gates in a way that unmasks causal relationships and detailed interactions within the system, thus reducing the uncertainties the auditor faces.
The practical applicability of our proposed model is a key strength. As demonstrated in the illustrative examples presented in this paper, the framework can be readily applied to real-world operational risk scenarios, providing tangible benefits for risk managers in organizations and projects, internal auditors, and other decision-makers. The model’s graphical representation, using DAGs, offers an intuitive visualization of complex risk pathways, making it accessible to both technical and non-technical audiences. This user-friendliness facilitates communication and collaboration among stakeholders, fostering a shared understanding of the risk landscape. Furthermore, the model’s ability to generate quantitative risk probabilities supports data-driven decision-making, enabling risk managers to prioritize mitigation efforts and allocate resources effectively. By offering a structured and transparent approach to risk assessment, our model empowers organizations to move beyond subjective judgments and embrace a more robust and evidence-based approach to risk management.
The outline of our paper is as follows: In
Section 2, we define various types of risks and explore different approaches used in the literature and industry to describe systems, uncertainty, and process flow.
Section 3 introduces our methodological tool, which integrates various processes to enhance system clarity and highlights the role of causal graphs in managing uncertainty.
Section 4 presents illustrative examples comparing traditional risk assessment methods with our new approach. Finally,
Section 5 discusses the results and implications of our methodology, and
Section 6 concludes the paper by highlighting the study’s implications and suggesting several important avenues for future research.
2. Literature Review
A substantial body of research focuses on uncertainty and its measurement in risk assessment and management. The following section delves into the concepts of risk and uncertainty, particularly within systems and operational processes in the industry.
The literature identifies the following two main types of uncertainty that can impact the risk assessment process [
18,
19]:
Objective uncertainty: Arises from the inherent natural randomness and variability in certain processes, interdependencies, and feedback loops among the factors (stochastic or aleatory uncertainty or ontological uncertainty).
Subjective uncertainty: Originates from incomplete knowledge, measurement errors, vagueness, ambiguity, lack of specific details, indeterminacy, cognitive biases, and human judgment (perceived or epistemic uncertainty).
Subjective uncertainty primarily depends on the biases and judgment of the individual (such as an auditor), as well as their knowledge, experience, and understanding of the system and its processes [
20]. The gap between these two uncertainties might stem from either an underestimation or an overestimation of the process probabilities. While both are undesirable, risk managers typically prefer overestimation to ensure a more cautious approach rather than underestimation [
21].
Despite these observations, a key gap in the literature is the lack of insight into the mechanism that explains the discrepancy between objective and subjective risk parameters. Various research studies [
22,
23] have highlighted some factors, including subjective judgment and human biases, which widen the gap between these risk values. Yet, we did not find any methodology that reduces the gaps between objective and subjective risk assessments or studies that aimed to explain how the risk chain of different factors converges to the finite risk score.
Recognizing these challenges, recent research has explored advanced methodologies to improve risk assessment accuracy and overcome subjective inconsistencies. In a relevant study, [
24] compared traditional risk assessment, often hindered by reliance on fixed, potentially subjective impact and probability values, with a graphical approach explicitly incorporating uncertainty via user-defined rectangles. Their study, conducted in a critical infrastructure setting, evaluated various aggregation methods for these graphical assessments, validating their consistency with classical approaches. While acknowledging that no single method is inherently superior, their findings underscore the importance of integrating uncertainties into risk assessments and offer insights into the effectiveness and applicability of diverse aggregation methods.
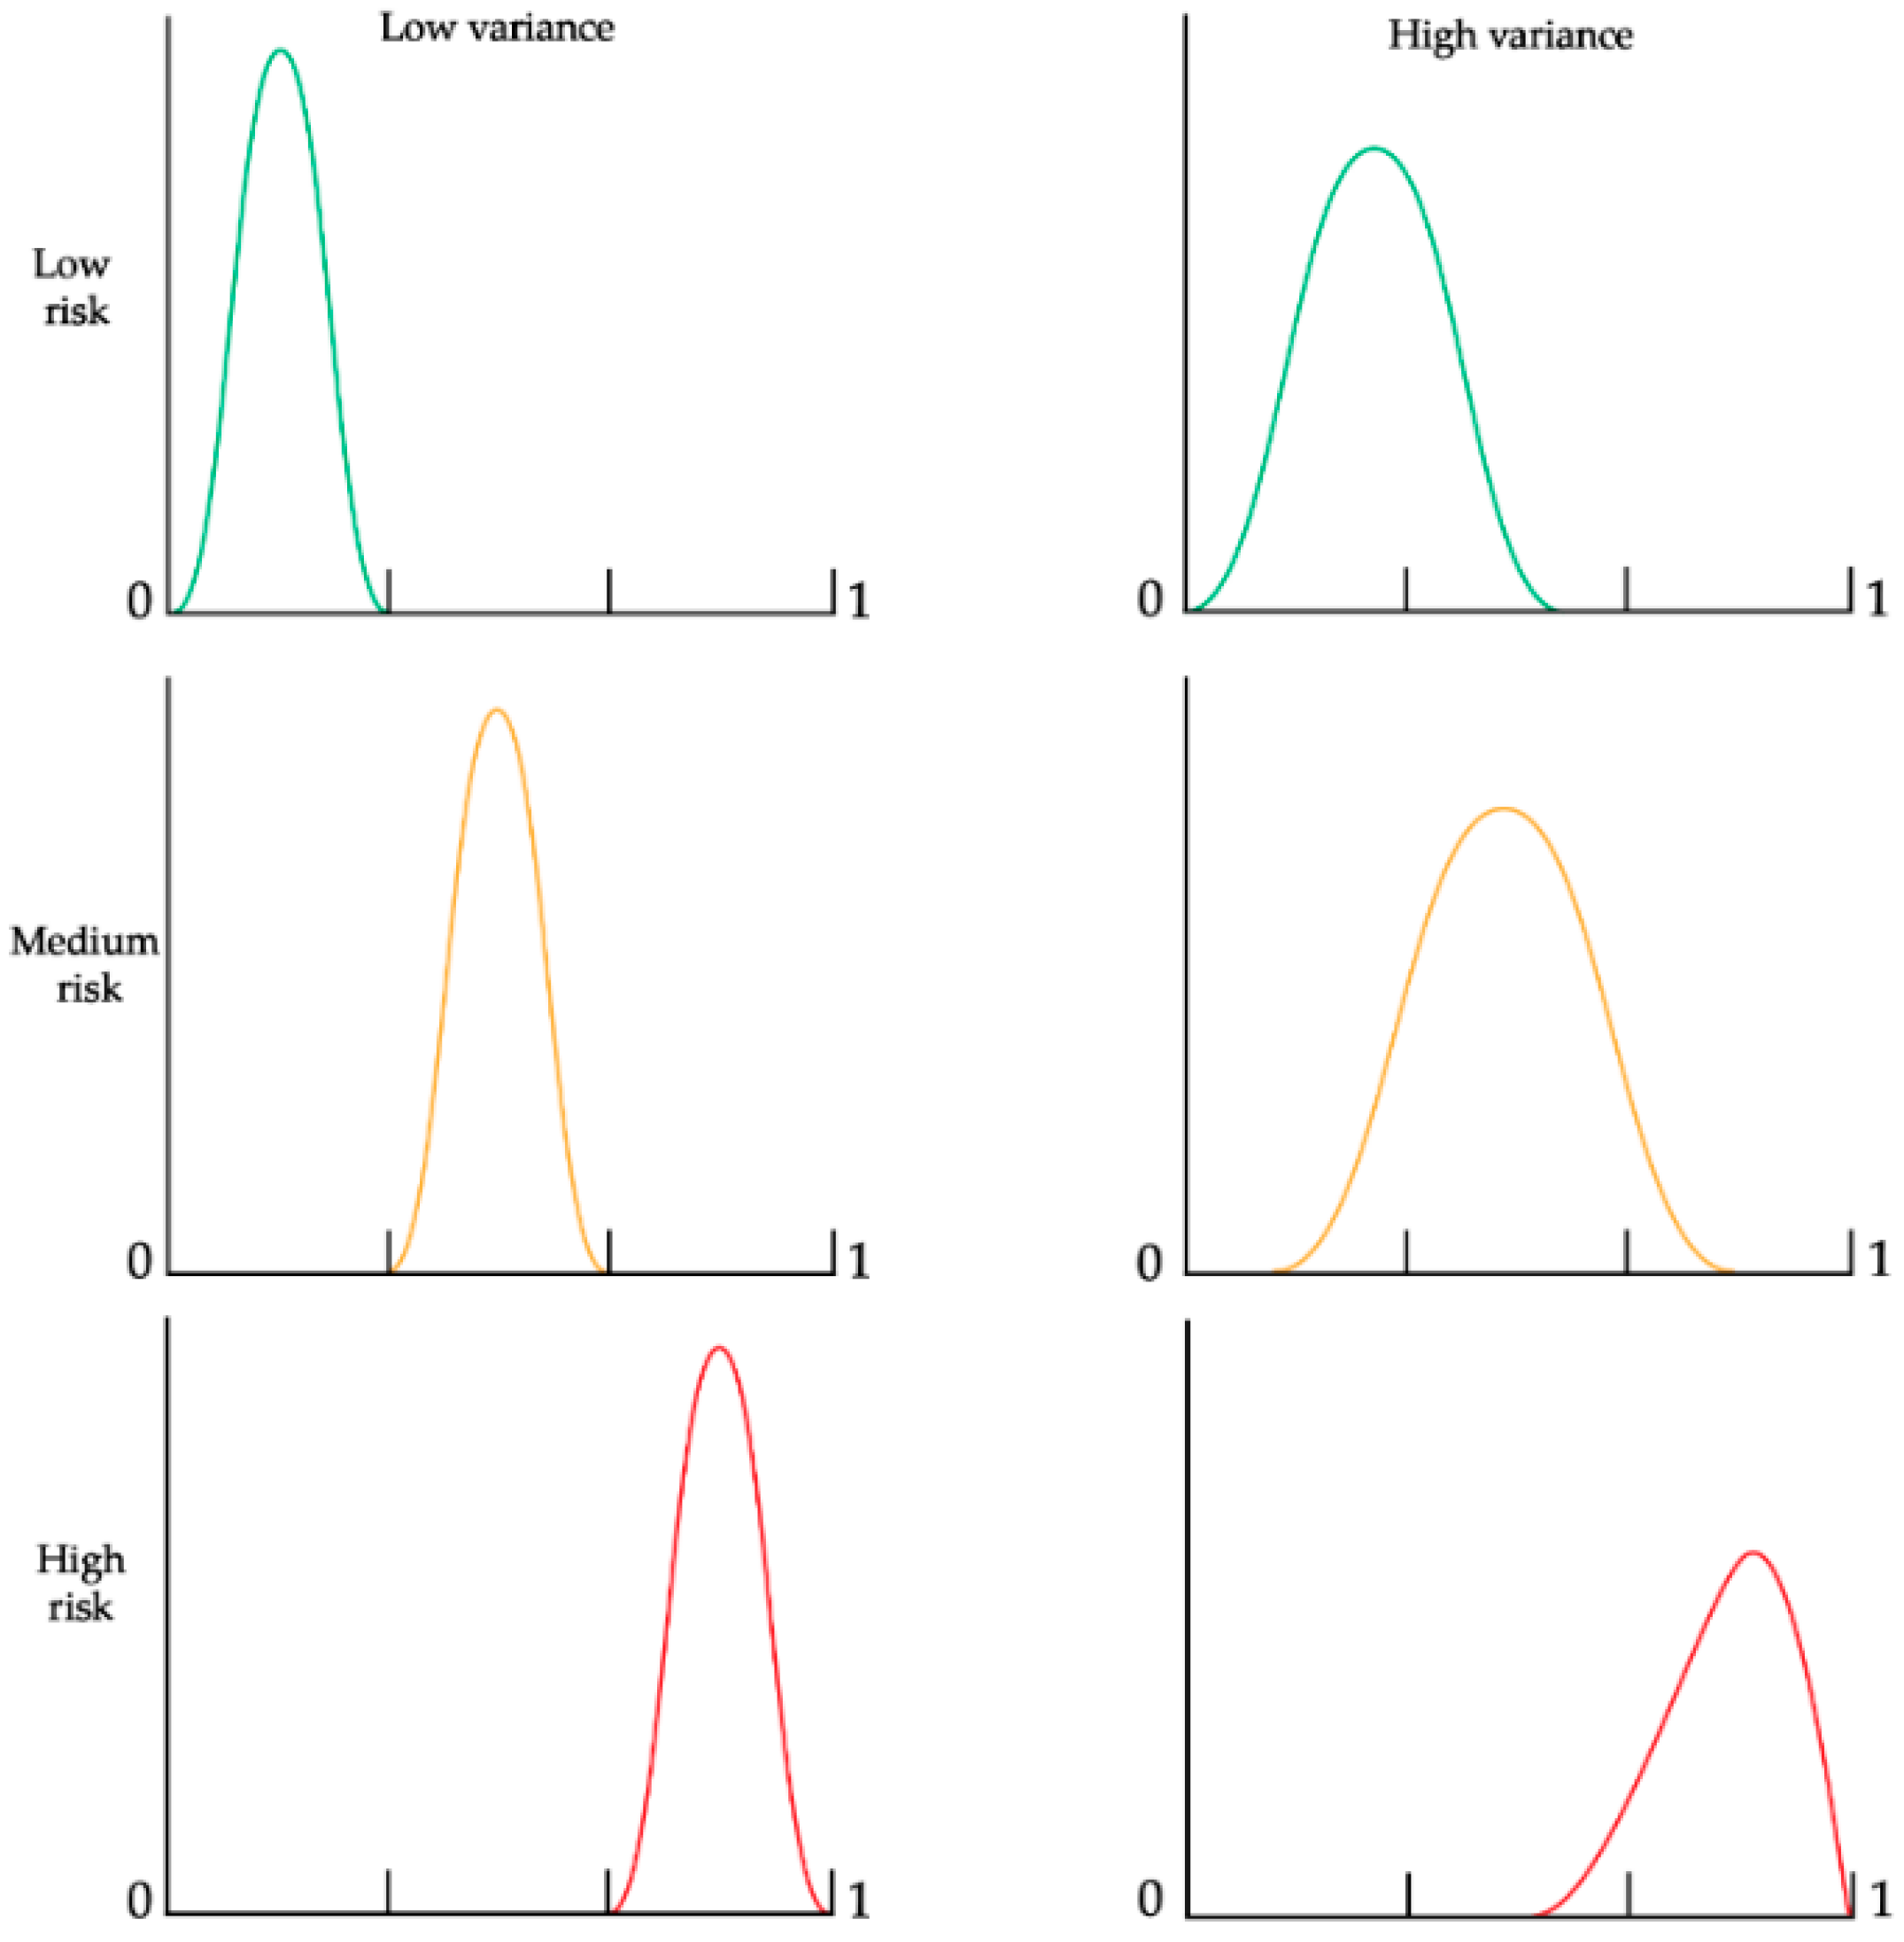
Figure 1 illustrates the two primary characteristics of risk and uncertainty: the mean and the variance, or the system’s entropy [
25] in three different risk levels {low, medium, high}. We can see two examples of variances for each level: a low and a high one. A low variance occurs in cases where the process under the risk evaluation is more controlled (thus, the set of possible outcomes of the process is smaller). A high variance will occur in cases in which the process might result in a larger set of outcomes; thus, a process that is harder to predict or control.
The process/system complexity primarily influences the variance (or entropy) [
26,
27] and the interactions between risk factors [
28]. Even if the risk level is low or medium, high variance can sometimes lead to a higher likelihood of risk due to the broader dispersion at the higher end of the range. Notably, a previous study [
6] showed that reducing variance has a more significant impact at low and medium-risk levels, whereas its effect at high-risk levels is less pronounced.
Figure 1 demonstrates that increased variance can positively affect outcomes at high-risk levels (represented by the red curve) due to its skew towards the lower end of the distribution. So, counter-intuitively, in some very special cases, we might be better off with a process that produces high variance, which may reduce the probability of risk occurrence. The situations that can benefit from higher variability are cases in which the output range is strictly specified, such as in a production assembly line, where one machine has a low tolerance of output, but it is tuned out of the control levels and yields only scrap output. In another machine that is also out of tune, the process might have a higher tolerance, so there is a higher likelihood that some of the output will not be considered outliers because of the wider dispersion.
In risk assessment, the auditor aims to obtain insights into the system’s components, behavior, and outcomes while minimizing any biases that might skew our understanding of reality. Previous work showed that different auditors often determine different risk levels to the same reality due to biases in their judgment of the risk [
6]. The literature describes these subjective biases [
23], as well as the concepts of subjective precision and accuracy [
22]. From our perspective, objective uncertainty is difficult to control unless adjustments are made to the system, such as enhancing resilience, introducing redundancy, or implementing additional controls.
This research aims to minimize subjective biases by enhancing objective calculations of risk factors and other confounding factors [
29]. One method to reduce the gap is to deepen our understanding of system components and their behavioral patterns. This involves assigning probabilities to each outcome branch based on causal relationships. A previous study demonstrated that systematically deconstructing processes can improve precision and assessments [
6]. In a similar vein, recent work has explored agent-based models as a robust alternative for analyzing non-linear and unpredictable behaviors arising from intricate interdependencies within financial markets, particularly in the context of systemic risk and risk transfer [
30]. Building on these insights, approaches using frameworks similar to DAGs have emerged as widely used tools for analyzing causality that can also be beneficial for risk assessments [
31]. Our model also draws from research in the field of reliability engineering. Specifically, fault-tree analysis [
32] is well-suited for explaining the risk structure within a system. This methodology involves elements of the process connected through logical operators such as AND and OR gates, which help construct the system’s topology and flow.
The House of Risk (HOR) model [
33], often used to manage supply chain risk, is an approach centered on identifying risk agents and their associated risk events. This approach centers on identifying risk agents and their associated risk events. By systematically mapping these components, the HOR model offers a robust basis for developing a framework that accommodates multiple risk agents for a single risk event or consequence, each with varying transformation rates. This adaptability more accurately reflects the complexities of real-world processes and systems.
A process-oriented approach to risk assessment in operations can be broadened through the lens of a business process management methodology [
34]. This methodology incorporated the dimensions and concepts of the business process management methodology, particularly focusing on contextual factors such as goal, process, organization, and environmental dimensions. These dimensions are crucial for assessing performance and success. Furthermore, understanding the dynamic nature of risk propagation within such processes is vital, and models like the SIR epidemic model have been adapted to analyze how risks spread in complex networks, offering insight into supply chain health control [
35].
The methodologies and theoretical background discussed above have given us a solid foundation for implementing a novel framework. This framework schematically constructs a topology of risk factors and their logical gates, enabling us to describe complex systems clearly. This literature review focused on studies addressing the challenges of subjectivity and uncertainty in risk assessment, as well as foundational works in system dynamics, information systems analysis, and graph theory that form the theoretical underpinnings of our proposed framework.
3. A Novel Framework for Risk Assessment
This section presents our framework, building on previous research and incorporating new insights from further exploration and a deeper understanding of risk mechanisms and uncertainty in systems and processes. Our framework synthesizes established concepts from system dynamics, information systems analysis, and graph theory (including DAGs, Fault Tree Analysis, and the HOR model). We leverage these foundational approaches to construct a structured methodology for operational risk assessment, particularly focusing on decomposing risk into its causal components and modeling their interactions.
3.1. Traditional Methods of Risk Assessment
Qualitative risk assessment, the most basic approach, uses expert judgment and descriptive categories to evaluate risk likelihood and consequence. While quick and requiring minimal resources, its subjectivity and lack of precise magnitude make it unsuitable for complex decisions. Semi-quantitative risk assessment uses numerical scales to rank risks, combining qualitative judgment with a quantitative approach. While offering more objectivity than purely qualitative methods, the reliance on subjective scoring can still lead to limited precision [
36]. Quantitative risk assessment, a data-driven process, uses numerical data and statistical analysis to quantify risks by probability and impact. This allows for more accurate evaluations, detailed analysis, and informed decisions. The resulting risks are often visualized using a risk matrix [
37].
3.2. The Dimensions of Risk and Uncertainty in a Risk Matrix
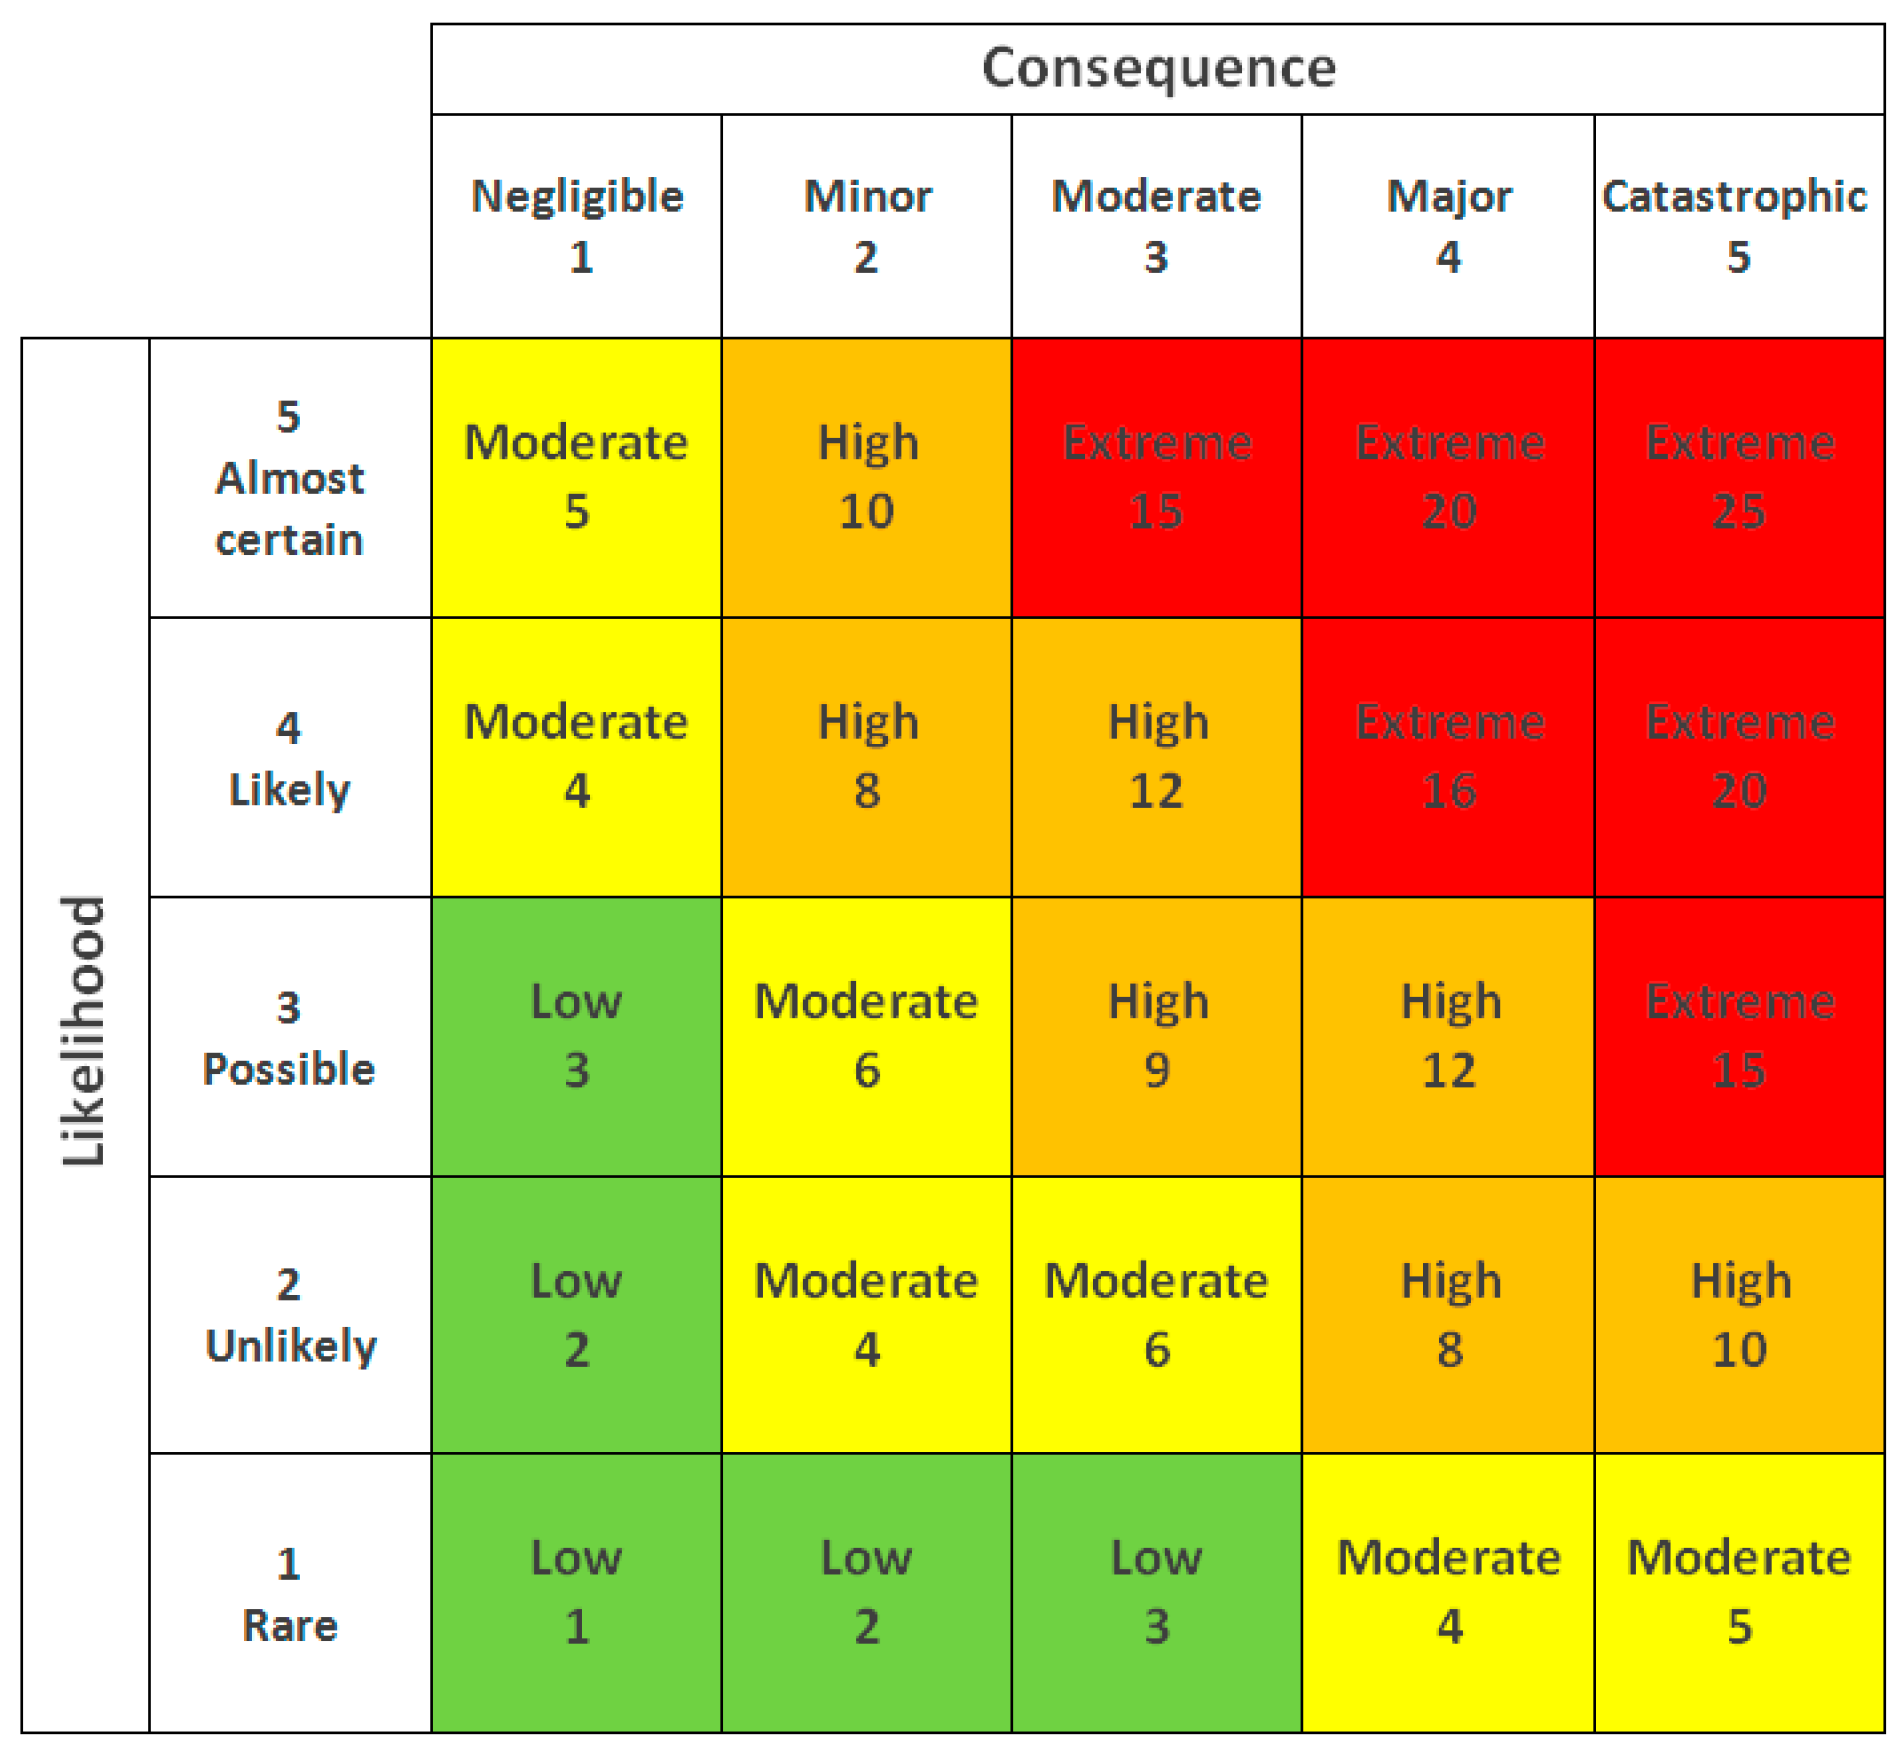
A key component of quantitative risk assessment is the risk matrix, a two-dimensional chart where the y-axis represents the likelihood of an event occurring and the x-axis represents the consequence of that event (
Figure 2). Some studies have proposed adding extra dimensions to the traditional risk matrix, such as the level of control [
38] and knowledge [
39]. We believe these additional dimensions should be integrated into the probability calculations rather than introducing a third axis to create a three-dimensional risk matrix. A simple two-dimensional risk matrix remains the most effective way to present the risk map, factoring additional dimensions into the existing structure of the 2-D matrix.
3.3. Proposed Framework to Increase Precision
Our methodology for bridging the gap involves a five-step procedure: (1) The initial step is to define the risk event blocks, each comprising two distinct components: the agent and the transfer mechanism. (2) The next step involves defining the topology of the process, and (3) we create a causal map that outlines all risk event blocks and their logical connections leading to the final consequential risk. (4) Next, we compute the risk probability of each block and finish (5) by assessing the overall system risk based on the cause-and-effect structure.
3.3.1. First Step—Define the Risk Building Blocks of Agents and Events
The core component of this framework involves defining a risk block, as illustrated in
Figure 3. A risk block comprises a risk agent (
ai), representing a typical risk source such as fire or explosion, and a specific risk transfer mechanism (
bi). The risk transfer mechanism is the conduit through which causality flows from the agent to the consequence and is quantified on a scale from 0 to 1.
If no controls or mitigation measures intervene between the agent and the event, the risk transfer (
bi) is set to 1. Conversely, when effective controls such as redundancy, resilience, or robust design are in place, the value approaches 0, indicating that the risk is unlikely to be transferred to the subsequent event. This approach effectively integrates the “level of control” dimension, as noted by [
38], into the probability value. Typically, values will fall within the midrange rather than 1 or 0, with probabilities of 0.2 or 0.7. The objective for auditors and risk managers is to evaluate the risk transfer mechanism (
bi) as objectively as possible, given the context of the specific risk agent and event.
The approach for determining the probability of risk agents was proposed in earlier published research [
6]. This method involves evaluating several sub-parameters of an agent and using a straightforward formula to estimate the probability of risk occurrence accurately. Similarly, the probability of the risk transfer mechanism should be based on the effectiveness of controls and other mitigation measures relevant to the specific agent. While the risk transfer mechanism adds granularity and precision by accounting for mitigation measures, its explicit quantification is adaptable. In scenarios where a simpler model or data limitations preclude detailed measurement, the transfer mechanism’s probability can be set to 1, effectively indicating no additional control layer is being modeled, or it can be omitted from the calculation for a less complex representation.
We can now calculate the probability of risk event (
cj) by applying the intersection of (
ai) and (
bi) using the following equation. While (
n) is typically 1 in most cases (as from our real-world experience, most often there is a single risk agent for an event), Equation (1) does provide a general method for computing the probability. This formula represents the probability of the union of independent events (i.e., at least one event occurring) and is a standard application of the complement rule in probability theory [
40].
For example, consider a risk event
c1 representing a computer service failure, influenced by three risk agents (
ai) and their corresponding risk transfer mechanisms (
bi). For the purpose of calculating the combined probability of an individual risk block (
p(
ai)
p(
bi)), we assume that the occurrence of the risk agent (
ai) is statistically independent of the effectiveness of the risk transfer mechanism (
bi). This assumption allows us to compute their joint probability as a direct product, representing the likelihood that both the risk source manifests and its transfer mechanism permits propagation to the subsequent event. The first agent, (
a1), is human error; (
a2) is a fire in the server room; and (
a3) is a critical cyber-attack. For event (
c1) to occur, one or more agents must materialize. To determine the probability of (
c1), we need to calculate the probability of the negation, which is that none of the agents will occur.
Table 1 shows how to compute the probability of the event (
c1) occurring if one (or more) of the risk agents (
a1), (
a2), (
a3) occurs. In the table, the symbol ‘¬’ denotes logical negation or complement, meaning 1 minus the probability of the preceding expression.
The consequential risk event cj is determined by the product of the risk agent and its associated transfer mechanism. This represents a fundamental unit of risk within a broader, holistic system, leading to a significant risk consequence. Our objective is to evaluate the probability of the system comprising various risk events, c1…j, considering different configurations.
3.3.2. Second and Third Steps—Define the Topology and Logical Configurations
Following the computation of all the risk event probabilities, the second stage of our proposed framework involves constructing the process topology. This involves logically organizing all risk events, building blocks that capture the causal flow from risk sources to the final consequence. Fault Tree Analysis influences this logical structure: a methodology widely used in the reliability of engineering systems [
41]. To do so, we outline all the relationships leading to the final risk from its preceding events, considering the following three logical options:
The choice between OR and AND gates is dictated by the precise dependency logic: an OR gate is used when any single event can lead to the consequence, while an AND gate requires all connected events to occur concurrently.
3.3.3. Step Four—Compute the Risk Probability of Each Block
To compute the risk that affects the consequence, we build a truth table, as shown in
Table 2. In this example, we have 16 different combinations of event states for the complete table), but only 3 of them can yield a false result (which means, in our example, that the system will not fail).
3.3.4. Step Five—Compute the Risk Probability of the Entire Map
To calculate the entire system risk probability in this topology, we only need to know the probabilities of
c1–4, and then we can derive the map solution. For our running example, we will use the following probabilities of failure:
As we can see from the truth table (
Table 3), it will be easier to find only the states that cause the system not to fail and calculate its negation. We now apply the probabilities of failure noted (T) and success noted (F) to the truth table:
We find that the probability of the entire system failing, which means that all predecessor events to the consequence will concurrently fail, negates the situations in which all the predecessors are false. Now, we can easily compute the result using the complement:
When constructing the causal map and assessing overall system risk, it is crucial to avoid restrictive assumptions that may compromise the accuracy of risk quantification. Specifically, assuming Independent and Identically Distributed (IID) risk events or mutually exclusive outcomes can lead to an underestimation or misrepresentation of true risk. IID assumes that each event occurs independently of others and that all events share the same probability distribution. We highlight that in complex operational systems, risk events are often interdependent and not identically distributed, making simple IID assumptions insufficient for accurate assessment. Therefore, for scenarios involving an OR logical gate where multiple risk events can independently lead to a common consequence, we rigorously employ the complement method. This approach, calculating the probability of the union of events as one minus the product of the probabilities of their complements, provides a more robust and accurate assessment, explicitly accounting for the possibility of concurrent occurrences and moving beyond simplified additive approximations.
3.4. Constructing a Model of a Real-World Situation
To illustrate the implementation of our method, we specify a real-world situation and construct a map to compute the probability of risk occurrence. In
Figure 5, we can see a schematic demonstration of events and consequences and a map of complex connections of risk fraud in a bank. We define consequence X as a fraud event by a bank employee and consequence Y as fraud by a customer and an employee. In this example, risk agent A, defined as a lack of internal controls and segregation of duties, transfers risk to events X and Y with different probabilities (due to the different transfer mechanisms). Risk agent B, defined as a lack of employee screening and recruiting procedures, also transfers risk to X and Y with different probabilities. Event C is defined as problematic customers and affects only consequence Y; note that all events have AND connectors, so all the input events must take place alone for consequences to occur.
4. Exemplifying the Model
This section exemplifies the utilization of the model in real-life cases. The illustrative examples represent examples of audits that top experts in the field conducted: one was conducted at a medium-sized organization and focused on operational risks in the payroll procedure. In contrast, the other was conducted in an investment bank, and the process under review was information security. In both cases, the risk assessment procedure was conducted using the traditional assessment protocol. We will use our proposed framework in the same situations and analyze the differences in the results. For clarity and conciseness in presentation, certain computational sub-steps of our five-step methodology, specifically the detailed generation of success/failure probabilities and the explicit construction of truth tables (corresponding to steps 4 and 5 in the new framework), have been integrated directly into the probability calculation for each illustrative example’s final risk assessment. This integrated approach demonstrates the practical application of our framework without redundant tabular representations of intermediate calculations.
4.1. Illustrative Example 1
The first risk assessment we studied was conducted at a medium-sized organization that provides nursing services for the older population. This organization has 13 branches nationwide, a management team of 30 managers and administrative staff, and more than 2000 nursing staff working at the customers’ homes. The firm’s internal auditor conducted an audit on operational risks. We focused mainly on the risks of the payroll procedure to evaluate our new model’s original risk scores.
We reviewed the operational risk assessment report that determined the risk probability in financial and payroll operational procedures in the organization’s headquarters. The auditor based his assessment on these key points: (a) the payroll team is relatively small, (b) the procedure is complex because there are few branches of local offices and a large amount of payroll, (c) the data transfer is based on external interface (d) there is a “heavy load” on the system due to many data entries (e) lack of documentation regarding system failure events (f) lack of effective control over the procedures.
Our criticism of this assessment is that it was not quantified, and determining a high probability of failure or fraud in the payroll payment procedure was arbitrary without any concrete quantifications or references to risk agents and control mechanisms. At this point, we represent alternative assessment using our unique framework format. First, we begin by defining the risk blocks:
A—Error or fraud in the procedure due to complexity and overload;
B—Failure to detect errors or fraud due to lack of effective controls;
C—Technical problem in payroll data processing (hardware, software, interface, cyber).
We evaluated each of these risk events’ significance and effect, and as a result, we assigned probability values. Specifically, we evaluated A to be 0.25, B to be 0.3, and C as 0.15. Our probability assignments are educated evaluations based on the written report and might not be optimal. However, due to the topological structure of the risk and its division into sub-components, the model is very capable of dealing with varying values of these assigned probabilities.
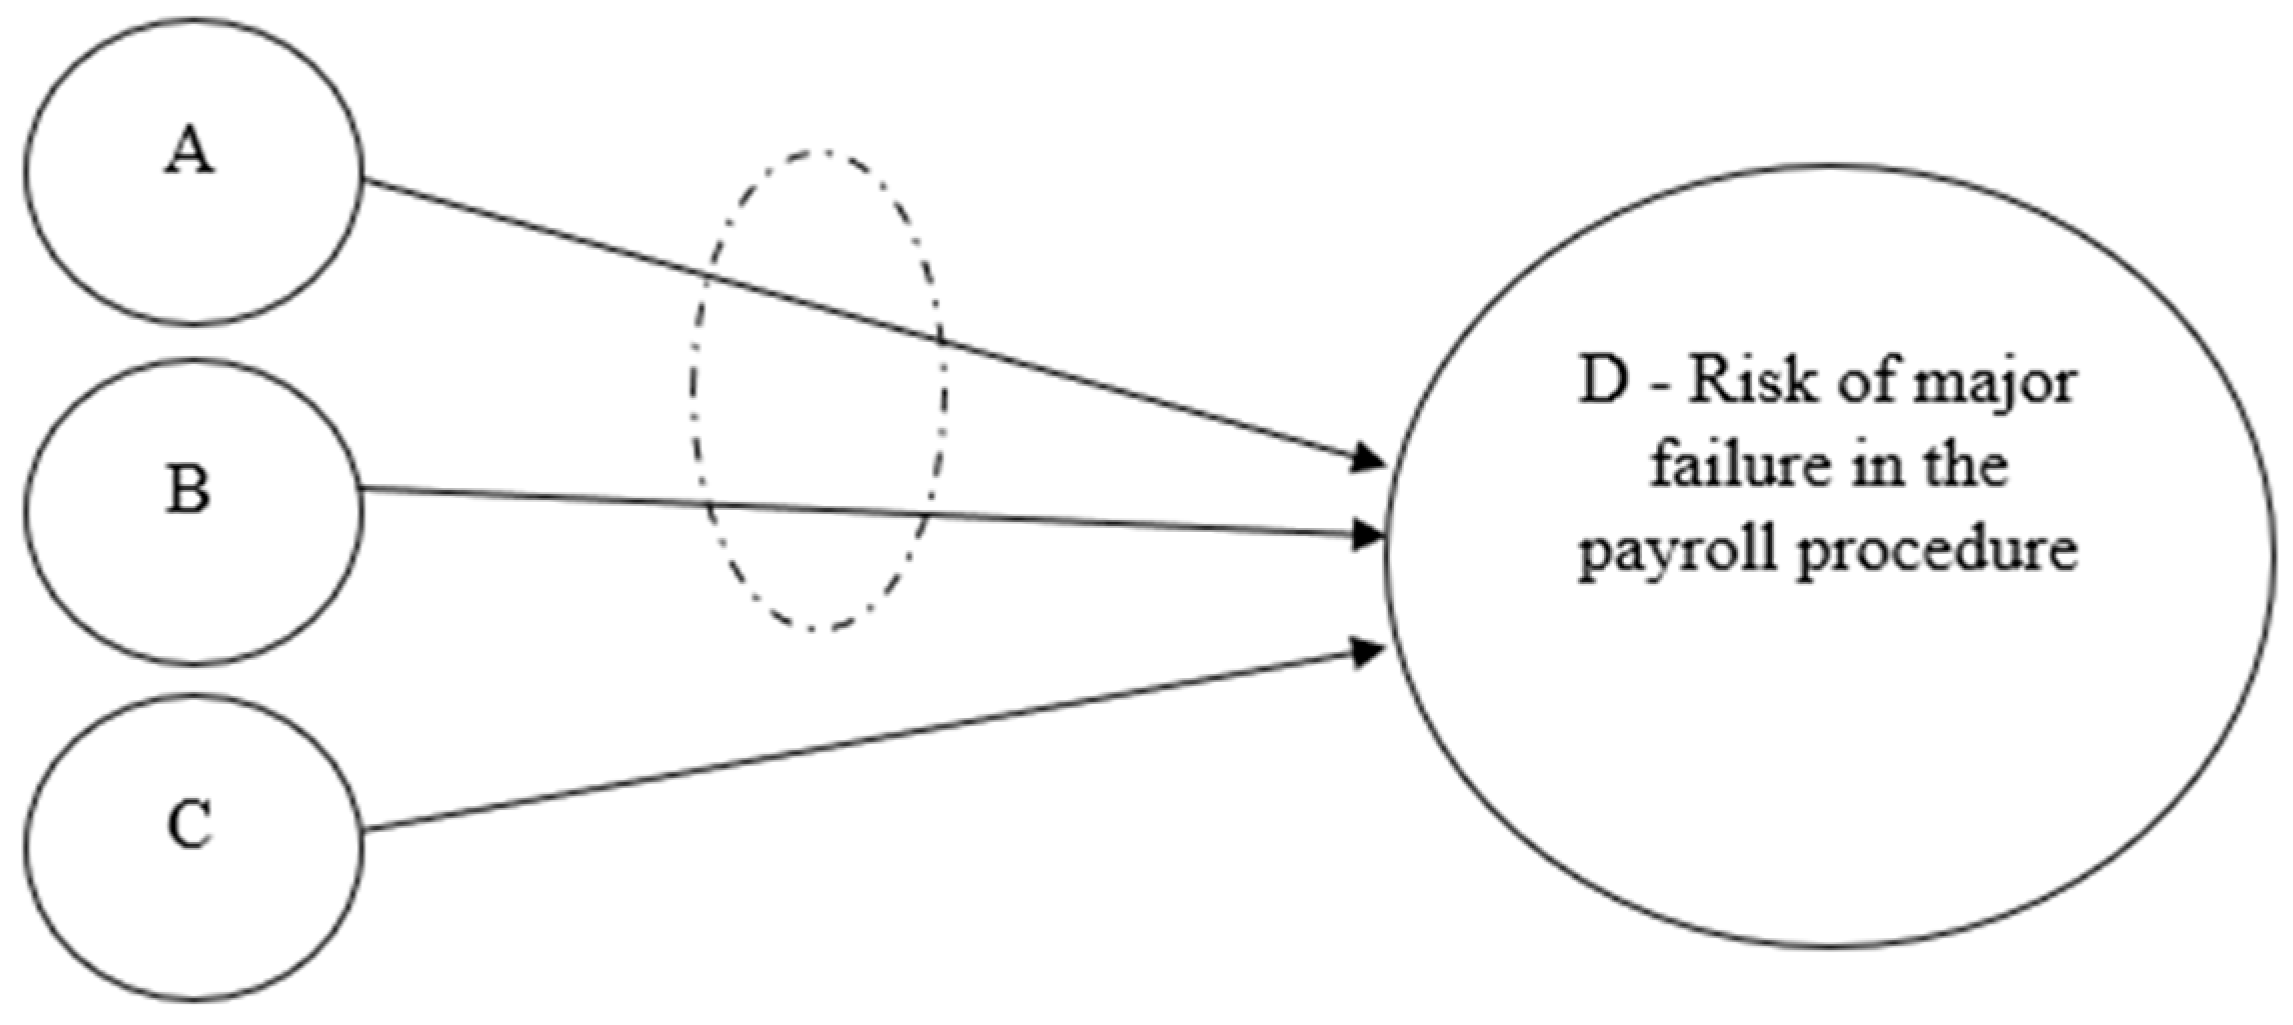
The next step in the model is to define the logical connections in the map. From our understanding, agent A and agent B should be treated as an AND connection; event C is independent of them, forming an OR relationship with the combined A and B events. In this case, we can draw the topology, as shown in
Figure 6.
To calculate the system’s risk occurrence and evaluate the risk assessment, we apply the established probabilistic rules based on the identified logical gates. For AND relationships between independent events, probabilities are multiplied. For OR relationships between independent events, the probability of occurrence is robustly calculated as one minus the product of the probabilities of their complements.
The composed risk of this layout is:
In this illustrative example, the computed risk probability is assessed to be 21.38%. This value is not negligible, yet it cannot be classified as a “high probability” as determined by the auditor using the traditional method. This more precise quantification positions the probability as medium at most. By applying the new framework, we can achieve a more objective and accurately quantified risk estimation compared to traditional approaches.
4.2. Illustrative Example 2-D
The second illustrative example deals with a small-sized investment bank. The bank’s headquarters has a 20-employee staff and manages 19 mutual funds with a total of 500 million US Dollars. The audit was conducted in 2023. The process under review is the information security and readiness for recovery and business continuity of the IT systems and the organization’s communication infrastructure. The auditor in the traditional assessment defined the probability of risk situation as very low (less than 10%). The narrative of risk situations in his context was: (a) “non-function of the system or module of the computer system,” (b) “inability to function as required, due to an emergency or disastrous event,” (c) “employees are not familiar with the IT backup and restoration procedures” and (d) “major unavailability of information from servers due to malfunction or cyber-attack.” At this point, we applied our model to assess the probability of risk occurrence in the state’s topology, as shown in
Figure 7.
This presentation of the risks map indicates that each agent is independent and that risk event E will be true and has a logical gate from all components. We must assess each agent’s probabilities and then calculate this system’s risk level.
0.90—this is based on our assessment that 0.1
0.95—this is based on our assessment that 0.05
0.90—this is based on our assessment that 0.1
0.95—this is based on our assessment that 0.05
0.269
It is important to note that the exact values of the different risk events might be quantified differently by different auditors. However, the process topology will increase the compound risk accuracy by considering the causal flow and connections between the isolated risk factors. Therefore, from the analysis, we concluded that the probability of major risk in the IT system or unavailability of required information for business continuity is 26.9%, more than twice the original auditor’s value, which was less than 10%. This illustrative example reflects the importance of assessing risk agents and understanding the mechanism or logical gates layout to achieve an objective evaluation.
5. Discussion
This paper introduces a novel methodology for operational risk assessment, designed to overcome the limitations inherent in traditional, subjective approaches, particularly within complex systems. Our proposed framework integrates concepts from risk management, system dynamics, uncertainty analysis, and graph theory to enhance clarity, reduce uncertainty, and improve the accuracy of risk predictions. By leveraging DAGs and logical gates, the model provides a structured and transparent approach to mapping causal relationships and risk pathways, effectively addressing challenges posed by non-linear interactions and feedback loops often overlooked in simpler models. This structured representation offers significant improvements over traditional subjective methods, particularly in enhancing accuracy and reducing biases in quantifying risk probabilities. The practical applicability of this framework is best demonstrated through the analysis of our illustrative examples.
Our illustrative examples revealed compelling discrepancies between traditional, qualitative risk assessments and the quantifiable outputs of our structured causal model. In illustrative Example 1 (Payroll Procedure), the model quantified the risk at 21.38%, while a human auditor qualitatively assessed the same scenario as “high risk”. This divergence suggests that the traditional qualitative method, by relying on an intuitive aggregation of factors, may lead to an oversimplified or even exaggerated perception of risk, particularly when dealing with complex logical relationships (e.g., AND/OR gates) that our model meticulously calculates. The auditor’s “high risk” assessment, lacking granular decomposition and explicit probabilistic rules, potentially conflated multiple contributing factors without precise weighting, leading to a broad, less actionable categorization.
Conversely, in illustrative example 2 (Information Security), our model yielded a risk value of 26.9%, which was significantly higher than the human auditor’s assessment of “less than 10%”. This highlights a different facet of subjective bias: the potential for underestimation of risk. In this scenario, the auditor’s broad judgment might have overlooked the cumulative impact of multiple independent failure points (an OR relationship), which, when probabilistically combined using the complement method, revealed a substantially higher likelihood of overall system crisis. This outcome underscores how a lack of structured probabilistic aggregation can mask the true compounded risk, leading to a false sense of security. These findings collectively illustrate that our proposed framework can produce risk evaluations that differ substantially from those derived from traditional methods, not merely in magnitude, but in revealing the underlying probabilistic realities. This emphasizes its potential to mitigate subjective biases and significantly improve assessment accuracy across different risk profiles.
A primary strength of this framework lies in its capacity to bridge the gap between subjective human judgments and objective, data-driven assessments. By providing a structured and analytical approach, the methodology minimizes the inherent subjectivity of traditional risk assessments, thereby reducing variability in risk scores assigned by human auditors. This increased transparency and repeatability of the assessment process are crucial for organizational consistency. The model’s ability to highlight discrepancies with traditional qualitative assessments provides concrete evidence of where subjective biases might otherwise lead to misallocation of resources or misguided mitigation efforts.
However, it is important to acknowledge certain limitations. While our framework significantly enhances the objectivity of the calculation and propagation of risk through its structured approach, the initial assignment of probabilities to individual risk agents (e.g., factors A, B, and C in Illustrative Example 1) still retains an element of subjective judgment. These initial probabilities are often derived from expert analysis of written reports or historical data, which can contain interpretation biases. Our method, therefore, acts as a semi-quantitative approach in its inputs, but delivers quantitatively rigorous outputs that are less susceptible to the cascading subjective errors found in purely qualitative or simplified quantitative methods. The lack of real-world outcome data in these illustrative examples (i.e., whether the payroll fraud actually occurred at 21.38% frequency, or the IT crisis at 26.9% frequency) means we cannot claim definitive “superiority” in predicting actual occurrences. Rather, our claim is one of providing a more precise, consistent, and transparent assessment method that reduces inter-auditor variability and reveals hidden probabilistic relationships.
This study contributes significantly to the field of operational risk management by offering a practical framework that directly addresses the challenges posed by system complexity and subjective human judgments. The proposed methodology has substantial implications for auditors and organizations seeking to enhance the accuracy, consistency, and reliability of their risk assessment processes. By promoting a structured and data-driven approach, the framework empowers organizations to move beyond intuitive judgments and embrace evidence-based decision-making. This, in turn, enhances organizational resilience and supports more effective risk mitigation strategies in the face of increasing system complexity and uncertainty. In essence, our framework provides a valuable tool for translating qualitative risk insights into a quantifiable, actionable format, allowing for more informed strategic and operational adjustments.
6. Conclusions
This study presents a novel framework for operational risk assessment that addresses the limitations of subjective evaluations by reducing variance in risk assessment outputs across auditors. The proposed methodology minimizes discrepancies between subjective auditor judgments and objective, data-driven risk evaluations by employing a logical typology and graphical representation of risk factors. The framework’s structured and analytical approach simplifies complex systems, enhances transparency, and ensures consistent evaluations regardless of the auditor’s background or expertise.
The primary contribution of this work lies in its ability to deconstruct complex risk scenarios into a logical typology of contributing factors, represented graphically using DAG. This approach improves the accuracy and reliability of risk assessments and facilitates better communication and collaboration among stakeholders. By reducing reliance on subjective judgments and incorporating data-driven analysis, the framework provides a robust foundation for decision-making in complex operational environments.
The proposed framework has significant practical implications for auditors and organizations seeking to improve their risk management processes. By promoting a structured, transparent, and data-driven approach, the framework empowers organizations to move beyond subjective judgments and embrace evidence-based decision-making. This, in turn, enhances organizational resilience and supports more effective risk mitigation strategies in the face of increasing system complexity and uncertainty.
While the proposed framework offers significant advancements, several avenues for future research remain to further enhance its applicability and effectiveness:
- (1)
Exploration of Risk Factor Interactions: Risk factors are rarely independent, and their weak and strong cross—effects can significantly impact risk probabilities and system stability. Future studies should investigate these interactions to improve predictive accuracy and reduce system volatility. For instance, applying the framework to industrial settings, such as production lines with complex interdependencies, could reveal latent connections and enable better control of individual risk factors.
- (2)
Mathematical Formalisms for Risk Analysis: Incorporating advanced mathematical tools, such as vector algebra, could enhance the representation and analysis of risk factors. These tools would provide a more rigorous framework for quantifying interdependencies and feedback loops, leading to more sophisticated and accurate risk-probability assessments.
- (3)
Mitigation of Subjectivity: Although the framework reduces subjectivity, the selection and weighting of risk factors and the interpretation of results remain influenced by human judgment. Future research could explore methods to further mitigate subjectivity, such as incorporating diverse expert inputs through Delphi methods or developing models that explicitly account for cognitive biases. These efforts would further enhance the objectivity and reliability of risk assessments.
- (4)
Application to Broader Contexts: Expanding the framework’s application to other domains, such as cybersecurity, supply chain management, or financial systems, could demonstrate its versatility and scalability. This would also provide opportunities to refine the methodology and validate its effectiveness across diverse operational environments.
In conclusion, this study contributes a practical and innovative framework to the field of operational risk management, offering a pathway to more accurate, consistent, and reliable risk assessments. Future research should build on these foundations to further refine the methodology, explore its broader applications, and address remaining challenges related to achieving objective risk assessment in complex and dynamic systems.


