
A Mixed-Integer Programming Framework for Drone Routing and Scheduling with Flexible Multiple Visits in Highway Traffic Monitoring


Abstract
1. Introduction
2. Drone-Based Traffic Monitoring: Insights from the Literature
2.1. Monitoring Applications of Drones in Traffic Systems
2.2. Routing and Scheduling Models for Drone-Based Surveillance
3. Problem Formulation and Model Development
3.1. Problem Description and Key Assumptions
3.2. Mathematical Formulation: Nonlinear Model
3.3. Linearization of the Model
4. Computational Experiments and Performance Evaluation
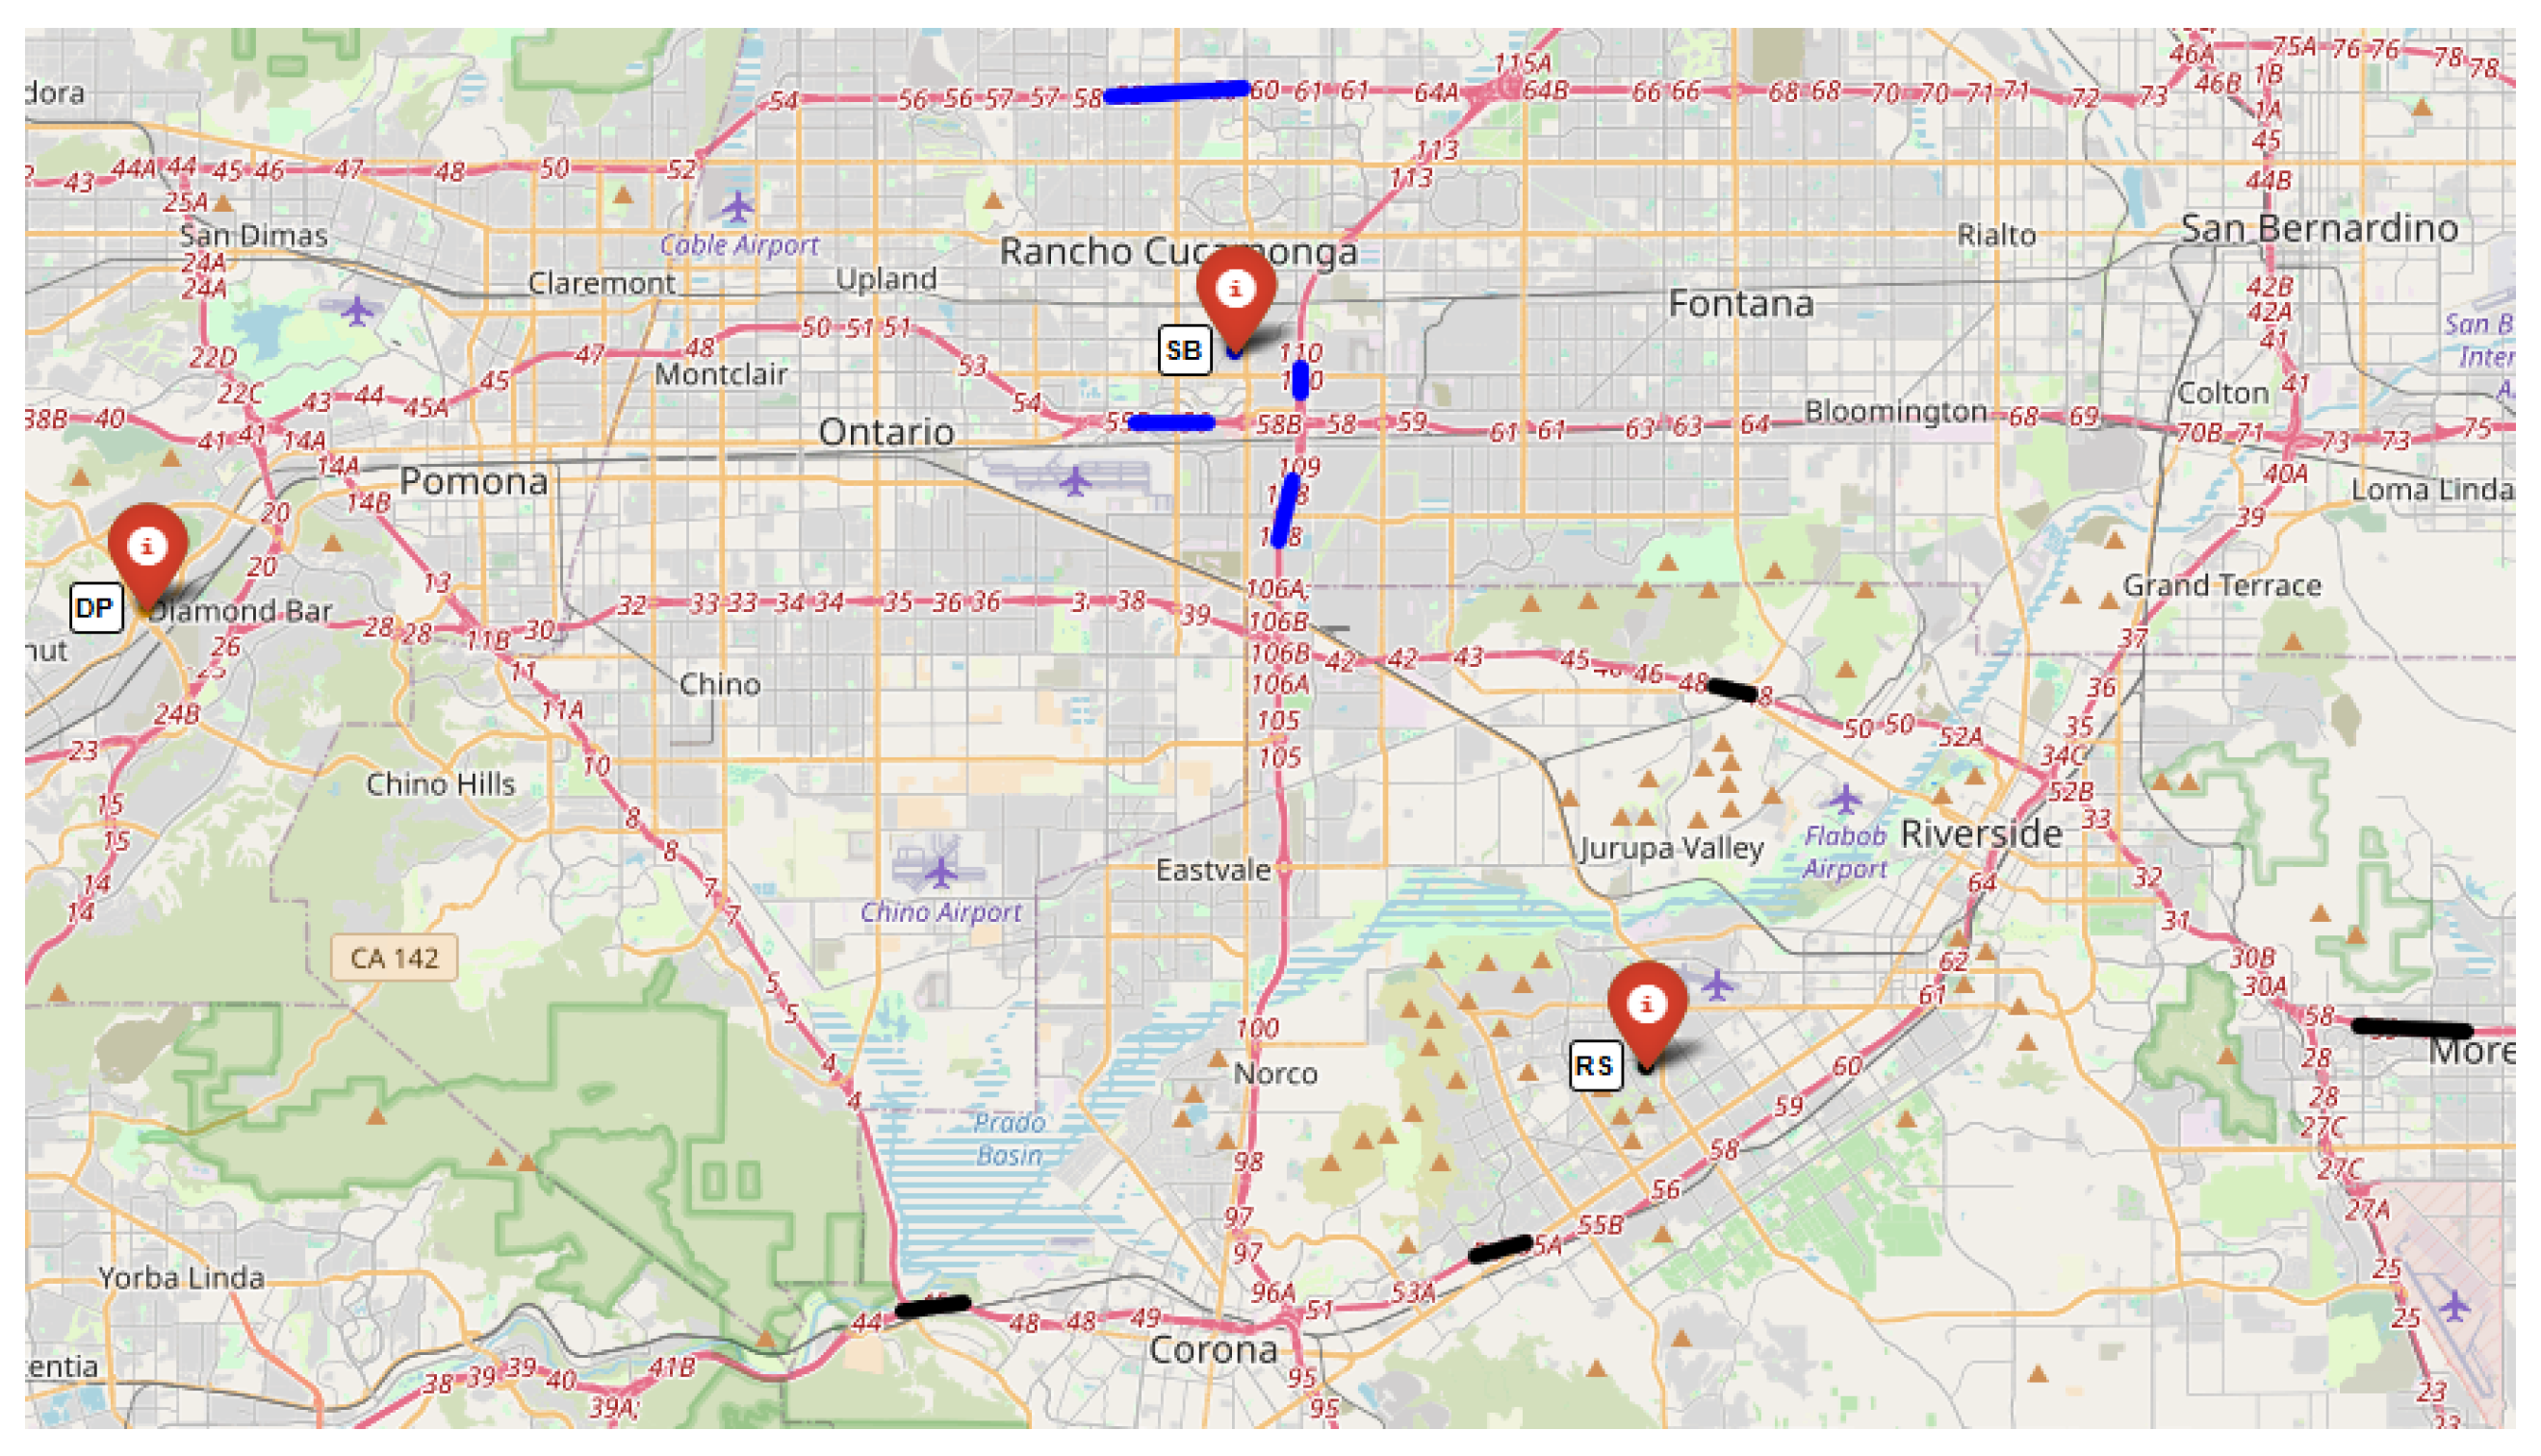
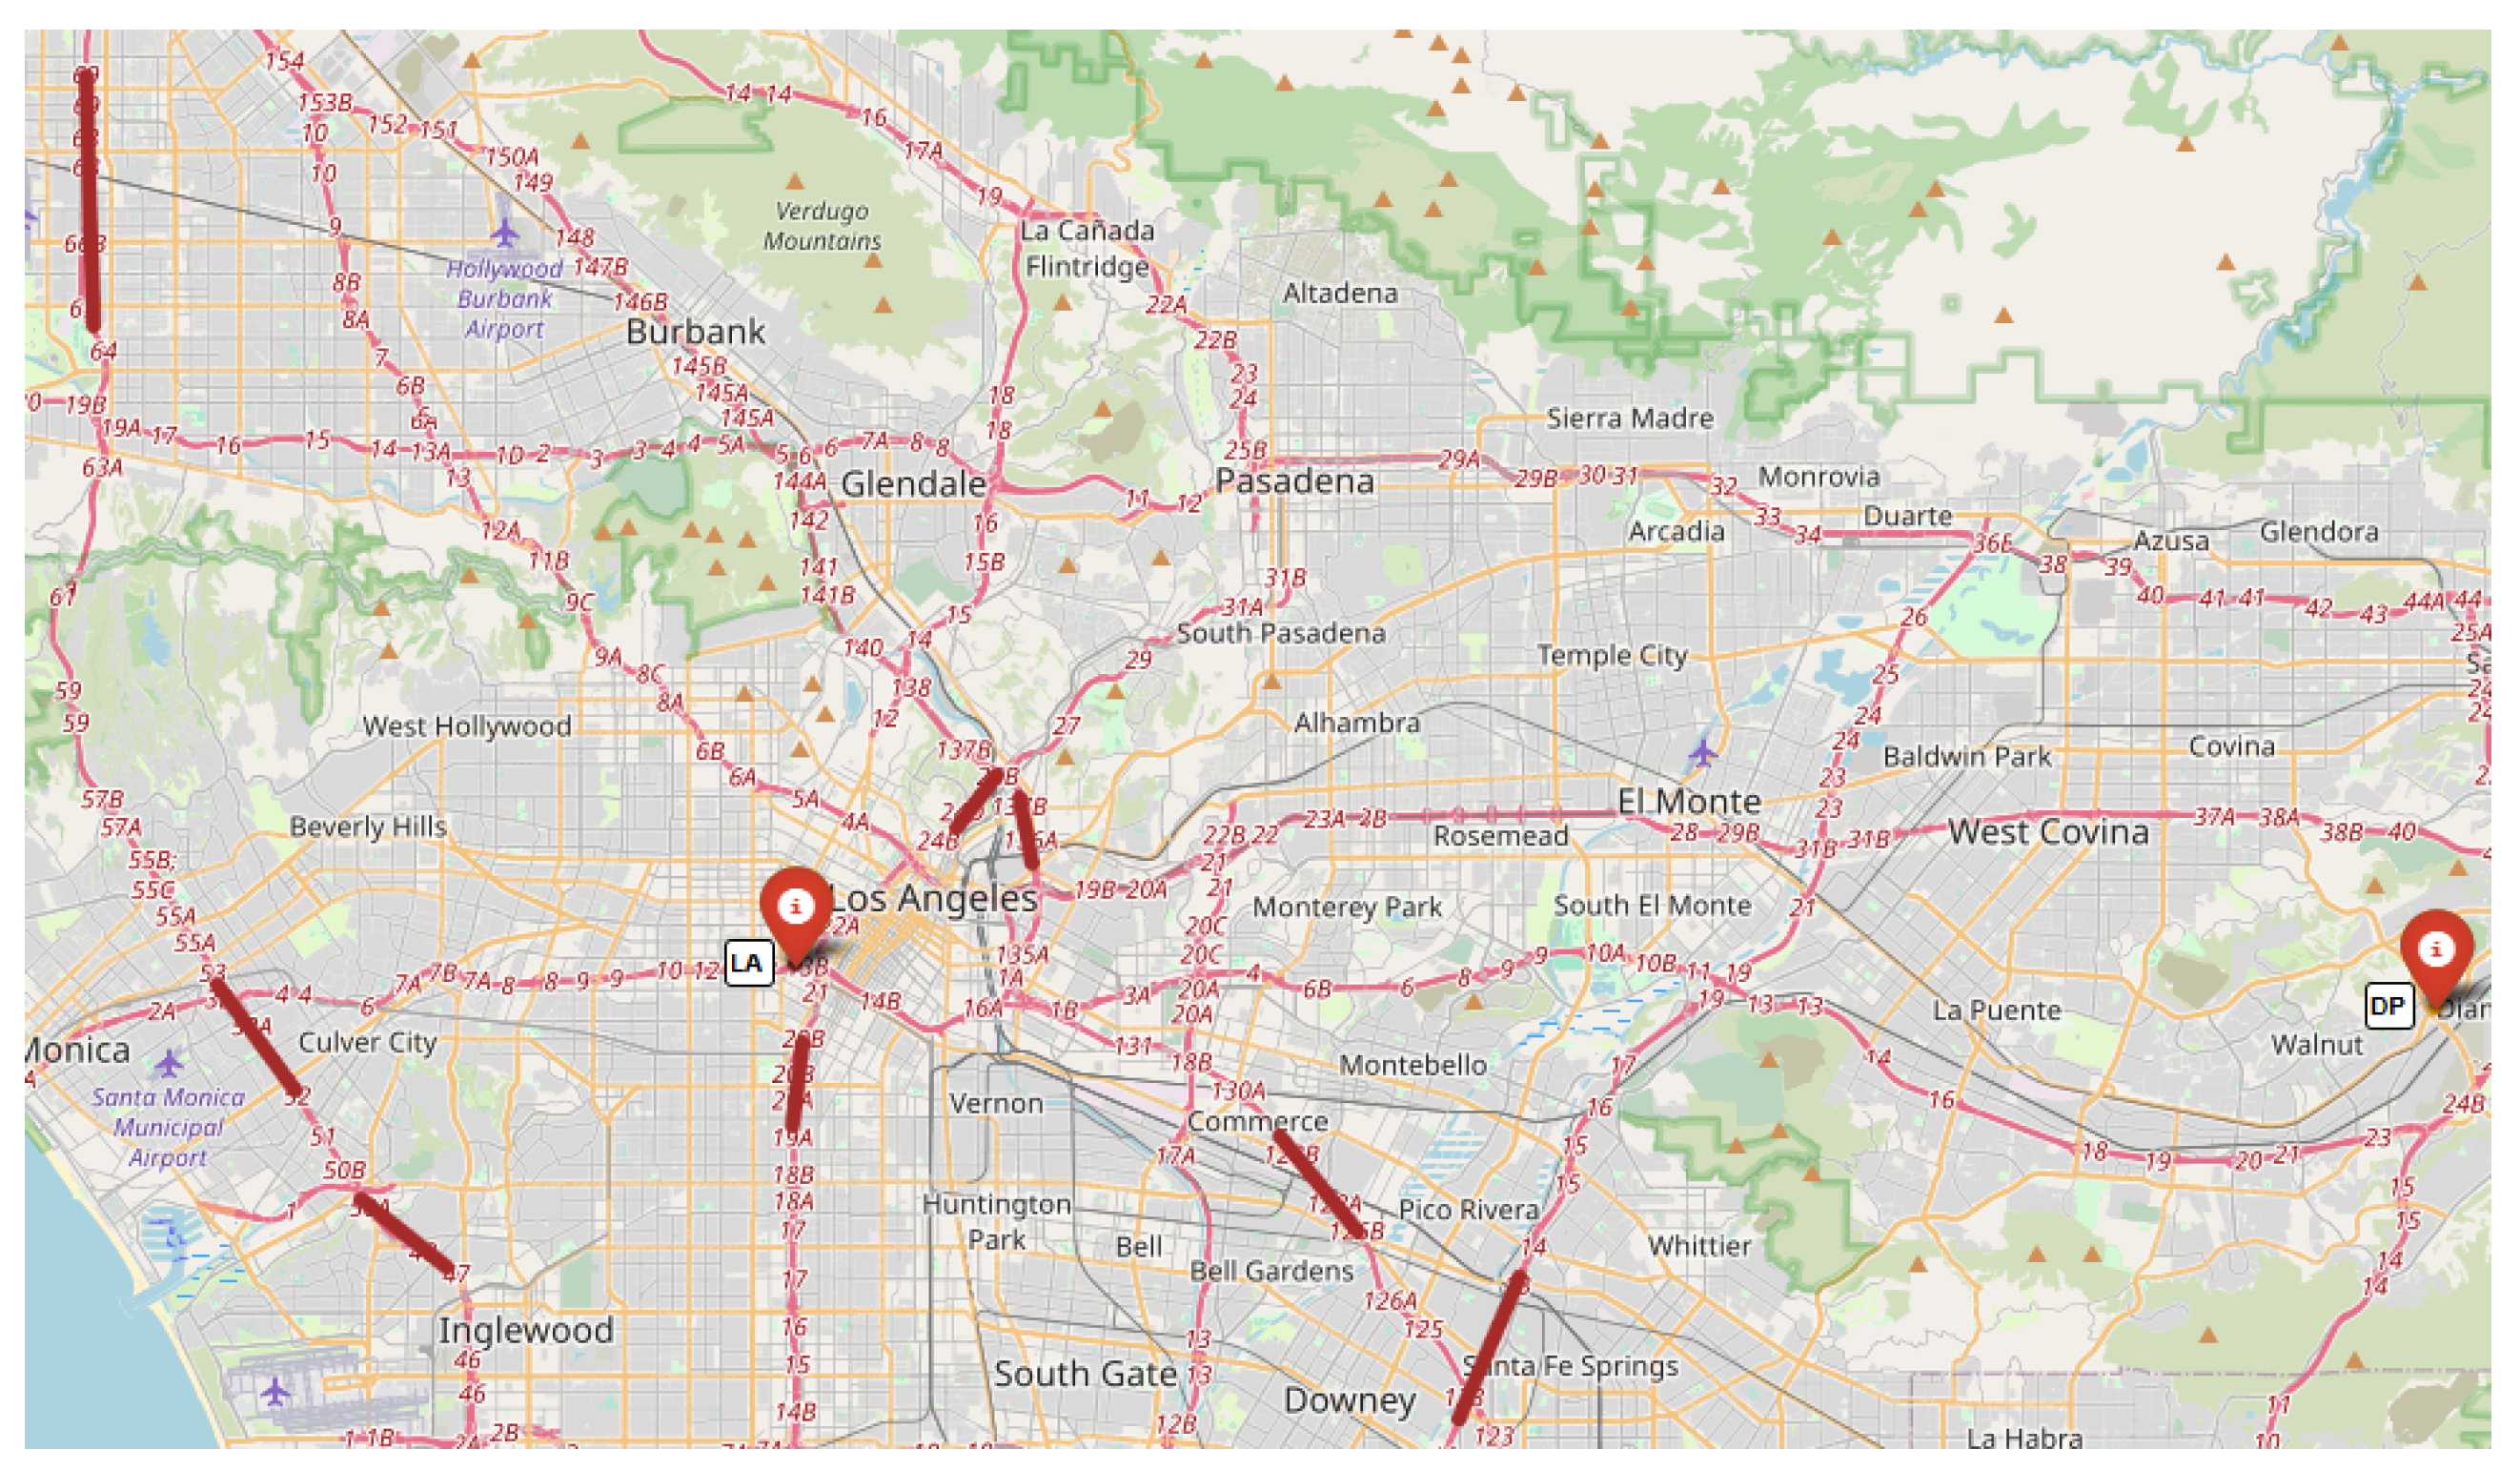
4.1. Case Study and Experimental Setup
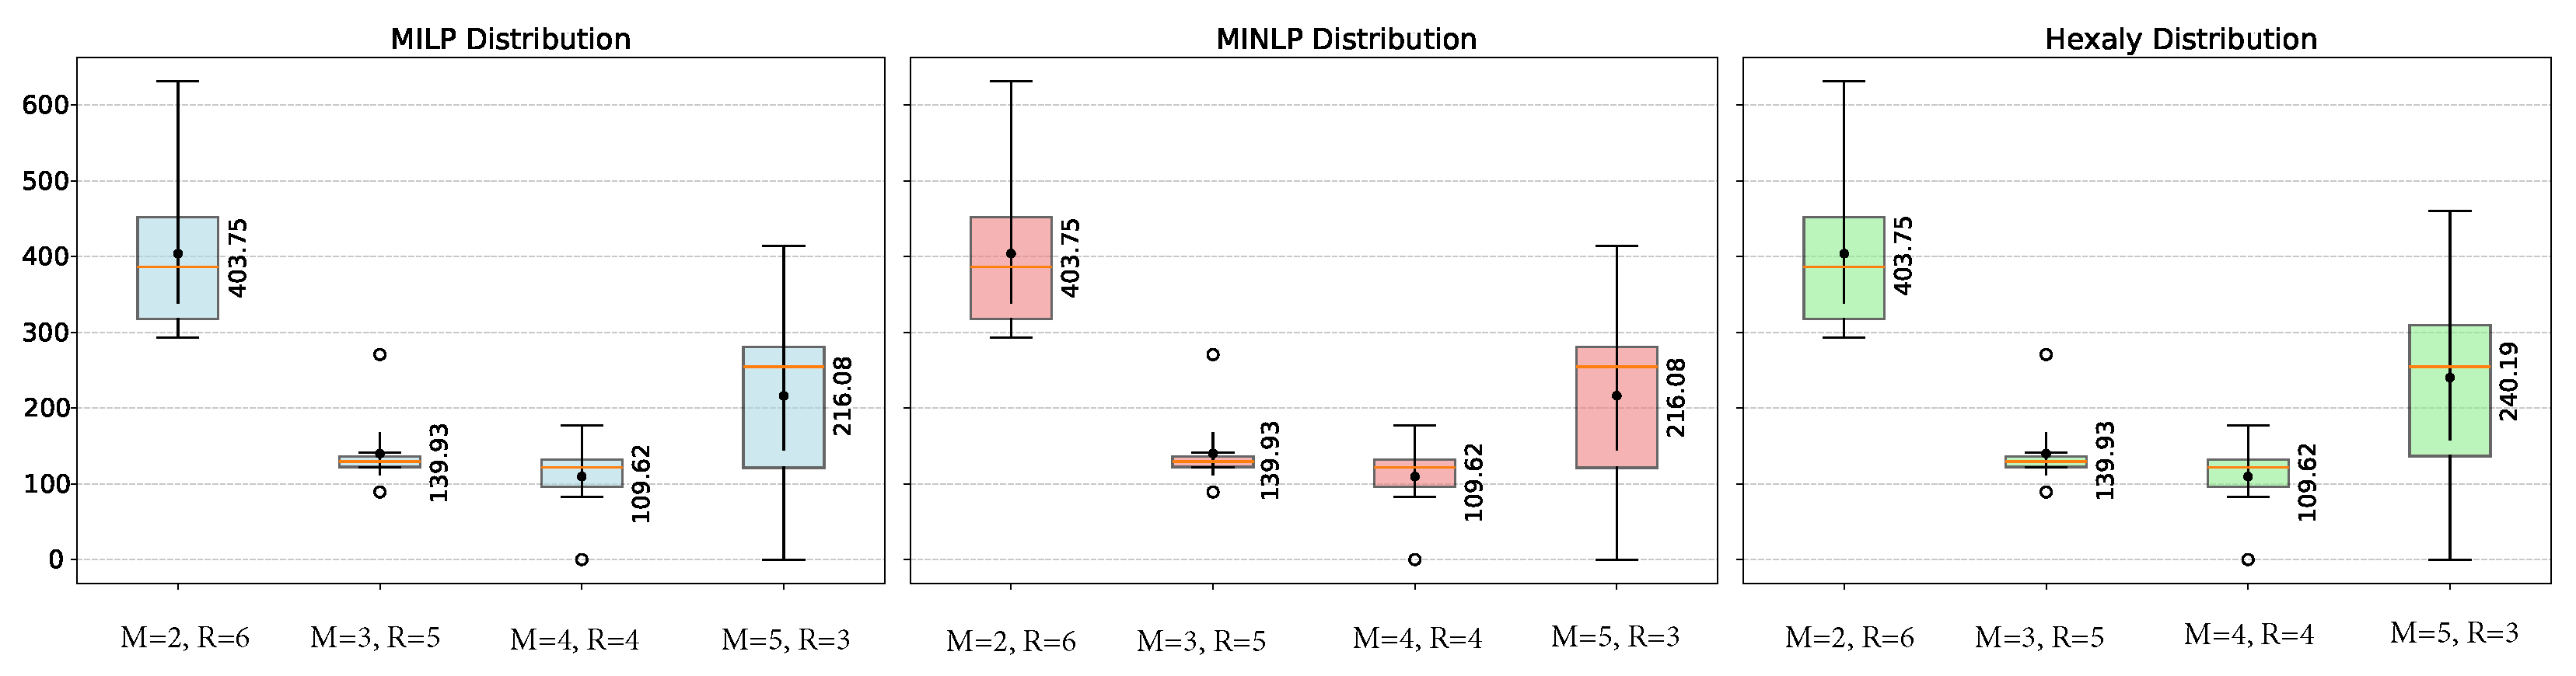
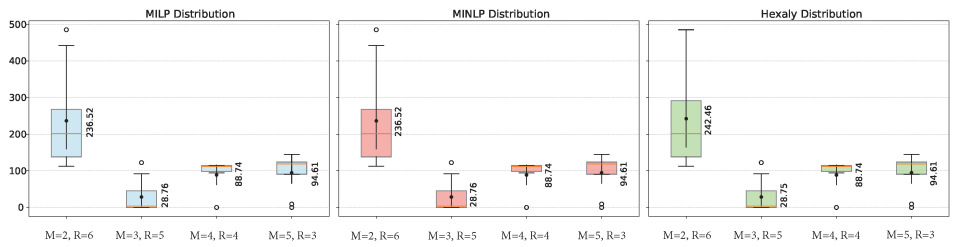
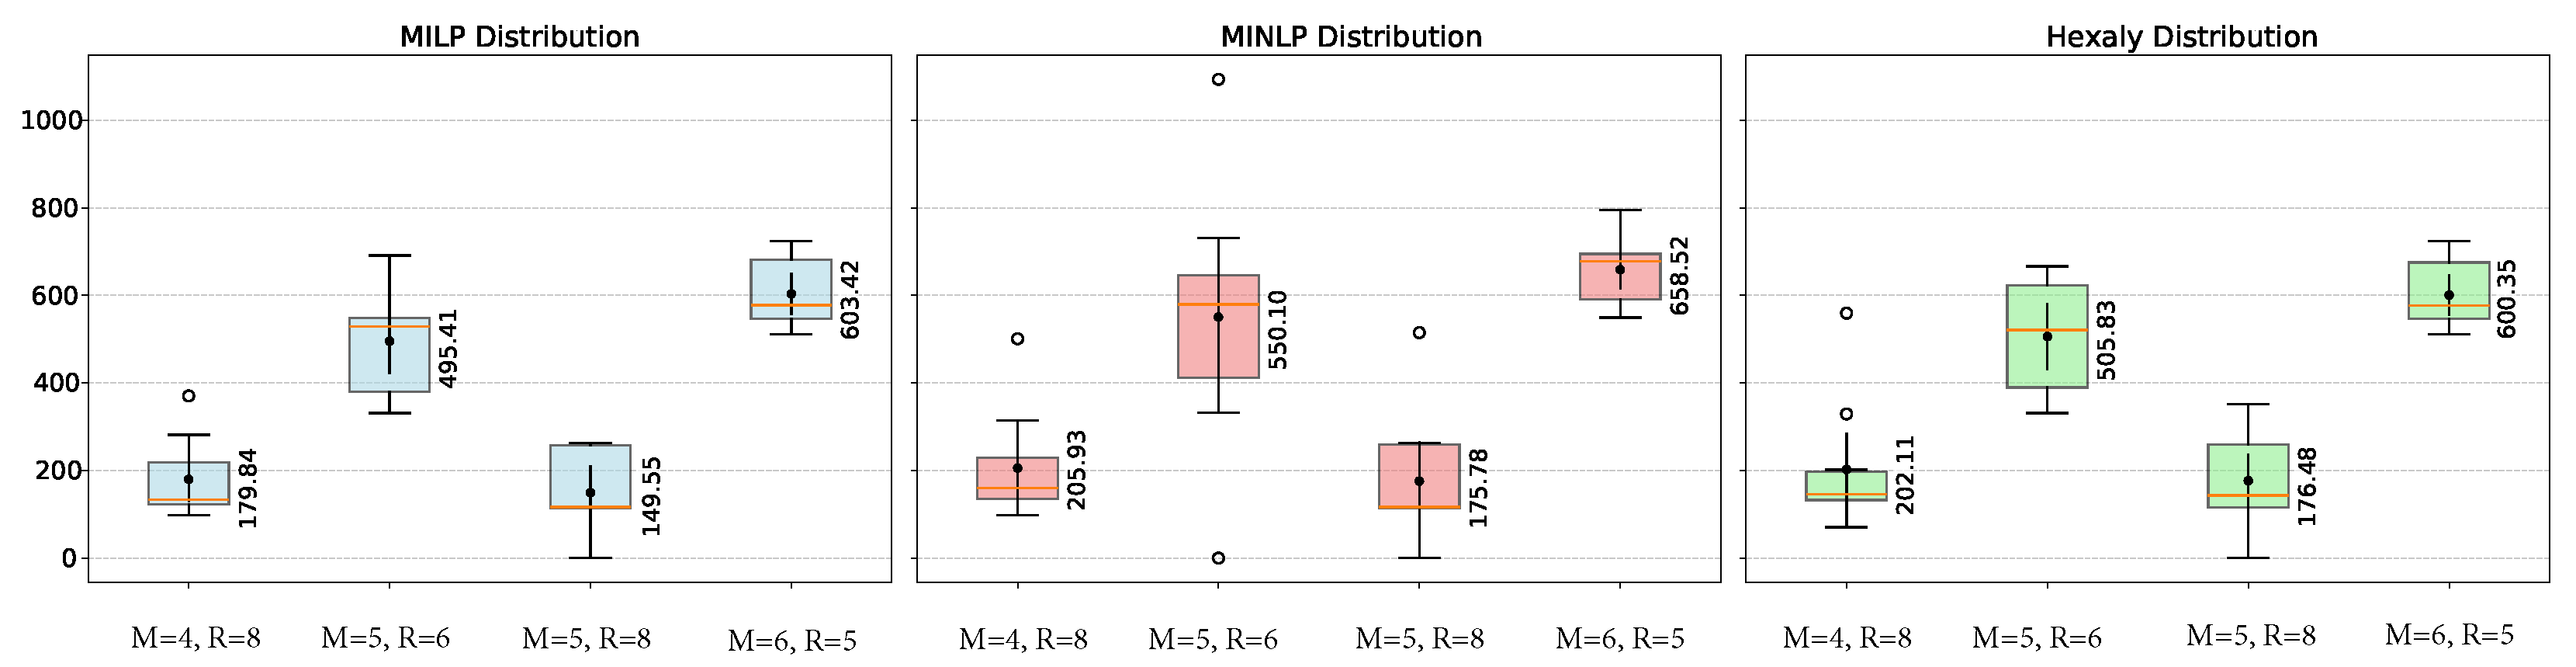
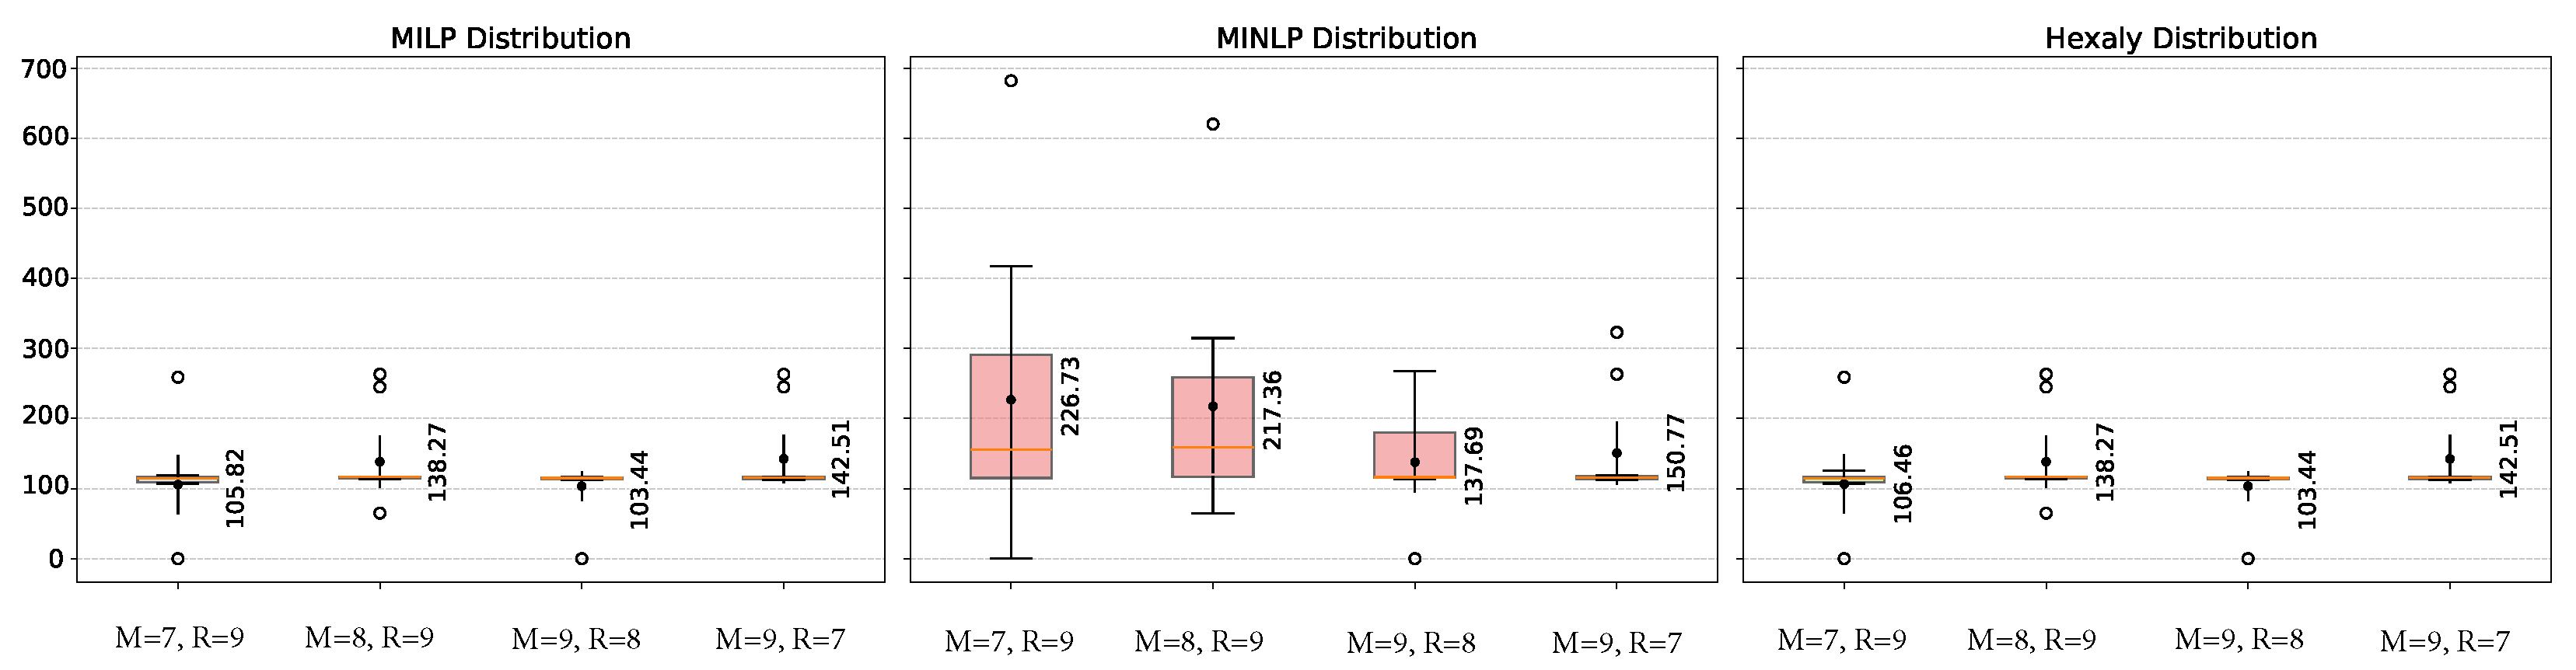
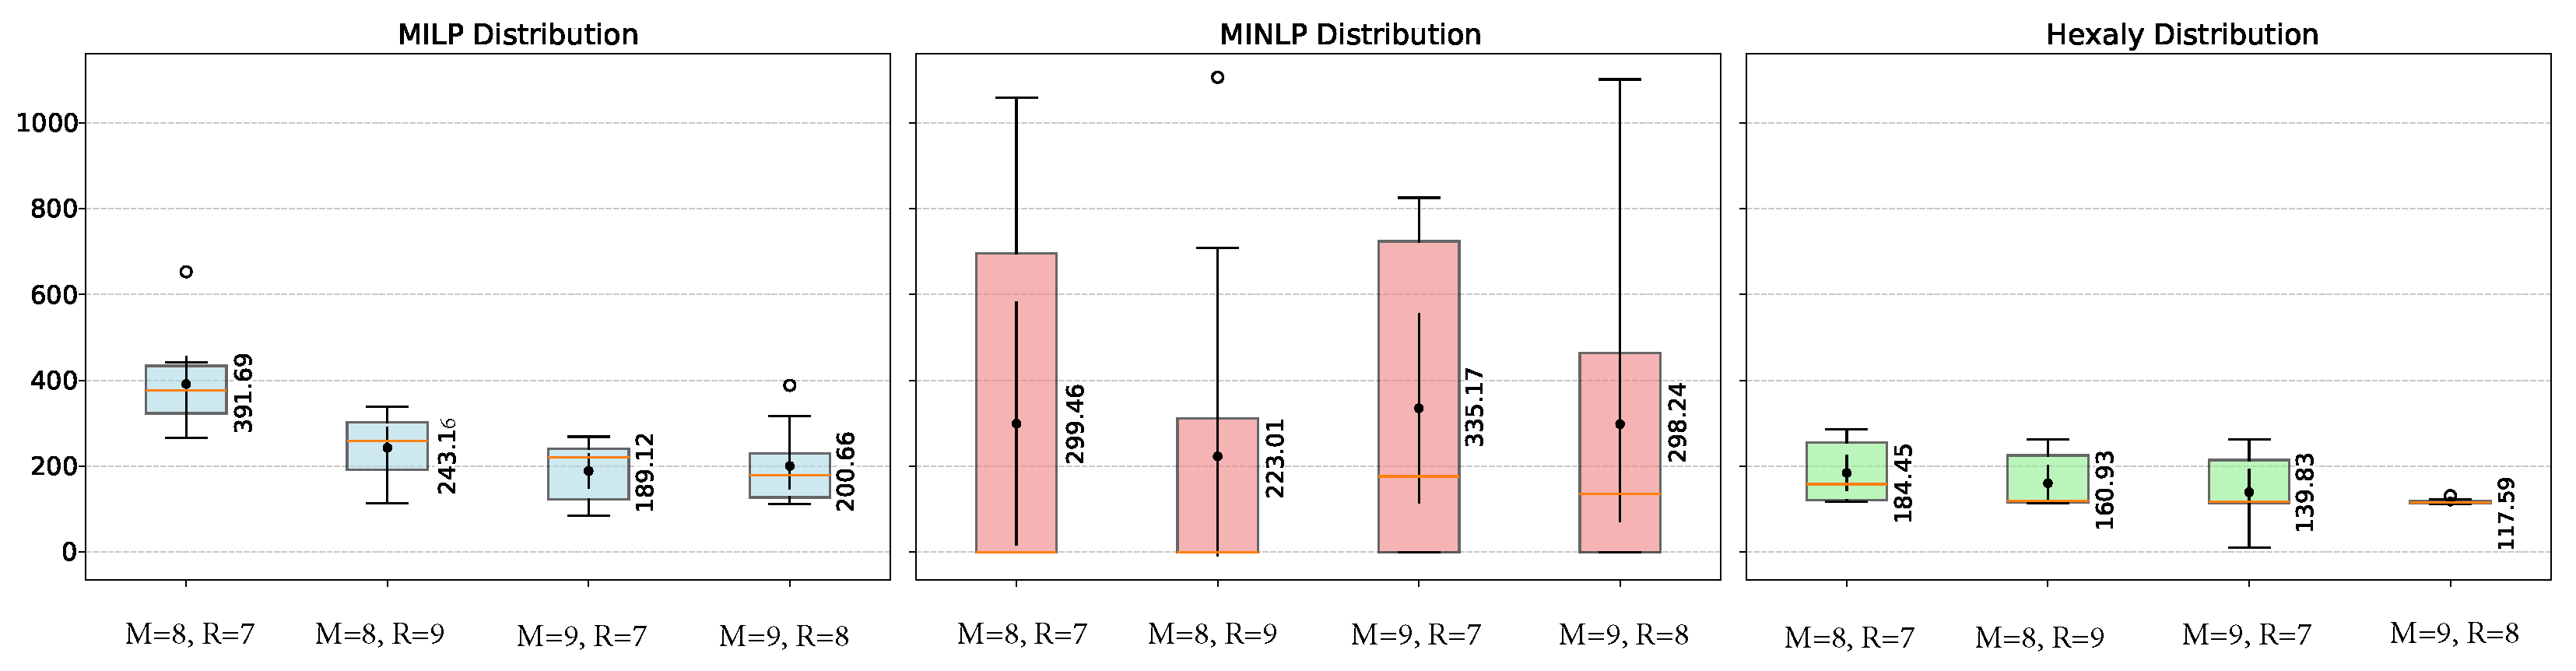
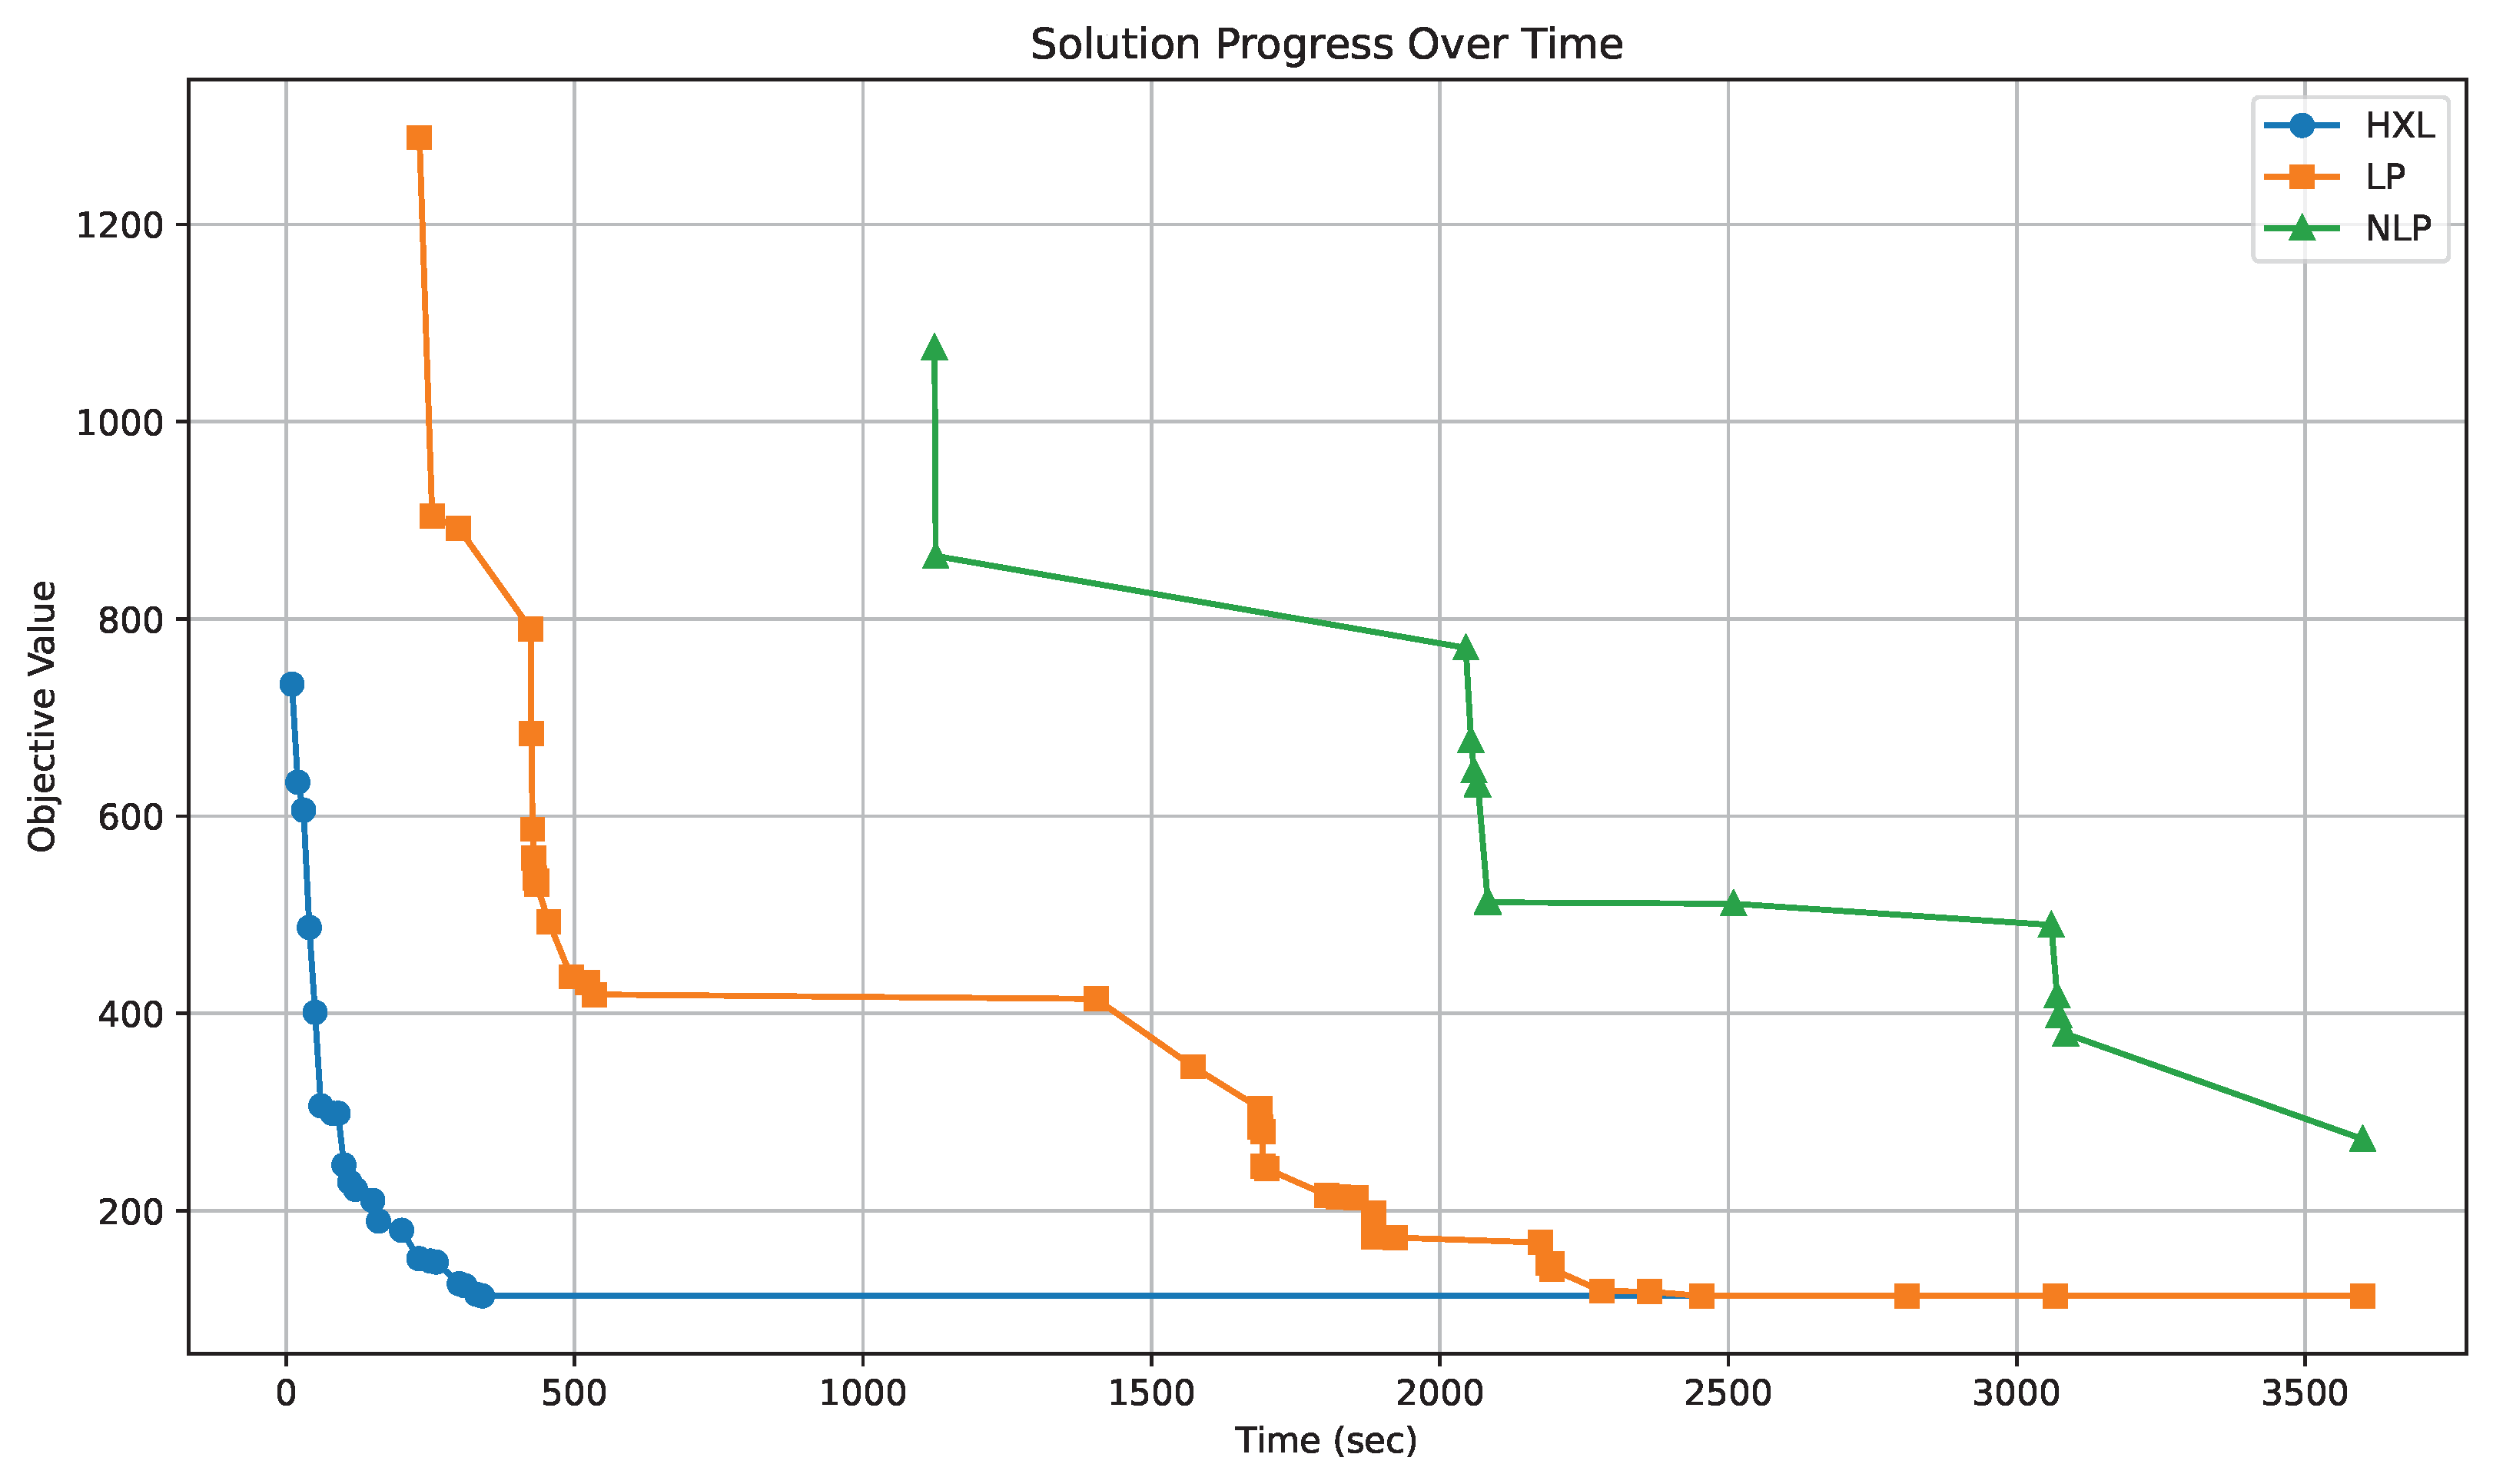
4.2. Results and Comparative Analysis
5. Conclusions
Author Contributions
Funding
Data Availability Statement
Acknowledgments
Conflicts of Interest
References
- National Highway Traffic Safety Administration. Overview of Motor Vehicle Traffic Crashes in 2022. 2024. Available online: https://rosap.ntl.bts.gov/view/dot/78044 (accessed on 20 May 2025).
- Abdelkader, G.; Elgazzar, K.; Khamis, A. Connected vehicles: Technology review, state of the art, challenges and opportunities. Sensors 2021, 21, 7712. [Google Scholar] [CrossRef] [PubMed]
- Office of the City Controller, City of Los Angeles. Audit of the Los Angeles Police Department’s Air Support Division in 2023. Available online: https://controller.lacity.gov/landings/lapd-helicopters (accessed on 5 July 2025).
- Public Policy Institute of California. Law Enforcement Staffing in California. PPIC Fact Sheet, February 2025. Available online: https://www.ppic.org/publication/law-enforcement-staffing-in-california/ (accessed on 25 June 2025).
- Wu, X.; Lum, C.; Koper, C. Do everyday proactive policing activities reduce vehicle crashes? examining a commonly held law enforcement belief using a novel method. J. Crim. Justice 2021, 76, 101846. [Google Scholar] [CrossRef]
- U.S. Department of Transportation, Federal Highway Administration. Common Issues in Emergency Transportation Operations Preparedness and Response: Results of the FHWA Workshop Series FHWA Office of Operations. Available online: https://rosap.ntl.bts.gov/view/dot/20659 (accessed on 4 May 2025).
- Mohabbati-Kalejahi, N.; Vinel, A. Robust hazardous materials closed-loop supply chain network design with emergency response teams location. Transp. Res. Rec. 2021, 2675, 306–329. [Google Scholar] [CrossRef]
- Coifman, B.; McCord, M.; Mishalani, R.G.; Iswalt, M.; Ji, Y. Roadway traffic monitoring from an unmanned aerial vehicle. IEE Proc.—Intell. Transp. Syst. 2006, 153, 11–20. [Google Scholar] [CrossRef]
- McCormack, E.D. The Use of Small Unmanned Aircraft by the Washington State Department of Transportation; Technical Report WA-RD 703.1; Washington State Dept. of Transportation: Olympia, WA, USA, 2008.
- Zhang, X.; Guan, Z.; Liu, X.; Zhang, Z. Digital reconstruction method for low-illumination road traffic accident scenes using uav and auxiliary equipment. World Electr. Veh. J. 2025, 16, 171. [Google Scholar] [CrossRef]
- Malveaux, C.; de Queiroz, M.; Li, X.; Hassan, H.; He, Z. Real-Time Work Zone Traffic Management via Unmanned Air Vehicles; Technical Report; Louisiana State University Transportation Research Center: Baton Rouge, LA, USA, 2020. [Google Scholar]
- Askarzadeh, T.; Bridgelall, R.; Tolliver, D. Drones for road condition monitoring: Applications and benefits. J. Transp. Eng. Part B Pavements 2023, 151, 04024055. [Google Scholar] [CrossRef]
- Roldán, J.J.; Joossen, G.; Sanz, D.; del Cerro, J.; Barrientos, A. Mini-uav based sensory system for measuring environmental variables in greenhouses. Sensors 2015, 15, 3334–3350. [Google Scholar] [CrossRef]
- Villa, T.F.; Salimi, F.; Morton, K.; Morawska, L.; Gonzalez, F. Development and validation of a uav based system for air pollution measurements. Sensors 2016, 16, 2202. [Google Scholar] [CrossRef]
- Pasha, J.; Elmi, Z.; Purkayastha, S.; Fathollahi-Fard, A.M.; Ge, Y.-E.; Lau, Y.-Y.; Dulebenets, M.A. The drone scheduling problem: A systematic state-of-the-art review. IEEE Trans. Intell. Transp. Syst. 2022, 23, 14224–14247. [Google Scholar] [CrossRef]
- Glock, K.; Meyer, A. Mission planning for emergency rapid mapping with drones. Transp. Sci. 2020, 54, 534–560. [Google Scholar] [CrossRef]
- Akram, T.; Awais, M.; Naqvi, R.; Ahmed, A.; Naeem, M. Multicriteria uav base stations placement for disaster management. IEEE Syst. J. 2020, 14, 3475–3482. [Google Scholar] [CrossRef]
- Banik, D.; Hossain, N.U.I.; Govindan, K.; Nur, F.; Babski-Reeves, K. A decision support model for selecting unmanned aerial vehicle for medical supplies: Context of covid-19 pandemic. Int. J. Logist. Manag. 2023, 34, 473–496. [Google Scholar] [CrossRef]
- Huang, H.; Savkin, A.V.; Huang, C. Scheduling of a parcel delivery system consisting of an aerial drone interacting with public transportation vehicles. Sensors 2020, 20, 2045. [Google Scholar] [CrossRef]
- Shi, Y.; Lin, Y.; Li, B.; Li, R.Y.M. A bi-objective optimization model for the medical supplies’ simultaneous pickup and delivery with drones. Comput. Ind. Eng. 2022, 171, 108389. [Google Scholar] [CrossRef]
- Cheema, M.A.; Ansari, R.I.; Ashraf, N.; Hassan, S.A.; Qureshi, H.K.; Bashir, A.K.; Politis, C. Blockchain-based secure delivery of medical supplies using drones. Comput. Netw. 2022, 204, 108706. [Google Scholar] [CrossRef]
- Li, M.; Zhen, L.; Wang, S.; Lv, W.; Qu, X. Unmanned aerial vehicle scheduling problem for traffic monitoring. Comput. Ind. Eng. 2018, 122, 15–23. [Google Scholar] [CrossRef]
- Khan, M.A.; Ectors, W.; Bellemans, T.; Janssens, D.; Wets, G. Uav-based traffic analysis: A universal guiding framework based on literature survey. Transp. Res. Procedia 2017, 22, 541–550. [Google Scholar] [CrossRef]
- Elloumi, M.; Dhaou, R.; Escrig, B.; Idoudi, H.; Saidane, L.A. Monitoring road traffic with a uav-based system. In Proceedings of the 2018 IEEE Wireless Communications and Networking Conference (WCNC), Barcelona, Spain, 15–18 April 2018; IEEE: Piscataway, NJ, USA, 2018; pp. 1–6. [Google Scholar]
- Barmpounakis, E.; Geroliminis, N. On the new era of urban traffic monitoring with massive drone data: The pneuma large-scale field experiment. Transp. Res. Part C Emerg. Technol. 2020, 111, 50–71. [Google Scholar] [CrossRef]
- Outay, F.; Mengash, H.A.; Adnan, M. Applications of unmanned aerial vehicle (uav) in road safety, traffic and highway infrastructure management: Recent advances and challenges. Transp. Res. Part A Policy Pract. 2020, 141, 116–129. [Google Scholar] [CrossRef]
- Khan, N.A.; Jhanjhi, N.Z.; Brohi, S.N.; Usmani, R.S.A.; Nayyar, A. Smart traffic monitoring system using unmanned aerial vehicles (uavs). Comput. Commun. 2020, 157, 434–443. [Google Scholar] [CrossRef]
- Ahmed, A.; Outay, F.; Zaidi, S.O.R.; Adnan, M.; Ngoduy, D. Examining queue-jumping phenomenon in heterogeneous traffic stream at signalized intersection using uav-based data. Pers. Ubiquitous Comput. 2021, 25, 93–108. [Google Scholar] [CrossRef]
- Beg, A.; Qureshi, A.R.; Sheltami, T.; Yasar, A. Uav-enabled intelligent traffic policing and emergency response handling system for the smart city. Pers. Ubiquitous Comput. 2021, 25, 33–50. [Google Scholar] [CrossRef]
- Kumar, A.; Yadav, A.S.; Gill, S.S.; Pervaiz, H.; Ni, Q.; Buyya, R. A secure drone-to-drone communication and software defined drone network-enabled traffic monitoring system. Simul. Model. Pract. Theory 2022, 120, 102621. [Google Scholar] [CrossRef]
- Kainz, O.; Dopiriak, M.; Michalko, M.; Jakab, F.; Nováková, I. Traffic monitoring from the perspective of an unmanned aerial vehicle. Appl. Sci. 2022, 12, 7966. [Google Scholar] [CrossRef]
- Butilă, E.V.; Boboc, R.G. Urban traffic monitoring and analysis using unmanned aerial vehicles (uavs): A systematic literature review. Remote Sens. 2022, 14, 620. [Google Scholar] [CrossRef]
- Bisio, I.; Garibotto, C.; Haleem, H.; Lavagetto, F.; Sciarrone, A. A systematic review of drone based road traffic monitoring system. IEEE Access 2022, 10, 101537–101555. [Google Scholar] [CrossRef]
- Fan, M.; Wu, Y.; Liao, T.; Cao, Z.; Guo, H.; Sartoretti, G.; Wu, G. Deep reinforcement learning for uav routing in the presence of multiple charging stations. IEEE Trans. Veh. Technol. 2022, 72, 5732–5746. [Google Scholar] [CrossRef]
- Chow, J.Y.J. Dynamic uav-based traffic monitoring under uncertainty as a stochastic arc-inventory routing policy. Int. J. Transp. Sci. Technol. 2016, 5, 167–185. [Google Scholar] [CrossRef]
- Luo, Z.; Liu, Z.; Shi, J. A two-echelon cooperated routing problem for a ground vehicle and its carried unmanned aerial vehicle. Sensors 2017, 17, 1144. [Google Scholar] [CrossRef]
- Hu, M.; Liu, W.; Peng, K.; Ma, X.; Cheng, W.; Liu, J. Joint routing and scheduling for vehicle-assisted multidrone surveillance. IEEE Internet Things J. 2018, 6, 1781–1790. [Google Scholar] [CrossRef]
- Luo, H.; Zhang, P.; Wang, J.; Wang, G.; Meng, F. Traffic patrolling routing problem with drones in an urban road system. Sensors 2019, 19, 5164. [Google Scholar] [CrossRef]
- Xu, B.; Zhao, K.; Luo, Q.; Wu, G.; Pedrycz, W. A gv-drone arc routing approach for urban traffic patrol by coordinating a ground vehicle and multiple drones. Swarm Evol. Comput. 2023, 77, 101246. [Google Scholar] [CrossRef]
- Zhang, J.; Jia, L.; Niu, S.; Zhang, F.; Tong, L.; Zhou, X. A space-time network-based modeling framework for dynamic unmanned aerial vehicle routing in traffic incident monitoring applications. Sensors 2015, 15, 13874–13898. [Google Scholar] [CrossRef]
- Ghazzai, H.; Kadri, A.; Ghorbel, B.; Menouar, H.; Massoud, Y. A generic spatiotemporal uav scheduling framework for multi-event applications. IEEE Access 2018, 7, 215–229. [Google Scholar] [CrossRef]
- Ghazzai, H.; Menouar, H.; Kadri, A.; Massoud, Y. Future uav-based its: A comprehensive scheduling framework. IEEE Access 2019, 7, 75678–75695. [Google Scholar] [CrossRef]
- Christodoulou, C.; Kolios, P. Optimized tour planning for drone-based urban traffic monitoring. In Proceedings of the 2020 IEEE 91st Vehicular Technology Conference (VTC2020-Spring), Antwerp, Belgium, 25–28 May 2020; IEEE: Piscataway, NJ, USA, 2020; pp. 1–5. [Google Scholar]
- Kumar, A.; Krishnamurthi, R.; Nayyar, A.; Luhach, A.K.; Khan, M.S.; Singh, A. A novel software-defined drone network (sddn)-based collision avoidance strategies for on-road traffic monitoring and management. Veh. Commun. 2021, 28, 100313. [Google Scholar] [CrossRef]
- Rigas, E.S.; Kolios, P.; Mavrovouniotis, M.; Ellinas, G. Scheduling a fleet of drones for monitoring missions with spatial, temporal, and energy constraints. IEEE Trans. Intell. Transp. Syst. 2021, 23, 15133–15145. [Google Scholar] [CrossRef]
- Yakıcı, E. Solving location and routing problem for uavs. Comput. Ind. Eng. 2016, 102, 294–301. [Google Scholar] [CrossRef]
- Terzi, M.; Kolios, P.; Panayiotou, C.; Theocharides, T. A unified framework for reliable multi-drone tasking in emergency response missions. In Proceedings of the 2019 International Conference on Unmanned Aircraft Systems (ICUAS), Atlanta, GA, USA, 11–14 June 2019; IEEE: Piscataway, NJ, USA, 2019; pp. 819–827. [Google Scholar]
- Oh, H.; Kim, S.; Tsourdos, A.; White, B.A. Coordinated road-network search route planning by a team of uavs. Int. J. Syst. Sci. 2014, 45, 825–840. [Google Scholar] [CrossRef]
- Campbell, J.F.; Corberán, Á.; Plana, I.; Sanchis, J.M.; Segura, P. Solving the length constrained k-drones rural postman problem. Eur. J. Oper. Res. 2021, 292, 60–72. [Google Scholar] [CrossRef]
- Wang, K.; Wu, Q.; He, X.; Hu, C.; Chen, N. Optimizing uav traffic monitoring routes during rush hours considering spatiotemporal variation of monitoring demand. Int. J. Geogr. Inf. Sci. 2022, 36, 2086–2111. [Google Scholar] [CrossRef]
- Cheng, L.; Zhong, L.; Tian, S.; Xing, J. Task assignment algorithm for road patrol by multiple uavs with multiple bases and rechargeable endurance. IEEE Access 2019, 7, 144381–144397. [Google Scholar] [CrossRef]
- Huang, H.; Savkin, A.V.; Huang, C. Decentralized autonomous navigation of a uav network for road traffic monitoring. IEEE Trans. Aerosp. Electron. Syst. 2021, 57, 2558–2564. [Google Scholar] [CrossRef]
- Niu, S.; Zhang, J.; Zhang, F.; Li, H. A method of uavs route optimization based on the structure of the highway network. Int. J. Distrib. Sens. Netw. 2015, 11, 359657. [Google Scholar] [CrossRef]
- Jo, J.-M. Highway drone patrol network topology and performance analysis for traffic violation enforcement. J. Korean Inst. Electron. Commun. 2017, 12, 1043–1048. [Google Scholar]
- Li, J.; Cao, X.; Guo, D.; Xie, J.; Chen, H. Task scheduling with uav-assisted vehicular cloud for road detection in highway scenario. IEEE Internet Things J. 2020, 7, 7702–7713. [Google Scholar] [CrossRef]
- Kim, S.; Jin, Y.; Jeong, B.; Han, J. Models and case studies for optimal deployment and scheduling of highway surveillance drones. Korean Manag. Sci. Rev. 2022, 39, 29–41. [Google Scholar] [CrossRef]
- Choi, S.; Lee, M.; Park, H.; Han, J. Mathematical programming-based heuristic for highway patrol drone scheduling problem. Socio-Econ. Plan. Sci. 2024, 93, 101907. [Google Scholar] [CrossRef]
- Bérczi, K.; Mnich, M.; Vincze, R. Approximations for many-visits multiple traveling salesman problems. Omega 2023, 116, 102816. [Google Scholar] [CrossRef]
- California Department of Transportation. Truck Traffic: Annual Average Daily Truck Traffic. 2020. Available online: https://gisdata-caltrans.opendata.arcgis.com/search?tags=Highway (accessed on 21 October 2024).
- Sandia National Laboratories. Pyomo: Python Optimization Modeling Objects; Version 6.7.0; Sandia National Laboratories: Albuquerque, NM, USA, 2023; Available online: https://github.com/Pyomo/pyomo (accessed on 7 February 2025).
- LLC Gurobi Optimization. Gurobi Optimizer Version 12.0.1 Reference Manual. 2025. Available online: https://www.gurobi.com (accessed on 7 February 2025).
- Hexaly SAS. Hexaly Optimization Solver; Version 13.5; Hexaly: Brooklyn, NY, USA, 2024; Available online: https://www.hexaly.com (accessed on 10 October 2024).
- LocalSolver. Hexaly: A New Generation Optimization Solver. 2023. Available online: https://www.hexaly.com/docs/last/quickstart/hexalyoptimizerintroduction.html (accessed on 15 April 2025).
- Reingold, E.M.; Strassen, V.; Rabin, M.O.; Reingold, E.M.; Stocks, A.I.; Fiduccia, C.M.; Paterson, M.S.; Winograd, S.; Brent, R.P.; Schultz, M.H.; et al. Complexity of computer computations. Reducibility Comb. Probl. 1972, 23, 85–103. [Google Scholar]
- Mohabbati-Kalejahi, N.; Yoon, S.W. Parallel machines scheduling problem for minimization of maximum lateness with sequence-dependent setup times. In Proceedings of the IIE Annual Conference Proceedings, Nashville, TN, USA, 30 May–2 June 2015; Institute of Industrial and Systems Engineers (IISE): Peachtree Corners, GA, USA, 2015; p. 837. [Google Scholar]
- Land, A.H.; Doig, A.G. An automatic method for solving discrete programming problems. Econometrica 2010, 28, 497–520. [Google Scholar] [CrossRef]
- Benoit, F.; David, T.; Van Hentenryck, J. Localsolver: A black-box local-search solver for combinatorial optimization. In Proceedings of the 25th International Conference on Principles and Practice of Constraint Programming, Stamford, CT, USA, 30 September–4 October 2019; pp. 45–60. [Google Scholar]


| Study | Objective Function | Repeated Visits | Battery Recharge | Max Inter-Visit Time | Heterogeneous Monitoring Durations |
|---|---|---|---|---|---|
| Fan et al. (2022) [34] | Minimize routing cost via DRL | ✗ | ✓ | ✗ | ✗ |
| Chow (2016) [35] | Minimize stochastic routing cost | ✗ | ✗ | ✗ | ✗ |
| Luo et al. (2017) [36] | Minimize 2-echelon routing cost | ✗ | ✓ (GV) | ✗ | ✗ |
| Hu et al. (2018) [37] | Joint routing and scheduling | ✗ | ✓ | ✗ | ✗ |
| Luo et al. (2019) [38] | Minimize patrol cost | ✗ | ✗ | ✗ | ✗ |
| Xu et al. (2023) [39] | GV-drone arc routing | ✗ | ✗ | ✗ | ✗ |
| Zhang et al. (2015) [40] | Minimize detection delay | ✗ | ✓ | ✗ | ✗ |
| Ghazzai et al. (2018) [41] | Minimize energy usage | ✗ | ✓ | ✗ | ✗ |
| Ghazzai et al. (2019) [42] | Proactive energy scheduling | ✗ | ✓ | ✗ | ✗ |
| Christodoulou & Kolios (2020) [43] | Minimize number of tours | ✗ | ✗ | ✗ | ✗ |
| Kumar et al. (2021) [44] | Secure communication (SDDN) | ✗ | ✗ | ✗ | ✗ |
| Rigas et al. (2021) [45] | Max. time-specific coverage | ✓ (fixed) | ✓ | ✗ | ✗ |
| Yakıcı (2016) [46] | Maximize visit score | ✗ | ✗ | ✗ | ✗ |
| Terzi et al. (2019) [47] | Minimize total flight time | ✗ | ✗ | ✗ | ✓ |
| Oh et al. (2014) [48] | Minimize route cost | ✗ | ✗ | ✗ | ✗ |
| Campbell et al. (2021) [49] | Minimize postman cost | ✗ | ✗ | ✗ | ✗ |
| Wang et al. (2022) [50] | Maximize time-based coverage | ✗ | ✗ | ✗ | ✗ |
| Cheng et al. (2019) [51] | Minimize patrol completion time | ✗ | ✓ | ✗ | ✗ |
| Huang et al. (2021) [52] | Decentralized coverage | ✗ | ✗ | ✗ | ✗ |
| Niu et al. (2015) [53] | Minimize UAV flight | ✗ | ✗ | ✗ | ✗ |
| Jo (2017) [54] | Patrol network simulation | ✗ | ✗ | ✗ | ✗ |
| Li et al. (2020) [55] | UAV blind-spot coverage | ✗ | ✗ | ✗ | ✗ |
| Kim et al. (2022) [56] | Highway drone scheduling | ✗ | ✓ | ✗ | ✗ |
| Choi et al. (2024) [57] | Time-varying patrol coverage | ✓ (not flexible) | ✓ | ✗ | ✗ |
| This study (DRSFMV) | Minimize maximum lateness and earliness of visits | ✓ | ✓ | ✓ | ✓ |
| Sets and Parameters | |
| Set of visits for each target q | |
| M | Number of identical drones |
| Q | Number of targets |
| N | Number of visits to all targets |
| R | Number of defined slots on each drone |
| i | Index set of drones, where |
| Index set of visits, where | |
| r | Index set of slots on each drone, where |
| Travel time between visits k and j | |
| Monitoring time for target j on slot r of drone i; | |
| The earliest possible start time for visit j | |
| The due date of visit j | |
| Maximum inter-visit time between consequent visits to target q | |
| Total flight time of a fully charged drone | |
| Upper bound for the dummy variables | |
| Lower bound for the dummy variables | |
| Decision Variables | |
| 1 if visit j is assigned to the slot r on drone i; 0 otherwise | |
| The completion time of monitoring a target on slot r of drone i | |
| The start time of monitoring a target on slot r of drone i | |
| Remaining charge in drone i after completing a visit assigned to slot r | |
| Time spent on node on slot r of drone i | |
| The maximum lateness | |
| The maximum earliness | |
| Dummy variable to linearize | |
| Dummy variable to linearize | |
| Dummy variable to linearize | |
| Dummy variable to linearize | |
| Dummy variable to linearize | |
| Dummy variable to linearize | |
| Dummy variable to linearize | |
| Feature | Hexaly | Traditional Solvers |
|---|---|---|
| Core Methodology | Hybrid local search with constraint propagation and learning-based heuristics | Branch-and-bound/cut with linear programming techniques |
| Problem Suitability | Excels in nonlinear, combinatorial, and large-scale problems | Best for linear and mixed-integer programming problems |
| Computation Speed | Faster for complex problems due to heuristic-driven exploration | Slower for large-scale, nonlinear problems |
| Solution Quality | Near-optimal or optimal, with trade-offs for speed | Optimal but may require significant time |
| Modeling Complexity | Intuitive, high-level language for complex constraints | Requires linearization or reformulation for nonlinear problems |
| Scalability | Highly scalable for millions of variables/constraints | Scalability limited by problem size and linearity |
| Instance | LP | NLP | HX | |||||||
|---|---|---|---|---|---|---|---|---|---|---|
| County | Iter | M | R | Obj | Time | Obj | Time | Obj | Time | |
| SB | 1 | 2 | 6 | 325.91 | 166 | 325.91 | 300 | 325.91 | 300 | [30, 570, 30, 570] |
| SB | 2 | 2 | 6 | 292.93 | 154 | 292.93 | 300 | 292.93 | 300 | [210, 750, 570, 570] |
| SB | 3 | 2 | 6 | 298.20 | 161 | 298.20 | 300 | 298.20 | 300 | [30, 390, 750, 390] |
| SB | 4 | 2 | 6 | 323.61 | 300 | 323.61 | 300 | 323.61 | 300 | [30, 390, 390, 30] |
| SB | 5 | 2 | 6 | 453.22 | 266 | 453.22 | 300 | 453.22 | 300 | [390, 30, 30, 390] |
| SB | 6 | 2 | 6 | 502.27 | 300 | 502.27 | 300 | 502.27 | 300 | [210, 210, 30, 390] |
| SB | 7 | 2 | 6 | 446.23 | 300 | 446.23 | 300 | 446.23 | 300 | [30, 210, 210, 570] |
| SB | 8 | 2 | 6 | 631.01 | 300 | 631.01 | 300 | 631.01 | 300 | [210, 210, 30, 30] |
| SB | 9 | 2 | 6 | 448.45 | 300 | 448.45 | 300 | 448.45 | 300 | [570, 750, 210, 390] |
| SB | 10 | 2 | 6 | 315.63 | 199 | 315.63 | 300 | 315.63 | 300 | [390, 930, 210, 750] |
| SB | 1 | 3 | 5 | 121.68 | 300 | 121.68 | 300 | 121.68 | 300 | [570, 210, 750, 750] |
| SB | 2 | 3 | 5 | 141.25 | 300 | 141.25 | 300 | 141.25 | 300 | [210, 390, 570, 390] |
| SB | 3 | 3 | 5 | 89.20 | 175 | 89.20 | 300 | 89.20 | 300 | [30, 570, 750, 390] |
| SB | 4 | 3 | 5 | 136.20 | 300 | 136.20 | 300 | 136.20 | 300 | [930, 30, 210, 210] |
| SB | 5 | 3 | 5 | 136.42 | 300 | 136.42 | 300 | 136.42 | 300 | [390, 930, 210, 570] |
| SB | 6 | 3 | 5 | 131.95 | 262 | 131.95 | 300 | 131.95 | 300 | [30, 210, 210, 390] |
| SB | 7 | 3 | 5 | 123.35 | 300 | 123.35 | 300 | 123.35 | 300 | [390, 210, 570, 390] |
| SB | 8 | 3 | 5 | 270.54 | 300 | 270.54 | 300 | 270.54 | 300 | [30, 30, 210, 570] |
| SB | 9 | 3 | 5 | 121.68 | 300 | 121.68 | 300 | 121.68 | 300 | [750, 570, 210, 390] |
| SB | 10 | 3 | 5 | 127.06 | 300 | 127.06 | 300 | 127.06 | 300 | [390, 210, 390, 210] |
| SB | 1 | 4 | 4 | 96.80 | 300 | 96.80 | 300 | 96.80 | 300 | [570, 210, 210, 390] |
| SB | 2 | 4 | 4 | 133.12 | 300 | 133.12 | 300 | 133.12 | 300 | [30, 390, 210, 30] |
| SB | 3 | 4 | 4 | 123.35 | 300 | 123.35 | 300 | 123.35 | 300 | [570, 210, 210, 390] |
| SB | 4 | 4 | 4 | 138.58 | 300 | 138.58 | 300 | 138.58 | 300 | [390, 210, 570, 570] |
| SB | 5 | 4 | 4 | 177.38 | 300 | 177.38 | 300 | 177.38 | 300 | [210, 390, 210, 390] |
| SB | 6 | 4 | 4 | 127.94 | 300 | 127.94 | 300 | 127.94 | 300 | [570, 570, 210, 210] |
| SB | 7 | 4 | 4 | 120.54 | 300 | 120.54 | 300 | 120.54 | 300 | [210, 390, 390, 750] |
| SB | 8 | 4 | 4 | 82.78 | 100 | 82.78 | 300 | 82.78 | 300 | [30, 570, 210, 570] |
| SB | 9 | 4 | 4 | 0 | 5 | 0 | 11 | 0 | 3 | [30, 750, 570, 390] |
| SB | 10 | 4 | 4 | 95.76 | 300 | 95.76 | 300 | 95.76 | 300 | [390, 210, 30, 210] |
| SB | 1 | 5 | 3 | 280.94 | 300 | 280.94 | 300 | 460.33 | 300 | [210, 930, 30, 30] |
| SB | 2 | 5 | 3 | 0 | 2 | 0 | 4 | 0 | 9 | [30, 390, 390, 570] |
| SB | 3 | 5 | 3 | 123.35 | 82 | 123.35 | 300 | 123.35 | 300 | [210, 210, 30, 570] |
| SB | 4 | 5 | 3 | 120.54 | 25 | 120.54 | 151 | 120.54 | 300 | [30, 570, 1110, 570] |
| SB | 5 | 5 | 3 | 114.03 | 36 | 114.03 | 137 | 175.72 | 300 | [30, 210, 750, 390] |
| SB | 6 | 5 | 3 | 413.99 | 208 | 413.99 | 300 | 413.99 | 300 | [30, 210, 210, 30] |
| SB | 7 | 5 | 3 | 280.27 | 88 | 280.27 | 300 | 280.27 | 300 | [210, 210, 750, 210] |
| SB | 8 | 5 | 3 | 262.78 | 140 | 262.78 | 300 | 262.78 | 300 | [210, 930, 390, 30] |
| SB | 9 | 5 | 3 | 318.58 | 38 | 318.58 | 300 | 318.58 | 300 | [210, 210, 390, 210] |
| SB | 10 | 5 | 3 | 246.34 | 201 | 246.34 | 300 | 246.34 | 300 | [210, 210, 210, 390] |
| Instance | LP | NLP | HX | |||||||
|---|---|---|---|---|---|---|---|---|---|---|
| County | Iter | M | R | Obj | Time | Obj | Time | Obj | Time | |
| RS | 1 | 2 | 6 | 214.07 | 60 | 214.07 | 300 | 214.07 | 300 | [570, 390, 570, 570] |
| RS | 2 | 2 | 6 | 185.36 | 300 | 185.36 | 300 | 185.36 | 300 | [570, 390, 930, 210] |
| RS | 3 | 2 | 6 | 285.04 | 300 | 285.04 | 300 | 305.98 | 300 | [210, 30, 210, 390] |
| RS | 4 | 2 | 6 | 485.36 | 300 | 485.36 | 300 | 485.36 | 300 | [210, 210, 210, 30] |
| RS | 5 | 2 | 6 | 189.10 | 281 | 189.10 | 131 | 189.10 | 300 | [930, 210, 210, 1110] |
| RS | 6 | 2 | 6 | 122.44 | 195 | 122.44 | 46 | 122.44 | 300 | [210, 930, 570, 390] |
| RS | 7 | 2 | 6 | 112.53 | 23 | 112.53 | 80 | 112.53 | 300 | [210, 390, 930, 1110] |
| RS | 8 | 2 | 6 | 442.42 | 300 | 442.42 | 300 | 449.24 | 300 | [390, 210, 30, 570] |
| RS | 9 | 2 | 6 | 215.96 | 300 | 215.96 | 300 | 247.68 | 300 | [390, 30, 390, 750] |
| RS | 10 | 2 | 6 | 112.88 | 300 | 112.88 | 300 | 112.88 | 300 | [930, 390, 390, 30] |
| RS | 1 | 3 | 5 | 0 | 2 | 0 | 3 | 0 | 11 | [390, 570, 30, 210] |
| RS | 2 | 3 | 5 | 0 | 2 | 0 | 5 | 0 | 5 | [570, 210, 570, 570] |
| RS | 3 | 3 | 5 | 7.12 | 17 | 7.12 | 300 | 7.12 | 300 | [570, 30, 390, 390] |
| RS | 4 | 3 | 5 | 0 | 2 | 0 | 4 | 0 | 28 | [570, 210, 750, 30] |
| RS | 5 | 3 | 5 | 122.44 | 300 | 122.44 | 300 | 122.44 | 300 | [570, 390, 30, 30] |
| RS | 6 | 3 | 5 | 58.04 | 199 | 58.04 | 300 | 58.04 | 300 | [570, 30, 210, 930] |
| RS | 7 | 3 | 5 | 8.12 | 300 | 8.12 | 300 | 8.12 | 300 | [390, 30, 930, 930] |
| RS | 8 | 3 | 5 | 0 | 1 | 0 | 36 | 0 | 69 | [210, 30, 210, 930] |
| RS | 9 | 3 | 5 | 91.83 | 300 | 91.83 | 300 | 91.83 | 300 | [570, 210, 390, 30] |
| RS | 10 | 3 | 5 | 0 | 0 | 0 | 4 | 0 | 1 | [570, 390, 390, 210] |
| RS | 1 | 4 | 4 | 109.73 | 300 | 109.73 | 300 | 109.73 | 300 | [210, 30, 570, 210] |
| RS | 2 | 4 | 4 | 0 | 2 | 0 | 2 | 0 | 0 | [750, 750, 210, 570] |
| RS | 3 | 4 | 4 | 94.24 | 300 | 94.24 | 300 | 94.24 | 300 | [390, 30, 390, 30] |
| RS | 4 | 4 | 4 | 111.14 | 300 | 111.14 | 300 | 111.14 | 300 | [390, 750, 210, 210] |
| RS | 5 | 4 | 4 | 115.09 | 300 | 115.09 | 300 | 115.09 | 300 | [30, 30, 1110, 570] |
| RS | 6 | 4 | 4 | 111.93 | 300 | 111.93 | 300 | 111.93 | 300 | [570, 750, 210, 750] |
| RS | 7 | 4 | 4 | 115.09 | 300 | 115.09 | 300 | 115.09 | 300 | [210, 390, 390, 30] |
| RS | 8 | 4 | 4 | 115.09 | 300 | 115.09 | 300 | 115.09 | 300 | [30, 930, 1110, 30] |
| RS | 9 | 4 | 4 | 115.09 | 300 | 115.09 | 300 | 115.09 | 300 | [390, 210, 30, 750] |
| RS | 10 | 4 | 4 | 0 | 1 | 0 | 4 | 0 | 4 | [570, 210, 390, 570] |
| RS | 1 | 5 | 3 | 0 | 0 | 0 | 1 | 0 | 4 | [570, 210, 1110, 750] |
| RS | 2 | 5 | 3 | 91.83 | 8 | 91.83 | 133 | 91.83 | 300 | [570, 30, 570, 210] |
| RS | 3 | 5 | 3 | 9.27 | 2 | 9.27 | 286 | 9.27 | 300 | [570, 210, 570, 210] |
| RS | 4 | 5 | 3 | 90.45 | 5 | 90.45 | 300 | 90.45 | 300 | [390, 750, 750, 390] |
| RS | 5 | 5 | 3 | 125.36 | 7 | 125.36 | 300 | 125.36 | 300 | [390, 570, 390, 210] |
| RS | 6 | 5 | 3 | 122.44 | 37 | 122.44 | 300 | 122.44 | 300 | [390, 390, 1110, 1110] |
| RS | 7 | 5 | 3 | 124.59 | 7 | 124.59 | 300 | 124.59 | 300 | [210, 30, 390, 930] |
| RS | 8 | 5 | 3 | 122.44 | 300 | 122.44 | 300 | 122.44 | 300 | [750, 390, 30, 570] |
| RS | 9 | 5 | 3 | 115.09 | 12 | 115.09 | 300 | 115.09 | 300 | [210, 570, 30, 390] |
| RS | 10 | 5 | 3 | 144.64 | 8 | 144.64 | 300 | 144.64 | 300 | [210, 390, 570, 30] |
| Instance | LP | NLP | HX | |||||||
|---|---|---|---|---|---|---|---|---|---|---|
| County | Iter | M | R | Obj | Time | Obj | Time | Obj | Time | |
| SB_RS | 1 | 3 | 8 | 140.74 | 1800 | 180.00 | 1800 | 140.74 | 1800 | [210, 390, 30, 750, 390, 210, 30, 210] |
| SB_RS | 2 | 3 | 8 | 114.44 | 1800 | 123.66 | 1800 | 104.45 | 1800 | [570, 390, 210, 930, 570, 210, 30, 930] |
| SB_RS | 3 | 3 | 8 | 139.30 | 1800 | 139.30 | 1800 | 139.30 | 1800 | [1110, 750, 390, 210, 210, 390, 570, 210] |
| SB_RS | 4 | 3 | 8 | 53.36 | 1800 | 53.36 | 1800 | 53.36 | 1800 | [30, 390, 750, 570, 930, 1110, 570, 390] |
| SB_RS | 5 | 3 | 8 | 143.95 | 1800 | 170.89 | 1800 | 237.80 | 1800 | [30, 570, 210, 750, 30, 750, 1110, 210] |
| SB_RS | 6 | 3 | 8 | 106.94 | 1800 | 113.41 | 1800 | 113.41 | 1800 | [210, 570, 390, 570, 570, 1110, 30, 210] |
| SB_RS | 7 | 3 | 8 | 206.34 | 1800 | 264.09 | 1800 | 157.56 | 1800 | [390, 30, 930, 570, 210, 750, 210, 210] |
| SB_RS | 8 | 3 | 8 | 126.93 | 1800 | 125.93 | 1800 | 129.13 | 1800 | [390, 750, 1110, 570, 390, 570, 930, 210] |
| SB_RS | 9 | 3 | 8 | 134.63 | 1800 | 152.65 | 1800 | 160.87 | 1800 | [30, 570, 390, 390, 30, 30, 390, 390] |
| SB_RS | 10 | 3 | 8 | 223.90 | 1800 | 257.92 | 1800 | 316.65 | 1800 | [30, 210, 930, 30, 210, 30, 30, 390] |
| SB_RS | 1 | 4 | 6 | 102.45 | 1800 | 102.45 | 1800 | 102.45 | 1800 | [390, 930, 390, 930, 570, 30, 210, 210] |
| SB_RS | 2 | 4 | 6 | 275.55 | 1800 | 241.93 | 1800 | 313.91 | 1800 | [390, 210, 30, 570, 210, 210, 30, 30] |
| SB_RS | 3 | 4 | 6 | 119.32 | 1800 | 119.32 | 1800 | 119.32 | 1800 | [1110, 210, 390, 210, 930, 570, 210, 210] |
| SB_RS | 4 | 4 | 6 | 92.94 | 1800 | 92.94 | 1800 | 92.94 | 1800 | [30, 570, 210, 390, 570, 930, 30, 750] |
| SB_RS | 5 | 4 | 6 | 138.27 | 1800 | 135.79 | 1800 | 138.27 | 1800 | [30, 210, 210, 390, 750, 390, 750, 390] |
| SB_RS | 6 | 4 | 6 | 123.79 | 1800 | 123.79 | 1800 | 123.79 | 1800 | [750, 210, 30, 570, 570, 390, 930, 30] |
| SB_RS | 7 | 4 | 6 | 128.47 | 1800 | 128.47 | 1800 | 128.47 | 1800 | [30, 210, 930, 390, 570, 570, 390, 30] |
| SB_RS | 8 | 4 | 6 | 138.36 | 1800 | 138.36 | 1800 | 138.36 | 1800 | [390, 390, 30, 390, 210, 390, 30, 390] |
| SB_RS | 9 | 4 | 6 | 273.65 | 1800 | 273.65 | 1800 | 274.92 | 1800 | [30, 30, 30, 390, 570, 1110, 390, 210] |
| SB_RS | 10 | 4 | 6 | 292.59 | 1800 | 292.59 | 1800 | 292.59 | 1800 | [30, 570, 210, 750, 30, 30, 30, 30] |
| SB_RS | 1 | 5 | 5 | 128.71 | 1800 | 128.71 | 1800 | 128.71 | 1800 | [30, 30, 210, 210, 390, 930, 750, 210] |
| SB_RS | 2 | 5 | 5 | 109.74 | 1800 | 109.74 | 1800 | 110.99 | 1800 | [210, 390, 390, 570, 570, 570, 390, 390] |
| SB_RS | 3 | 5 | 5 | 107.24 | 1800 | 107.24 | 1800 | 107.24 | 1800 | [30, 750, 390, 390, 930, 570, 750, 750] |
| SB_RS | 4 | 5 | 5 | 125.15 | 1800 | 125.15 | 1800 | 129.85 | 1800 | [30, 390, 210, 390, 570, 30, 570, 210] |
| SB_RS | 5 | 5 | 5 | 117.72 | 1800 | 117.72 | 1800 | 117.72 | 1800 | [390, 570, 390, 390, 570, 750, 750, 210] |
| SB_RS | 6 | 5 | 5 | 116.08 | 1800 | 116.08 | 1800 | 116.08 | 1800 | [210, 930, 30, 390, 390, 210, 750, 750] |
| SB_RS | 7 | 5 | 5 | 115.47 | 1800 | 115.47 | 1800 | 123.54 | 1800 | [930, 390, 570, 390, 750, 570, 30, 210] |
| SB_RS | 8 | 5 | 5 | 113.41 | 1800 | 113.41 | 1800 | 113.41 | 1800 | [1110, 750, 30, 570, 750, 570, 30, 750] |
| SB_RS | 9 | 5 | 5 | 117.06 | 1800 | 117.06 | 1800 | 117.06 | 1800 | [30, 570, 30, 570, 210, 30, 390, 30] |
| SB_RS | 10 | 5 | 5 | 138.81 | 1800 | 138.81 | 1800 | 288.79 | 1800 | [210, 390, 30, 30, 390, 210, 30, 210] |
| SB_RS | 1 | 6 | 4 | 148.92 | 1800 | 148.92 | 1800 | 148.92 | 1800 | [750, 210, 210, 390, 210, 390, 930, 210] |
| SB_RS | 2 | 6 | 4 | 176.58 | 1800 | 190.22 | 1800 | 179.25 | 1800 | [390, 750, 30, 750, 210, 390, 210, 210] |
| SB_RS | 3 | 6 | 4 | 265.42 | 1800 | 265.42 | 1800 | 265.42 | 1800 | [1110, 210, 570, 390, 570, 30, 390, 210] |
| SB_RS | 4 | 6 | 4 | 244.59 | 1800 | 244.59 | 1800 | 265.12 | 1800 | [30, 210, 30, 570, 30, 30, 390, 930] |
| SB_RS | 5 | 6 | 4 | 239.07 | 1800 | 239.07 | 1800 | 239.07 | 1800 | [930, 210, 210, 570, 390, 930, 750, 210] |
| SB_RS | 6 | 6 | 4 | 149.29 | 1800 | 149.29 | 1800 | 149.29 | 1800 | [210, 390, 750, 390, 390, 390, 390, 30] |
| SB_RS | 7 | 6 | 4 | 293.47 | 1800 | 293.47 | 1800 | 293.47 | 1800 | [390, 570, 30, 750, 390, 390, 210, 750] |
| SB_RS | 8 | 6 | 4 | 273.50 | 1800 | 270.78 | 1800 | 273.57 | 1800 | [750, 570, 570, 390, 30, 30, 30, 930] |
| SB_RS | 9 | 6 | 4 | 256.03 | 1800 | 256.03 | 1800 | 256.03 | 1800 | [930, 390, 570, 210, 570, 570, 30, 570] |
| SB_RS | 10 | 6 | 4 | 380.54 | 1800 | 380.54 | 1800 | 380.54 | 1800 | [30, 210, 210, 210, 390, 570, 570, 210] |
| Instance | LP | NLP | HX | |||||||
|---|---|---|---|---|---|---|---|---|---|---|
| County | Iter | M | R | Obj | Time | Obj | Time | Obj | Time | |
| LA | 1 | 4 | 8 | 134.61 | 3600 | 126.98 | 3600 | 119.08 | 3600 | [390, 210, 210, 570, 750, 210, 210, 210] |
| LA | 2 | 4 | 8 | 98.48 | 3600 | 98.48 | 3600 | 70.34 | 3600 | [390, 390, 570, 750, 570, 390, 390, 570] |
| LA | 3 | 4 | 8 | 281.37 | 3600 | 313.91 | 3600 | 329.08 | 3600 | [210, 570, 570, 390, 30, 750, 210, 570] |
| LA | 4 | 4 | 8 | 125.00 | 3600 | 137.97 | 3600 | 134.29 | 3600 | [390, 390, 390, 30, 570, 390, 570, 570] |
| LA | 5 | 4 | 8 | 207.73 | 3600 | 246.22 | 3600 | 184.13 | 3600 | [210, 30, 390, 570, 390, 210, 570, 570] |
| LA | 6 | 4 | 8 | 121.32 | 3600 | 134.41 | 3600 | 134.41 | 3600 | [210, 570, 390, 390, 210, 30, 210, 210] |
| LA | 7 | 4 | 8 | 221.28 | 3600 | 171.21 | 3600 | 201.80 | 3600 | [390, 750, 390, 570, 210, 390, 390, 30] |
| LA | 8 | 4 | 8 | 370.20 | 3600 | 500.59 | 3600 | 559.18 | 3600 | [30, 30, 30, 210, 390, 30, 390, 390] |
| LA | 9 | 4 | 8 | 106.03 | 3600 | 149.57 | 3600 | 131.84 | 3600 | [210, 210, 390, 210, 390, 210, 390, 210] |
| LA | 10 | 4 | 8 | 132.35 | 3600 | 180.00 | 3600 | 156.97 | 3600 | [570, 210, 210, 210, 210, 570, 30, 390] |
| LA | 1 | 5 | 6 | 363.92 | 3600 | 522.94 | 3600 | 363.52 | 3600 | [390, 570, 210, 750, 210, 570, 210, 570] |
| LA | 2 | 5 | 6 | 549.14 | 3600 | 731.41 | 3600 | 657.66 | 3600 | [210, 570, 210, 210, 750, 30, 210, 570] |
| LA | 3 | 5 | 6 | 546.34 | 3600 | 548.66 | 3600 | 531.71 | 3600 | [390, 390, 210, 390, 570, 390, 30, 570] |
| LA | 4 | 5 | 6 | 510.36 | 3600 | 609.51 | 3600 | 510.16 | 3600 | [210, 390, 210, 750, 570, 210, 210, 570] |
| LA | 5 | 5 | 6 | 647.48 | 3600 | 647.56 | 3600 | 647.49 | 3600 | [570, 570, 210, 570, 390, 390, 750, 390] |
| LA | 6 | 5 | 6 | 691.18 | 3600 | 3600 | 666.23 | 3600 | [570, 390, 210, 30, 390, 390, 210, 30] | |
| LA | 7 | 5 | 6 | 546.61 | 3600 | 1092.91 | 3600 | 546.60 | 3600 | [210, 750, 390, 30, 750, 390, 30, 570] |
| LA | 8 | 5 | 6 | 429.00 | 3600 | 640.95 | 3600 | 467.56 | 3600 | [570, 570, 210, 390, 390, 30, 390, 390] |
| LA | 9 | 5 | 6 | 338.92 | 3600 | 374.92 | 3600 | 336.52 | 3600 | [570, 750, 570, 390, 570, 570, 390, 750] |
| LA | 10 | 5 | 6 | 331.13 | 3600 | 332.18 | 3600 | 330.85 | 3600 | [390, 210, 750, 750, 390, 570, 390, 210] |
| LA | 1 | 5 | 8 | 0 | 775 | 0 | 1983 | 0 | 335 | [210, 210, 390, 390, 390, 750, 390, 390] |
| LA | 2 | 5 | 8 | 258.92 | 3600 | 258.92 | 3600 | 258.92 | 3600 | [570, 390, 570, 570, 210, 570, 210, 390] |
| LA | 3 | 5 | 8 | 113.80 | 3600 | 113.80 | 3600 | 113.80 | 3600 | [750, 750, 390, 570, 210, 390, 210, 210] |
| LA | 4 | 5 | 8 | 263.18 | 3600 | 263.18 | 3600 | 263.18 | 3600 | [30, 390, 210, 390, 390, 210, 570, 210] |
| LA | 5 | 5 | 8 | 116.71 | 3600 | 116.71 | 3600 | 116.71 | 3600 | [390, 210, 570, 390, 390, 390, 210, 210] |
| LA | 6 | 5 | 8 | - | 3600 | - | 3600 | 351.28 | 3600 | [390, 750, 30, 570, 30, 570, 210, 390] |
| LA | 7 | 5 | 8 | 252.42 | 3600 | 514.70 | 3600 | 154.41 | 3600 | [210, 570, 390, 210, 210, 390, 750, 390] |
| LA | 8 | 5 | 8 | 115.76 | 3600 | 115.76 | 3600 | 131.78 | 3600 | [390, 210, 210, 750, 210, 210, 390, 570] |
| LA | 9 | 5 | 8 | 115.76 | 3600 | 115.76 | 3600 | 115.76 | 3600 | [570, 30, 390, 570, 570, 390, 930, 570] |
| LA | 10 | 5 | 8 | 258.92 | 3600 | 258.92 | 3600 | 258.92 | 3600 | [390, 750, 210, 30, 210, 570, 570, 210] |
| LA | 1 | 6 | 5 | 548.23 | 3600 | 577.19 | 3600 | 546.68 | 3600 | [390, 390, 390, 30, 390, 750, 390, 390] |
| LA | 2 | 6 | 5 | 510.93 | 3600 | 549.11 | 3600 | 510.40 | 3600 | [570, 390, 210, 210, 570, 930, 930, 390] |
| LA | 3 | 6 | 5 | 548.99 | 3600 | 570.06 | 3600 | 547.69 | 3600 | [390, 390, 570, 750, 390, 210, 390, 570] |
| LA | 4 | 6 | 5 | 656.87 | 3600 | 629.47 | 3600 | 629.47 | 3600 | [210, 210, 570, 390, 570, 570, 930, 210] |
| LA | 5 | 6 | 5 | 691.40 | 3600 | 695.97 | 3600 | 692.45 | 3600 | [210, 570, 390, 390, 210, 750, 30, 210] |
| LA | 6 | 6 | 5 | 511.34 | 3600 | 663.84 | 3600 | 510.40 | 3600 | [390, 390, 570, 210, 210, 210, 570, 210] |
| LA | 7 | 6 | 5 | 606.18 | 3600 | 690.50 | 3600 | 606.16 | 3600 | [570, 390, 570, 390, 210, 570, 390, 390] |
| LA | 8 | 6 | 5 | 723.54 | 3600 | 723.69 | 3600 | 723.54 | 3600 | [390, 390, 570, 390, 210, 750, 750, 570] |
| LA | 9 | 6 | 5 | 546.60 | 3600 | 794.39 | 3600 | 546.67 | 3600 | [570, 570, 390, 30, 570, 210, 390, 570] |
| LA | 10 | 6 | 5 | 690.08 | 3600 | 690.96 | 3600 | 690.08 | 3600 | [390, 390, 390, 390, 210, 570, 750, 390] |
| Instance | LP | NLP | HX | |||||||
|---|---|---|---|---|---|---|---|---|---|---|
| County | Iter | M | R | Obj | Time | Obj | Time | Obj | Time | |
| SB_LA | 1 | 7 | 9 | 114.03 | 3600 | 122.17 | 3600 | 114.03 | 3600 | [30, 210, 210, 390, 390, 210, 570, 30, 390, 390, 210, 30] |
| SB_LA | 2 | 7 | 9 | 118.86 | 3600 | 118.86 | 3600 | 118.86 | 3600 | [30, 210, 210, 30, 750, 210, 390, 570, 210, 570, 750, 570] |
| SB_LA | 3 | 7 | 9 | 118.86 | 3600 | 155.41 | 3600 | 118.86 | 3600 | [750, 30, 570, 30, 390, 390, 390, 390, 210, 390, 390, 210] |
| SB_LA | 4 | 7 | 9 | 114.03 | 3600 | 126.09 | 3600 | 114.03 | 3600 | [390, 390, 210, 30, 210, 210, 390, 210, 570, 390, 210, 570] |
| SB_LA | 5 | 7 | 9 | 113.80 | 3600 | 124.18 | 3600 | 113.80 | 3600 | [750, 390, 390, 210, 570, 210, 390, 210, 390, 750, 390, 210] |
| SB_LA | 6 | 7 | 9 | 263.18 | 3600 | 337.75 | 3600 | 263.18 | 3600 | [750, 390, 390, 570, 210, 570, 570, 390, 570, 210, 390, 210] |
| SB_LA | 7 | 7 | 9 | 118.86 | 3600 | 255.33 | 3600 | 118.86 | 3600 | [210, 30, 30, 570, 390, 750, 390, 390, 210, 390, 750, 210] |
| SB_LA | 8 | 7 | 9 | 115.76 | 3600 | 115.76 | 3600 | 115.76 | 3600 | [750, 570, 210, 570, 210, 30, 390, 390, 210, 570, 210, 210] |
| SB_LA | 9 | 7 | 9 | 116.59 | 3600 | 116.59 | 3600 | 116.59 | 3600 | [930, 750, 570, 210, 210, 210, 570, 750, 210, 390, 390, 210] |
| SB_LA | 10 | 7 | 9 | 0 | 2444 | 27.68 | 3600 | 0 | 1483 | [390, 390, 210, 570, 210, 390, 210, 570, 210, 390, 570, 570] |
| SB_LA | 1 | 8 | 9 | 258.92 | 3600 | 258.91 | 3600 | 258.92 | 3600 | [570, 210, 570, 390, 390, 570, 390, 30, 30, 570, 210, 570] |
| SB_LA | 2 | 8 | 9 | 112.32 | 3600 | 114.18 | 3600 | 112.33 | 3600 | [210, 390, 210, 750, 390, 570, 390, 390, 210, 570, 930, 30] |
| SB_LA | 3 | 8 | 9 | 112.33 | 3600 | 112.33 | 3600 | 112.33 | 3600 | [930, 750, 390, 750, 390, 210, 390, 390, 390, 390, 390, 30] |
| SB_LA | 4 | 8 | 9 | 114.03 | 3600 | 114.03 | 3600 | 114.03 | 3600 | [30, 210, 570, 390, 570, 390, 390, 390, 210, 750, 390, 570] |
| SB_LA | 5 | 8 | 9 | 116.71 | 3600 | 209.20 | 3600 | 116.71 | 3600 | [30, 390, 30, 210, 210, 570, 210, 390, 570, 30, 30, 930] |
| SB_LA | 6 | 8 | 9 | 118.86 | 3600 | 278.29 | 3600 | 118.86 | 3600 | [570, 30, 930, 570, 570, 930, 390, 570, 210, 210, 570, 210] |
| SB_LA | 7 | 8 | 9 | 263.18 | 3600 | 602.53 | 3600 | 263.18 | 3600 | [210, 30, 750, 210, 210, 210, 570, 930, 210, 750, 390, 390] |
| SB_LA | 8 | 8 | 9 | 0 | 1596 | 246.41 | 3600 | 0 | 613 | [570, 750, 210, 210, 390, 570, 390, 570, 210, 210, 210, 750] |
| SB_LA | 9 | 8 | 9 | 115.76 | 3600 | 530.65 | 3600 | 115.76 | 3600 | [390, 570, 30, 210, 210, 30, 750, 390, 390, 210, 210, 390] |
| SB_LA | 10 | 8 | 9 | 258.92 | 3600 | 570.77 | 3600 | 258.92 | 3600 | [30, 750, 30, 210, 390, 750, 390, 390, 30, 210, 390, 210] |
| SB_LA | 1 | 9 | 8 | 118.85 | 3600 | 118.86 | 3600 | 118.86 | 3600 | [390, 210, 210, 210, 210, 30, 390, 570, 570, 210, 750, 750] |
| SB_LA | 2 | 9 | 8 | 258.92 | 3600 | 258.92 | 3600 | 258.92 | 3600 | [750, 30, 390, 390, 210, 390, 390, 30, 210, 570, 570, 570] |
| SB_LA | 3 | 9 | 8 | 263.18 | 3600 | 300.54 | 3600 | 263.18 | 3600 | [570, 390, 390, 390, 30, 210, 210, 210, 30, 930, 390, 570] |
| SB_LA | 4 | 9 | 8 | 116.71 | 3600 | 116.71 | 3600 | 116.71 | 3600 | [210, 210, 210, 390, 390, 210, 210, 390, 210, 210, 390, 30] |
| SB_LA | 5 | 9 | 8 | 114.03 | 3600 | 114.03 | 3600 | 114.03 | 3600 | [30, 210, 30, 30, 210, 570, 210, 210, 570, 210, 210, 210] |
| SB_LA | 6 | 9 | 8 | 113.80 | 3600 | 136.72 | 3600 | 113.80 | 3600 | [210, 390, 570, 210, 750, 750, 210, 390, 210, 390, 30, 210] |
| SB_LA | 7 | 9 | 8 | 118.86 | 3600 | 118.86 | 3600 | 118.86 | 3600 | [390, 30, 210, 570, 390, 390, 570, 30, 210, 390, 390, 30] |
| SB_LA | 8 | 9 | 8 | 107.48 | 3600 | 107.48 | 3600 | 107.48 | 3600 | [930, 930, 390, 210, 390, 210, 210, 210, 390, 570, 750, 570] |
| SB_LA | 9 | 9 | 8 | 112.33 | 3600 | 112.33 | 3600 | 112.33 | 3600 | [570, 390, 30, 390, 390, 210, 390, 390, 390, 390, 390, 30] |
| SB_LA | 10 | 9 | 8 | 116.59 | 3600 | 116.59 | 3600 | 116.59 | 3600 | [750, 750, 930, 570, 390, 930, 210, 390, 390, 210, 570, 390] |
| SB_LA | 1 | 9 | 7 | 116.71 | 3600 | 116.71 | 3600 | 116.71 | 3600 | [750, 390, 210, 390, 210, 750, 570, 570, 570, 30, 570, 210] |
| SB_LA | 2 | 9 | 7 | 244.96 | 3600 | 274.29 | 3600 | 244.96 | 3600 | [930, 570, 930, 210, 390, 210, 30, 390, 390, 390, 30, 390] |
| SB_LA | 3 | 9 | 7 | 258.92 | 3600 | 258.92 | 3600 | 258.92 | 3600 | [570, 210, 930, 390, 390, 750, 390, 390, 210, 210, 30, 210] |
| SB_LA | 4 | 9 | 7 | 116.71 | 3600 | 160.93 | 3600 | 116.71 | 3600 | [570, 210, 390, 390, 390, 390, 570, 210, 210, 30, 210, 570] |
| SB_LA | 5 | 9 | 7 | 116.59 | 3600 | 126.29 | 3600 | 116.59 | 3600 | [750, 930, 750, 30, 210, 390, 210, 210, 390, 930, 210, 750] |
| SB_LA | 6 | 9 | 7 | 114.03 | 3600 | 114.03 | 3600 | 114.03 | 3600 | [30, 210, 30, 30, 390, 570, 210, 390, 570, 210, 210, 930] |
| SB_LA | 7 | 9 | 7 | 258.92 | 3600 | 258.92 | 3600 | 258.92 | 3600 | [390, 210, 390, 210, 390, 390, 390, 570, 210, 210, 210, 30] |
| SB_LA | 8 | 9 | 7 | 115.75 | 3600 | 126.39 | 3600 | 115.76 | 3600 | [390, 570, 30, 210, 750, 210, 390, 570, 750, 390, 210, 390] |
| SB_LA | 9 | 9 | 7 | 113.80 | 3600 | 113.80 | 3600 | 113.80 | 3600 | [30, 750, 1110, 570, 210, 390, 390, 210, 570, 210, 30, 570] |
| SB_LA | 10 | 9 | 7 | 118.86 | 3600 | 118.86 | 3600 | 118.86 | 3600 | [570, 210, 390, 570, 210, 210, 570, 570, 210, 570, 750, 750] |
| Instance | LP | NLP | HX | |||||||
|---|---|---|---|---|---|---|---|---|---|---|
| County | Iter | M | R | Obj | Time | Obj | Time | Obj | Time | |
| RS_LA | 1 | 7 | 9 | 112.33 | 3600 | 112.33 | 3600 | 112.33 | 3600 | [750, 390, 570, 570, 390, 750, 750, 570, 390, 390, 570, 30] |
| RS_LA | 2 | 7 | 9 | 113.80 | 3600 | - | 3600 | 113.80 | 3600 | [210, 30, 30, 570, 210, 210, 210, 930, 210, 390, 390, 750] |
| RS_LA | 3 | 7 | 9 | 107.48 | 3600 | 168.98 | 3600 | 107.48 | 3600 | [570, 750, 30, 930, 570, 210, 390, 570, 390, 570, 930, 390] |
| RS_LA | 4 | 7 | 9 | 115.09 | 3600 | 115.09 | 3600 | 115.09 | 3600 | [210, 390, 210, 390, 570, 390, 570, 210, 390, 390, 210, 750] |
| RS_LA | 5 | 7 | 9 | 116.59 | 3600 | 189.38 | 3600 | 116.59 | 3600 | [390, 570, 210, 390, 210, 750, 390, 570, 210, 390, 570, 750] |
| RS_LA | 6 | 7 | 9 | 0 | 1455 | 141.52 | 3600 | 0 | 1321 | [390, 30, 30, 390, 390, 210, 210, 750, 570, 210, 570, 570] |
| RS_LA | 7 | 7 | 9 | 0 | 1678 | 325.19 | 3600 | 0 | 462 | [210, 390, 210, 930, 390, 390, 210, 390, 570, 390, 750, 390] |
| RS_LA | 8 | 7 | 9 | 115.09 | 3600 | 115.09 | 3600 | 115.09 | 3600 | [210, 30, 30, 210, 390, 750, 210, 390, 570, 210, 30, 390] |
| RS_LA | 9 | 7 | 9 | 258.92 | 3600 | 417.62 | 3600 | 258.92 | 3600 | [390, 30, 570, 30, 210, 210, 390, 570, 30, 210, 390, 210] |
| RS_LA | 10 | 7 | 9 | 118.94 | 3600 | 682.06 | 3600 | 125.32 | 3600 | [30, 930, 750, 210, 210, 390, 210, 30, 210, 750, 210, 750] |
| RS_LA | 1 | 8 | 9 | 116.71 | 3600 | 116.71 | 3600 | 116.71 | 3600 | [390, 210, 390, 30, 390, 210, 750, 390, 210, 30, 570, 210] |
| RS_LA | 2 | 8 | 9 | 244.96 | 3600 | 244.96 | 3600 | 244.96 | 3600 | [390, 570, 210, 30, 570, 750, 30, 570, 210, 750, 210, 570] |
| RS_LA | 3 | 8 | 9 | 116.71 | 3600 | 116.71 | 3600 | 116.71 | 3600 | [30, 750, 210, 1110, 210, 930, 390, 30, 570, 30, 750, 750] |
| RS_LA | 4 | 8 | 9 | 116.71 | 3600 | 128.51 | 3600 | 116.71 | 3600 | [750, 570, 30, 210, 390, 210, 750, 210, 210, 30, 930, 210] |
| RS_LA | 5 | 8 | 9 | 116.71 | 3600 | 314.61 | 3600 | 116.71 | 3600 | [570, 390, 930, 210, 210, 390, 390, 390, 210, 210, 30, 390] |
| RS_LA | 6 | 8 | 9 | 263.18 | 3600 | 263.18 | 3600 | 263.18 | 3600 | [570, 390, 30, 210, 30, 30, 390, 750, 390, 390, 390, 390] |
| RS_LA | 7 | 8 | 9 | 114.46 | 3600 | 189.30 | 3600 | 114.46 | 3600 | [930, 30, 570, 210, 210, 210, 750, 390, 210, 390, 210, 210] |
| RS_LA | 8 | 8 | 9 | 64.96 | 3600 | 64.96 | 3600 | 64.96 | 3600 | [570, 1110, 30, 390, 570, 570, 210, 390, 750, 750, 210, 390] |
| RS_LA | 9 | 8 | 9 | 113.80 | 3600 | 620.20 | 3600 | 113.80 | 3600 | [750, 1110, 30, 210, 570, 750, 390, 390, 210, 390, 390, 570] |
| RS_LA | 10 | 8 | 9 | 114.46 | 3600 | 114.46 | 3600 | 114.46 | 3600 | [570, 570, 30, 30, 390, 570, 210, 390, 210, 570, 390, 390] |
| RS_LA | 1 | 9 | 8 | 116.59 | 3600 | 116.59 | 3600 | 116.59 | 3600 | [390, 30, 390, 750, 210, 210, 750, 210, 390, 390, 210, 210] |
| RS_LA | 2 | 9 | 8 | 115.76 | 3600 | 115.76 | 3600 | 115.76 | 3600 | [570, 570, 30, 30, 390, 30, 210, 210, 390, 210, 390, 390] |
| RS_LA | 3 | 9 | 8 | 115.76 | 3600 | 115.76 | 3600 | 115.76 | 3600 | [570, 30, 930, 390, 390, 390, 210, 30, 390, 390, 570, 390] |
| RS_LA | 4 | 9 | 8 | 113.80 | 3600 | 267.39 | 3600 | 113.80 | 3600 | [210, 930, 30, 210, 390, 390, 390, 30, 390, 750, 210, 570] |
| RS_LA | 5 | 9 | 8 | 115.08 | 3600 | 200.73 | 3600 | 115.09 | 3600 | [390, 210, 210, 930, 390, 210, 210, 750, 210, 570, 570, 570] |
| RS_LA | 6 | 9 | 8 | 112.33 | 3600 | 215.59 | 3600 | 112.33 | 3600 | [930, 570, 570, 210, 390, 390, 570, 390, 390, 930, 390, 390] |
| RS_LA | 7 | 9 | 8 | 0 | 744 | 0 | 3002 | 0 | 653 | [390, 30, 210, 570, 390, 210, 570, 210, 390, 750, 930, 210] |
| RS_LA | 8 | 9 | 8 | 116.59 | 3600 | 116.59 | 3600 | 116.59 | 3600 | [570, 570, 210, 570, 210, 570, 570, 210, 390, 390, 390, 210] |
| RS_LA | 9 | 9 | 8 | 113.43 | 3600 | 113.44 | 3600 | 113.44 | 3600 | [390, 390, 750, 30, 210, 570, 570, 210, 390, 390, 390, 570] |
| RS_LA | 10 | 9 | 8 | 115.09 | 3600 | 115.09 | 3600 | 115.09 | 3600 | [30, 390, 390, 390, 390, 750, 210, 570, 390, 750, 570, 210] |
| RS_LA | 1 | 9 | 7 | 112.33 | 3600 | 112.33 | 3600 | 112.33 | 3600 | [570, 30, 1110, 750, 390, 390, 390, 750, 390, 570, 570, 30] |
| RS_LA | 2 | 9 | 7 | 113.80 | 3600 | 118.32 | 3600 | 113.80 | 3600 | [390, 210, 30, 570, 210, 390, 390, 210, 390, 750, 30, 930] |
| RS_LA | 3 | 9 | 7 | 244.96 | 3600 | 323.01 | 3600 | 244.96 | 3600 | [210, 750, 30, 210, 390, 390, 30, 390, 210, 390, 30, 30] |
| RS_LA | 4 | 9 | 7 | 116.71 | 3600 | 116.71 | 3600 | 116.71 | 3600 | [570, 30, 30, 930, 210, 570, 390, 570, 570, 30, 750, 390] |
| RS_LA | 5 | 9 | 7 | 263.18 | 3600 | 263.18 | 3600 | 263.18 | 3600 | [390, 210, 30, 570, 30, 210, 390, 570, 210, 210, 210, 30] |
| RS_LA | 6 | 9 | 7 | 115.76 | 3600 | 115.76 | 3600 | 115.76 | 3600 | [210, 30, 930, 210, 390, 30, 570, 390, 210, 570, 30, 570] |
| RS_LA | 7 | 9 | 7 | 115.76 | 3600 | 115.76 | 3600 | 115.76 | 3600 | [390, 750, 390, 750, 570, 30, 390, 210, 390, 930, 570, 390] |
| RS_LA | 8 | 9 | 7 | 113.44 | 3600 | 113.44 | 3600 | 113.44 | 3600 | [750, 210, 390, 570, 390, 210, 390, 210, 390, 390, 210, 930] |
| RS_LA | 9 | 9 | 7 | 115.76 | 3600 | 115.76 | 3600 | 115.76 | 3600 | [210, 390, 570, 210, 210, 210, 390, 210, 390, 390, 210, 570] |
| RS_LA | 10 | 9 | 7 | 113.44 | 3600 | 113.44 | 3600 | 113.44 | 3600 | [210, 210, 210, 750, 390, 210, 390, 210, 210, 390, 570, 750] |
| Instance | LP | NLP | HX | |||||||
|---|---|---|---|---|---|---|---|---|---|---|
| County | Iter | M | R | Obj | Time | Obj | Time | Obj | Time | |
| SB_RS_LA | 1 | 8 | 7 | 277.18 | 3600 | - | 3600 | 244.96 | 3600 | [390, 30, 30, 210, 570, 750, 570, 390, 390, 570, 30, 210, 390, 750, 570, 390] |
| SB_RS_LA | 2 | 8 | 7 | 266.69 | 3600 | - | 3600 | 121.29 | 3600 | [390, 390, 30, 570, 210, 390, 570, 750, 210, 570, 210, 210, 570, 570, 390, 570] |
| SB_RS_LA | 3 | 8 | 7 | 439.27 | 3600 | - | 3600 | 189.54 | 3600 | [30, 210, 30, 570, 30, 30, 570, 210, 210, 930, 390, 210, 390, 570, 210, 30] |
| SB_RS_LA | 4 | 8 | 7 | 313.14 | 3600 | 1008.33 | 3600 | 258.92 | 3600 | [570, 30, 930, 390, 750, 930, 210, 570, 390, 390, 570, 30, 210, 750, 570, 390] |
| SB_RS_LA | 5 | 8 | 7 | 441.69 | 3600 | - | 3600 | 120.09 | 3600 | [210, 30, 390, 930, 390, 210, 30, 930, 210, 30, 390, 750, 210, 930, 750, 210] |
| SB_RS_LA | 6 | 8 | 7 | 353.18 | 3600 | - | 3600 | 120.63 | 3600 | [930, 750, 30, 390, 570, 750, 30, 210, 210, 30, 210, 750, 570, 390, 390, 570] |
| SB_RS_LA | 7 | 8 | 7 | 417.74 | 3600 | - | 3600 | 126.80 | 3600 | [210, 750, 570, 30, 390, 930, 570, 390, 210, 570, 210, 210, 570, 210, 390, 570] |
| SB_RS_LA | 8 | 8 | 7 | 653.29 | 3600 | 927.47 | 3600 | 285.95 | 3600 | [30, 30, 750, 390, 750, 210, 570, 30, 30, 210, 30, 390, 390, 210, 210, 210] |
| SB_RS_LA | 9 | 8 | 7 | 398.61 | 3600 | - | 3600 | 258.92 | 3600 | [390, 570, 1110, 570, 570, 30, 30, 390, 390, 570, 390, 210, 30, 210, 570, 390] |
| SB_RS_LA | 10 | 8 | 7 | 356.08 | 3600 | 1058.75 | 3600 | 117.37 | 3600 | [210, 570, 30, 30, 390, 750, 30, 750, 210, 570, 570, 390, 390, 210, 210, 390] |
| SB_RS_LA | 1 | 8 | 9 | 338.37 | 3600 | - | 3600 | 263.18 | 3600 | [570, 210, 390, 210, 30, 930, 390, 930, 210, 210, 210, 390, 570, 390, 390, 210] |
| SB_RS_LA | 2 | 8 | 9 | 278.37 | 3600 | 708.87 | 3600 | 258.92 | 3600 | [390, 210, 390, 390, 210, 210, 210, 570, 210, 750, 210, 570, 30, 750, 750, 390] |
| SB_RS_LA | 3 | 8 | 9 | 116.71 | 3600 | 415.16 | 3600 | 116.71 | 3600 | [210, 570, 570, 570, 390, 570, 570, 570, 210, 210, 390, 210, 390, 30, 570, 750] |
| SB_RS_LA | 4 | 8 | 9 | 114.03 | 3600 | - | 3600 | 114.03 | 3600 | [30, 210, 210, 30, 570, 30, 210, 390, 210, 750, 390, 570, 390, 750, 750, 390] |
| SB_RS_LA | 5 | 8 | 9 | 172.39 | 3600 | - | 3600 | 115.09 | 3600 | [390, 210, 390, 210, 210, 390, 30, 210, 390, 390, 210, 390, 570, 750, 210, 570] |
| SB_RS_LA | 6 | 8 | 9 | 310.95 | 3600 | 1106.08 | 3600 | 124.75 | 3600 | [30, 390, 30, 210, 390, 570, 210, 210, 210, 30, 750, 210, 570, 210, 210, 570] |
| SB_RS_LA | 7 | 8 | 9 | 254.08 | 3600 | - | 3600 | 118.86 | 3600 | [30, 390, 210, 390, 390, 570, 570, 750, 210, 570, 750, 30, 570, 390, 210, 210] |
| SB_RS_LA | 8 | 8 | 9 | 252.48 | 3600 | - | 3600 | 118.86 | 3600 | [210, 30, 390, 570, 390, 30, 30, 30, 210, 210, 210, 390, 750, 210, 390, 390] |
| SB_RS_LA | 9 | 8 | 9 | 331.03 | 3600 | - | 3600 | 115.76 | 3600 | [390, 390, 30, 570, 390, 30, 930, 390, 570, 30, 390, 570, 210, 930, 390, 210] |
| SB_RS_LA | 10 | 8 | 9 | 263.18 | 3600 | - | 3600 | 263.18 | 3600 | [570, 570, 390, 390, 570, 390, 210, 930, 30, 570, 390, 210, 210, 390, 210, 930] |
| SB_RS_LA | 1 | 9 | 7 | 103.54 | 3600 | 596.03 | 3600 | 102.70 | 3600 | [30, 750, 30, 390, 390, 570, 390, 750, 390, 210, 390, 390, 210, 750, 570, 750] |
| SB_RS_LA | 2 | 9 | 7 | 268.83 | 3600 | - | 3600 | 263.18 | 3600 | [930, 750, 390, 390, 210, 570, 390, 30, 210, 390, 210, 210, 390, 390, 30, 210] |
| SB_RS_LA | 3 | 9 | 7 | 135.02 | 3600 | - | 3600 | 112.33 | 3600 | [1110, 210, 750, 750, 210, 210, 930, 30, 570, 390, 390, 570, 210, 570, 390, 30] |
| SB_RS_LA | 4 | 9 | 7 | 263.18 | 3600 | - | 3600 | 263.18 | 3600 | [30, 570, 750, 570, 390, 30, 210, 210, 30, 390, 390, 210, 390, 390, 390, 570] |
| SB_RS_LA | 5 | 9 | 7 | 231.01 | 3600 | 825.48 | 3600 | 124.00 | 3600 | [1110, 210, 750, 390, 30, 570, 930, 390, 390, 30, 570, 210, 390, 570, 570, 30] |
| SB_RS_LA | 6 | 9 | 7 | 118.86 | 3600 | 352.47 | 3600 | 118.86 | 3600 | [570, 210, 390, 390, 570, 210, 390, 570, 390, 930, 390, 390, 390, 570, 390, 570] |
| SB_RS_LA | 7 | 9 | 7 | 244.96 | 3600 | - | 3600 | 244.96 | 3600 | [210, 570, 390, 750, 210, 210, 570, 570, 210, 750, 30, 390, 390, 570, 570, 390] |
| SB_RS_LA | 8 | 9 | 7 | 85.12 | 3600 | 811.11 | 3600 | 28.38 | 3600 | [210, 390, 570, 570, 210, 210, 390, 30, 570, 390, 390, 390, 570, 570, 210, 570] |
| SB_RS_LA | 9 | 9 | 7 | 219.11 | 3600 | 766.65 | 3600 | 116.59 | 3600 | [750, 570, 570, 570, 390, 1110, 30, 570, 210, 570, 210, 570, 390, 570, 210, 570] |
| SB_RS_LA | 10 | 9 | 7 | 221.60 | 3600 | - | 3600 | 116.59 | 3600 | [30, 390, 570, 210, 390, 210, 930, 390, 210, 390, 390, 570, 390, 570, 30, 390] |
| SB_RS_LA | 1 | 9 | 8 | 388.62 | 3600 | - | 3600 | 122.45 | 3600 | [30, 570, 210, 210, 30, 30, 390, 390, 210, 210, 210, 30, 210, 210, 750, 210] |
| SB_RS_LA | 2 | 9 | 8 | 238.78 | 3600 | - | 3600 | 119.74 | 3600 | [210, 210, 30, 570, 210, 570, 30, 30, 390, 750, 210, 30, 570, 210, 390, 30] |
| SB_RS_LA | 3 | 9 | 8 | 113.44 | 3600 | 272.46 | 3600 | 113.44 | 3600 | [210, 570, 30, 570, 570, 390, 30, 930, 390, 570, 570, 30, 390, 750, 210, 750] |
| SB_RS_LA | 4 | 9 | 8 | 317.44 | 3600 | - | 3600 | 131.50 | 3600 | [210, 930, 570, 30, 210, 30, 390, 930, 210, 750, 570, 30, 390, 30, 390, 210] |
| SB_RS_LA | 5 | 9 | 8 | 200.97 | 3600 | - | 3600 | 113.44 | 3600 | [30, 210, 390, 570, 570, 30, 210, 210, 570, 570, 210, 210, 390, 210, 210, 570] |
| SB_RS_LA | 6 | 9 | 8 | 159.84 | 3600 | 1101.55 | 3600 | 116.71 | 3600 | [390, 390, 30, 390, 30, 750, 390, 1110, 570, 30, 210, 750, 570, 30, 390, 210] |
| SB_RS_LA | 7 | 9 | 8 | 174.31 | 3600 | 507.07 | 3600 | 113.80 | 3600 | [750, 210, 390, 570, 570, 210, 30, 750, 390, 390, 750, 390, 210, 210, 210, 570] |
| SB_RS_LA | 8 | 9 | 8 | 184.13 | 3600 | 765.34 | 3600 | 115.76 | 3600 | [750, 750, 210, 210, 210, 210, 930, 390, 390, 30, 390, 30, 390, 210, 390, 570] |
| SB_RS_LA | 9 | 9 | 8 | 112.33 | 3600 | 335.99 | 3600 | 112.33 | 3600 | [390, 390, 210, 570, 390, 750, 30, 210, 210, 750, 210, 570, 570, 390, 570, 30] |
| SB_RS_LA | 10 | 9 | 8 | 116.71 | 3600 | - | 3600 | 116.71 | 3600 | [390, 750, 1110, 930, 750, 210, 30, 210, 570, 750, 210, 570, 390, 210, 570, 570] |
Disclaimer/Publisher’s Note: The statements, opinions and data contained in all publications are solely those of the individual author(s) and contributor(s) and not of MDPI and/or the editor(s). MDPI and/or the editor(s) disclaim responsibility for any injury to people or property resulting from any ideas, methods, instructions or products referred to in the content. |
© 2025 by the authors. Licensee MDPI, Basel, Switzerland. This article is an open access article distributed under the terms and conditions of the Creative Commons Attribution (CC BY) license (https://creativecommons.org/licenses/by/4.0/).
Share and Cite
Mohabbati-Kalejahi, N.; Alavi, S.; Toragay, O. A Mixed-Integer Programming Framework for Drone Routing and Scheduling with Flexible Multiple Visits in Highway Traffic Monitoring. Mathematics 2025, 13, 2427. https://doi.org/10.3390/math13152427
Mohabbati-Kalejahi N, Alavi S, Toragay O. A Mixed-Integer Programming Framework for Drone Routing and Scheduling with Flexible Multiple Visits in Highway Traffic Monitoring. Mathematics. 2025; 13(15):2427. https://doi.org/10.3390/math13152427
Chicago/Turabian StyleMohabbati-Kalejahi, Nasrin, Sepideh Alavi, and Oguz Toragay. 2025. "A Mixed-Integer Programming Framework for Drone Routing and Scheduling with Flexible Multiple Visits in Highway Traffic Monitoring" Mathematics 13, no. 15: 2427. https://doi.org/10.3390/math13152427
APA StyleMohabbati-Kalejahi, N., Alavi, S., & Toragay, O. (2025). A Mixed-Integer Programming Framework for Drone Routing and Scheduling with Flexible Multiple Visits in Highway Traffic Monitoring. Mathematics, 13(15), 2427. https://doi.org/10.3390/math13152427