Article

Incentive Scheme for Low-Carbon Travel Based on the Public–Private Partnership

1
Shenzhen Campus of Sun Yat-sen University, Sun Yat-sen University, Shenzhen 518100, China
2
Guangdong Key Laboratory of Intelligent Transportation Systems, School of Intelligent Systems Engineering, Sun Yat-sen University, Guangzhou 510275, China
*
Author to whom correspondence should be addressed.
Mathematics 2025, 13(15), 2358; https://doi.org/10.3390/math13152358
Submission received: 2 July 2025 / Revised: 18 July 2025 / Accepted: 20 July 2025 / Published: 23 July 2025

Abstract

This paper proposes an incentive scheme based on a public–private partnership (PPP) to encourage low-carbon travel behavior by inducing the mode choice shift from private cars to public transit. The scheme involves three key entities: travelers, the government, and the private sector. Travelers can choose between private cars and public transit, producing different emissions. As the leader, the government aims to reduce total emission to a certain level with limited budgets. The private sector, as an intermediary, invests subsidies in low-carbon rewards to attract green travelers and benefits from a larger user pool. A two-layer multi-objective optimization model is proposed, which includes travel time, monetary cost, and emission. The objective of the upper level is to maximize the utilities of the private sector and minimize social costs to the government. The lower layer is the user equilibrium of the travelers. The numerical results obtained through heuristic algorithms demonstrate that the proposed scheme can achieve a triple-win situation, where all stakeholders benefit. Moreover, sensitivity analysis finds that prioritizing pollution control strategies will be beneficial to the government only if the unit pollution control cost coefficient is below a low threshold. Contrary to intuition, larger government subsidies do not necessarily lead to better promotion of low-carbon travel.

1. Introduction

As global industrialization and urbanization progress, emission pollution has become a widely concerning issue. Data show that the transportation sector accounts for over 20% of global emission, and this proportion is expected to double by 2050, with road traffic contributing over 70% [1,2]. Meanwhile, the continuous increase in car ownership has led to congestion, resulting in a significant loss of time. In 2021, US drivers spent 3.4 billion hours and over USD 53 billion in traffic congestion [3]. Therefore, deploying and expanding public transportation is critical for reducing carbon emission and traffic congestion, necessitating policy interventions to encourage a shift toward public transit.
Many sectors have adopted strategies to promote the development of public transportation. Among them, the sustainment of public transportation services through government subsidies is a practice worldwide [4]. By subsidizing travelers or operators, passengers benefit from discounted fares [5] or improved services, encouraging the shift towards public transportation. Operators can mitigate operational losses through financial aid [6]. However, sustained financial outlays pressure government budgets and debt burdens. Moreover, the efficacy of subsidies is often limited, easily leading to a heavy reliance on financial support. For example, in 2020, Beijing Subway operational expenses averaged CNY 13.05 per capita per time, significantly exceeding fare revenues. The governmental subsidy of CNY 8.5 per capita per time has increased to address this deficit, totaling CNY 26.2 billion in 2022. Despite these subsidies, the subway reported a net loss of CNY 24.1 billion (13 July 2025, https://www.chinamoney.com.cn/chinese/cwbg/20230428/2615364.html). Therefore, it is appealing for the government to attract social capital into the market through collaborative frameworks to enhance the effectiveness of subsidies by leveraging resources, technologies, and management [7], thereby alleviating its financial burden and influencing travel behaviors more effectively.
At the same time, international acts and national regulations on emission reduction have emerged to face global warming. As the groundwork for market-based tools to cut emissions, Article 17 of the Kyoto Protocol defines “carbon emission trading” as a tradable quota system and established the Clean Development Mechanism (CDM). It is worth noting that choosing public transport over driving can reduce carbon emissions by 2737.5 kg per year, which is equivalent to planting 152 trees (13 July 2025, https://earthbound.report/2018/10/15/the-hierarchy-of-sustainable-transport/). In line with this focus, the USA–California Cap-and-Trade Program (CARB), Korea Emissions Trading Scheme (K-ETS), and China Carbon Emission Trade Exchange (CCETE) all cover the transportation sector. The EU Emissions Trading System 2 (EU ETS 2) targeting road transport is also under development. China’s Interim Regulations on Carbon Emission Trading explicitly stipulate that ecological environment authorities should take the lead, while promoting public supervision and information sharing. Beyond regulatory frameworks, international consensus has increasingly emphasized the need for collaborative models to drive low-carbon transportation. The 2024 UN ITC strategy for reducing greenhouse gas emissions from inland transport reaffirmed the need for cooperation among all relevant stakeholders, with the PPP model highlighted as a key approach. Under the guidance of the UN, the general PPP model has been widely adopted and developed: Japan’s PFI Act clarifies the rights and obligations of all parties in PPP projects, the UK has established a dedicated advisory body to support PPP initiatives, South Korea has enacted the Act on Promoting Private Capital Participation in Social Infrastructure Investment to regulate PPP implementation, and China has issued the Opinions of the State Council on Encouraging and Guiding Private Capital Participation in Infrastructure Construction and Other Projects to incentivize private sector involvement. Policies, regulatory measures, and carbon trading systems have significantly increased the likelihood of introducing the PPP into low-carbon transportation. Several trials are underway. Singapore is promoting green travel through the Heavy Vehicle Zero Emission Scheme (HVZES) and the Electric Heavy Vehicle Charging Grant (EHVCG). The new policy provides financial incentives specifically for buses. China has launched a low-carbon travel project called Mobility-as-a-Service (MaaS), which encourages citizens to participate in green travel through a credits-for-rewards system. As a typical PPP model, it is jointly launched by the Beijing Municipal Commission of Transport, the Beijing Municipal Ecology and Environment Bureau, and private companies such as AutoNavi Maps. By 2022, the number of MaaS users had exceeded 1 million.
This study introduces a public–private partnership (PPP) with low-carbon rewards in transportation management. Specifically, the government subsidizes the private sector, which offers low-carbon rewards to transit travelers based on subsidies and operational capacity. In turn, the private sector benefits from the number of transit travelers. Through public–private collaboration, this scheme enhances the effectiveness of government subsidies and the attractiveness of incentive policies for travelers, effectively inducing low-carbon travel and reducing emission from private vehicles, thus achieving a triple-win situation for the government, private sector, and travelers. It can offer a new perspective on traditional incentive schemes, which typically involve only the government or enterprises. Moreover, the theoretical and numerical studies can provide useful policy insights for local transport authorities to promote green travel.
This study is organized as follows: Section 2 reviews relevant literature. Section 3 models the benefits of multiple participants under the PPP scheme. Section 4 compares different schemes and conducts a sensitivity analysis. Section 5 concludes the study and offers future directions.

2. Literature Review

This section reviews subsidy-related policies and the public–private partnership (PPP) model. The main contributions and highlights of this study are also summarized in this section.

2.1. Transit Subsidy Policy to Induce Travel Mode Shifts

Subsidizing public transportation is a widely adopted strategy to incentivize changes in travel behavior. Existing research predominantly considers optimization objectives from the perspective of individual travelers or public transportation operators.
Subsidies directed at individual travelers reduce their travel expenses, promoting the adoption of public transportation. For example, ref. [8] demonstrated that public transportation subsidies positively influence commuters’ choices to use public transportation. Additionally, researchers have investigated specific factors affecting travel mode choices. Ref. [9] found that public transportation service quality is a critical factor influencing mode choice under subsidy policies, thus revealing the interplay between subsidies and service quality. Ref. [10] analyzed the impact of personalized incentives on travel behavior during peak hours, demonstrating that monetary incentives effectively motivate travelers to shift their trips away from peak periods, thereby reducing overall travel time. Ref. [11] developed an incentive mechanism to adjust commuters’ travel time, incorporating constraints related to incentive availability, market penetration, and user heterogeneity, and validated its efficiency under budget constraints.
Subsidies directed at public transportation operators aim to improve service quality and attract passengers, with the primary objectives of minimizing costs for operators or maximizing social welfare. Ref. [12] introduced an innovative traffic subsidy allocation scheme that used a fixed budget model and could meet multiple policy objectives. Ref. [13] explored the effectiveness of government subsidies in promoting the adoption of battery electric buses (BEBs) and reducing carbon dioxide emissions. Ref. [14] considered not only bus operator costs but also user costs, developing a bus operator model subject to fiscal budget constraints. This model has become a foundational framework in transport economics for analyzing bus operating issues. Additionally, other studies integrated factors including land rent revenue [15], competitive market [16], social welfare [17], and service level [9] into their models.
However, subsidy approaches result in a substantial fiscal burden on the government [18,19,20]. In addition, previous studies have predominantly focused on the government, overlooking the willingness of other stakeholders to promote public transportation and reduce vehicle emissions. Furthermore, quantitative analyses of the participation of private capital in public transportation are rare [21,22].

2.2. Literature Flow on Public–Private Partnership

Public–private partnership (PPP) emerged in the 1980s in the United Kingdom. Broadly defined, PPP represents a long-term collaboration between the public and private sectors to provide public services that involve the joint development of products and services, risk sharing, and revenue distribution [23]. The strength of PPP is the promotion of complementary strengths between stakeholders through coordinated efforts and mutual supervision.
The PPP model is widely applied in large-scale public infrastructure projects. Examples include the 1996 Barcelona Olympics, the 1998 FIFA World Cup in France, the National Stadium for the 2008 Beijing Olympics, and the Beijing Subway Line 4 [24]. The resulting fiscal strain could disrupt financial liquidity and preclude investment in other essential public services [22]. The involvement of capital, management, and technology from the private sector alleviates fiscal pressure on the government and improves the quality and service standards of public infrastructure. Simultaneously, it creates new revenue opportunities for private enterprises [7,25,26]. Furthermore, the work of [27] provides a theoretical basis for a sound regulatory environment for PPP operations. Many countries and regions are also attempting to implement regulatory methods related to PPP, carbon trade, and transportation, such as China’s MaaS [28], the Singapore Green Plan 2030 (www.greenplan.gov.sg), and Japan’s Sustainable Smart Town (SST) (13 July 2025, https://news.panasonic.com/global/zh-CHS/stories/17225).
The PPP model holds significant potential for energy conservation and emission reduction in global warming. For instance, [25] investigated the impact of public–private partnerships in energy projects and energy efficiency on CO2 emission in China and found a positive influence. Ref. [29] concluded that increasing private capital investment in passenger-centered public transportation can reduce fuel consumption and carbon emission. Existing transportation PPP projects focus on financing, investment, construction, and operation of green transportation infrastructure, as exemplified by [30], which applies PPP to invest in, build, and operate shared bikes, with Weifang City in Shandong Province serving as a case study. However, limited research has explored the potential of PPP in inducing green travel behaviors.
The successful implementation of the PPP model encounters several challenges, with the necessity of developing effective subsidy and incentive mechanisms tailored to the private sector. When appropriately designed, these mechanisms can attract more private sector participants. Ref. [31] guaranteed the long-term sustainability of projects [32]. Ref. [33] points out that interactions between private sector entities, or between private sector entities and their regulatory authorities, are an increasingly important issue. It should be noted that conflicts of interest can lead to opportunistic behavior in the private sector [27,34]. As noted in [35], in a typical PPP setting, the two collaborators exhibit conflicting motivations, but align on a shared objective (i.e., completing the project). The public sector aims for welfare maximization, whereas the private partner is driven by potential profitability [36]. This study acknowledges such challenges and incorporates relevant constraints into the subsidy design and incentive mechanism models to mitigate these risks.
In summary, the PPP model is currently widely used in infrastructure construction and investment. The literature indicates that the PPP model has potential in reducing transportation emissions, while subsidy policies are also effective in promoting low-carbon travel. However, few researchers have combined the advantages of both to design low-carbon travel incentive mechanisms. Additionally, speculative behavior in the private sector, such as exaggerating costs or misappropriating funds [36], is rarely considered in incentive mechanism design.

2.3. Contributions and Highlights

Based on literature research, this paper focuses on the context of low-carbon travel and proposes a PPP-based incentive. The main contributions and highlights of this research are listed as follows.
  • First, few studies have introduced the PPP model into the design of low-carbon travel incentive mechanisms. A similar approach was proposed in [37], which suggested a tradable carbon credit mechanism based on public–private partnerships to reduce congestion and carbon emissions. However, they only considered enterprises and homogeneous travelers, whereas this paper further incorporates roles such as banks and financial institutions and considers heterogeneous travelers, which is more in line with reality. Additionally, the government in this paper can choose pollution control strategies in addition to subsidies.
  • Second, many studies simply suppose that travelers are homogeneous [9,38,39], which is an idealized assumption. This study examines heterogeneous travelers with different values of time (VOTs) and travel demand at different levels, providing a comprehensive discussion of travel mode choices between the low-carbon group and the high-carbon group and enhancing the alignment with real-world scenarios.
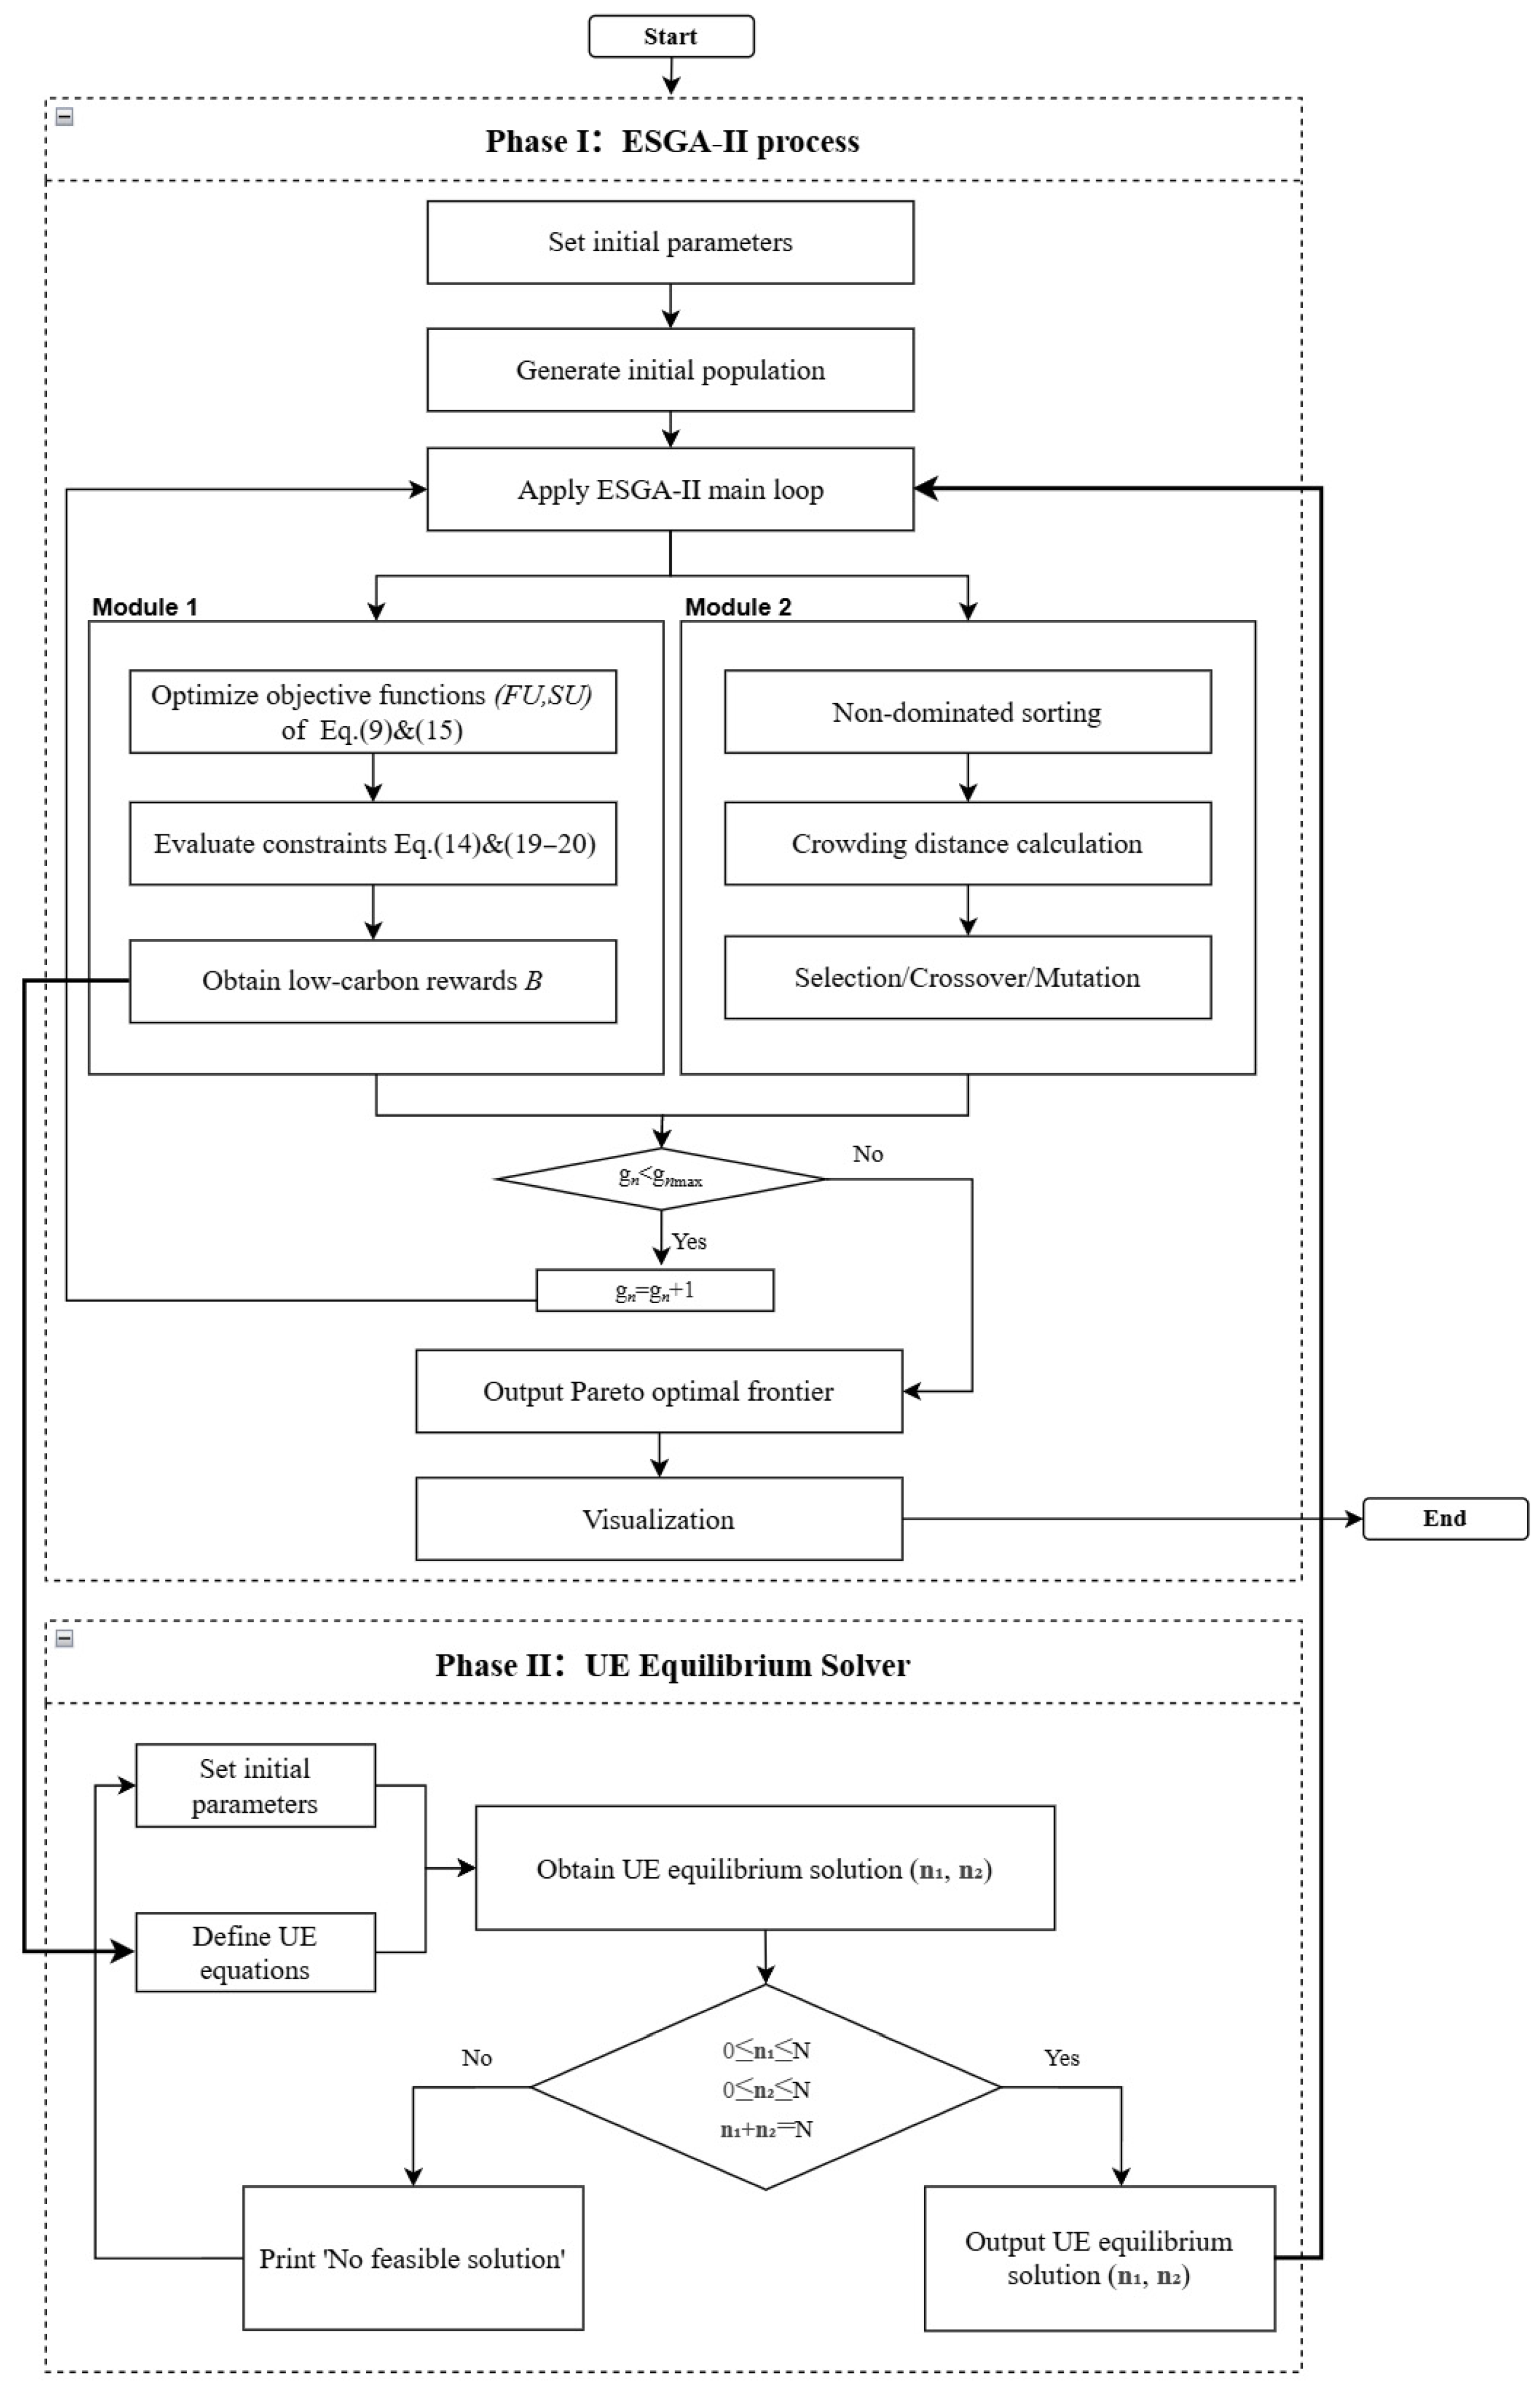
  • Third, this paper develops a two-layer optimization algorithm based on the improved NSGA-II heuristic algorithm, with a user equilibrium solver embedded in the lower layer. The algorithm is suitable for solving optimization problems related to the mathematical model of PPP.

3. Model Formulation

Figure 1 illustrates the framework and the relationships among travelers, the private sector, and the government. The government subsidizes the potential private sector to participate in the promotion of low-carbon travel. The private sector leverages these subsidies to incentivize travelers to adopt low-carbon modes through attractive low-carbon rewards.
This study considers a single OD system with a total travel demand. Each traveler is presumed to choose between a high-carbon transportation mode (e.g., private car) and a low-carbon alternative (e.g., public transit), resulting in distinct emission levels. Depending on the total emission generated, the government strategically allocates its constrained budget between direct pollution treatment measures and indirect subsidies to the private sector, aiming to minimize the total social cost associated with emission reduction. The private sector comprises financial institutions, enterprises, and a carbon platform. Subsidized by the government, they will develop highly qualified and diversified low-carbon rewards for transit travelers. In turn, this also brings potential benefits to the private sector. The value of low-carbon rewards is determined by the level of service of financial institutions A, the level of participation of enterprises p, and the level of development of the carbon platform q. Take China’s Ant Forest as an illustrative example. Banks collaborating with Alipay, as financial institutions, provide the legal qualifications required for carbon trading. Enterprises, including Alibaba and the China Green Foundation, offer various products such as a box of apples as material incentives or e-medals as moral incentives. Ant Forest, as a carbon platform, is responsible for recording and accounting for the equivalent low-carbon rewards earned from low-carbon travel activities. While enhancing A, p, and q requires increased investment and operational costs, it also allows them to benefit from a scale effect of the increased number of transit travelers, higher frequency of Alipay usage, and extended browsing time.
The following sections will describe the cost composition and decision variables for the three stakeholders involved: travelers, the private sector, and the government.

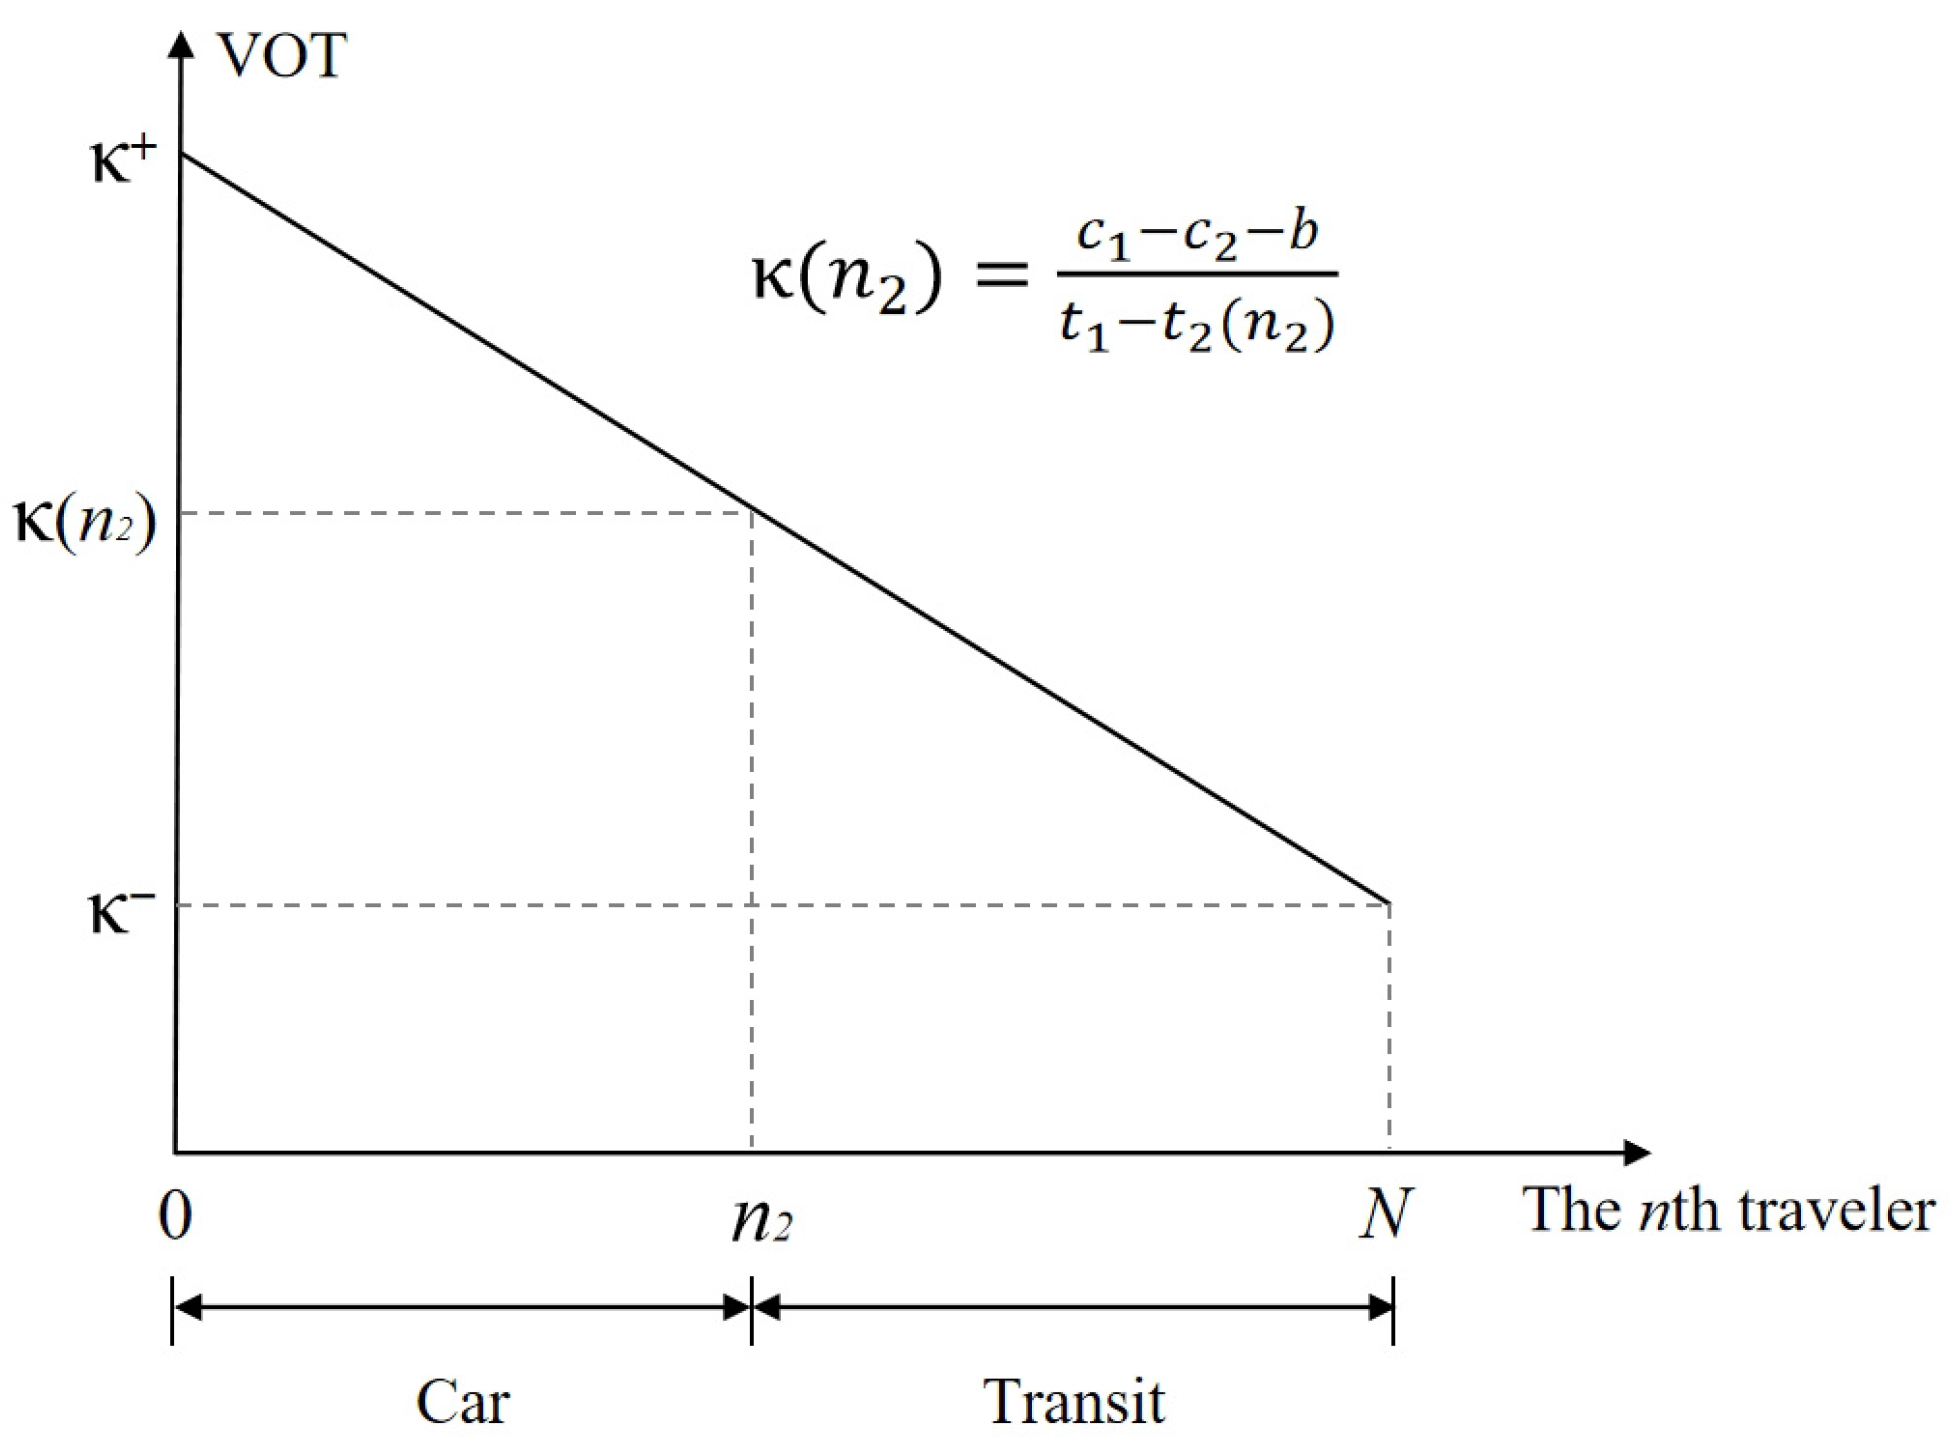
3.1. User Equilibrium of Heterogeneous Travelers

This paper supposes that travelers have heterogeneous VOT, which follows a continuous distribution characterized by a cumulative distribution function, denoted as κ F κ . F κ is assumed to be strictly increasing and differentiable over its support κ , κ + , and the corresponding probability density function is represented by f κ = F κ . Furthermore, all travelers according to their VOT in descending order are labeled, where κ n denotes the VOT of the nth traveler. It can be assumed that κ n is continuous and differentiable. Clearly, κ n 0 . The relationships between κ n and F κ and κ n and f κ are given in the following Equations (1) and (2):
κ n = F 1 1 n N
κ n = 1 N f κ n
Travel costs generally include time and monetary components. The key distinction between high-carbon and low-carbon travel modes is the eligibility for low-carbon benefits. Specifically, only transit travelers can gain such low-carbon rewards b. The travel costs for low-carbon and high-carbon travel are formally expressed in the following Equations (3) and (4):
T C n , 1 = κ n t 1 + c 1 b
T C n , 2 = κ n t 2 + c 2
where T C n , 1 and T C n , 2 respectively represent the travel costs associated with taking public transit and driving a private car for the nth traveler with the heterogeneous value of time (VOT) represented by κ n 0 .
In Equation (3), the transit travel time t 1 is assumed to be constant, and the monetary cost is denoted by c 1 . Each traveler who chooses public transit can receive a reward b, the size of which is determined by the private sector. In Equation (4), the car travel time t 2 follows the BPR function, expressed as the following Equation (5):
t 2 n 2 = t 0 1 + α n 2 V β
The monetary costs for car travel include fuel and insurance fees, denoted by c 2 . Notably, car travelers are not eligible for any reward. n 1 and n 2 represent the total number of transit and car travelers, respectively, which must satisfy the fixed travel demand N as specified in Equation (6) and the non-negativity constraints as delineated in the following Equation (7):
n 1 + n 2 = N
n 1 , n 2 0
We further reasonably assume the following:
Assumption A1.
For each traveler, the travel time by transit is always larger than that by car. The monetary cost difference between car and transit travel lies within the range defined as κ t 1 t 2 N < c 2 c 1 < κ + t 1 t 2 0 b , where b is the low-carbon rewards provided by the private sector.
Assumption A2.
Each traveler is a rational agent who makes mode-choice decisions to minimize their individual travel cost.
According to Wardrop’s principle, travelers will always choose the travel mode that minimizes their individual travel costs. Under user equilibrium, no traveler can further reduce individual travel costs by unilaterally altering their travel behavior. Therefore, for the nth traveler, the travel cost is
T C n = min i 1 , 2 T C n , i , n 0 , N
Equation (8) is always satisfied in equilibrium. In extreme cases, when one travel mode i significantly outweighs another mode i , for n 0 , N , there are n i = N , n i = 0 and T C n , i < T C n , i .
Under the user equilibrium, there is B n 1 = κ n 2 t 1 t 2 n 2 + c 1 c 2 , n 2 = N n 1 . Let n 1 take the first-order derivative of the low-carbon rewards B; there is n 1 B = 1 b + n 1 κ n 1 t 1 t 2 κ t 2 n 1 . Since κ n 1 > 0 , t 2 n 1 < 0 , κ > 0 , t 1 t 2 > 0 , it is obvious that n 1 B > 0 . It can be seen that providing low-carbon rewards to travelers is an effective means of promoting low-carbon travel.
Lemma 1.
Given different values of low-carbon rewards b, the following results can be derived (Figure 2):
(1) If c 1 c 2 + κ t 1 t 2 N < b < c 1 c 2 + κ + t 1 t 2 0 , then κ n 2 = c 1 c 2 b t 1 t 2 n 2 . Travelers with VOT κ κ n 2 choose to take the transit, while travelers with VOT κ > κ n 2 choose to drive cars.
(2) If b < c 1 c 2 + κ t 1 t 2 N , n 2 = N , then κ n 2 = κ . All travelers choose to drive cars.
(3) If b > c 1 c 2 + κ + t 1 t 2 0 , then n 2 = 0 and κ n 2 = κ + . Thus, all travelers choose to take the transit.

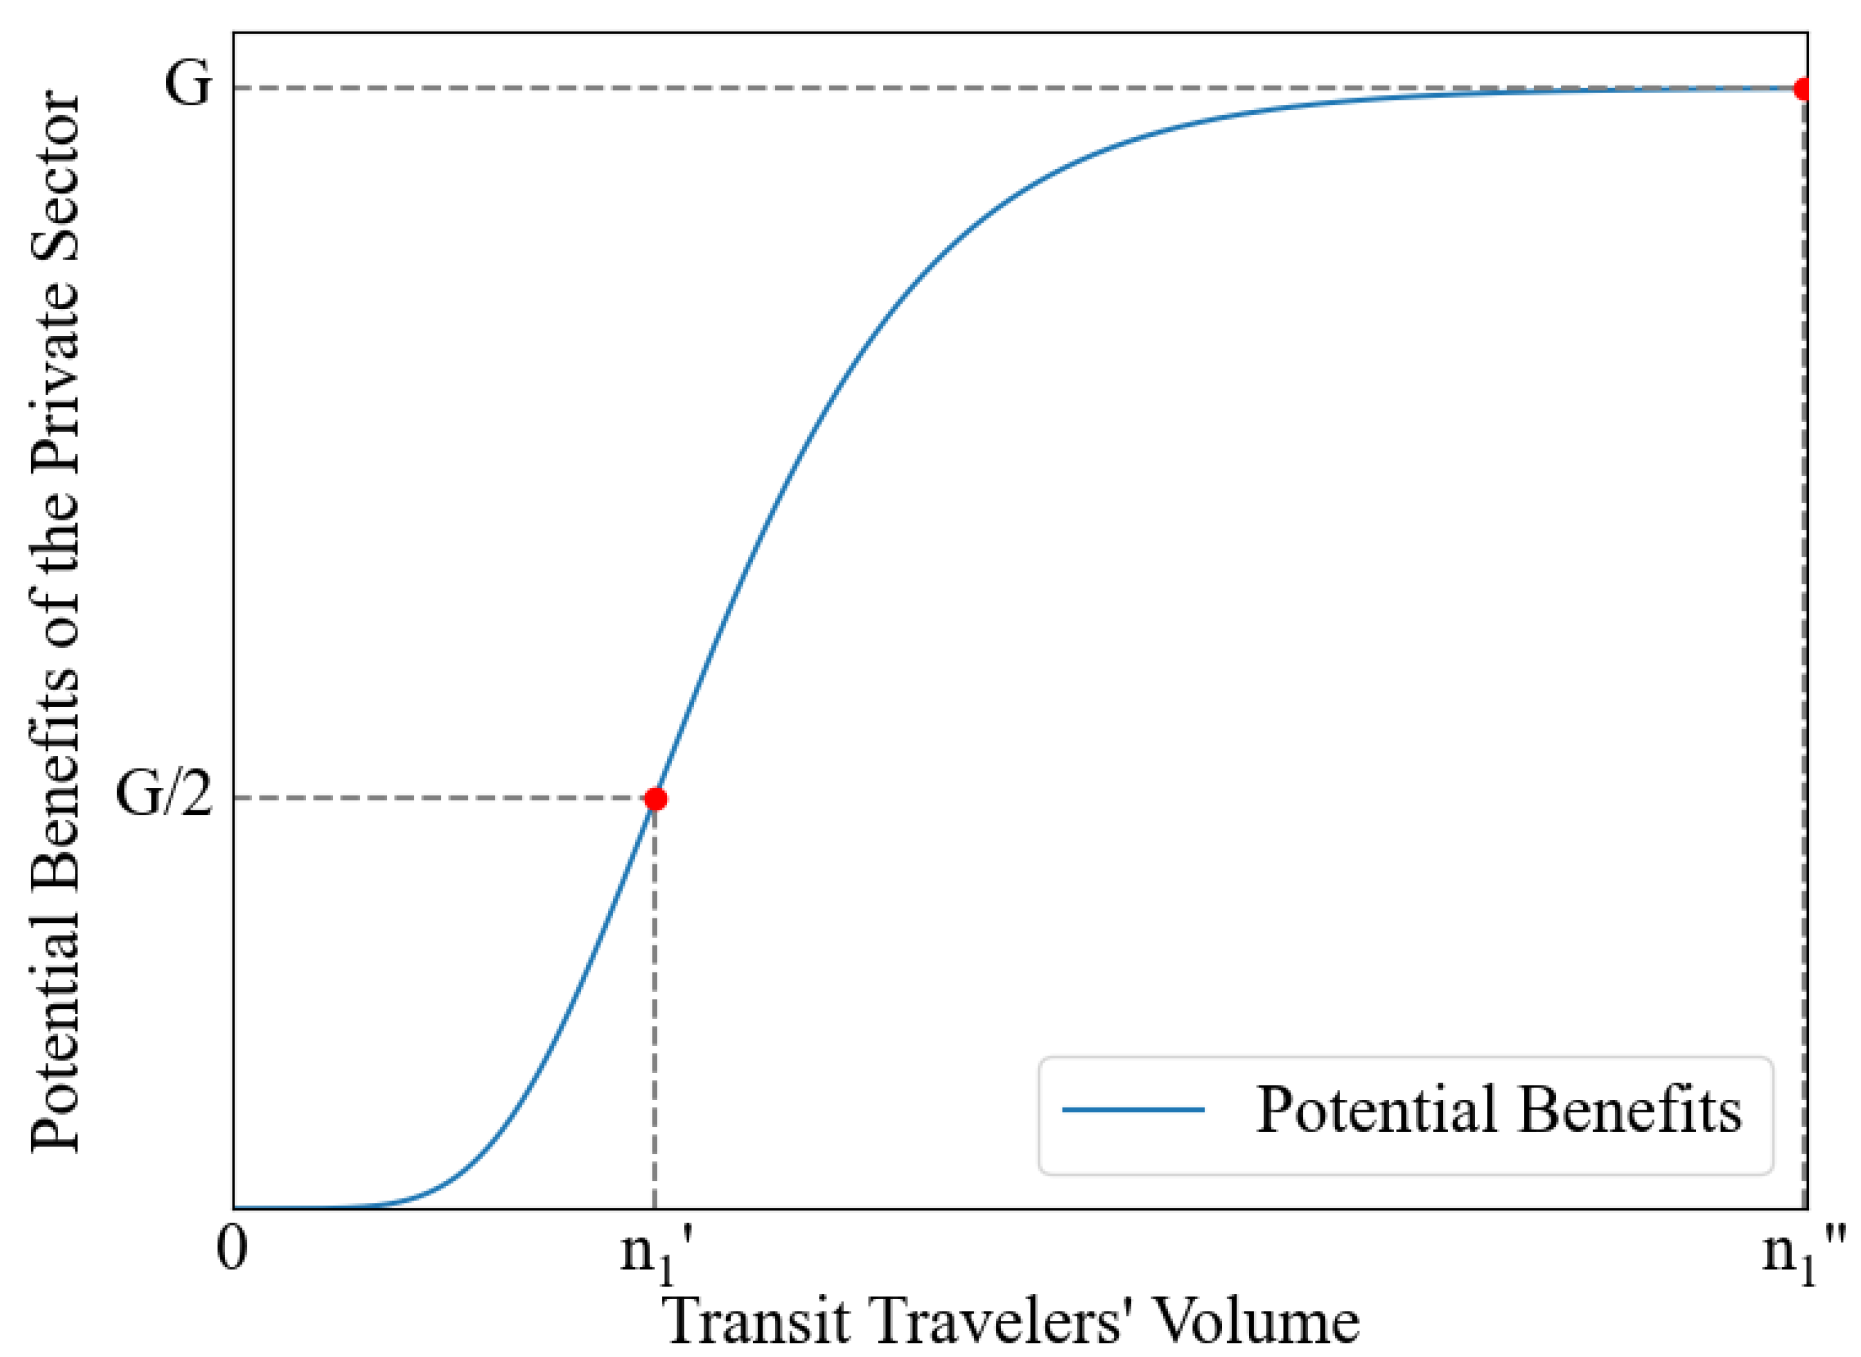
3.2. The Utility of the Private Sector

The private sector mentioned in this article consists of financial institutions, enterprises, and a carbon platform. They work together to promote green travel by sharing the investment cost of low-carbon rewards B A , p , q and gaining government subsidies S s , n 1 as well as the potential benefits of flow scale G A , p , q . Their decision-making goal is to maximize the utility F U , as shown in Equation (9).
max A , p , q F U = B A , p , q + S s , n 1 + G A , p , q
Following the methodology of [40], the participation level of enterprises p 0 , 1 , the development level of the carbon platform q 0 , 1 and the service level of financial institutions A are regarded as the “inputs”. The costs invested into the low-carbon rewards B are considered as the “outputs”. Then, a Cobb–Douglas production function can be formulated, as shown in Equation (10). In addition, the private sector’s low-carbon investment cost B is the sum of each traveler’s low-carbon rewards b, as follows:
B A , p , q = A p e q f = n 1 b
where e and f are predetermined parameters. Consequently, the low-carbon rewards b for each traveler is calculated as the following Equation (11):
b = B n 1
In this framework, the private sector deserves governmental subsidies S s , n 1 , which are positively correlated with the number of transit travelers and the government’s unit subsidy s, as shown in the following Equation (12):
S s , n 1 = s n 1
An increase in p, q, and A could attract more transit travelers n 1 , which will generate potential profits G A , p , q for the private sector, such as increased utilization of payment functions, enhanced social responsibility image, and higher sales of other products. Given the paucity of research on the economy of flow scale, an S-curve can be used to model the relationship between transit flows and the private sector’s potential benefits. The S-curve has been widely used in population growth studies and resource-constrained systems analyses in competitive market environments [41]. Its wide application in related fields proves its theoretical validity and practical significance. In the context of urban development, the S-curve has been successfully used to model resource allocation patterns and growth trends, effectively capturing the intricate interactions between various factors [42]. In this context, this paper refers to the work in [43], which applied an improved logistic model related to Cobb–Douglas input factors, and then modifies the formulation based on A , p , q in the PPP framework (13).
G A , p , q = K A p q A + K A e r n 1 + h
Here, K, h, and r are non-negative constants. The parameters affect the potential benefits in the following ways. With other parameters unchanged, G increases with K. The slope of the function G increases with r, and the value of h affects the inflection point. This model captures the non-linear relationship between transit flow and its potential benefits. The S-growth curve provides insights into how the private sector’s potential benefits vary across different investment scales [44]. As illustrated in Figure 3, when 0 n 1 n 1 , the potential benefits increase at an accelerating rate as the number of transit travelers grows. When n 1 n 1 n 1 , the potential benefits continue to grow but at a slower rate, suggesting that the marginal benefits to the private sector will decrease.
Additionally, in case of opportunistic behavior, Equation (10) must satisfy the following constraint expressed in Equation (14), which ensures that the low-carbon rewards provided by the private sector to each transit traveler exceed the subsidies provided by the government that directly function as rewards, as follows:
b S n 1
Assumption A3.
The precondition for successfully implementing the PPP strategy is that the private sector remains profitable. The private sector’s utility must always be positive, denoted as F U > 0 .

3.3. The Social Cost of the Government

The government optimum is to minimize social cost, which considers four parts: total travel cost t t n 1 , subsidies to the private sector S s , n 1 , cost of pollution control C ( γ , E ) , and the loss of social welfare W ( γ , E ) .
min γ , s S C = t t n 1 + S s , n 1 + C ( γ , E ) + W ( γ , E )
In Equation (15), total travel cost t t n 1 is an integral function of the travel cost of heterogeneous travelers, as follows:
t t n 1 = n 2 * N T C n , 1 d n + 0 n 2 * T C n , 2 d n = t 1 n 2 * N κ n d n + t 2 n 2 * 0 n 2 * κ n d n + c 1 b N n 2 * + c 2 n 2 *
where n 2 * is the total number of car travelers in the equilibrium travel flow and κ n is the heterogeneous value of time of the nth traveler.
The cost of pollution control is positively correlated with the degree of government efforts to control pollution γ 0 , 1 and the remaining emission E under the PPP incentive mechanism, which is formulated as C ( γ , E ) = π γ E . Here, π is the unit cost of direct pollution control (RMB/g), which is a given parameter.
As is well known, emission pollution adversely affects human health and socio-economic development. It can be defined as a loss of social welfare, which is correlated with the total carbon emission level [45,46], and can be formulated as W ( γ , E ) = m ( 1 γ ) E . Here, m is the unit loss of social welfare caused by emission pollution (RMB/g), a given parameter.
The emission generated by cars on an O-D section is denoted by a separable emission function e n 2 . This emission function is widely adopted. For example, the following emission function e n 2 (g/veh) presented in Equation (17) is used in TRANSYT-7F [47,48]:
e n 2 = 0.2038 · t 2 n 2 · exp 0.7962 · l t 2 n 2
Assuming that public transportation in this study is a zero-emission travel mode, the total carbon emission in equilibrium is only related to car travelers. It is formulated as shown in Equation (18).
E = e n 2 · n 2 = 0.2038 · t 2 n 2 · exp 0.7962 · l t 2 n 2 · n 2
In the benchmark, let E ¯ denote the total carbon emission without any intervention from the government or the private sector. Denote ρ 0 , 1 as the emission reduction percentage set by the government. The remaining emission must be less than that without intervention, as prescribed in Equation (19), and the government budget is constrained in reality, as illustrated in the following Equation (20):
E γ E ρ E ¯
0 π γ E + S C b g t
where γ E represents the remaining amount of emission after direct pollution control and C b g t denotes the upper limit of the government budget allocated for this purpose.

4. Numerical Studies

This section compares and analyzes the results of the four schemes to demonstrate the superiority of the proposed PPP scheme. Discussion on the possibility of opportunistic behavior and the sensitivity analysis of key variables and parameters is also included.

4.1. Solving Algorithm

This paper proposes a two-stage optimization algorithm based on the NSGA-II heuristic algorithm. Phase I is used to solve multi-objective optimization problems for the government and the private sector, and Phase II obtains the user equilibrium solution for travelers through a solver. The algorithm flowchart for the PPP scheme is shown in Figure 4, where g n denotes the iteration count and g n m a x denotes the maximum iteration count. The key to this algorithm lies in transferring the low-carbon reward B from Phase I to Phase II and then passing the user equilibrium solution obtained in Phase II back to Phase I. This process is repeated iteratively until a Pareto solution for the dual-objective optimization is ultimately obtained.

4.2. Parameters Setting

Consider a single O-D pair with three distinct travel demands of N = 1000 , 1500 , 2000 , representing high, medium, and low travel demand levels. Each traveler chooses between two transportation modes: public transit and private car. As referenced in [46,49], the details of all parameters are provided in Table 1.

4.3. Comparison of Different Schemes

To further clarify the distinct roles and functions of the government and the private sector within the PPP-PTCS scheme, a comparative analysis of the following four scenarios is conducted, as illustrated in Table 2.
  • The benchmark scheme P 0 : Neither the government nor the private sector engages in low-carbon incentives. This scenario produces the highest carbon emissions and serves as a reference group for the other three scenarios.
  • The government-led scheme P 1 : The government directly subsidizes travelers without the participation of travelers.
  • The private sector-led scheme P 2 : The government is not involved in PPP, i.e., S = 0 . Instead, the private sector is responsible for distributing carbon reduction rewards B directly to travelers.
  • The PPP scheme P 3 : Both the government and the private sector participate in low-carbon regulation as prescribed. The government provides subsidies s n 1 to the private sector, which subsequently provides low-carbon rewards B to travelers. Moreover, the government can allocate budget resources for direct pollution control.
Suppose that the emission reduction target of the government is set at ρ = 50 % , and the outcomes of varying travel demand scenarios, namely N = 1000 , 1500 , 2000 , are detailed in Table 3.
Among all the schemes, the proposed PPP scheme P 3 achieves a win–win–win situation with optimal social costs, maximized private sector profits, and the highest number of low-carbon travelers, resulting in the largest emission reduction rate. From the carbon emission reduction goal of the government, it is better to subsidize the private sector rather than engage in direct pollution control. From the private sector’s perspective, collaborating with the government increases its revenue F U , which exceeds that under the private sector-led scheme P 2 . From the traveler’s perspective, low-carbon travelers under the P 3 scheme are rewarded with the highest low-carbon rewards. In conclusion, the government, the private sector, and travelers all benefit from the PPP scheme.
Specifically, this research find the following:
(1)
The government-led scheme P 1 exhibits the smallest number of low-carbon travelers n 1 and the lowest volume of low-carbon rewards b, while requiring the highest level of actual effort for direct pollution control γ and social cost S C . It indicates that relying exclusively on government initiatives to promote low-carbon travel imposes a substantial financial burden on the government. Therefore, the government should collaborate with the private sector and leverage the existing resources.
(2)
In the private sector-led scheme P 2 , there is a significant increase in both the number of low-carbon travelers and the profits of the private sector compared with the government-led scheme P 1 . The private sector’s profits are even higher in the PPP scheme P 3 . This indicates that the private sector is more willing to collaborate with the government.
(3)
Additionally, the PPP scheme P 3 achieves emission reduction that exceeds the target ( Δ E = 60.77 % , 63.85 % , 65.63 % > 50 % ) without requiring direct pollution control ( γ = 0 ). The effect of the emission reduction improves as the travel demand increases. This shows that the PPP scheme is expected to be applied to large cities with high travel demand to reduce costs and increase efficiency.

4.4. Sensitivity Analysis

To further illustrate the properties of the model, this section conducts sensitivity analyses of key parameters and variables. The following analyses are conducted with a travel demand N = 1000 as an example.

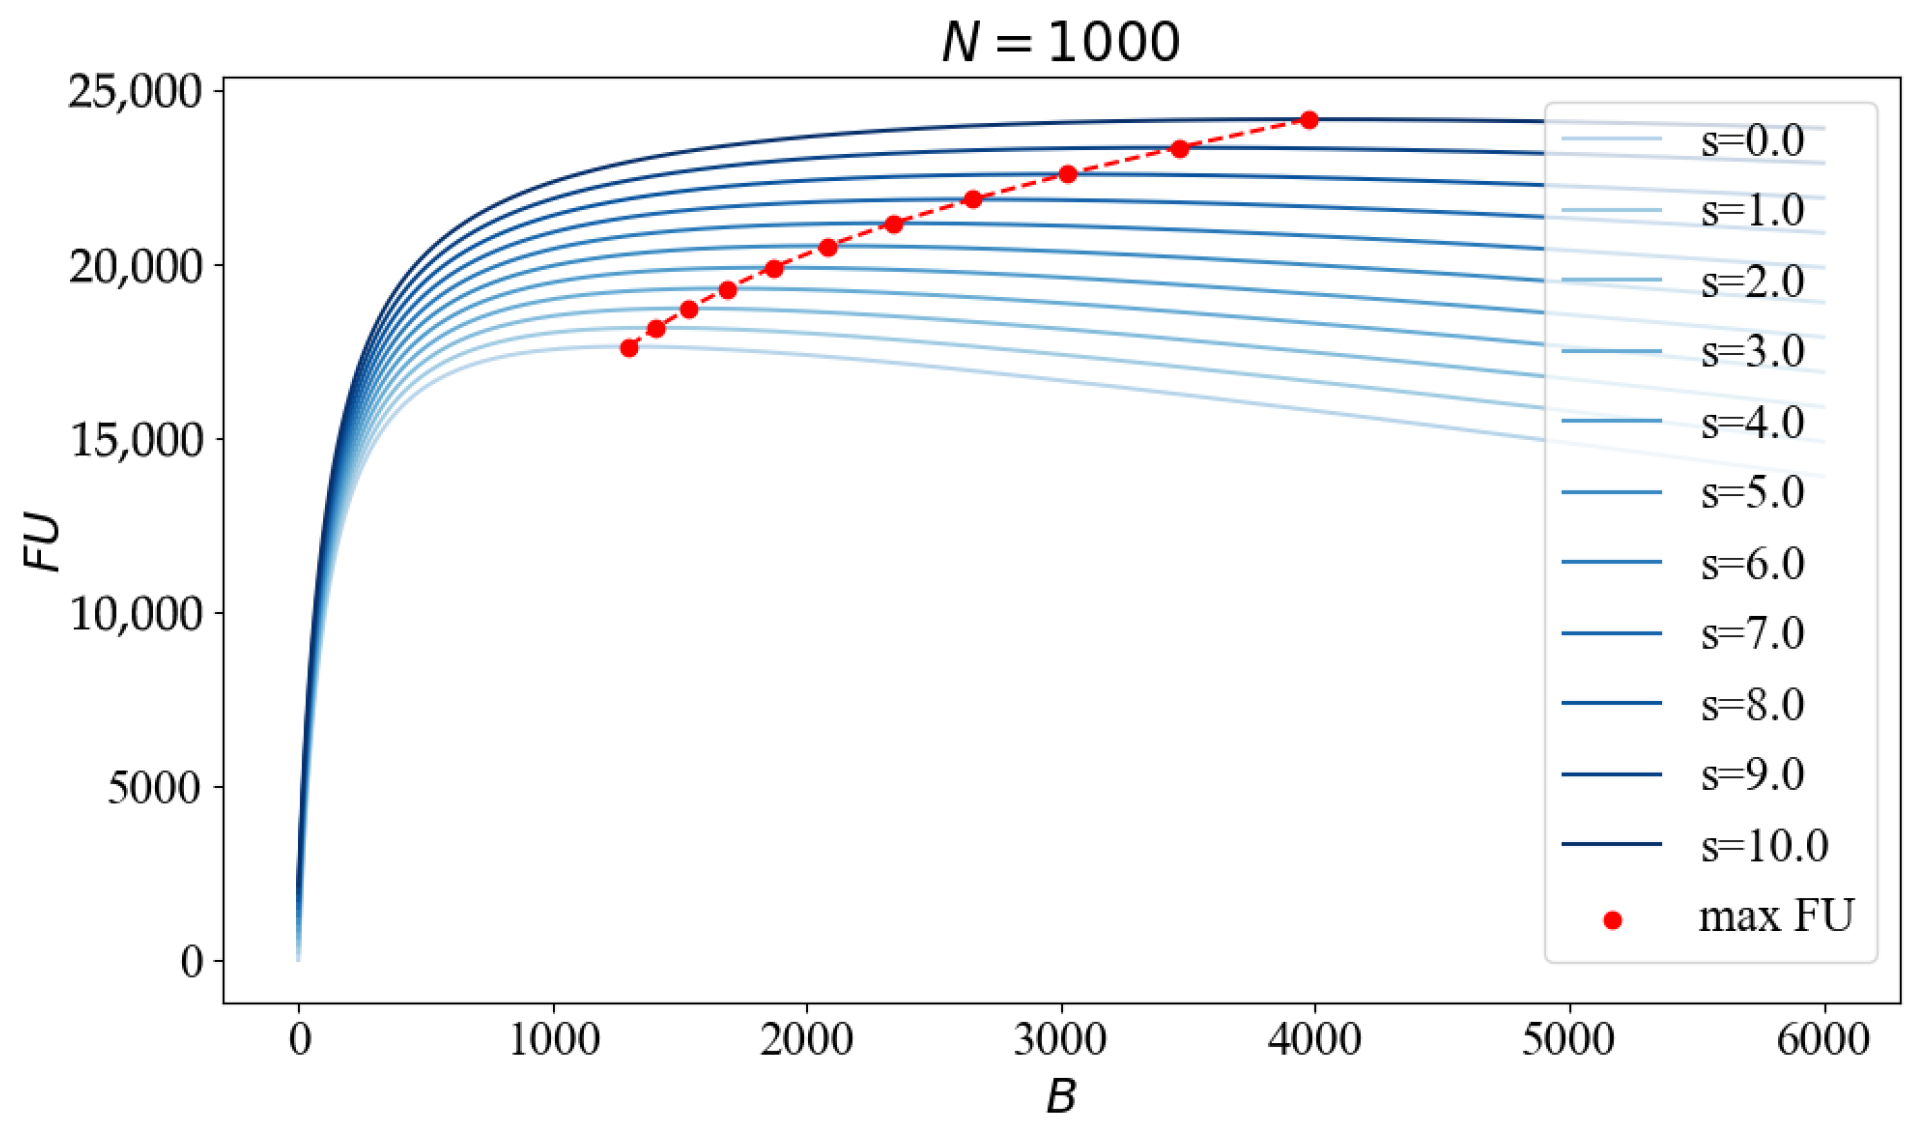
4.4.1. The Impact of Government Subsidies on the Private Sector and Travelers

Given the range of government subsidies s from 0 to 10, the total cost of rewarding travelers B, the utility derived by the private sector F U , and the variation in the number of low-carbon travelers n 1 are analyzed. As shown in Figure 5, both the total low-carbon rewards B used by the private sector to reward low-carbon travelers and the utility maximum F U increase with the government unit subsidy decision variable s. In addition, the number of low-carbon travelers n 1 increases as the government’s unit subsidy s increases, as shown in Figure 6. The results demonstrate that subsidizing the private sector is an effective way to promote low-carbon travel. Increased subsidies s can motivate the private sector to devote more B to attracting travelers to choose low-carbon travel modes, which in turn will bring greater benefits to the private sector.

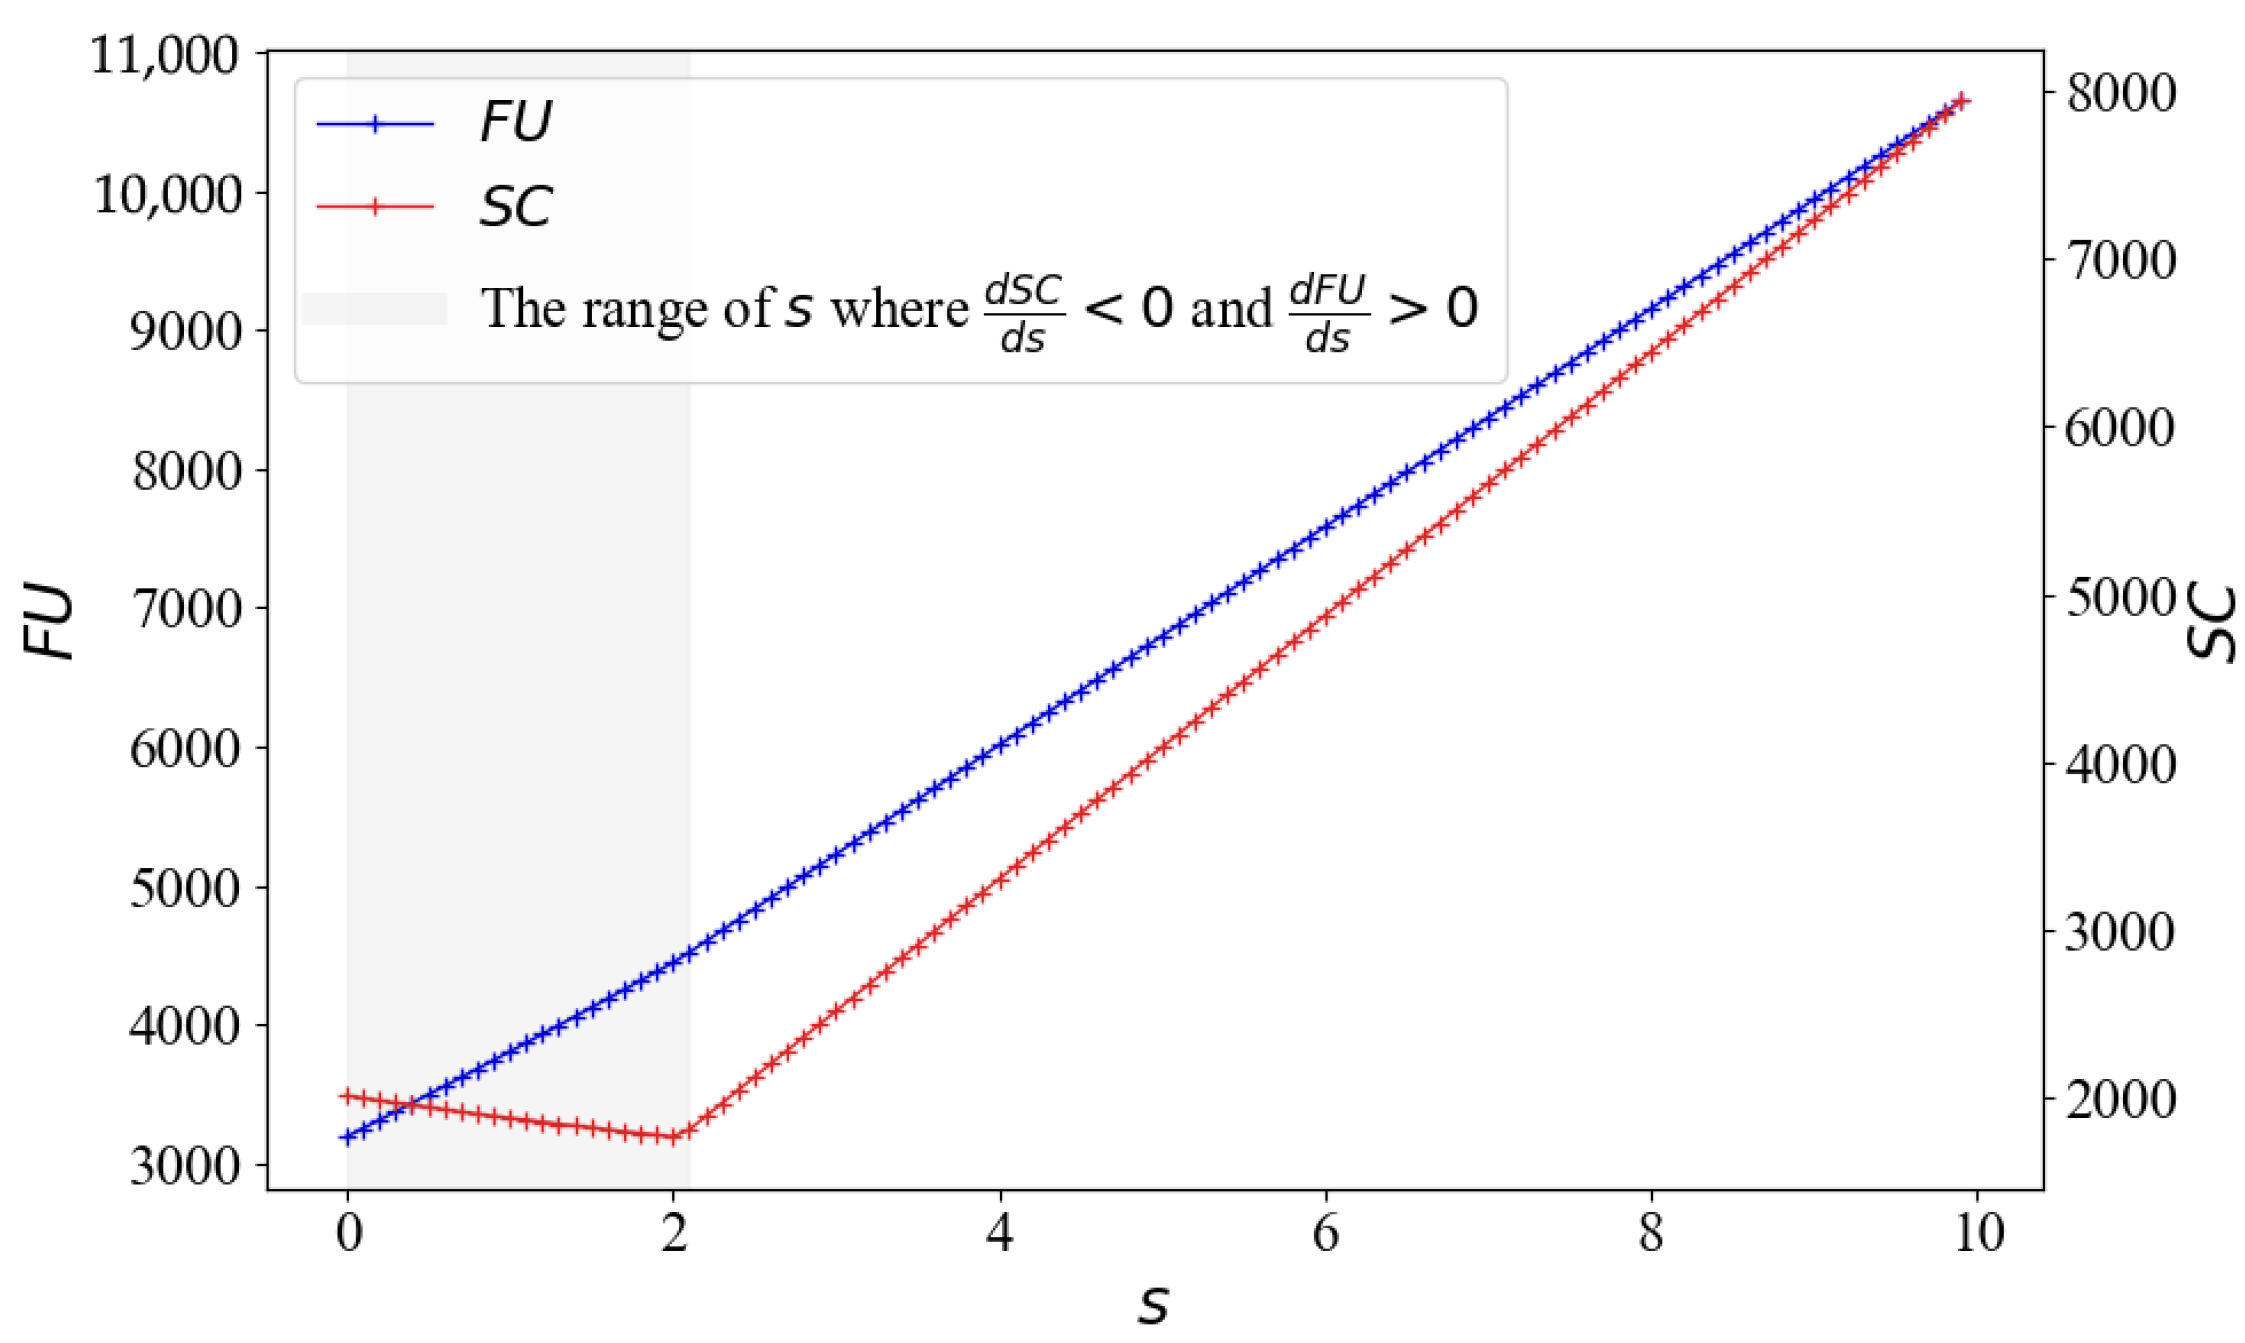
4.4.2. The Impact of the Unit Subsidy s on the Private Sector’s Utility F U and the Government’s Social Costs S C

This section investigates the impact of the unit subsidy s on the government’s social costs S C and the private sector’s utilities F U . As shown in Figure 7, F U continues to increase with s, while S C first decreases and then increases with s. The results suggest that the government is expected to find a Pareto solution s that achieves a win–win situation. However, it should be noted that there is a reasonable size range for the unit subsidy s, and excessive subsidies will bring a cost burden to the government.

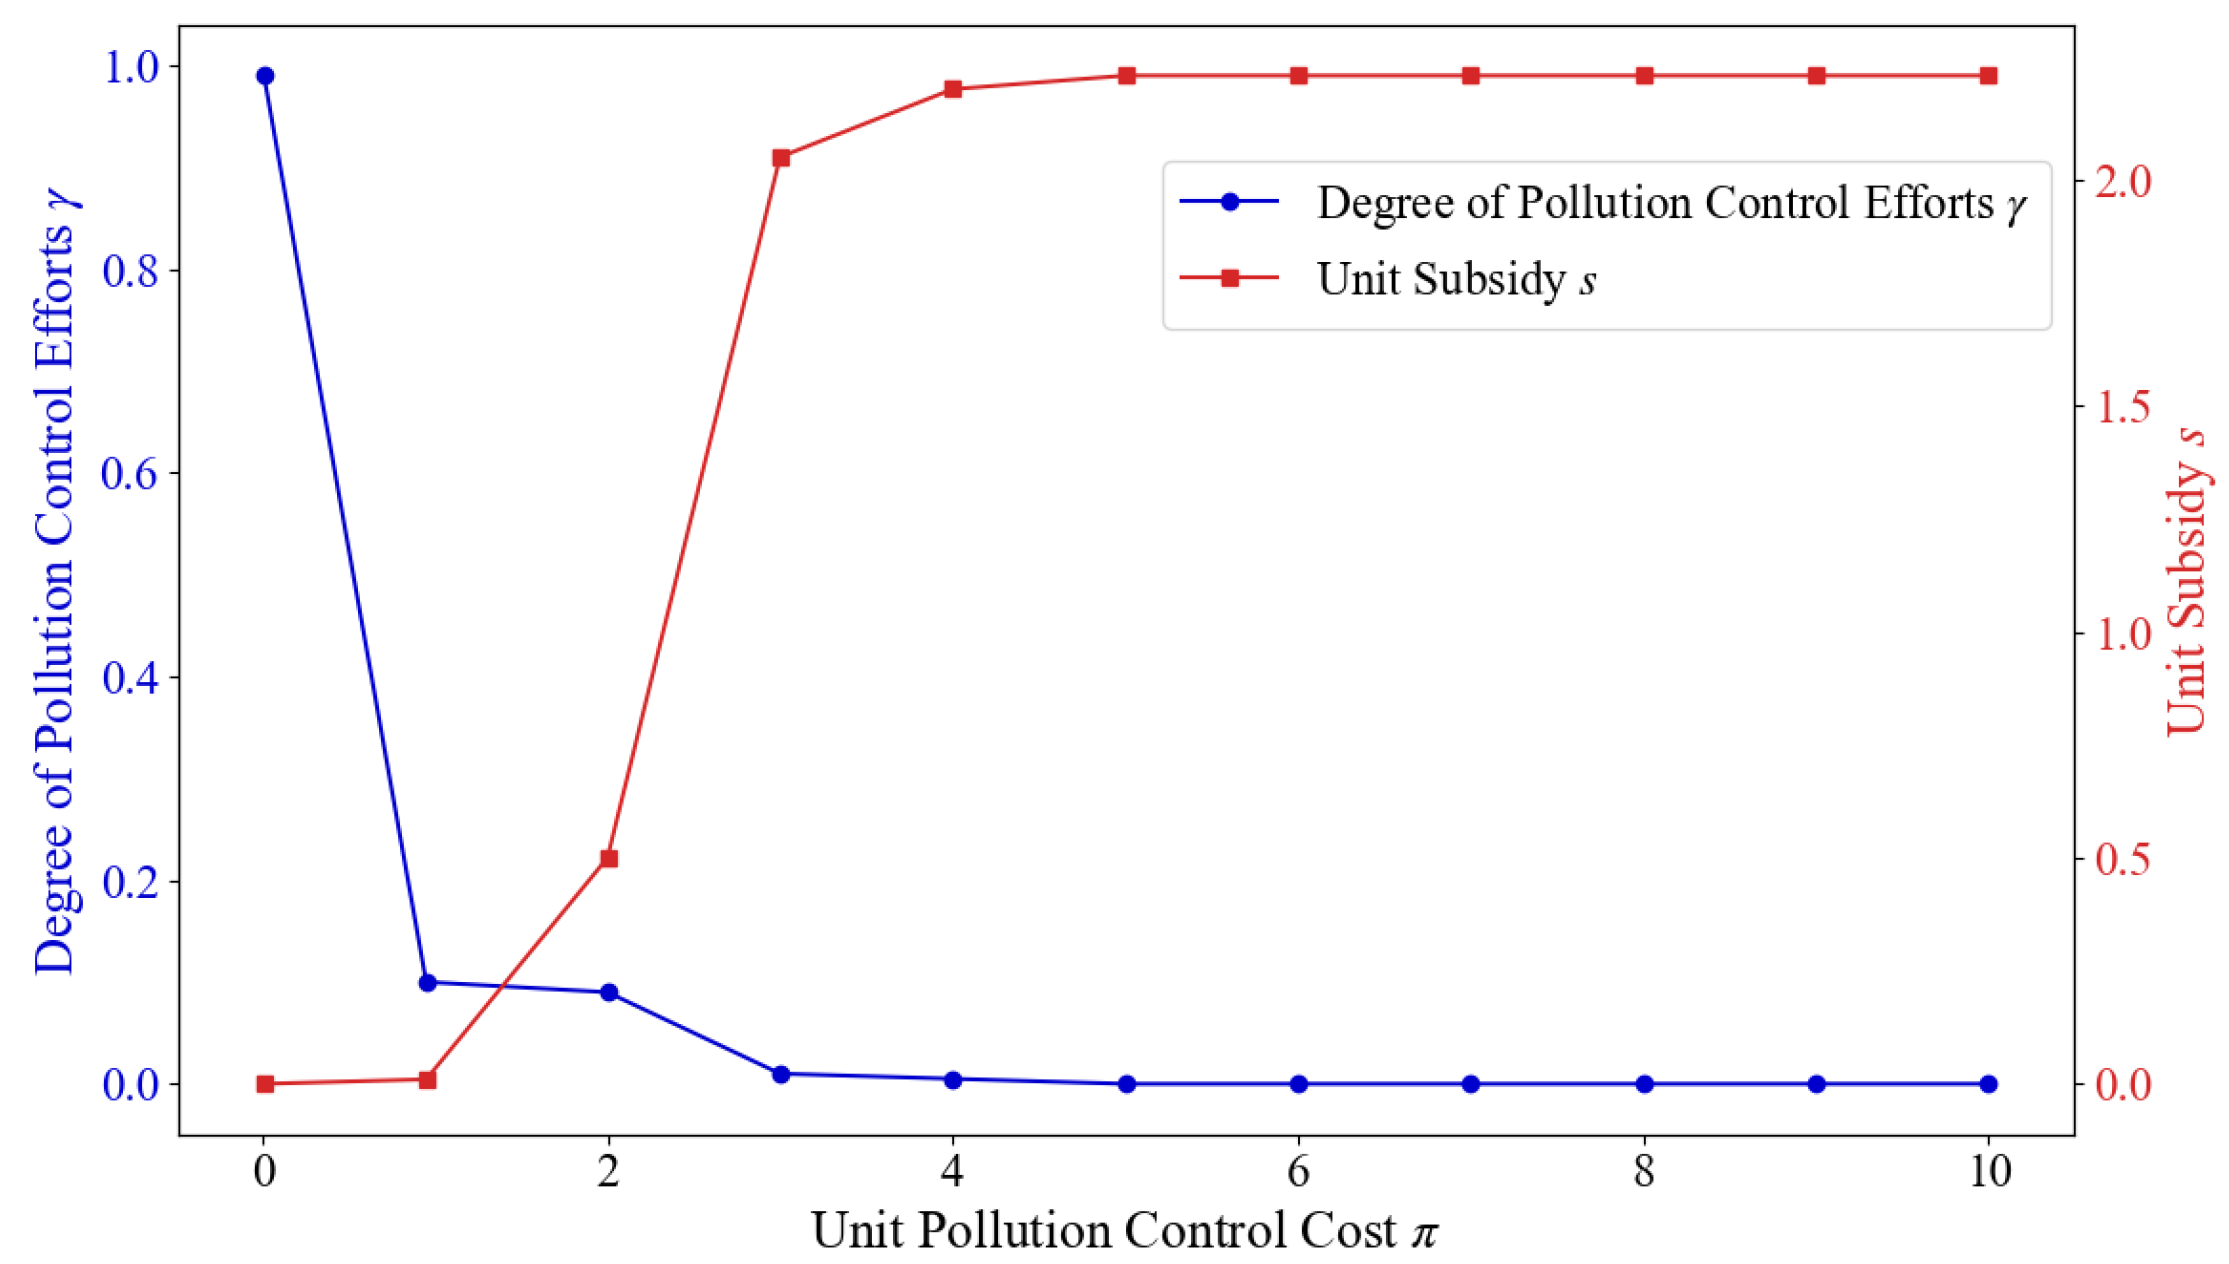
4.4.3. The Impact of the Unit Pollution Control Cost π on the Government’s Decisions ( γ , s )

In this experiment, the target of the remaining emission is initialized as ρ = 50 % . Fix other parameters, and the impact of the unit cost of pollution control π [ 0 , 10 ] (RMB/g) on the two government decision variables ( γ , s ) is investigated. The results are shown in Figure 8. When the unit pollution control cost π is very low, the government will choose to control pollution rather than subsidize the private sector. However, as the unit pollution control cost π increases, the government’s decision-making preference shifts from controlling pollution to subsidizing the private sector. In addition, when the unit pollution control cost exceeds a critical value, the government chooses only to subsidize the private sector instead of pollution control, i.e., π 5 , at which point the parameter π does not affect the government’s decisions. Thus, it can be inferred from the results that, given the existing high cost of abatement technologies, it is more advisable for the government to adopt subsidy measures. However, with the development of technology, it is expected that the cost of pollution control will decrease in the future and that pollution control will be more recommended at that time.

5. Discussion and Conclusions

Unlike previous literature that discussed the PPP model in the field of infrastructure construction, this paper introduces it to the level of travel behavior. Heterogeneous travelers with different values of time (VOTs) and budget constraint are also incorporated into the model. In the proposed PPP scheme, the private sector provides low-carbon rewards to attract travelers to choose public transit and helps the government reduce greater emission while receiving subsidies. It offers new insights into traffic management, which may face the problem of government financial burden and insufficient initiative for private sector participation.
The results show that (i) all stakeholders are better off in the proposed PPP scheme. Governments benefit from more emission reductions while reducing social costs. The private sector is more profitable. Travelers also benefit from richer rewards for low-carbon travel. (ii) Governments can induce the private sector to invest more in attracting travelers to low-carbon travel through increased subsidies, which in turn can bring greater returns to the private sector. (iii) The proposed mechanism can prevent the opportunistic behavior of the private sector. (iv) Direct pollution control strategies may be better if technological advances reduce the cost of direct control. However, given the present high cost of direct pollution control, government subsidies to the private sector represent a more cost-effective strategy. (v) This paper can also provide new policy design ideas for existing PPP practices, such as the tiered subsidy system in Beijing’s MaaS platform and the shadow charging mechanism in Singapore’s 2023 Green Plan.
One limitation of this study is that the range of a single O-D pair is relatively small, which may limit the generalizability of the results. As to multiple O-D pairs, the conditions for user equilibrium are related not only to the travel modes but also to route selections. Therefore, when implementing the PPP scheme, local governments need to design different low-carbon rewards for different O-D pairs to achieve system optimization under a large road network.
In future studies, we will apply the proposed model to more complex multi-modal transport networks. Considering that travelers may have nonrecurrent and stochastic trips within a day, the PPP scheme can be further extended by incorporating uncertainty [50]. Other choices made by travelers, such as route choice, car ownership, and vehicle types, could also be incorporated into the analysis. Furthermore, the application of this model in specific countries is an interesting future research direction, as the modeling formulas proposed in this paper need to be modified and improved accordingly. Many countries or cities can carry out related practices. China has the world’s largest carbon trading market and is actively exploring low-carbon mobility PPP initiatives, including MaaS. However, there is a lack of consistency in platform interfaces, payment systems, and carbon calculation methods across cities. In Singapore, innovative models such as public–private partnerships (PPPs) are being urged to accelerate the achievement of the 2030 Green Plan. Highly developed companies and advanced low-carbon technologies are expected to facilitate the implementation of the PPP scheme proposed in this paper. It is recommended that a specific PPP legislation be enacted to provide additional safeguards. For Japan, PPP projects have a well-established process, with basic procedures including preliminary investigations, simulation analyses during implementation, and experimental verification after implementation. In addition, highly specialized expert teams and public oversight mechanisms have been established to ensure quality control. However, government subsidies for PPP projects require annual approval by parliament, which is a cumbersome process.

Author Contributions

Y.Z.: writing—original draft, methodology, conceptualization, visualization, validation, software, formal analysis, data curation. G.J.: writing—review and editing, supervision, project administration, methodology, formal analysis, conceptualization, funding acquisition, resources. A.C.: writing—review and editing, validation, investigation, formal analysis. All authors have read and agreed to the published version of the manuscript.

Funding

This research was supported by grants from the National Natural Science Foundation of China (72201285), Shenzhen Science and Technology Program (202206193000001, 20220817200513001, RCBS20231211090558092), Science and Technology Planning Project of Guangdong Province (2023B1212060029), and Basic and Applied Basic Research Foundation of Guangdong Province (2024A1515012422).

Data Availability Statement

No new data were created.

Conflicts of Interest

The authors declare that they have no known competing financial interests or personal relationships that could have appeared to influence the work reported in this paper.

References

  1. Zong, F.; Zeng, M.; Lv, J.; Wang, C. A credit charging scheme incorporating carpool and carbon emissions. Transp. Res. Part D Transp. Environ. 2021, 94, 102711. [Google Scholar] [CrossRef]
  2. Liu, B.; Li, F.; Hou, Y.; Antonio Biancardo, S.; Ma, X. Unveiling built environment impacts on traffic CO2 emissions using Geo-CNN weighted regression. Transp. Res. Part D Transp. Environ. 2024, 132, 104266. [Google Scholar] [CrossRef]
  3. Ding, H.; Yang, H.; Qin, X.; Xu, H. Credit charge-cum-reward scheme for green multi-modal mobility. Transp. Res. Part B Methodol. 2023, 178, 102852. [Google Scholar] [CrossRef]
  4. Sun, Y.; Guo, Q.; Schonfeld, P.; Li, Z. Implications of the cost of public funds in public transit subsidization and regulation. Transp. Res. Part A Policy Pract. 2016, 91, 236–250. [Google Scholar] [CrossRef]
  5. Najmi, A.; Rashidi, T.H.; Waller, T. A multimodal multi-provider market equilibrium model: A game-theoretic approach. Transp. Res. Part C Emerg. Technol. 2023, 146, 103959. [Google Scholar] [CrossRef]
  6. Sun, Y.; Schonfeld, P. Optimization Models for Public Transit Operations Under Subsidization and Regulation. Transp. Res. Rec. J. Transp. Res. Board 2015, 2530, 44–54. [Google Scholar] [CrossRef]
  7. Wang, H.; Xiong, W.; Wu, G.; Zhu, D. Public Private Partnership in Public Administration Discipline: A Literature Review. Public Manag. Rev. 2018, 20, 293–316. [Google Scholar] [CrossRef]
  8. Tscharaktschiew, S.; Hirte, G. Should subsidies to urban passenger transport be increased? A spatial CGE analysis for a German metropolitan area. Transp. Res. Part A Policy Pract. 2012, 46, 285–309. [Google Scholar] [CrossRef]
  9. Luo, Q.; Bing, X.; Jia, H.; Song, J. An incentive subsidy mechanism for bus lines based on service level. Transp. Policy 2022, 126, 1–13. [Google Scholar] [CrossRef]
  10. Li, T.; Chen, P.; Tian, Y. Personalized incentive-based peak avoidance and drivers’ travel time-savings. Transp. Policy 2021, 100, 68–80. [Google Scholar] [CrossRef]
  11. Sun, J.; Wu, J.; Xiao, F.; Tian, Y.; Xu, X. Managing bottleneck congestion with incentives. Transp. Res. Part B Methodol. 2020, 134, 143–166. [Google Scholar] [CrossRef]
  12. Yu, M.M.; Chung, Y.S. Performance-based transit subsidy allocation scheme to fulfill multiple policy criteria. Transp. Lett. 2024, 16, 814–828. [Google Scholar] [CrossRef]
  13. Rodrigues, A.L.; Cipcigan, L.; Potoglou, D.; Dattero, D.; Wells, P.; da Cal Seixas, S.R. Impacts of subsidy efficiency on bus electrification: A participatory system dynamic modeling. Transp. Policy 2025, 167, 210–221. [Google Scholar] [CrossRef]
  14. Jara-Díaz, S.R.; Gschwender, A. The effect of financial constraints on the optimal design of public transport services. Transportation 2009, 36, 65–75. [Google Scholar] [CrossRef]
  15. Xu, S.X.; Liu, T.L.; Huang, H.J.; Liu, R. Mode choice and railway subsidy in a congested monocentric city with endogenous population distribution. Transp. Res. Part A Policy Pract. 2018, 116, 413–433. [Google Scholar] [CrossRef]
  16. Wang, Z.; Yu, J.G.; Chen, A.; Fu, X. Subsidy policies towards zero-emission bus fleets: A systematic technical-economic analysis. Transp. Policy 2024, 150, 1–13. [Google Scholar] [CrossRef]
  17. Giagnorio, M.; Börjesson, M.; D’Alfonso, T. Introducing electric buses in urban areas: Effects on welfare, pricing, frequency, and public subsidies. Transp. Res. Part A: Policy Pract. 2024, 185, 104103. [Google Scholar] [CrossRef]
  18. Hu, X.; Chen, X.; Li, L.M. A path-based incentive scheme toward de-carbonized trips in a bi-modal traffic network. Transp. Res. Part D. Transp. Environ. 2023, 122, 103853. [Google Scholar] [CrossRef]
  19. Liu, Z.; Chen, X.; Hu, J.; Wang, S.; Zhang, K.; Zhang, H. An alternating direction method of multipliers for solving user equilibrium problem. Eur. J. Oper. Res. 2023, 310, 1072–1084. [Google Scholar] [CrossRef]
  20. Liu, B.; Ma, X.; Liu, W.; Ma, Z. Designing a carbon-trading incentive scheme for mode shifts in multi-modal transport systems. Transp. Res. Part E Logist. Transp. Rev. 2024, 192, 103789. [Google Scholar] [CrossRef]
  21. Sheng, M.; Sreenivasan, A.V.; Sharp, B.; Wilson, D.; Ranjitkar, P. Economic analysis of dynamic inductive power transfer roadway charging system under public-private partnership–Evidence from New Zealand. Technol. Forecast. Soc. Change 2020, 154, 119958. [Google Scholar] [CrossRef]
  22. Hou, L.; Yang, F.; Liang, W.; Wu, C.; Song, J. Government subsidy and benefit distribution mechanisms for transportation PPP projects: An evolutionary game perspective. J. Environ. Manag. 2024, 359, 120981. [Google Scholar] [CrossRef] [PubMed]
  23. Casady, C.B.; Cepparulo, A.; Giuriato, L. Public-private partnerships for low-carbon, climate-resilient infrastructure: Insights from the literature. J. Clean. Prod. 2024, 470, 143338. [Google Scholar] [CrossRef]
  24. Dong, Z.; Wang, M.; Yang, X. Comparative study of China and USA public private partnerships in public transportation. J. Mod. Transp. 2016, 24, 215–223. [Google Scholar] [CrossRef]
  25. Lu, Q.; Farooq, M.U.; Ma, X.; Iram, R. Assessing the combining role of public-private investment as a green finance and renewable energy in carbon neutrality target. Renew. Energy 2022, 196, 1357–1365. [Google Scholar] [CrossRef]
  26. Zhang, S.; Chan, A.P.; Feng, Y.; Duan, H.; Ke, Y. Critical review on PPP Research–A search from the Chinese and International Journals. Int. J. Proj. Manag. 2016, 34, 597–612. [Google Scholar] [CrossRef]
  27. Shi, G.; Zhang, X. Development of a Regulatory Mechanism for Key Stages in Public–Private Partnerships. J. Infrastruct. Syst. 2022, 28, 04022017. [Google Scholar] [CrossRef]
  28. Zhang, Y.; Xu, M. Promoting low carbon mobility: A case study of Beijing MaaS. Int. J. Sustain. Transp. 2025, 1–15. [Google Scholar] [CrossRef]
  29. Xue, Y.; Guan, H.; Corey, J.; Zhang, B.; Yan, H.; Han, Y.; Qin, H. Transport Emissions and Energy Consumption Impacts of Private Capital Investment in Public Transport. Sustainability 2017, 9, 1760. [Google Scholar] [CrossRef]
  30. Yuan, X. Research on Construction of Public Bicycle System Under the PPP Mode in Weifang. J. Weifang Univ. 2017, 17, 12–15. [Google Scholar]
  31. Wang, H.; Liu, Y.; Xiong, W.; Zhun, D. Government Support Programs and Private Investments in PPP Markets. Int. Public Manag. J. 2019, 22, 499–523. [Google Scholar] [CrossRef]
  32. Lv, J.; Ye, G.; Liu, W.; Shen, L.; Wang, H. Alternative Model for Determining the Optimal Concession Period in Managing BOT Transportation Projects. J. Manag. Eng. 2015, 31, 04014066. [Google Scholar] [CrossRef]
  33. Hörcher, D.; Tirachini, A. A review of public transport economics. Econ. Transp. 2021, 25, 100196. [Google Scholar] [CrossRef]
  34. Cheng, X.; Cheng, M.; Liu, Y. The behavioral strategies of multiple stakeholders in the NIMBY facility public-private partnership project: A tripartite evolutionary game analysis based on prospect theory. Can. J. Civ. Eng. 2024, 51, 1126–1144. [Google Scholar] [CrossRef]
  35. Soomro, M.A.; Zhang, X. Roles of Private-Sector Partners in Transportation Public-Private Partnership Failures. J. Manag. Eng. 2015, 31, 04014056. [Google Scholar] [CrossRef]
  36. Zhang, L.; Long, R.; Huang, Z.; Li, W.; Wei, J. Evolutionary game analysis on the implementation of subsidy policy for sustainable transportation development. J. Clean. Prod. 2020, 267, 122159. [Google Scholar] [CrossRef]
  37. Jiang, G.; Fan, Q.; Zhang, Y.; Xiao, Y.; Xie, J.; Zhou, S. A tradable carbon credit incentive scheme based on the public-private-partnership. Transp. Res. Part E Logist. Transp. Rev. 2025, 197, 104039. [Google Scholar] [CrossRef]
  38. Emami, M.; Haghshenas, H.; Talebian, A.; Kermanshahi, S. A game theoretic approach to study the impact of transportation policies on the competition between transit and private car in the urban context. Transp. Res. Part A Policy Pract. 2022, 163, 320–337. [Google Scholar] [CrossRef]
  39. Yang, H.; Wang, X. Managing network mobility with tradable credits. Transp. Res. Part B Methodol. 2011, 45, 580–594. [Google Scholar] [CrossRef]
  40. Zha, L.; Yin, Y.; Yang, H. Economic analysis of ride-sourcing markets. Transp. Res. Part C Emerg. Technol. 2016, 71, 249–266. [Google Scholar] [CrossRef]
  41. Vittorio, V.; Donatella, S. Economic development and population growth: An inverted-U shaped curve? Med. Educ. 1988, 22, 447–454. [Google Scholar]
  42. Liu, X.; Hu, G.; Ai, B.; Li, X.; Tian, G.; Chen, Y.; Li, S. Simulating urban dynamics in China using a gradient cellular automata model based on S-shaped curve evolution characteristics. Int. J. Geogr. Inf. Sci. 2017, 32, 73–101. [Google Scholar] [CrossRef]
  43. Smirnov, R.G.; Wang, K. In search of a new economic model determined by logistic growth. Eur. J. Appl. Math. 2020, 31, 339–368. [Google Scholar] [CrossRef]
  44. Cioffi, D.F. A tool for managing projects: An analytic parameterization of the S-curve. Int. J. Proj. Manag. 2005, 23, 215–222. [Google Scholar] [CrossRef]
  45. Liu, Y.; Chen, H.; Li, Y.; Gao, J.; Dave, K.; Chen, J.; Li, T.; Tu, R. Exhaust and non-exhaust emissions from conventional and electric vehicles: A comparison of monetary impact values. J. Clean. Prod. 2022, 331, 129965. [Google Scholar] [CrossRef]
  46. Yang, H.; Liu, J.; Jiang, K.; Meng, J.; Guan, D.; Xu, Y.; Tao, S. Multi-objective analysis of the co-mitigation of CO2 and PM2.5 pollution by China’s iron and steel industry. J. Clean. Prod. 2018, 185, 331–341. [Google Scholar] [CrossRef]
  47. Yin, Y.; Lawphongpanich, S. Internalizing emission externality on road networks. Transp. Res. Part D Transp. Environ. 2006, 11, 292–301. [Google Scholar] [CrossRef]
  48. Chen, L.; Yang, H. Managing congestion and emissions in road networks with tolls and rebates. Transp. Res. Part B Methodol. 2012, 46, 933–948. [Google Scholar] [CrossRef]
  49. Cheng, Y.; Xiaoxia, G.; Qing, L. Quantification Model of Carbon Emission Reduction Benefits Based on Dynamic Carbon Emission Factors in a Subtation Area. Mod. Electr. Power 2025. [Google Scholar]
  50. Lin, X.; Yin, Y.; He, F. Credit-based mobility management considering travelers’ budgeting behaviors under uncertainty. Transp. Sci. 2021, 55, 297–314. [Google Scholar] [CrossRef]
Figure 1. Framework of the PPP scheme.
Mathematics 13 02358 g001
Figure 2. The value of time of heterogeneous travelers under user equilibrium.
Mathematics 13 02358 g002
Figure 3. The property of function G regarding the number of transit travelers n 1 .
Mathematics 13 02358 g003
Figure 4. The algorithm flowchart of the PPP scheme.
Mathematics 13 02358 g004
Figure 5. The impact of unit subsidy s on the low-carbon rewards and the utility of the private sector.
Mathematics 13 02358 g005
Figure 6. The impact of unit subsidy s on travelers under the maximum utility of the private sector.
Mathematics 13 02358 g006
Figure 7. The impact of the unit subsidy s on the bi-objective function ( S C , F U ).
Mathematics 13 02358 g007
Figure 8. The impact of the unit cost of direct pollution control π on the government’s decisions ( γ , s ).
Mathematics 13 02358 g008
Table 1. Numerical parameters and symbols.
ParametersSymbolsValuesUnits
The distance between the O-D pairl15km
The cost of taking public transit c 1 6RMB
The cost of driving a private car c 2 15RMB
The travel time for public transit t 1 60min
The travel time of the free flow t 0 30min
Parameters of the road resistance function α , β 0.15, 4/
Road capacityV1500/
Unit benefit of emission reductionm 10 3 RMB/g
Unit subsidys[0, 10]RMB
Unit cost of direct pollution control π 2.961 × 10 3 RMB/g
Level of direct pollution control effort γ [0, 1]/
Target of emission reduction ρ [0, 1]/
Table 2. Scheme setting.
B γ s
P 0 : benchmark scheme=0=0=0
P 1 : government-led scheme=0>0>0
P 2 : private sector-led scheme>0=0=0
P 3 : PPP scheme≥0≥0≥0
Table 3. Results of different schemes under different demands.
Demand100015002000
Scheme P 0 P 1 P 2 P 3 P 0 P 1 P 2 P 3 P 0 P 1 P 2 P 3
n 1 213.74270.65668.60689.49386.05573.301002.541110.62656.46970.151325.021511.60
b-0.453.513.67-1.143.493.92-1.773.394.15
A--2346.803049.1--3498.864491.52--4494.676328.56
p--1.001.00--1.001.00--1.001.00
q--1.001.00--1.001.00--1.001.00
s-0.450.000.85-1.140.002.83-1.770.003.88
γ -46.03%0.00%0.00%-39.33%0.00%0.00%-32.5%0.00%0.00%
F U -0.0015,370.1215,810.52-0.0023,156.1426,105.52-0.0030,228.8337,276.21
S C 26,220.9625,209.2725,076.7625,069.4739,802.2738,290.0736,906.7436,901.4653,955.1752,349.7349,372.8849,369.35
Δ E -3605.12 (50.02%)4189.08 (58.12%)4379.44 (60.77%)-5235.31 (50.42%)5878.75 (56.41%)6654.00 (63.85%)-6492.4 (50.1%)7047.2 (54.4%)8499.23 (65.63%)
Disclaimer/Publisher’s Note: The statements, opinions and data contained in all publications are solely those of the individual author(s) and contributor(s) and not of MDPI and/or the editor(s). MDPI and/or the editor(s) disclaim responsibility for any injury to people or property resulting from any ideas, methods, instructions or products referred to in the content.

