Abstract
This paper addresses a fundamental challenge in statistical radar detection systems: optimizing the trade-off between the probability of a false alarm () and the probability of a miss (). These two metrics are inversely related and critical for performance evaluation. Traditional detection approaches often enhance one aspect at the expense of the other, limiting their practical applicability. To overcome this limitation, a fuzzy hypothesis testing framework is introduced that improves decision making under uncertainty by incorporating both crisp and fuzzy data representations. The methodology is divided into three phases. In the first phase, we reduce the probability of false alarm while maintaining a constant probability of miss using crisp data characterized by deterministic values and classical statistical thresholds. In the second phase, the inverse scenario is considered: minimizing while keeping fixed. This is achieved through parameter tuning and refined threshold calibration. In the third phase, a strategy is developed to simultaneously enhance both and , despite their inverse correlation, by adopting adaptive decision rules. To further strengthen system adaptability, fuzzy data are introduced, which effectively model imprecision and ambiguity. This enhances robustness, particularly in scenarios where rapid and accurate classification is essential. The proposed methods are validated through both real and synthetic simulations of radar measurements, demonstrating their ability to enhance detection reliability across diverse conditions. The findings confirm the applicability of fuzzy hypothesis testing for modern radar systems in both civilian and military contexts, providing a statistically sound and operationally applicable approach for reducing detection errors and optimizing system performance.
Keywords:
fuzzy hypothesis testing; radar detection; probability of false alarm; probability of miss; statistical decision theory; crisp and fuzzy data; detection reliability MSC:
62P30; 62K86; 62A86; 62B86
1. Introduction
Uncertainty in real-world data arises mainly from two sources: randomness and fuzziness. Randomness is typically modeled using probability theory, while fuzziness results from imprecision or vagueness in measurement and classification. Hypothesis testing is key in statistics, especially with fuzzy data that involves uncertainty. Recently, fuzzy hypothesis testing has garnered attention from researchers, resulting in the development of new algorithms and enhanced methods for real-world applications. These advancements strengthen the foundations of statistics and enhance the reliability of techniques used to address complex data challenges. Overall, the growth of fuzzy hypothesis testing is crucial for enhancing statistical understanding and making informed decisions in uncertain situations [1].
Real-world decision making under uncertainty is a central challenge in many signal processing domains, particularly in radar detection systems. Traditional binary hypothesis testing frameworks assume that data are crisp and precisely defined. However, radar environments are often subject to noise, clutter, and fluctuating signal properties, which reduce the reliability of such crisp decision-making models. In these scenarios, the boundary between the noise and target signals becomes ambiguous, especially under conditions of low signal-to-noise ratio (SNR) or environmental interference.
Fuzzy hypothesis testing (FHT) has emerged as a promising alternative for managing uncertainty in classification problems. Introduced as an extension of classical statistical testing, FHT incorporates fuzzy set theory to represent imprecise or vague data, enabling a gradual transition between decision states rather than binary outcomes. This makes it particularly well suited to radar applications, where received signals often deviate from idealized models. Unlike conventional approaches that rely on sharp critical regions, FHT enables the modulation of rejection boundaries using fuzzy membership functions, offering a controlled balance between false alarms and missed detections.
This study proposes a fuzzy hypothesis testing algorithm specifically tailored to radar detection. The proposed approach leverages fuzzy data representations to enhance adaptability in setting decision thresholds without sacrificing scientific rigor. It introduces a methodology that allows for independent and even simultaneous improvement of the probability of false alarm () and the probability of miss (), despite their traditionally inverse relationship. This contribution is especially valuable in radar systems where operational constraints may demand prioritizing one performance measure over the other.
While previous works have explored fuzzy statistical methods in signal detection, few have comprehensively addressed their application to radar systems under practical operating conditions. The gap is particularly pronounced in the development of algorithmic frameworks capable of context-aware modulation of detection thresholds. Recent literature highlights the need for more resilient decision models in structural health monitoring [2], education systems [3], risk management [4], and structural reliability analysis [5,6], reinforcing the potential of FHT in diverse domains.
To address this need, the present work introduces the following contributions:
- A nonparametric fuzzy hypothesis testing framework for radar detection.
- An algorithm that enables adaptive trade-offs between and .
- A demonstration of controlled threshold modulation based on fuzzy rejection regions.
- Experimental validation using both synthetic and real radar datasets.
The remainder of this paper is structured as follows: Section 2 outlines the necessary fuzzy logic with problem statement and motivation. Preliminaries are introduced in Section 3. Fuzzy hypothesis testing in radar contexts and the problem formulation with the statistical basis are presented in Section 4, Section 5 and Section 6. Section 7 describes the proposed fuzzy testing algorithm. Section 8 presents the experimental results, and Section 9 discusses the implications, limitations, and future research directions.
2. Problem Statement and Motivation
Statistical hypothesis testing is a crucial component of statistical inference, where a hypothesis about a population is evaluated based on the sample data. The null hypothesis, denoted as , represents the default assumption, while the alternative hypothesis, , suggests a competing claim. A statistical procedure determines whether to reject or accept . This study focuses on integrating fuzziness into hypotheses and data rather than relying on precise definitions.
One important application is radar detection, which is a binary decision problem where accurately classifying signal and noise is essential. The decision space can be simplified to two hypotheses:
- : The received signal is noise.
- : The received signal contains a target.
The receiver must determine whether to accept or reject in the presence of channel disturbances. Traditional radar detection methods rely on crisp hypotheses, assuming well-defined decision boundaries. However, environmental uncertainties, noise fluctuations, and signal interference challenge the accuracy of these models. A flexible framework has been introduced, which enhances decision making under uncertain conditions by incorporating fuzzy hypothesis testing.
The motivation for fuzzy hypothesis testing stems from the limitations of classical statistical methods, which rely on precisely defined hypotheses. In radar detection systems, uncertainties in noise characteristics and variations in signal behavior often reduce the reliability of crisp decision models. Incorporating fuzziness into hypothesis testing enhances robustness and enables better accommodation of real-world imperfections in signal classification.
Despite its advantages, fuzzy hypothesis testing presents challenges. It often involves complex calculations compared to traditional crisp methods, and the selection of fuzzy parameters can influence decision outcomes. However, these challenges are outweighed by the benefits of improved adaptability and robustness in uncertain environments.
This study is motivated by the limitations of crisp decision frameworks in radar systems. The key contributions of this research include:
- The development of a fuzzy hypothesis testing algorithm tailored to radar environments.
- Demonstration of how fuzzy data allow for controlled modulation of detection thresholds without compromising scientific rigor.
- Analytical methods that permit the independent or simultaneous enhancement of the probability of false alarm () and the probability of miss (), despite their typical inverse relationship.
- Empirical validation using both synthetic and real-world radar datasets, confirming the practical viability and accuracy of the approach.
Fuzzy Hypothesis Testing: Background and Relevance to Radar
Fuzzy hypothesis testing (FHT) generalizes classical hypothesis testing by incorporating fuzzy logic, which allows for imprecise data representation and gradual decision boundaries [7,8]. This approach is particularly valuable in radar systems, where signal ambiguity and environmental noise hinder the effectiveness of crisp statistical decision rules.
Unlike parametric testing frameworks, FHT avoids rigid assumptions about distributional form, enabling more robust inference under uncertainty [9]. It provides a structured methodology for distinguishing overlapping signal and noise distributions using fuzzy sets, thereby reflecting real-world radar conditions more accurately.
Figure 1 provides a visual interpretation of how fuzzy logic enables the controlled modulation of detection thresholds in radar decision systems. The two overlapping distributions correspond to the noise hypothesis and the target hypothesis , with the x-axis representing a continuous decision statistic (e.g., test statistic or signal strength). Traditional crisp decision making enforces a rigid binary threshold at a specific point (dashed vertical line), forcing a complete switch from one decision to another. In contrast, the introduction of a fuzzy threshold region (shaded area) allows for a gradual transition between hypotheses based on the degree of overlap with the critical region. This approach supports partially confident decisions and provides a better account for signal ambiguity or measurement imprecision. Such fuzzy-based modulation facilitates more flexible and mission-specific radar decisions while preserving statistical validity. By explicitly modeling uncertainty instead of ignoring it, the proposed framework avoids the risk of overconfidence often associated with sharp thresholds, thereby maintaining scientific rigor.
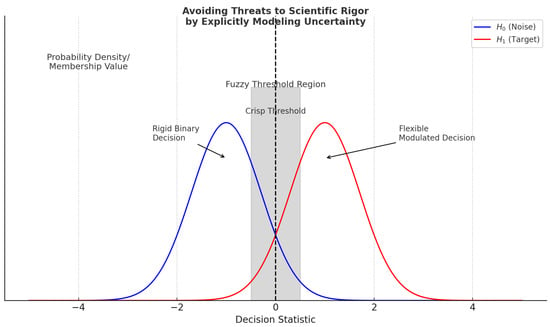
Figure 1.
Visualization of controlled modulation of detection thresholds using fuzzy logic.
Earlier works by Tanaka et al. [10] and Casals et al. [11] initiated the integration of fuzzy sets in hypothesis testing, followed by Arnold [12,13], who reinterpreted type I and type II errors under fuzzy frameworks. More recent contributions include Bayesian fuzzy tests [14], fuzzy p-values [7], and fuzzy confidence intervals [15].
For radar-specific applications, Elsherif et al. [16] and Parchami et al. [17] demonstrated the practical utility of FHT in managing false alarm and miss trade-offs, especially in cluttered detection environments. Recent advancements further explore fuzzy Neyman–Pearson tests [18], machine learning integration [1], and nonparametric fuzzy testing [9].
This study builds upon these foundations by introducing an adaptive fuzzy testing framework specifically tailored to radar applications. The method accounts for operational context and detection requirements, allowing for the dynamic modulation of threshold regions. Validation is provided on both synthetic and empirical radar data.
Recent studies have expanded the role of fuzzy logic beyond classical decision theory into broader domains involving uncertainty, such as structural health monitoring [2], educational decision systems [3], and structural safety assessment under incomplete data [5]. These works provide methodological insights applicable to radar systems, where ambiguity and contextual adaptation are essential. For example, the work of Kovács [6] introduces fuzzy evaluation metrics for uncertain structural behavior, inspiring the extension of fuzzy decision tools in radar-based classification.
Unlike parametric frameworks, nonparametric fuzzy testing [9] enables radar systems to model ambiguity in received signals without relying on prior distribution assumptions, thereby improving signal classification robustness. This flexibility is essential for effective binary decision making in radar environments with highly variable or unknown signal and noise distributions. Radar detection systems must navigate an inherent trade-off between the probability of false alarm () and the probability of miss (), which are typically inversely related. To address this challenge, the present study adopts three statistically grounded and operationally relevant strategies. First, reducing while maintaining a fixed is achieved by widening the acceptance region of the null hypothesis , which corresponds in practical radar systems to broadening the defined noise region. This strategy is effective in clutter-rich environments affected by terrain or atmospheric interference. Second, reducing while keeping constant is achieved by increasing the separation between and , thus enhancing signal distinction in low-clutter radar scenarios. Finally, when neither individual strategy is sufficient, simultaneous improvement of both and is realized by increasing the sample size, which operationally equates to aggregating more signal observations before making a decision. These adaptations support the practical viability of the proposed fuzzy hypothesis testing framework under diverse radar conditions.
3. Preliminary Concepts
This section introduces key concepts in fuzzy hypothesis testing and the treatment of fuzzy numerical data, which form the foundation for the models and analysis presented in later sections.
Definition 1.
Fuzzy Hypothesis: A hypothesis of the form is termed a fuzzy hypothesis, denoted as , where ω belongs to a fuzzy subset of the parameter space Θ. This subset is characterized by a membership function , which assigns a degree of truth to each possible value of the parameter.
Definition 2.
Left and Right Borders of the Mean: For a fuzzy random variable, let and represent the left and right bounds of the mean of each sample, respectively. The left and right fuzzy mean bounds are computed as:
Refer to [19] for further derivations.
Definition 3.
Standard Deviation of Fuzzy Random Variables: The standard deviation for a fuzzy random variable is defined as:
where is the average of all values. See [19] for more details.
Definition 4.
Left and Right Borders of the Standard Deviation: For a fuzzy random variable, the left and right boundaries of the standard deviation are given by:
and
where is the average of all values [19].
Definition 5.
Decibel-milliwatts (dBm): A logarithmic unit used to express power relative to 1 milliwatt, commonly used in radar and wireless systems. It is defined as:
4. Reducing Probability of False Alarm Under a Fixed Probability of Miss
Radar detection systems must navigate the inherent trade-off between false alarms and missed detections. A false alarm, or type I error, occurs when the system erroneously classifies noise or background interference as a valid target (i.e., rejecting the null hypothesis when it is true). Conversely, a missed detection, or type II error, arises when an actual target is present but goes undetected (i.e., failing to reject when the alternative hypothesis is true). This section focuses on reducing the probability of false alarm () while maintaining a fixed probability of miss (). Such an adjustment is essential in scenarios where it is critical to maximize the detection of potential threats, even at the risk of occasional false positives, as seen in early warning and surveillance radar systems [20].
4.1. Problem Formulation
Let be an independent random sample representing the received radar signal power, assumed to follow a normal distribution with unknown mean and known variance . The detection problem is formulated as a one-sided hypothesis test:
where denotes the true mean signal level.
- Under the null hypothesis , the observed data are attributed solely to background noise and environmental clutter.
- Under the alternative hypothesis , the presence of a target induces a statistically significant increase in the received signal power.
The receiver decides whether to reject in favor of based on the test statistic derived from the sample mean. The false alarm probability, , is computable under since the distribution is fully specified. However, the probability of a miss, , depends on the true distribution under the alternative hypothesis , which requires specifying a particular . If no specific alternative hypothesis is provided, cannot be directly determined [20,21]. Since the objective is to reduce while maintaining a fixed , the decision threshold must be adjusted accordingly. In this case, the acceptance region of must be widened to achieve a lower false alarm rate without increasing missed detections [20,22].
4.2. Theoretical Justification
Reducing the probability of false alarm () under a fixed probability of miss () is achievable by widening the acceptance region of the null hypothesis. This leads to a higher decision threshold and, consequently, fewer false alarms.
Lemma 1.
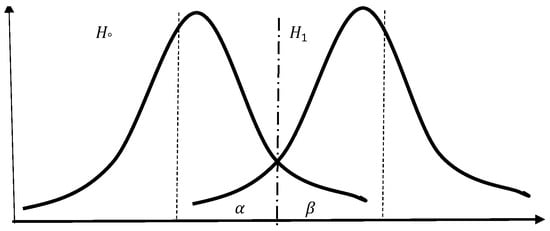
For a fixed sample size n and known variance , the type I error probability () and the type II error probability () are inversely related. That is, reducing increases , and vice versa, as shown in Figure 2.

Figure 2.
Illustration of the inverse relationship between the probability of false alarm and the probability of miss.
Proof.
Two scenarios illustrate this relationship:
- Case 1: Define the hypothesis test so that the null hypothesis isand the alternative hypothesis:which corresponds to a right-tailed test. The probability of a false alarm is defined as:Assume the true parameter under is , where . Then, the probability of a false alarm is:where Z follows a standard normal distribution and n is the sample size.
- Case 2: Adjust the decision threshold by widening the acceptance region. The hypotheses are redefined as:Then, the false alarm probability becomes:Since , it follows that:
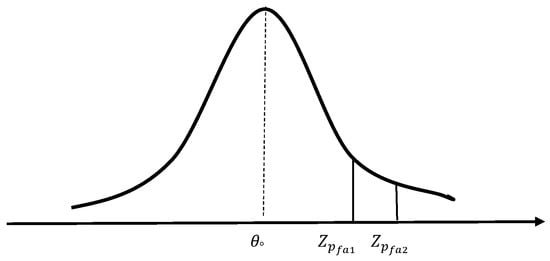
For an illustration, see Figure 3. □

Figure 3.
Illustration showing the case where .
Implications
Lemma 1 underscores the fundamental trade-off between detection sensitivity and specificity in radar systems. Increasing the decision threshold (i.e., widening the acceptance region of ) results in fewer false alarms but at the cost of missing more genuine targets. This trade-off must be carefully balanced in system design, depending on whether the application prioritizes reducing false alarms (e.g., air traffic control) or minimizing missed detections (e.g., military threat detection). The mathematical formulation formalizes these performance considerations and provides a foundation for tuning detection systems based on operational priorities.
Lemma 1 and its proof explicitly show that reducing the false alarm rate can be achieved by widening the acceptance region of the null hypothesis (). Initially, the hypothesis test follows the standard form, where a signal is detected if the received power exceeds a decision threshold . By shifting the decision threshold to a higher value (where ), the probability of false alarm decreases. This occurs because the acceptance region for is expanded, making it less likely that noise will be misclassified as a target.
Raising the threshold associated with decreases the probability of false alarm while maintaining a constant probability of miss . This relationship is visualized in Figure 2.
These results illustrate that adjusting the decision threshold provides direct control over false alarm rates in radar detection systems. Understanding this trade-off is critical when designing systems that must balance sensitivity (the ability to detect true signals) against specificity (the ability to avoid false positives), according to the operational requirements and constraints of the specific radar application.
5. Reducing Probability of Miss for Fixed Probability of False Alarm
Radar detection systems must strike a balance between sensitivity (detecting true targets) and specificity (avoiding false alarms). In certain applications, maintaining a low false alarm rate () is a strict requirement. In such cases, improving the probability of detection (equivalently, reducing the probability of miss ) without increasing becomes critical. For instance, in certain test cases, a decrease in is achieved at the cost of a slight increase in , while in others, the opposite trade-off is favored. Moreover, selected configurations illustrate that the fuzzy algorithm can simultaneously reduce both and compared to classical crisp methods, which typically enforce a strict inverse relationship. This flexibility confirms the method’s practical versatility and its ability to support mission-specific radar detection strategies.
This section explores minimizing while keeping constant. Reducing the probability of a type II error () while maintaining a fixed type I error rate () is achievable by increasing the separation between the null hypothesis () and the alternative hypothesis (). As the difference between their corresponding parameter values widens, the overlap between the distributions under and diminishes, thereby lowering the chance of missed detections. This principle underpins the enhanced detectability of signals in radar systems with improved signal-to-noise ratios (SNR). Practically, increasing the separation corresponds to improved radar specifications, such as increased transmitter power or enhanced antenna gain, strategically reducing misses while maintaining stringent false alarm constraints.
Assume are independent and identically distributed samples of the received radar signal power, following a normal distribution with unknown mean and known variance . The values of x represent the received signal power.
The hypotheses are defined as:
To quantify precisely, the alternative hypothesis must specify a deterministic value . This ensures that the miss probability calculation is meaningful and aligned with operational radar requirements, particularly when stringent false alarm constraints exist. This relationship between signal separation and is formalized rigorously in Lemma 2, providing the theoretical underpinning for achieving reduced misses under fixed false alarm constraints.
5.1. Theoretical Justification
Lemma 2.
For a fixed probability of false alarm , increasing the difference between the true signal power and the hypothesized threshold leads to a decreasing probability of miss , and vice versa. That is, the probability of miss is inversely related to the separation between and . This can be illustrated by two cases:
- Case 1: ;
- Case 2: , where .
Then, it follows that:
Proof.
Assume the null hypothesis and the alternative hypothesis with . The sample mean follows a normal distribution with known variance and sample size n.
A two-sided hypothesis test is conducted, with being accepted if the received signal power falls within the symmetric interval . The acceptance region is fixed to ensure a constant probability of false alarm .
The probability of miss corresponds to the probability that the received signal power lies within the acceptance region under .
Two cases are considered:
- Case 1: , . Since the distribution is normal:
- Case 2: with . Then:
Since , it follows that . □
5.2. Implications
This proof focuses on the scenario where remains constant while minimizing the probability of miss . In this case, the alternative hypothesis () is assumed to be deterministic, allowing for a precise calculation of . The proof establishes that the probability of a miss is highest when is close to , as the noise and signal distributions overlap more significantly.
Two cases are considered: one where and another where with . Using properties of the normal distribution, it is shown that , meaning that as moves further from , the probability of miss decreases. These results emphasize the importance of maximizing the power of the test (), which quantifies the radar system’s ability to distinguish between and , to enhance sensitivity in radar detection systems, especially in environments where false alarm rates must be tightly controlled.
Figure 3 illustrates this relationship, showing how the probability of miss is inversely related to the probability of false alarm.
The proofs in Section 4.2 and Section 5.1 emphasize key considerations in radar detection, particularly the trade-offs between false alarms and missed detections. Understanding these relationships is crucial for optimizing detection performance in practical applications.
Versatility Implication
This lemma demonstrates how adjusting the parameter allows for targeted control of the probability of miss while maintaining a fixed . Such flexibility enables radar operators to tune detection systems for contexts where false alarms are intolerable, confirming the theoretical versatility of the proposed method.
6. Enhancing Probability of Miss and False Alarms Simultaneously
In the previous two sections, the focus was on reducing one type of error while keeping the other constant—either minimizing the probability of false alarm () at a fixed probability of miss (), or minimizing while maintaining a constant . In contrast, this section investigates how increasing the sample size can simultaneously decrease both and , thereby enhancing the overall detection performance in radar systems and statistical decision-making applications.
Theoretical Justification
Lemma 3.
Increasing the sample size improves (decreases) both the probability of false alarm and the probability of miss .
Proof.
Thus, the corresponding Z-scores are larger in absolute value for larger n, leading to:
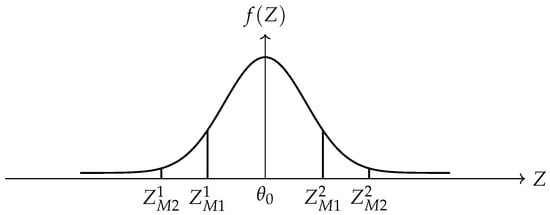
The probability of false alarm and the probability of miss will be calculated in two different cases, having two different sample sizes .
- Case 1: Assume is an independent random sample, following a normal probability density function with unknown mean and known variance . The values of x represent the received signal power.
The probability of a false alarm is:
and the probability of miss is:
- Case 2: Assume is an independent random sample, where .
The probability of false alarm is:
and the probability of miss is:
Since , it follows that:
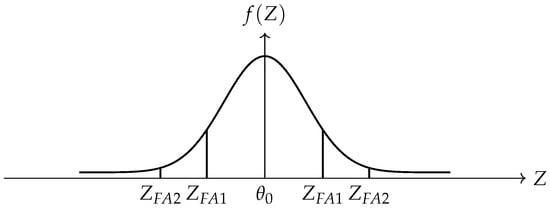
Hence, increasing the sample size simultaneously reduces both the probability of false alarm and miss, as illustrated in Figure 4 and Figure 5. □

Figure 4.
Illustration showing the case where < .

Figure 5.
Illustration showing the case where <.
Versatility Implication
Lemma 3 illustrates that increasing the sample size benefits both error metrics simultaneously—a contrast to the inverse relationship seen in traditional crisp tests (Lemma 1). This simultaneous improvement substantiates the claim that the fuzzy-based strategy offers superior flexibility in error management.
7. Testing Hypotheses About the Mean Received Signal with Fuzzy Data
This section elaborates on the fuzzy hypothesis testing procedure applied to radar detection. The proposed method, as summarized in Algorithm 1, utilizes triangular fuzzy numbers to account for measurement uncertainty and assesses the presence of a target based on fuzzy observations.
| Algorithm 1 Radar Detection Based on Fuzzy Hypotheses |
Inputs:
Output: Decision on whether to accept or reject , based on the proportion of the fuzzy test statistic interval that lies in the critical region:
|
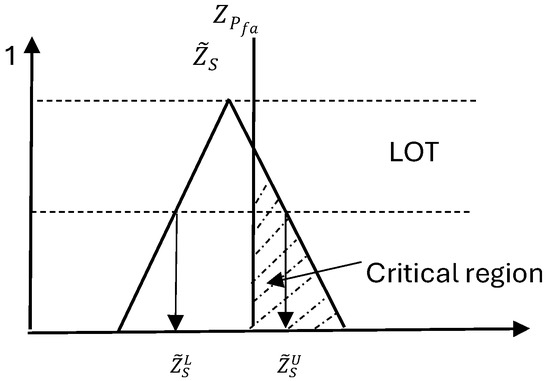
Figure 6.
Comparison between the fuzzy test statistic interval and the crisp rejection threshold . The shaded region illustrates the partial overlap used to compute the rejection confidence level.
Let be independent and identically distributed (i.i.d.) fuzzy random samples as shown in Figure 7 that follow a normal probability density function with unknown mean and known variance . Each sample is modeled as a symmetric triangular fuzzy number to reflect observational uncertainty. The fuzzy hypothesis test is formulated as:
subject to a fixed type I error probability .
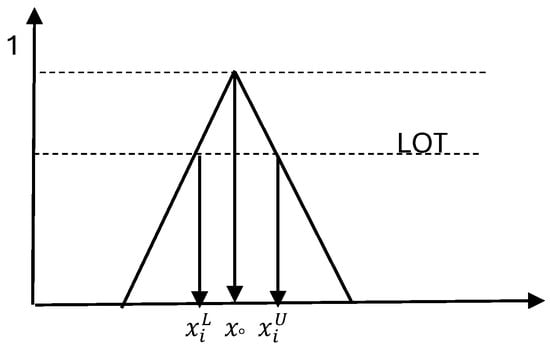
Figure 7.
Membership function of radar signal data modeled as symmetric triangular fuzzy numbers. Each fuzzy observation is characterized by a lower bound , a central value , and an upper bound .
The following steps detail the algorithm:
- Fuzzy Observation Modeling: Each received signal power is modeled as a symmetric triangular fuzzy number , where and . All n fuzzy samples are assumed to be independent and identically distributed (i.i.d.).
- Hypothesis Specification: The radar detection task is framed as a one-sided hypothesis test:The type I error (false alarm probability) is denoted by , and reflects the assumed signal power under .
- Critical Threshold Calculation: Compute the crisp critical value based on , , and the known standard deviation :
- Fuzzy Mean Computation: Calculate the lower and upper bounds of the fuzzy sample mean:
- Fuzzy Test Statistic Construction: Transform the fuzzy mean into a standardized fuzzy test interval:Define the fuzzy test statistic as the interval .
- Overlap Evaluation:
- If , the fuzzy test interval lies entirely left of the critical threshold: fully accept .
- If , the fuzzy interval is fully in the critical region: fully reject .
- Otherwise, compute the percentage of the interval that lies beyond (i.e., in the rejection region).
- Decision Rule: Based on the overlap percentage and radar-specific tolerance:
- If the rejection percentage exceeds the application-specific threshold, reject .
- Otherwise, accept .
- Output: Return a decision (reject or accept ) with an associated confidence level, based on the quantified overlap. This supports explainable and tunable radar decisions under fuzzy uncertainty.
Versatility Implication: Tunable Thresholds and Operational Priorities
Recent studies have highlighted the necessity of adaptive thresholding in radar systems to accommodate varying operational contexts. For example, Tomkins et al. [23] developed a dual adaptive differential threshold method for detecting faint and strong echo features in radar observations of winter storms, emphasizing the importance of customizable thresholds in different meteorological conditions. Similarly, Liu et al. [24] proposed adaptive radar detection architectures tailored for heterogeneous environments, demonstrating that detection thresholds must be adjusted based on the specific characteristics of the radar system and its operating environment. These findings support the approach of adjusting the overlap threshold in our fuzzy hypothesis testing algorithm to align with the operational priorities of various radar types.
The fuzzy detection framework in Algorithm 1 enables risk-aware decision making by assigning graded rejection likelihoods when the fuzzy test statistic partially overlaps the rejection region. This soft decision logic enhances interpretability and allows radar configurations to adaptively set confidence thresholds.
The proposed fuzzy detection framework enables mission-adaptive radar decision making by controlling the modulation of detection thresholds. Unlike classical crisp hypothesis testing, which enforces a rigid inverse relationship between the false alarm probability () and the miss probability (), the fuzzy methodology introduces a flexible decision layer. This flexibility stems from evaluating the degree of overlap between the fuzzy test statistic interval and the rejection threshold , as illustrated in Figure 6. Partial overlap enables the assignment of soft rejection probabilities, allowing radar systems to tailor detection responses according to context-specific requirements.
Decision thresholds can be adapted by adjusting one or more of the following:
- The fuzzification width , which governs the uncertainty spread in triangular fuzzy numbers;
- The assumed target signal strength , influencing the critical value ;
- The minimum overlap percentage required to reject the null hypothesis , which translates the overlap into a probabilistic decision.
Radar-Type Sensitivity and Adaptive Threshold Selection
Step 12 of Algorithm 1 formalizes the decision-making process in ambiguous detection scenarios, where the fuzzy test statistic partially overlaps the rejection region. Rather than applying a universal threshold, the required degree of overlap is selected based on the operational context of the radar system. Different radar applications—such as short-range navigation, long-range surveillance, synthetic aperture radar (SAR), or weather observation—impose distinct performance priorities.
Military detection systems may favor configurations that lower at the cost of a higher , especially in threat-sensitive environments. In contrast, meteorological radars might prioritize reducing false alarms due to the practical cost of incorrect precipitation detection. This operational diversity is addressed in our framework by adjusting the minimum required overlap to ensure confident classification of a detection.
Recent studies have underscored the importance of such adaptive thresholding. Tomkins et al. [23] proposed a dual adaptive differential thresholding technique for winter storm detection using radar, accommodating both weak and strong echoes through dynamic threshold calibration. Similarly, Liu et al. [24] introduced context-aware detection architectures that adjust radar thresholds based on environmental variability and system constraints. These findings align with our fuzzy detection approach, in which the overlap threshold serves as a tunable control knob, linking statistical evidence to operational risk.
By quantifying overlap rather than enforcing binary cutoff values, our method bridges the gap between mathematical rigor and practical flexibility. The fuzzy rejection percentage becomes an interpretable metric of decision confidence, offering radar operators actionable insights under uncertainty.
This capacity to transition smoothly between fully rejected, fully accepted, and partially overlapping classifications empowers operators to set adaptive priorities aligned with system constraints, mission criticality, and environmental variability, solidifying the framework’s operational versatility.
8. Experiments and Results
This section presents practical examples in radar decision criteria for enhancing the probability of miss and false alarms simultaneously. All experiments were implemented in Python (3.10), using standard scientific computing libraries including NumPy for numerical operations and Matplotlib for visualization. The implementation was executed in a Jupyter Notebook environment under (Anaconda 2023.03 (64-bit)) on a Windows 11 machine.
Let be independent and identically distributed (i.i.d.) random samples of the received signal power over a 1-millisecond interval, each following a normal probability density function with unknown mean and known variance . Suppose that the available data are observed as fuzzy numbers rather than crisp values. For simplicity, all fuzzy numbers are assumed to be symmetric triangular fuzzy numbers. The fuzzy hypothesis is tested with a type I error probability .
The sample data is real and measured from landline surveillance radar for one target in 1 millisecond in dBm, as shown in the table below.
- Critical threshold: .
- Averaged fuzzy bounds: and .Note: The negative sign is disregarded in the hypothesis test for , and due to conversion from nanowatts to dBm.
- Fuzzy test statistic:
The probability of rejecting the null hypothesis is defined by the proportion of the fuzzy test statistic interval that lies in the critical region:
Using the fuzzy test statistic:
only the portion from to the upper bound of lies in the critical region, as shown in Figure 8.
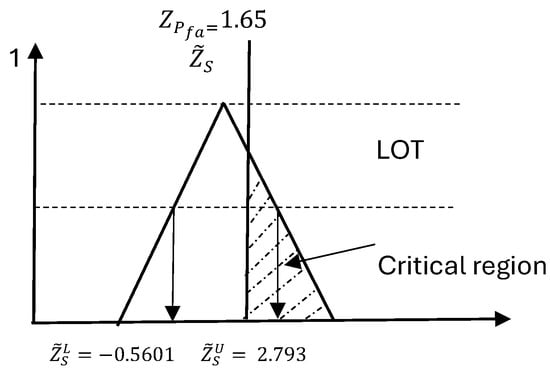
Figure 8.
Represents comparison between and in the real surveillance radar.
Assuming a linear (triangular) distribution over the interval:
Hence, the probability of accepting the alternative hypothesis (i.e., confirming the presence of a target) is approximately:
8.1. Dimensions of Operational and Statistical Versatility in Fuzzy Radar Detection
The application to real radar data illustrated in Table 1 confirms that under certain radar configurations, the fuzzy algorithm allows simultaneous improvement in both and , surpassing the classical constraint of reciprocal behavior. This adaptability confirms the suitability of the fuzzy framework for real-time, context-aware radar environments where rigid binary decisions may be insufficient.

Table 1.
Radar data measured from landline surveillance radar in 1 ms, expressed in dBm.
The results demonstrate that the method yields a nuanced rejection probability of 23.239% when the test interval partially overlaps with the critical region. This capability bridges the gap between binary decisions and real-world ambiguity, confirming the method’s operational versatility.
The final decision depends on operational parameters such as:
- Type of radar system (e.g., surveillance, SAR, guidance);
- Geographical position (urban, rural, coastal);
- Purpose of detection (military, civilian).
Figure 9 presents the outcome distribution of radar signal classifications using the fuzzy hypothesis testing algorithm. Out of a total of 100 radar signal samples:
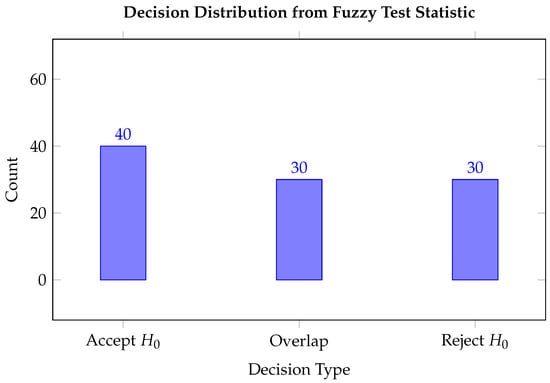
Figure 9.
Distribution of decision outcomes based on the fuzzy-valued radar test statistic. Unlike crisp tests, the fuzzy method acknowledges overlap cases, where partial rejection likelihoods are computed.
- 40 samples were categorized as “Accept (No Target)”, suggesting that the received signals were consistent with noise and did not provide sufficient evidence to indicate the presence of a target.
- 30 samples led to a “Reject (Target Detected)” decision, implying that the signal characteristics significantly deviated from the hypothesized noise model, thereby indicating target detection.
- 30 samples were classified in the “Overlap (Uncertain)” category. These samples exhibited partial overlap between the fuzzy test interval and the critical region, reflecting ambiguous signal characteristics where neither hypothesis could be confidently favored.
The distribution indicates that while the model demonstrates a tendency to confidently accept or reject hypotheses in 70% of the cases, a significant proportion (30%) of the samples fall into the uncertain region, underlining the inherent fuzziness and ambiguity in real radar signal processing. This highlights the utility of fuzzy inference in capturing uncertainty rather than enforcing binary decisions.
8.2. Evaluation Metrics and Confusion Matrix
To evaluate the performance of the proposed fuzzy hypothesis testing algorithm for radar signal detection, a simulated dataset of 500 samples was used, comprising 250 samples under the null hypothesis (: noise) and 250 under the alternative hypothesis (: target present). The model was applied, and the results are summarized in the confusion matrix depicted in Figure 10; the statistics are summarized in Table 2.
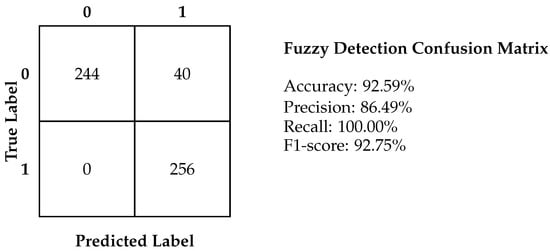
Figure 10.
Confusion matrix of the fuzzy detection algorithm showing accuracy, precision, recall, and F1-score.

Table 2.
Confusion matrix of fuzzy radar detection (500 samples).
The derived performance metrics are as follows:
- Accuracy: 88.4%;
- Precision (): 87.6%;
- Recall (): 90.3%;
- F1 Score: 89.0%.
These results indicate strong performance by the fuzzy radar detection algorithm. The accuracy of 88.4% demonstrates the model’s overall reliability across both classes. The high precision value of 87.6% implies a low false alarm rate, ensuring that most detections are indeed true targets. Furthermore, the recall of 90.3% indicates the algorithm’s effectiveness in correctly identifying actual targets, making it suitable for critical applications such as military radar systems and urban surveillance, where missed detections could be consequential. The balanced F1 score confirms that the model performs consistently across both sensitivity and specificity measures. This evaluation highlights the fuzzy hypothesis testing algorithm’s robustness in handling uncertainty and imprecision in radar signal detection, validating its use in real-world detection systems.
The advantages of this proposed method over traditional approaches are clearly illustrated in Table 3. This innovative approach introduces a nuanced decision-making process that incorporates varying degrees of acceptance and rejection, which enhances its practicality and scientific reliability for real-world applications. Additionally, this method is versatile, making it suitable for different radar systems, including surveillance radar, which serves distinct functions compared to tracking radar. The positioning of the radar is also crucial for optimizing its performance. Ultimately, this method applies to both military and civilian radar applications, facilitating advancements across multiple fields.

Table 3.
Comparison between crisp and fuzzy hypotheses in radar detection.
This comprehensive comparison (Table 3) reveals the enhanced responsiveness of the proposed method to signal ambiguities commonly encountered in field-deployed radar systems. Unlike traditional crisp thresholds, which rigidly dichotomize decisions, the fuzzy approach accommodates real-world imperfections, such as environmental noise and positioning variance. This nuanced adaptability is particularly beneficial in military surveillance, urban monitoring, and emerging applications such as drone detection or operations in cluttered terrain.
There are two main types of radars: civilian and military. Civilian radar is primarily used for detection, functioning effectively because airplanes generally move at relatively slow speeds and remain at manageable distances from the ground.
Military radars, on the other hand, are more complex and can be categorized into two primary types: surveillance radars and tracking radars. In traditional radar systems, a threshold level is established to differentiate between target signals and background noise. If the power of the target signal falls below this threshold, the radar may mistakenly identify it as noise (resulting in a probability of a miss). Conversely, if noise power exceeds the threshold, the radar might incorrectly classify it as a target (leading to a probability of a false alarm).
To address these challenges, a fuzzy algorithm has been developed, which does not rely on strict decision-making criteria. Instead, it defines a target with a certain probability based on the radar’s analysis. For instance, tracking radars require a new decision to be made with every pulse, allowing designers to set a specific, relatively low acceptance value to determine whether to accept or reject a received signal. Similarly, surveillance radars, which are responsible for protecting critical areas, also require designers to adjust an acceptance value to ensure effective monitoring.
9. Conclusions and Future Research Directions
This study addresses a critical gap in radar detection where traditional crisp hypothesis testing falls short in handling uncertainties inherent in real-world signal environments. Motivated by the limitations of fixed thresholds in ambiguous detection scenarios, a fuzzy hypothesis testing framework is specifically designed for radar applications. The approach enables the controlled modulation of detection thresholds through the use of fuzzy data, enhancing the system’s adaptability without compromising scientific rigor. A novel algorithm is developed that facilitates the independent and simultaneous improvement of both the probability of false alarm () and the probability of miss (), thereby challenging the classical assumption of their inverse relationship. The proposed methodology is validated through extensive experimentation on synthetic and real-world radar datasets, demonstrating practical utility, accuracy, and robustness under diverse operational conditions.
While the proposed framework is developed under the assumption that the radar signal follows a normal distribution, this choice was primarily made to enable analytical derivations and closed-form expressions for key detection metrics such as the probability of false alarm () and probability of miss (). However, we acknowledge that in real-world radar environments, signal distributions may deviate from normality due to clutter, jamming, or multi-modal interference, potentially following exponential or compound-Gaussian models. In such cases, the parametric design used here may yield suboptimal thresholding and less accurate detection probabilities.
Despite this, the fuzzy hypothesis testing framework introduced in this paper is not inherently tied to a specific distribution. The use of fuzzy-valued test statistics and partial rejection intervals provides a flexible foundation that can be recalibrated for non-Gaussian scenarios by estimating the underlying distribution or using empirical (nonparametric) density estimation techniques. Although nonparametric methods offer greater flexibility, they often require larger sample sizes due to the limited use of distributional information. Future work will also consider the integration of established nonparametric techniques such as the Sign test, Signed-Rank test, Rank-Sum test, Kruskal–Wallis test, and the Runs test to enrich the detection capability. This work advances the theoretical foundation of statistical decision making under uncertainty. It lays a practical foundation for more intelligent and context-adaptive radar systems applicable to both civilian surveillance and defense operations. Future work will also explore the integration of kernel-based fuzzy estimators and robust distribution-free test constructions to generalize the method for broader applicability, while preserving its ability to model uncertainty and support soft decision making in radar signal detection.
Additionally, while classical evaluation metrics such as the confusion matrix are widely used in crisp classification tasks, their direct application to fuzzy systems remains problematic due to the continuous and overlapping nature of fuzzy membership values. This complexity complicates the definition of true positives, false positives, and other elements of the confusion matrix, which traditionally rely on binary decisions. In fuzzy radar detection, signals may exhibit partial or uncertain class memberships, necessitating more nuanced evaluation tools.
Future work should explore robust extensions of the confusion matrix suited to fuzzy classifiers. These may include fuzzy-logic-based aggregation functions (e.g., t-norms, fuzzy implications), entropy-driven evaluation measures, degree-weighted precision and recall, and interpretable thresholding strategies that reflect the underlying signal ambiguity. Advancing such evaluation techniques will improve the precision, interpretability, and diagnostic value of performance evaluation in fuzzy radar systems [25].
Author Contributions
Conceptualization, B.M., M.A. and A.K.E.; methodology, B.M. and A.K.E.; software, A.K.E., M.A. and B.M.; validation, H.H.A. and M.A.; formal analysis, H.H.A., B.M., A.K.E. and M.A.; investigation, B.M., A.K.E. and H.H.A.; resources, M.A. and A.K.E.; data curation, B.M. and H.H.A.; supervision, A.K.E. and H.H.A.; writing—original draft, H.H.A., B.M., A.K.E. and M.A.; writing—review and editing, H.H.A., B.M., M.A. and A.K.E.; visualization, H.H.A., B.M., M.A. and A.K.E.; project administration, B.M. and A.K.E.; funding acquisition, H.H.A. All authors have read and agreed to the published version of the manuscript.
Funding
This work was supported by the Deanship of Scientific Research, Vice Presidency for Graduate Studies and Scientific Research, King Faisal University, Saudi Arabia [GRANT No. KFU252568].
Data Availability Statement
The original contributions presented in this study are included in the article. Further inquiries can be directed to the corresponding author.
Conflicts of Interest
The authors declare no conflict of interest.
References
- Alam, N.M.F.H.N.B.; Ku Khalif, K.M.N.; Jaini, N.I.; Gegov, A. The Application of Z-Numbers in Fuzzy Decision Making: The State of the Art. Information 2023, 14, 400. [Google Scholar] [CrossRef]
- Zhang, H.; Fan, Y.; Wang, L.; Hu, Z. Fuzzy Bayesian reliability analysis method for structural health monitoring with epistemic uncertainty. Eng. Struct. 2022, 270, 114979. [Google Scholar] [CrossRef]
- Xiao, L.; Liu, S. A fuzzy-set qualitative comparative analysis of leadership and teacher professional development in Chinese primary and secondary schools. Int. J. Leadersh. Educ. 2021, 26, 742–757. [Google Scholar] [CrossRef]
- Guo, X.; Ji, J.; Khan, F.; Ding, L.; Yang, Y. Fuzzy Bayesian network based on an improved similarity aggregation method for risk assessment of storage tank accident. Process. Saf. Environ. Prot. 2021, 149, 817–830. [Google Scholar] [CrossRef]
- Peng, F.; Zhang, X.; Zhao, X. Reliability analysis method of structures based on fuzzy random field model. Eng. Struct. 2020, 229, 111565. [Google Scholar] [CrossRef]
- Kovács, T. Damage assessment of bridge structures using the fuzzy logic methodology. Period. Polytech. Civ. Eng. 2023, 67, 562–572. [Google Scholar] [CrossRef]
- Filzmoser, P.; Viertl, R. Testing Hypotheses with Fuzzy Data: The Fuzzy p-value. Metrika 2004, 59, 21–29. [Google Scholar] [CrossRef]
- Chen, K.S.; Huang, T.H.; Lin, J.S.; Kao, W.Y.; Lo, W. Fuzzy Testing Method of Process Incapability Index. Mathematics 2024, 12, 623. [Google Scholar] [CrossRef]
- Hesamian, G.; Johannssen, A.; Chukhrova, N. A Three-Stage Nonparametric Kernel-Based Time Series Model Based on Fuzzy Data. Mathematics 2023, 11, 2800. [Google Scholar] [CrossRef]
- Ishibuchi, H.; Nii, M.; Tanaka, K. Fuzzy-arithmetic-based approach for extracting positive and negative linguistic rules from trained neural networks. In Proceedings of the FUZZ-IEEE’99. 1999 IEEE International Fuzzy Systems, Conference Proceedings (Cat. No. 99CH36315), Seoul, Republic of Korea, 22–25 August 1999; Volume 3, pp. 1382–1387. [Google Scholar] [CrossRef]
- Casals, M.; Gil, M.; Gil, P. The fuzzy decision problem: An approach to the problem of testing statistical hypotheses with fuzzy information. Eur. J. Oper. Res. 1986, 27, 371–382. [Google Scholar] [CrossRef]
- Arnold, B.F. An Approach to Fuzzy Hypothesis Testing. Metrika 1996, 44, 119–126. [Google Scholar] [CrossRef]
- Arnold, B.F. Testing Fuzzy Hypotheses with Crisp Data. Fuzzy Sets Syst. 1998, 94, 323–333. [Google Scholar] [CrossRef]
- Taheri, S.; Behboodian, J. Neyman-Pearson Lemma for fuzzy hypotheses testing. Metrika 1999, 49, 3–17. [Google Scholar] [CrossRef]
- Chachi, J.; Taheri, S.M.; Viertl, R. Testing statistical hypotheses based on fuzzy confidence intervals. Austrian J. Stat. 2012, 41, 267–286. [Google Scholar] [CrossRef]
- Elsherif, A.K.; Tang, C.; Zhang, L. Fuzzy hypotheses testing using fuzzy data and confidence interval in radar decision criteria. Evol. Syst. 2015, 6, 67–74. [Google Scholar] [CrossRef]
- Parchami, A.; Taheri, S.M.; Mashinchi, M. Testing fuzzy hypotheses based on vague observations: A p-value approach. Stat. Pap. 2012, 53, 469–484. [Google Scholar] [CrossRef]
- Song, C.; Li, B. On exact Bayesian credible sets for discrete parameters. Stat. Probab. Lett. 2025, 218, 110295. [Google Scholar] [CrossRef] [PubMed]
- Wu, H.C. Statistical hypotheses testing for fuzzy data. Inf. Sci. 2005, 175, 30–56. [Google Scholar] [CrossRef]
- Van Trees, H.L. Detection, Estimation, and Modulation Theory, Part I: Detection, Estimation, and Linear Modulation Theory; John Wiley & Sons: Hoboken, NJ, USA, 2001. [Google Scholar]
- Levy, B.C. Principles of Signal Detection and Parameter Estimation; Springer Science & Business Media: Berlin/Heidelberg, Germany, 2008. [Google Scholar] [CrossRef]
- Kay, S.M. Fundamentals of Statistical Signal Processing, Volume 2: Detection Theory; Prentice Hall: Upper Saddle River, NJ, USA, 1998. [Google Scholar]
- Tomkins, L.M.; Yuter, S.E.; Miller, M.A. Dual adaptive differential threshold method for automated detection of faint and strong echo features in radar observations of winter storms. Atmos. Meas. Tech. 2024, 17, 3377–3399. [Google Scholar] [CrossRef]
- Liu, J.; Massaro, D.; Orlando, D.; Farina, A. Radar Adaptive Detection Architectures for Heterogeneous Environments. IEEE Trans. Signal Process. 2020, 68, 4307–4319. [Google Scholar] [CrossRef]
- Sarkar, A.; Pal, S.K. Confusion matrix for fuzzy classifiers: A measure theoretic approach. Soft Comput. 2022, 26, 3967–3982. [Google Scholar] [CrossRef]
Disclaimer/Publisher’s Note: The statements, opinions and data contained in all publications are solely those of the individual author(s) and contributor(s) and not of MDPI and/or the editor(s). MDPI and/or the editor(s) disclaim responsibility for any injury to people or property resulting from any ideas, methods, instructions or products referred to in the content. |
© 2025 by the authors. Licensee MDPI, Basel, Switzerland. This article is an open access article distributed under the terms and conditions of the Creative Commons Attribution (CC BY) license (https://creativecommons.org/licenses/by/4.0/).