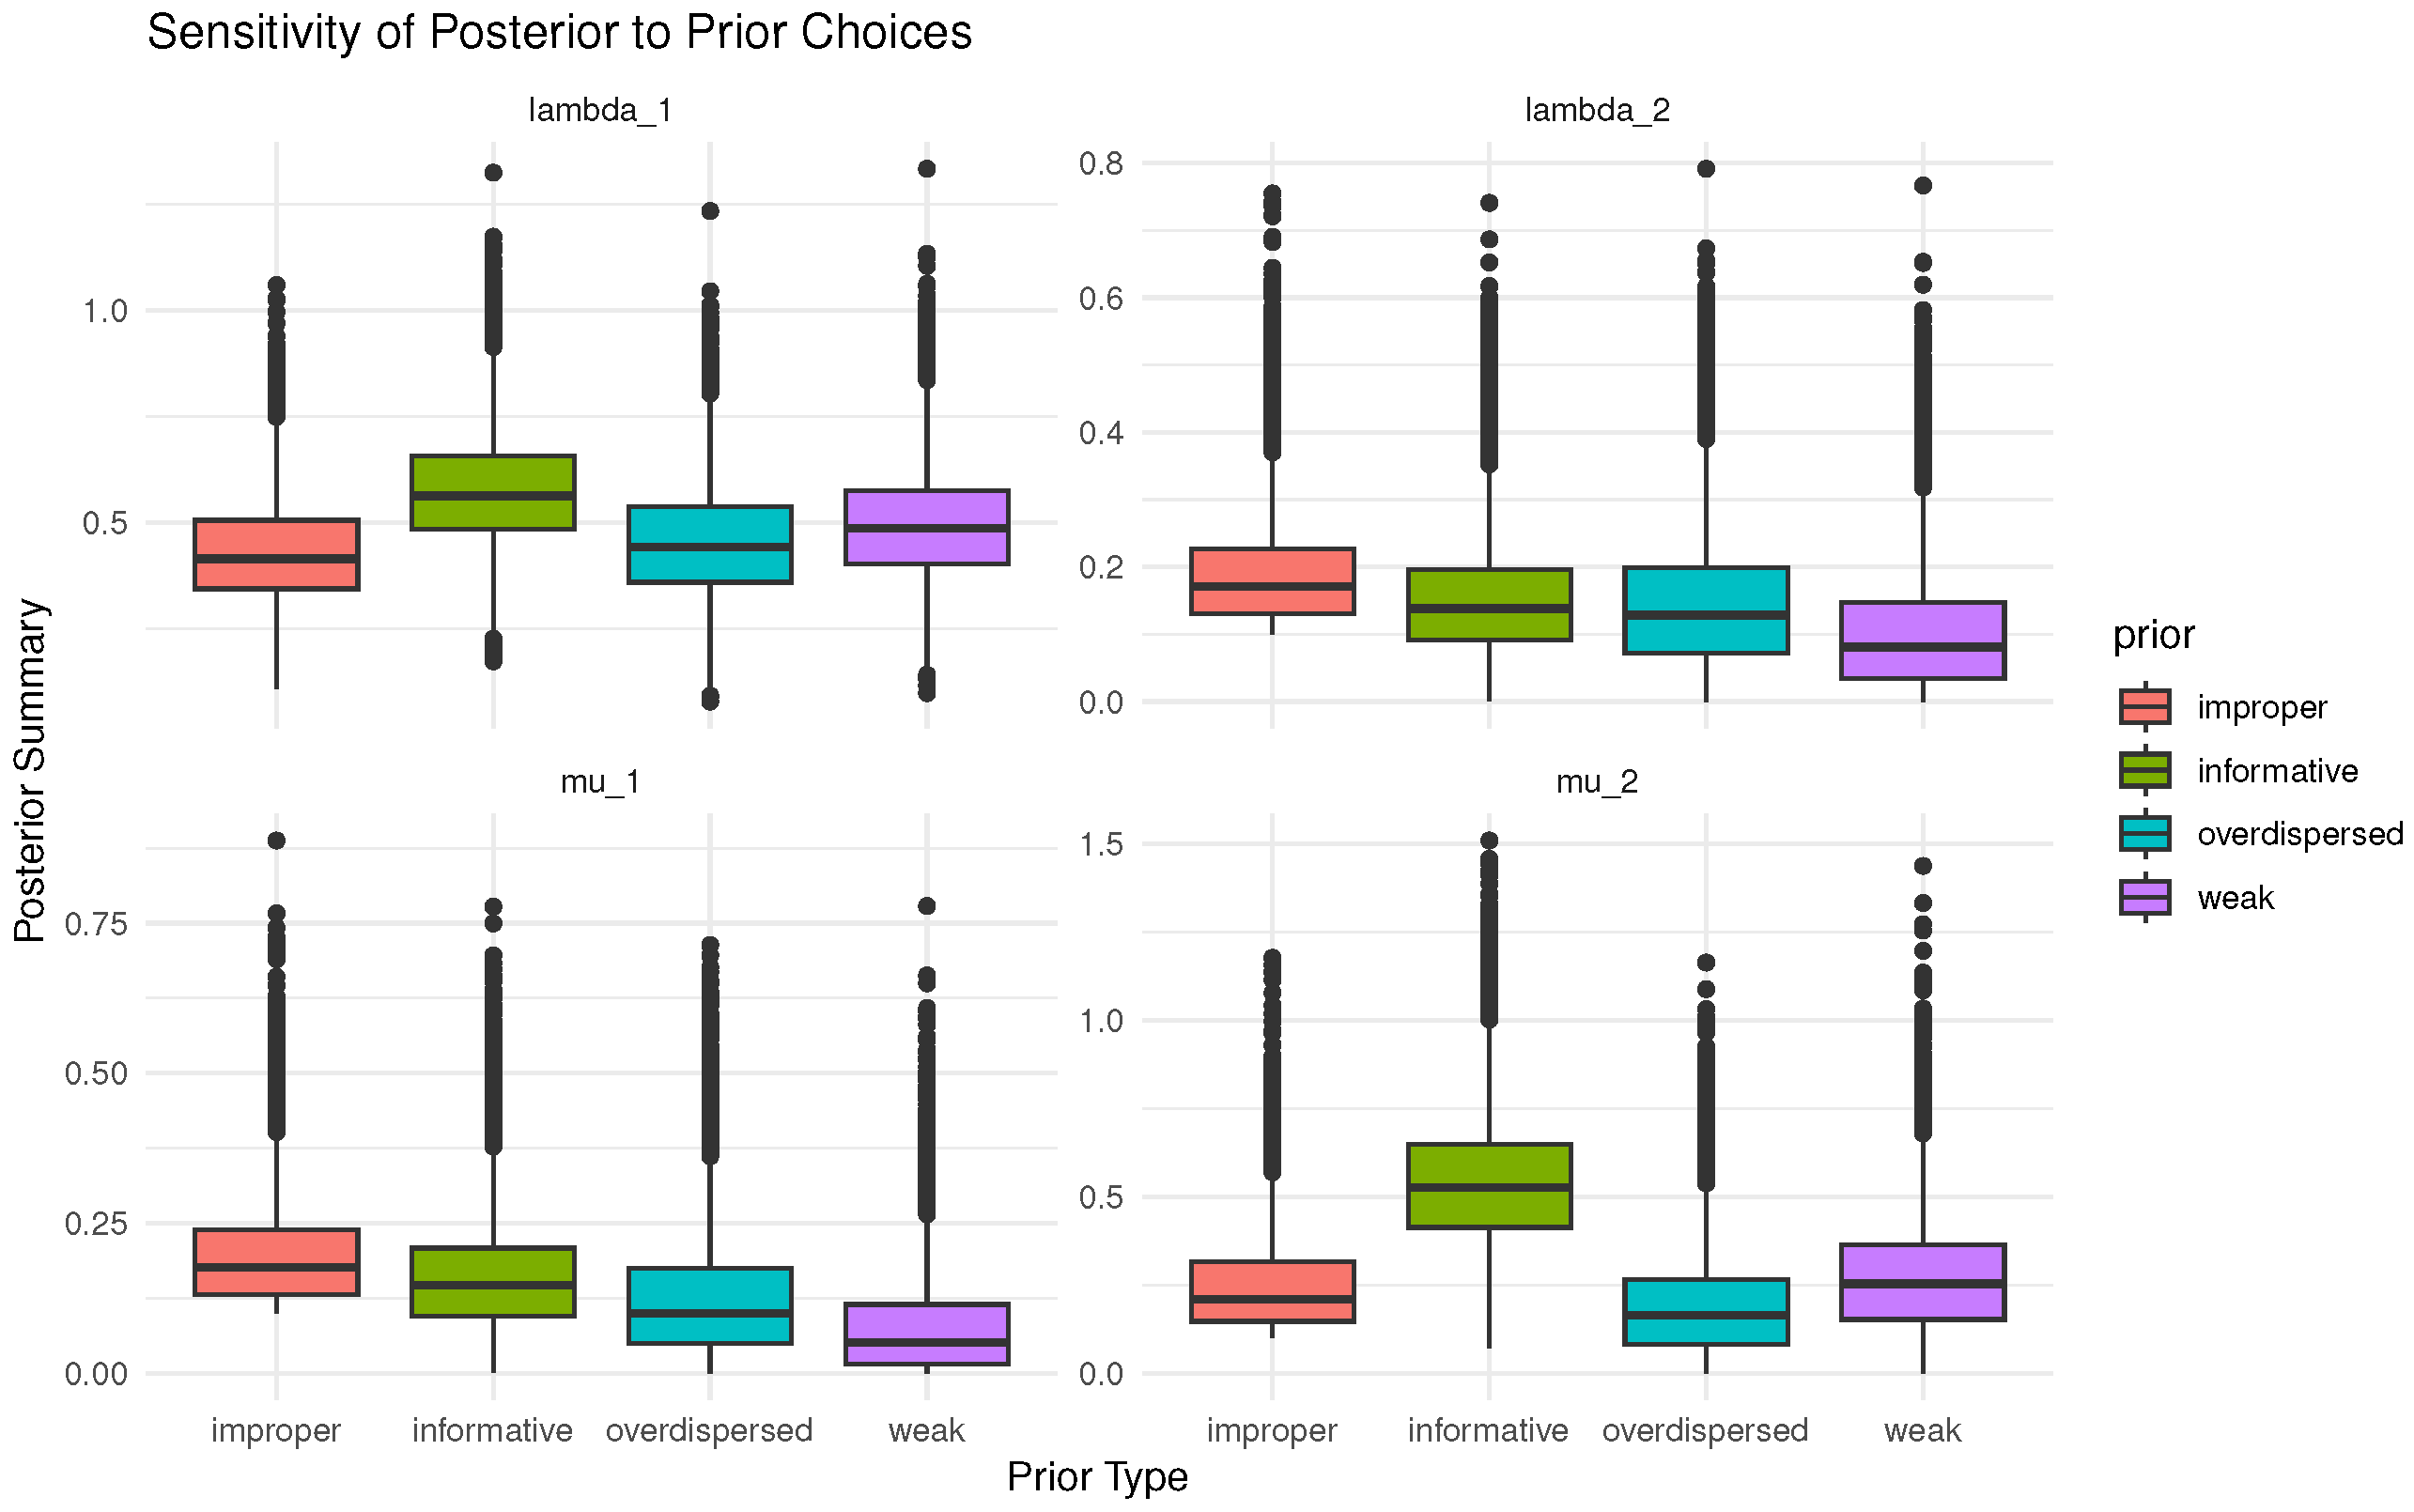
Figure 1.
Posterior sensitivity to prior type.
Figure 1.
Posterior sensitivity to prior type.
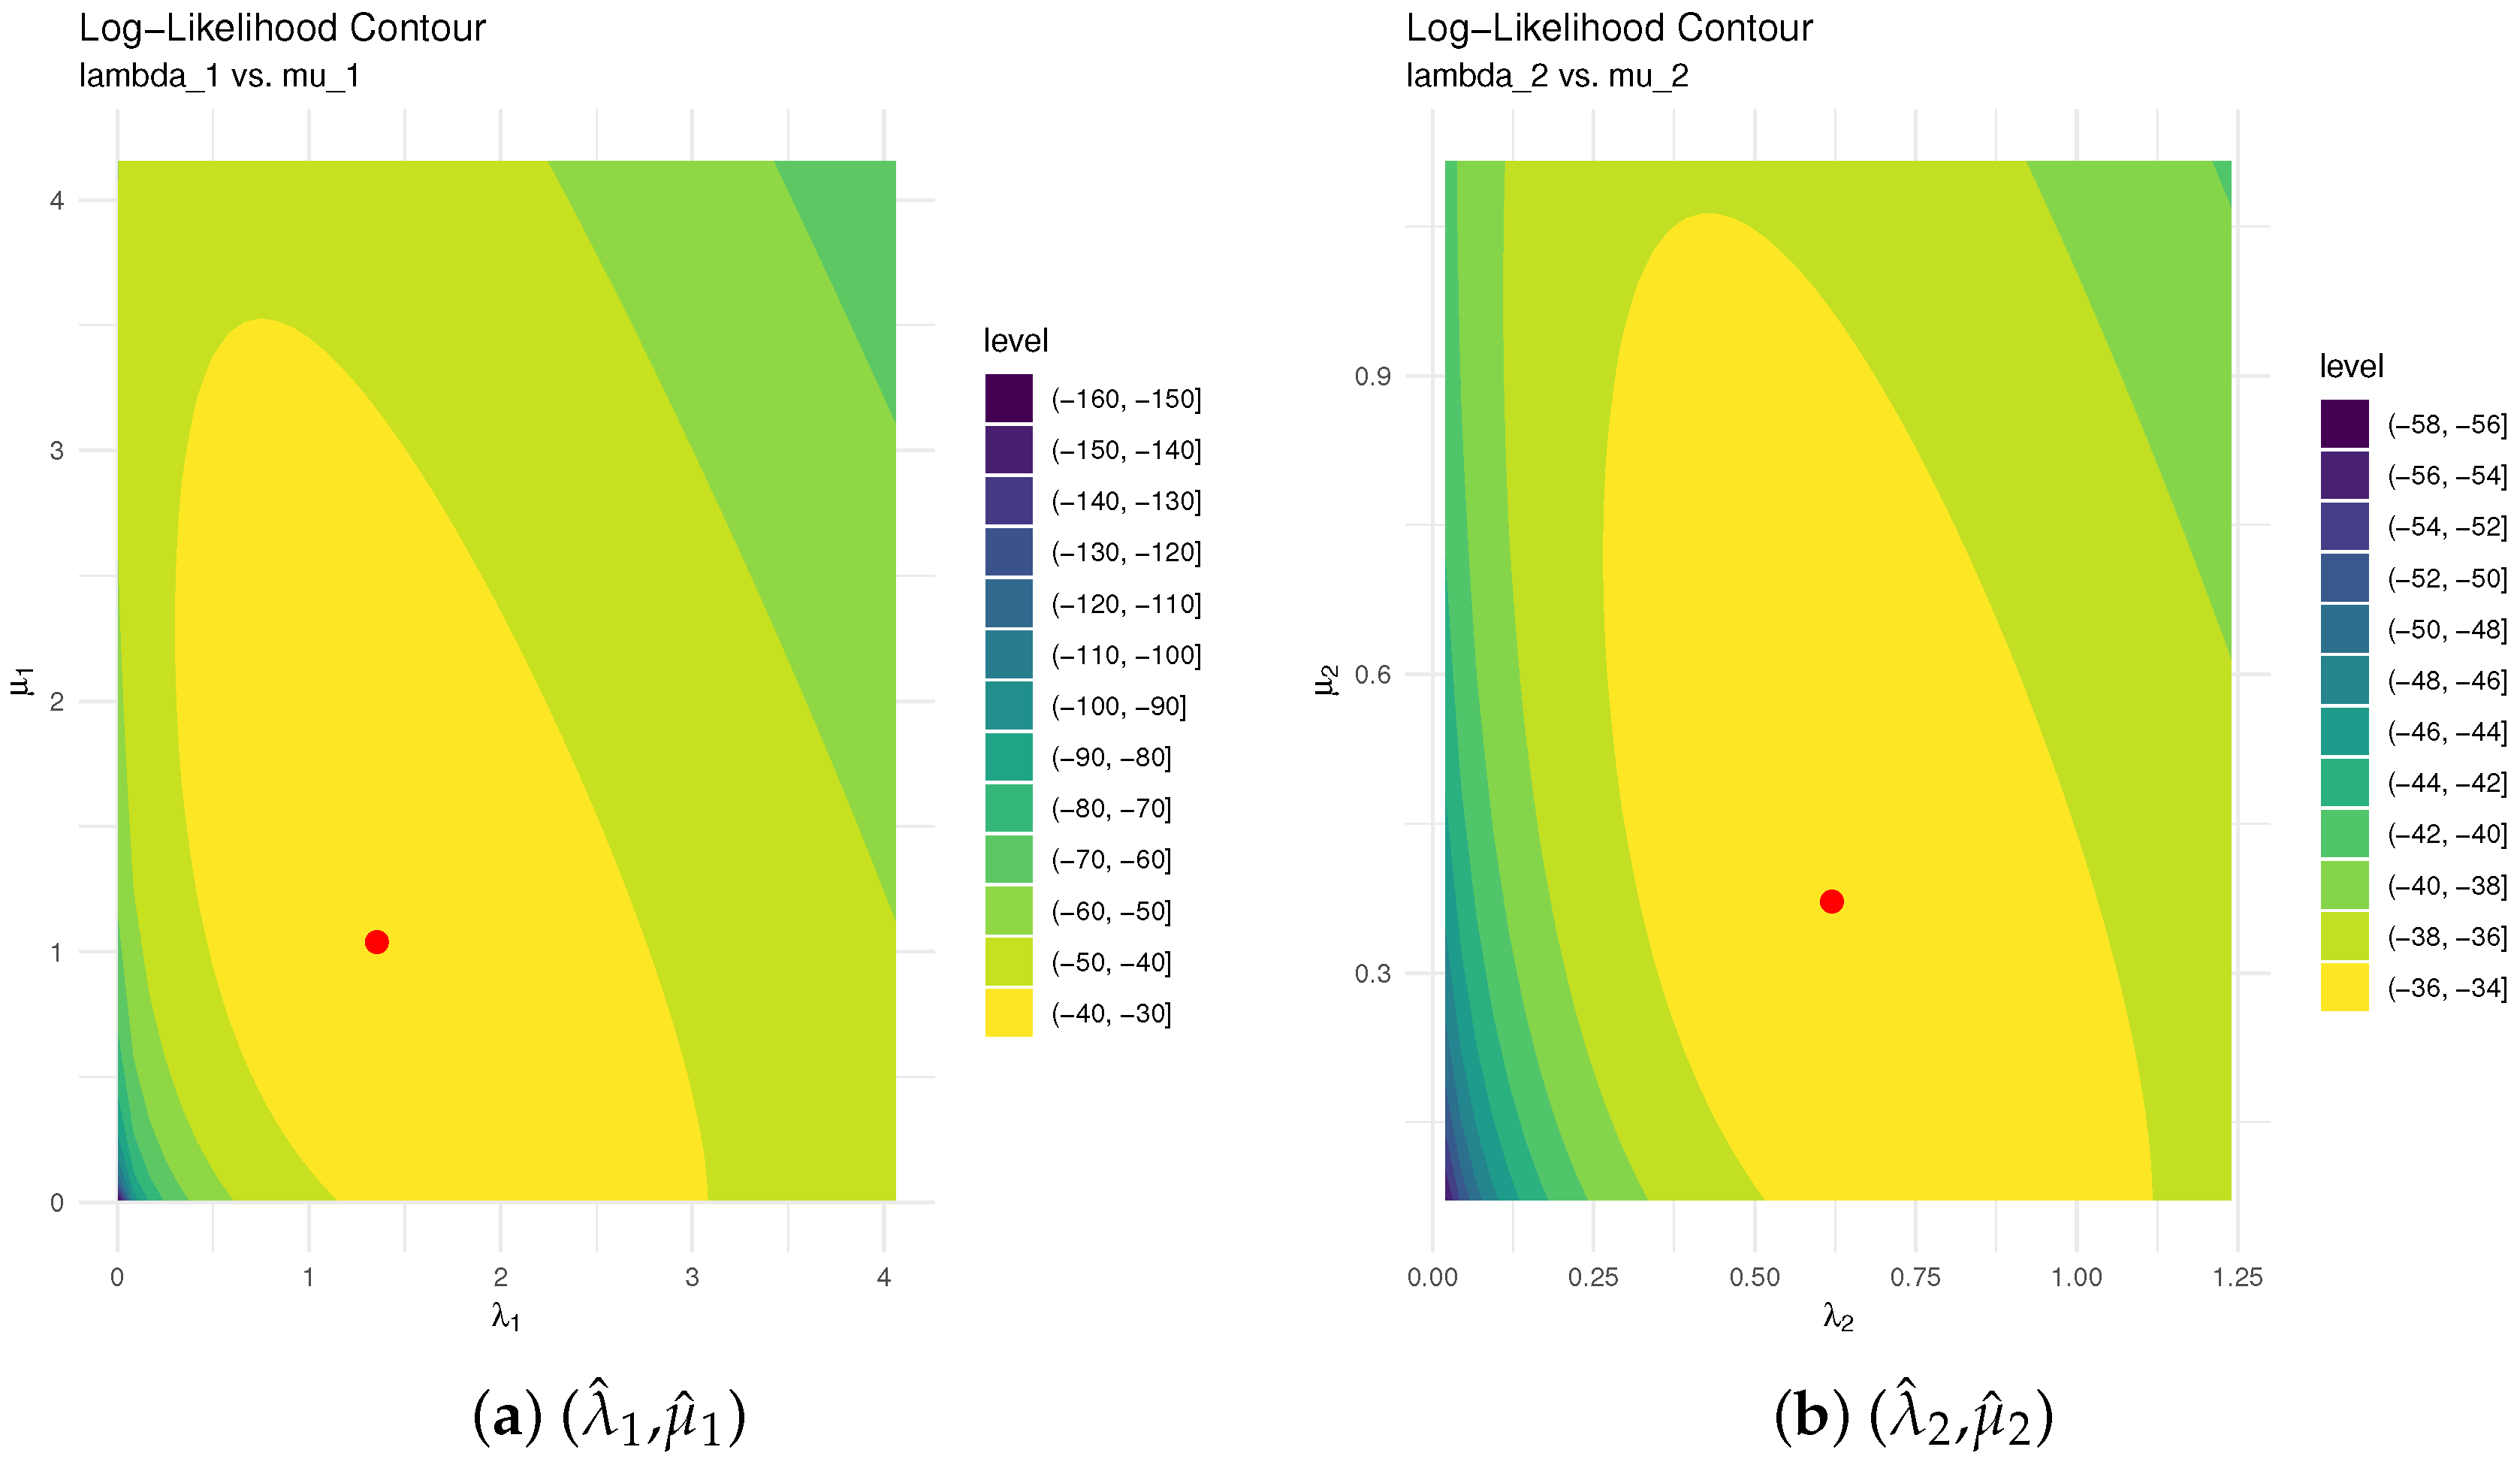
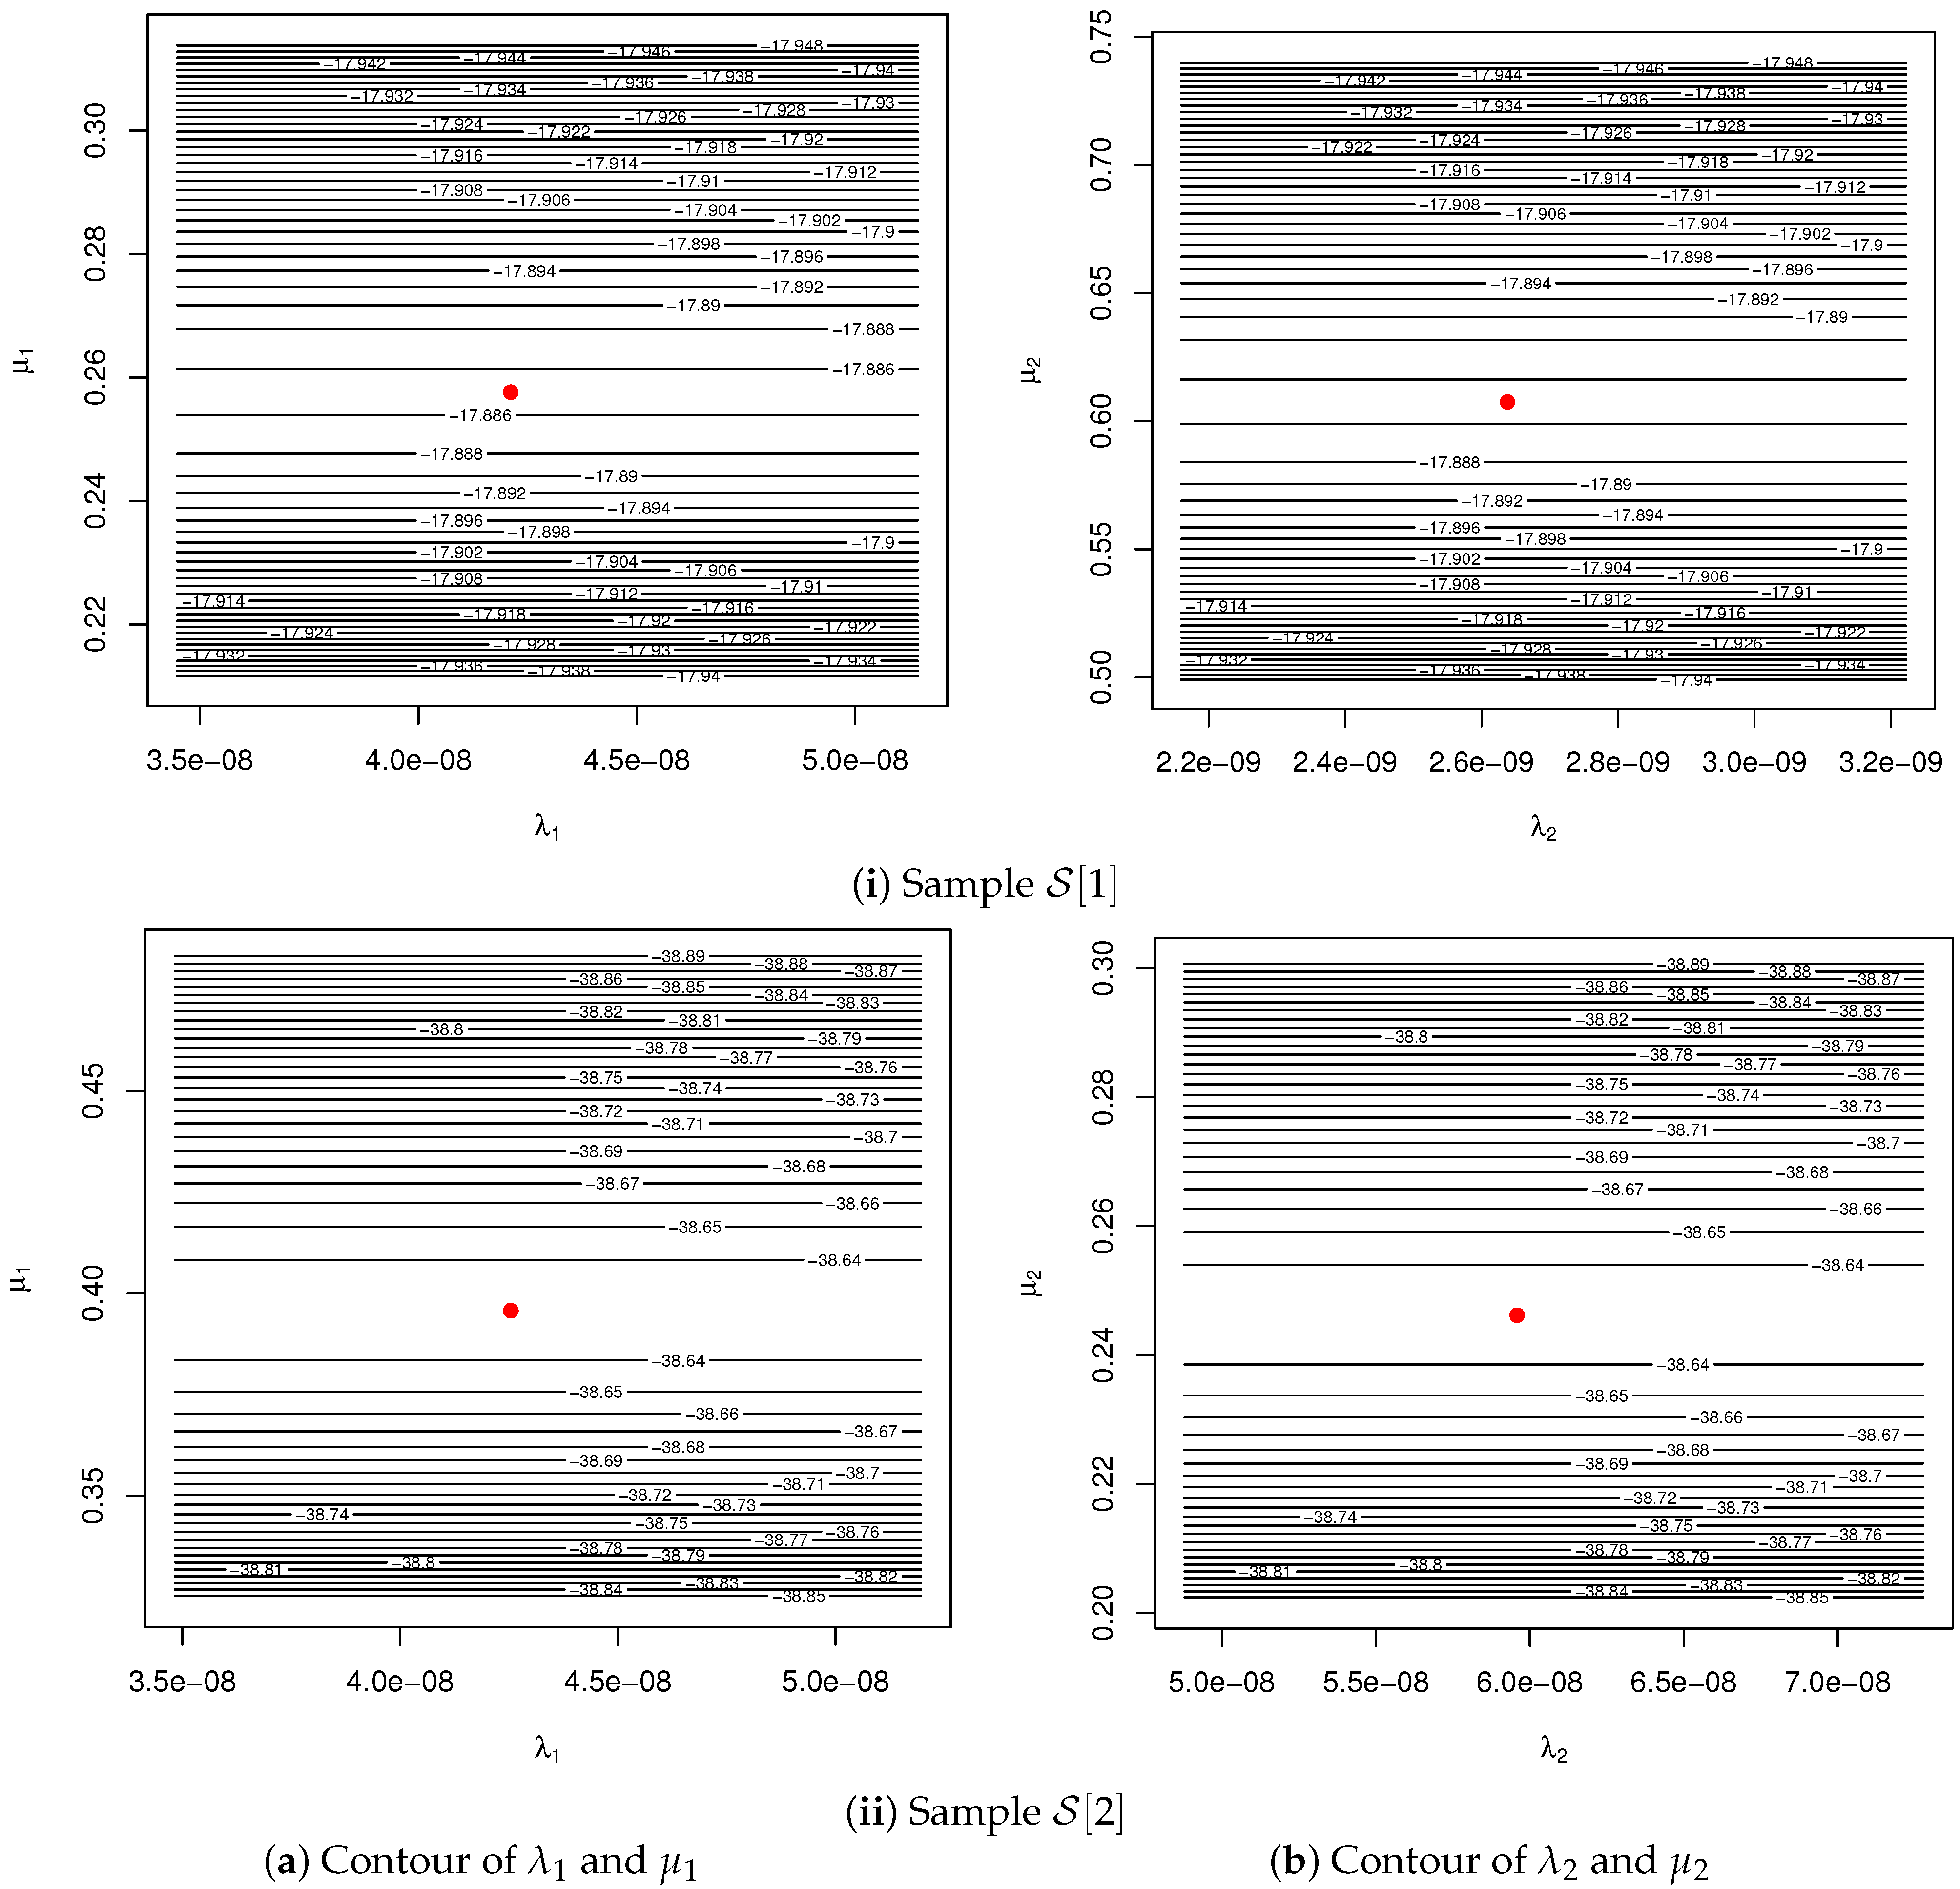
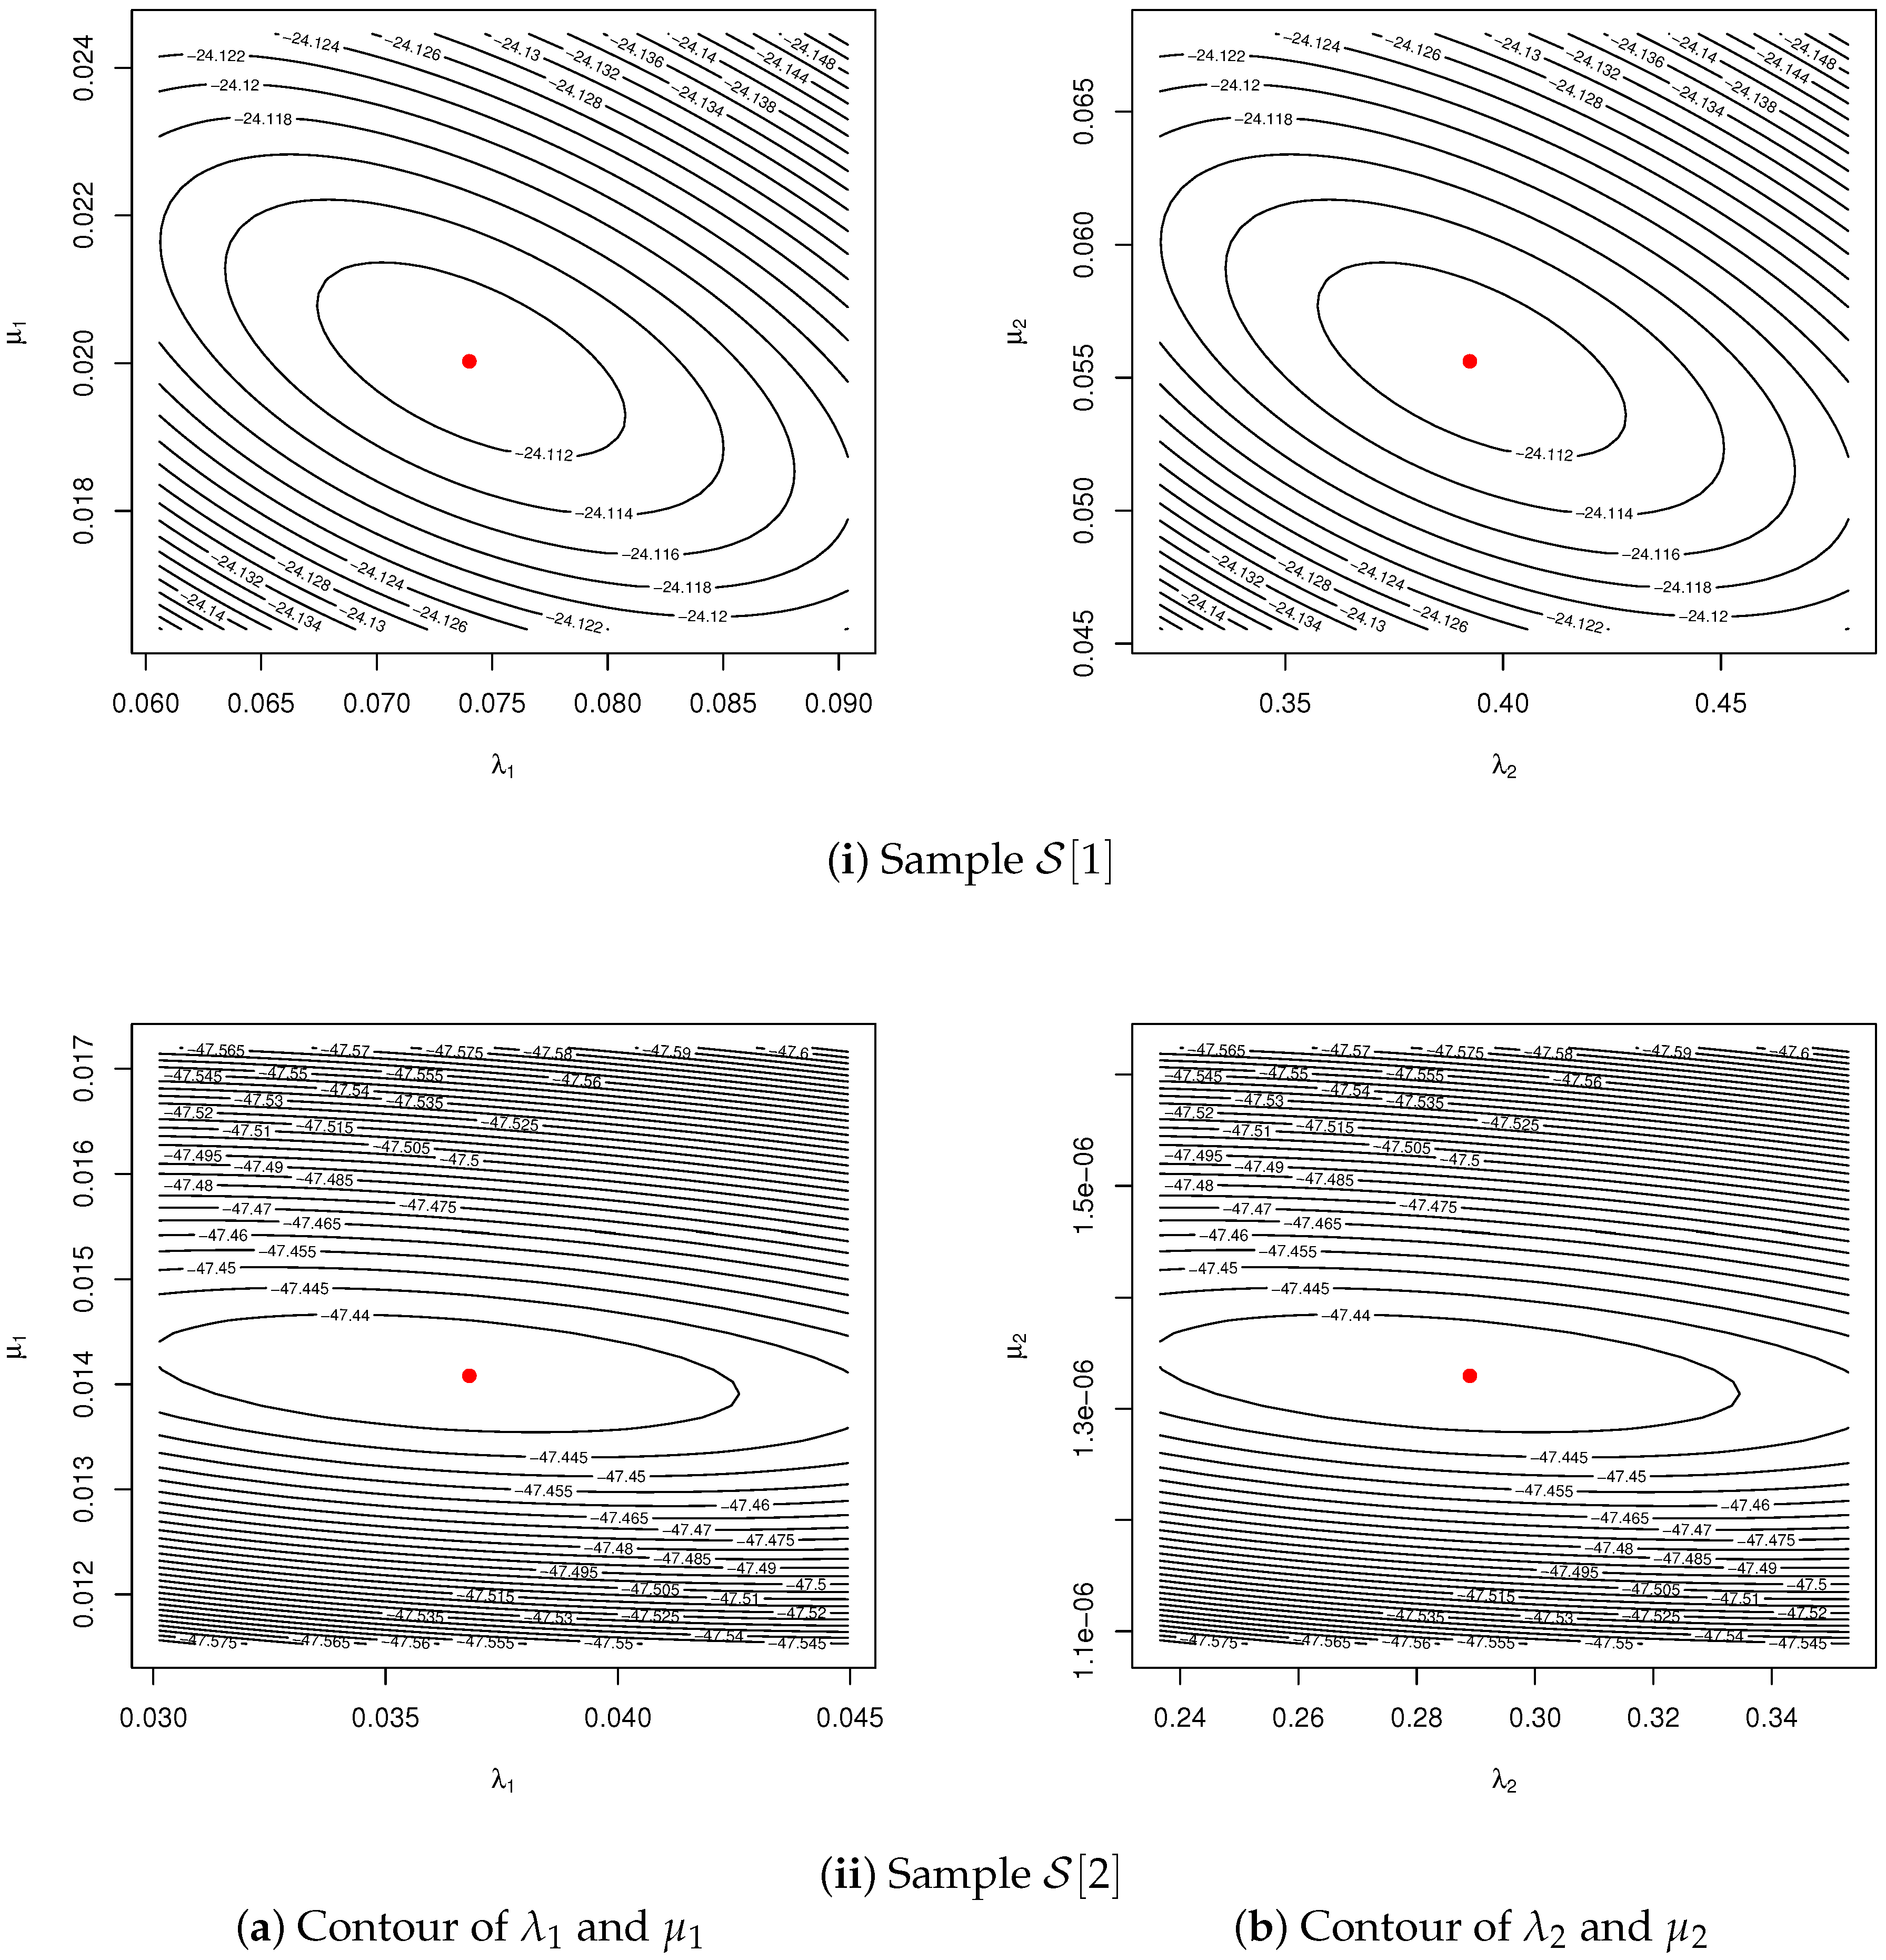
Figure 2.
Contour diagrams of the Hj parameters in Monte Carlo simulations.
Figure 2.
Contour diagrams of the Hj parameters in Monte Carlo simulations.
Figure 3.
Geweke convergence diagnostics for the Hj parameters in Monte Carlo simulations.
Figure 3.
Geweke convergence diagnostics for the Hj parameters in Monte Carlo simulations.
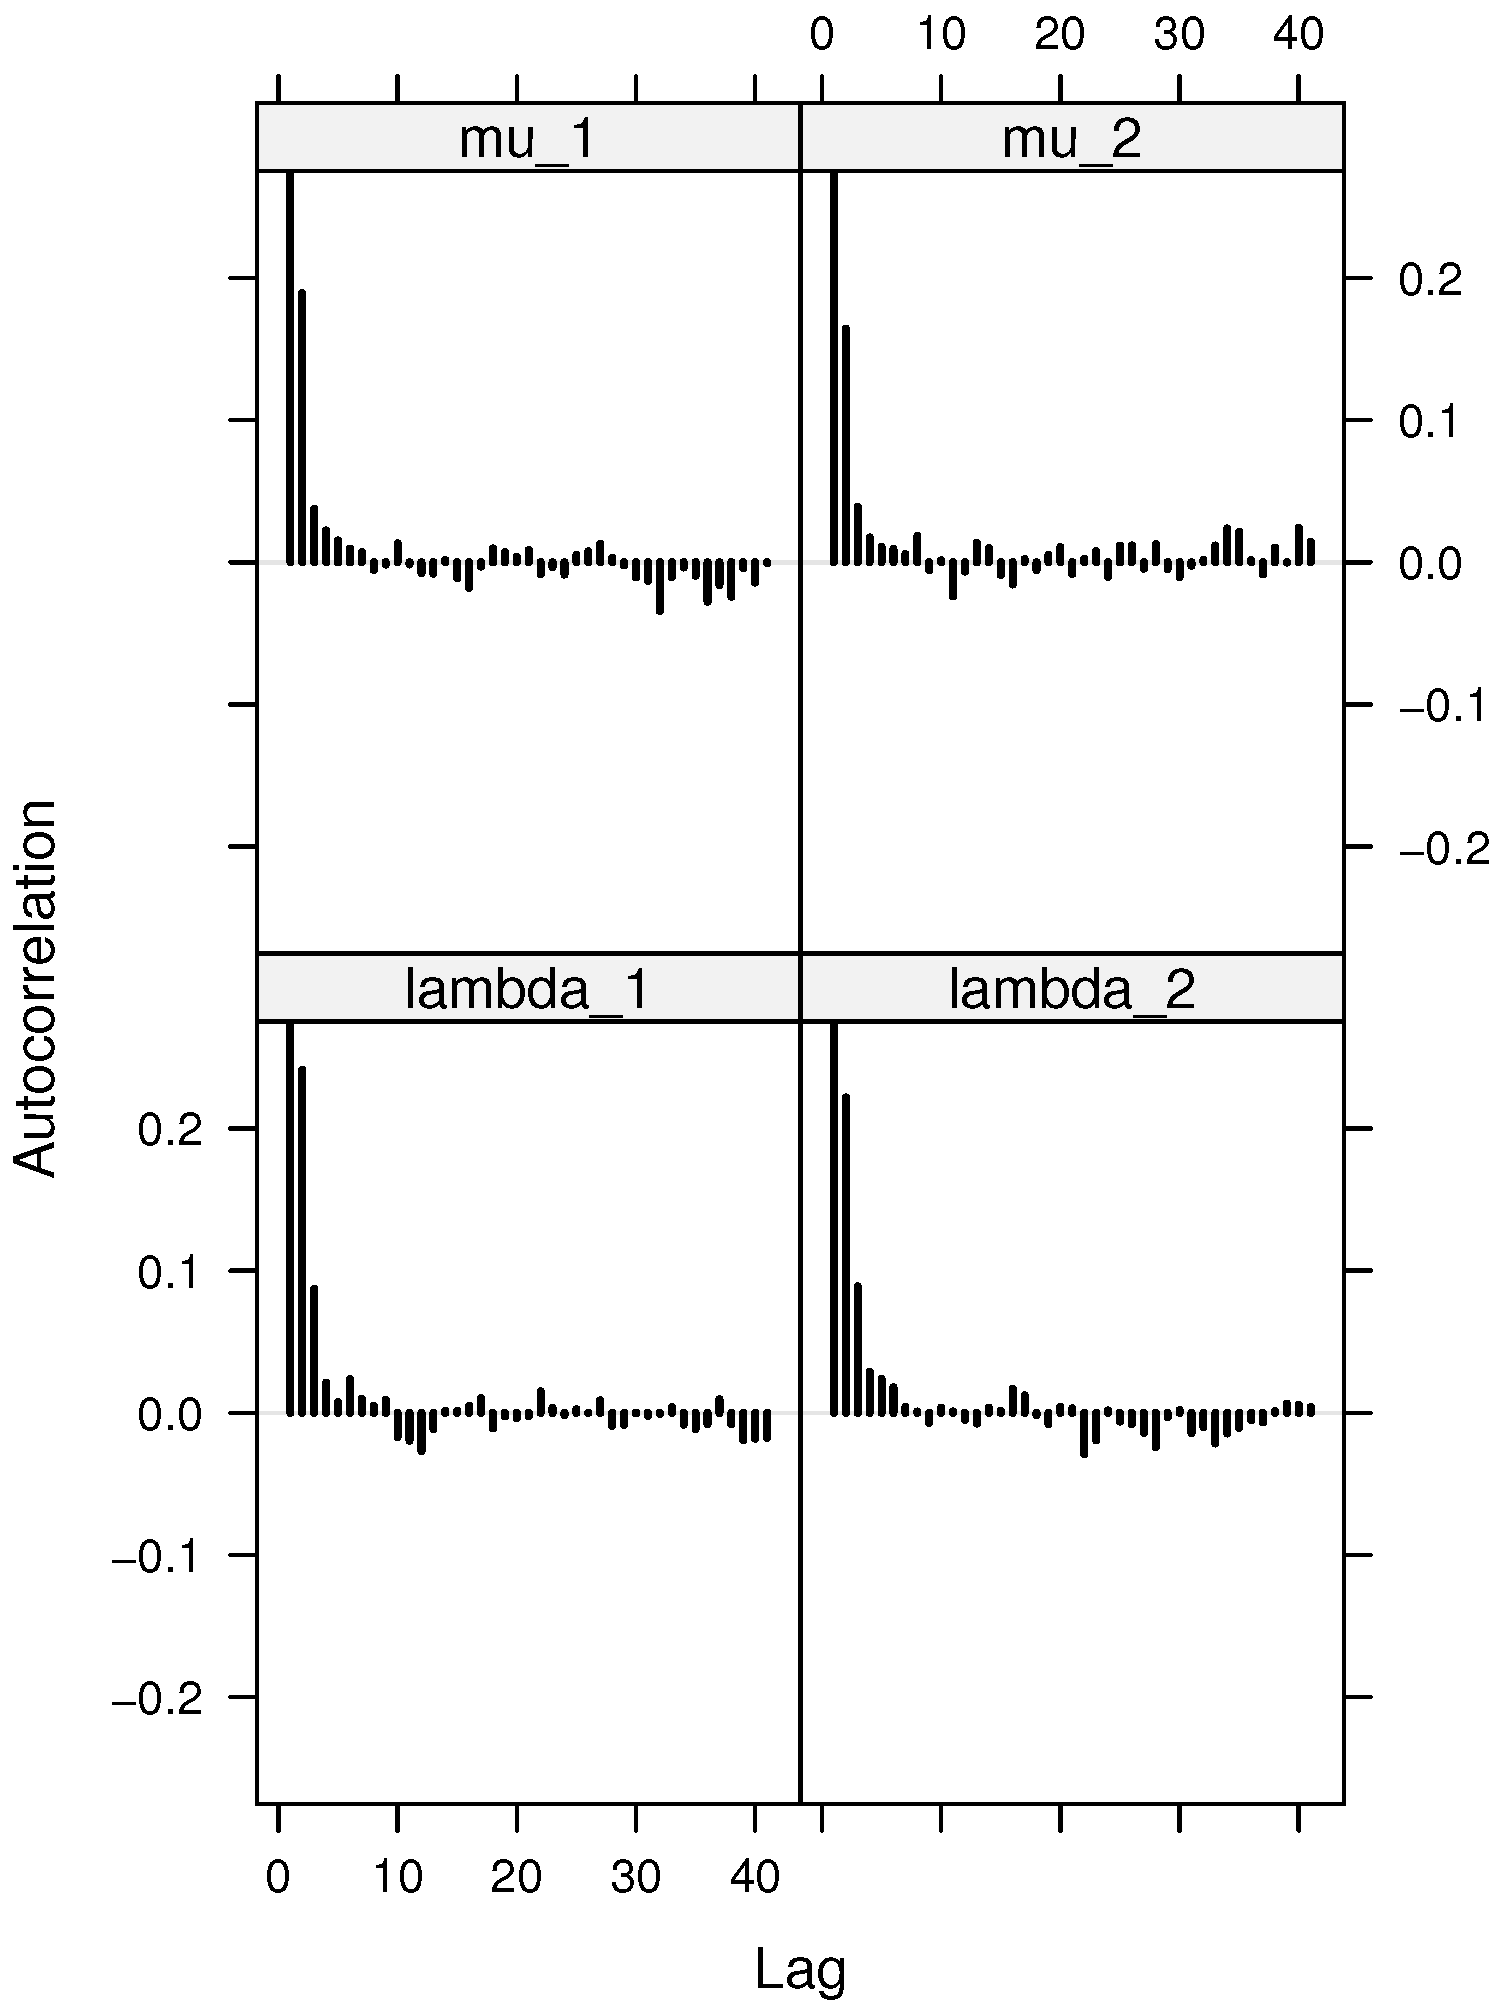
Figure 4.
The ACF diagrams of the Hj parameters in Monte Carlo simulations.
Figure 4.
The ACF diagrams of the Hj parameters in Monte Carlo simulations.
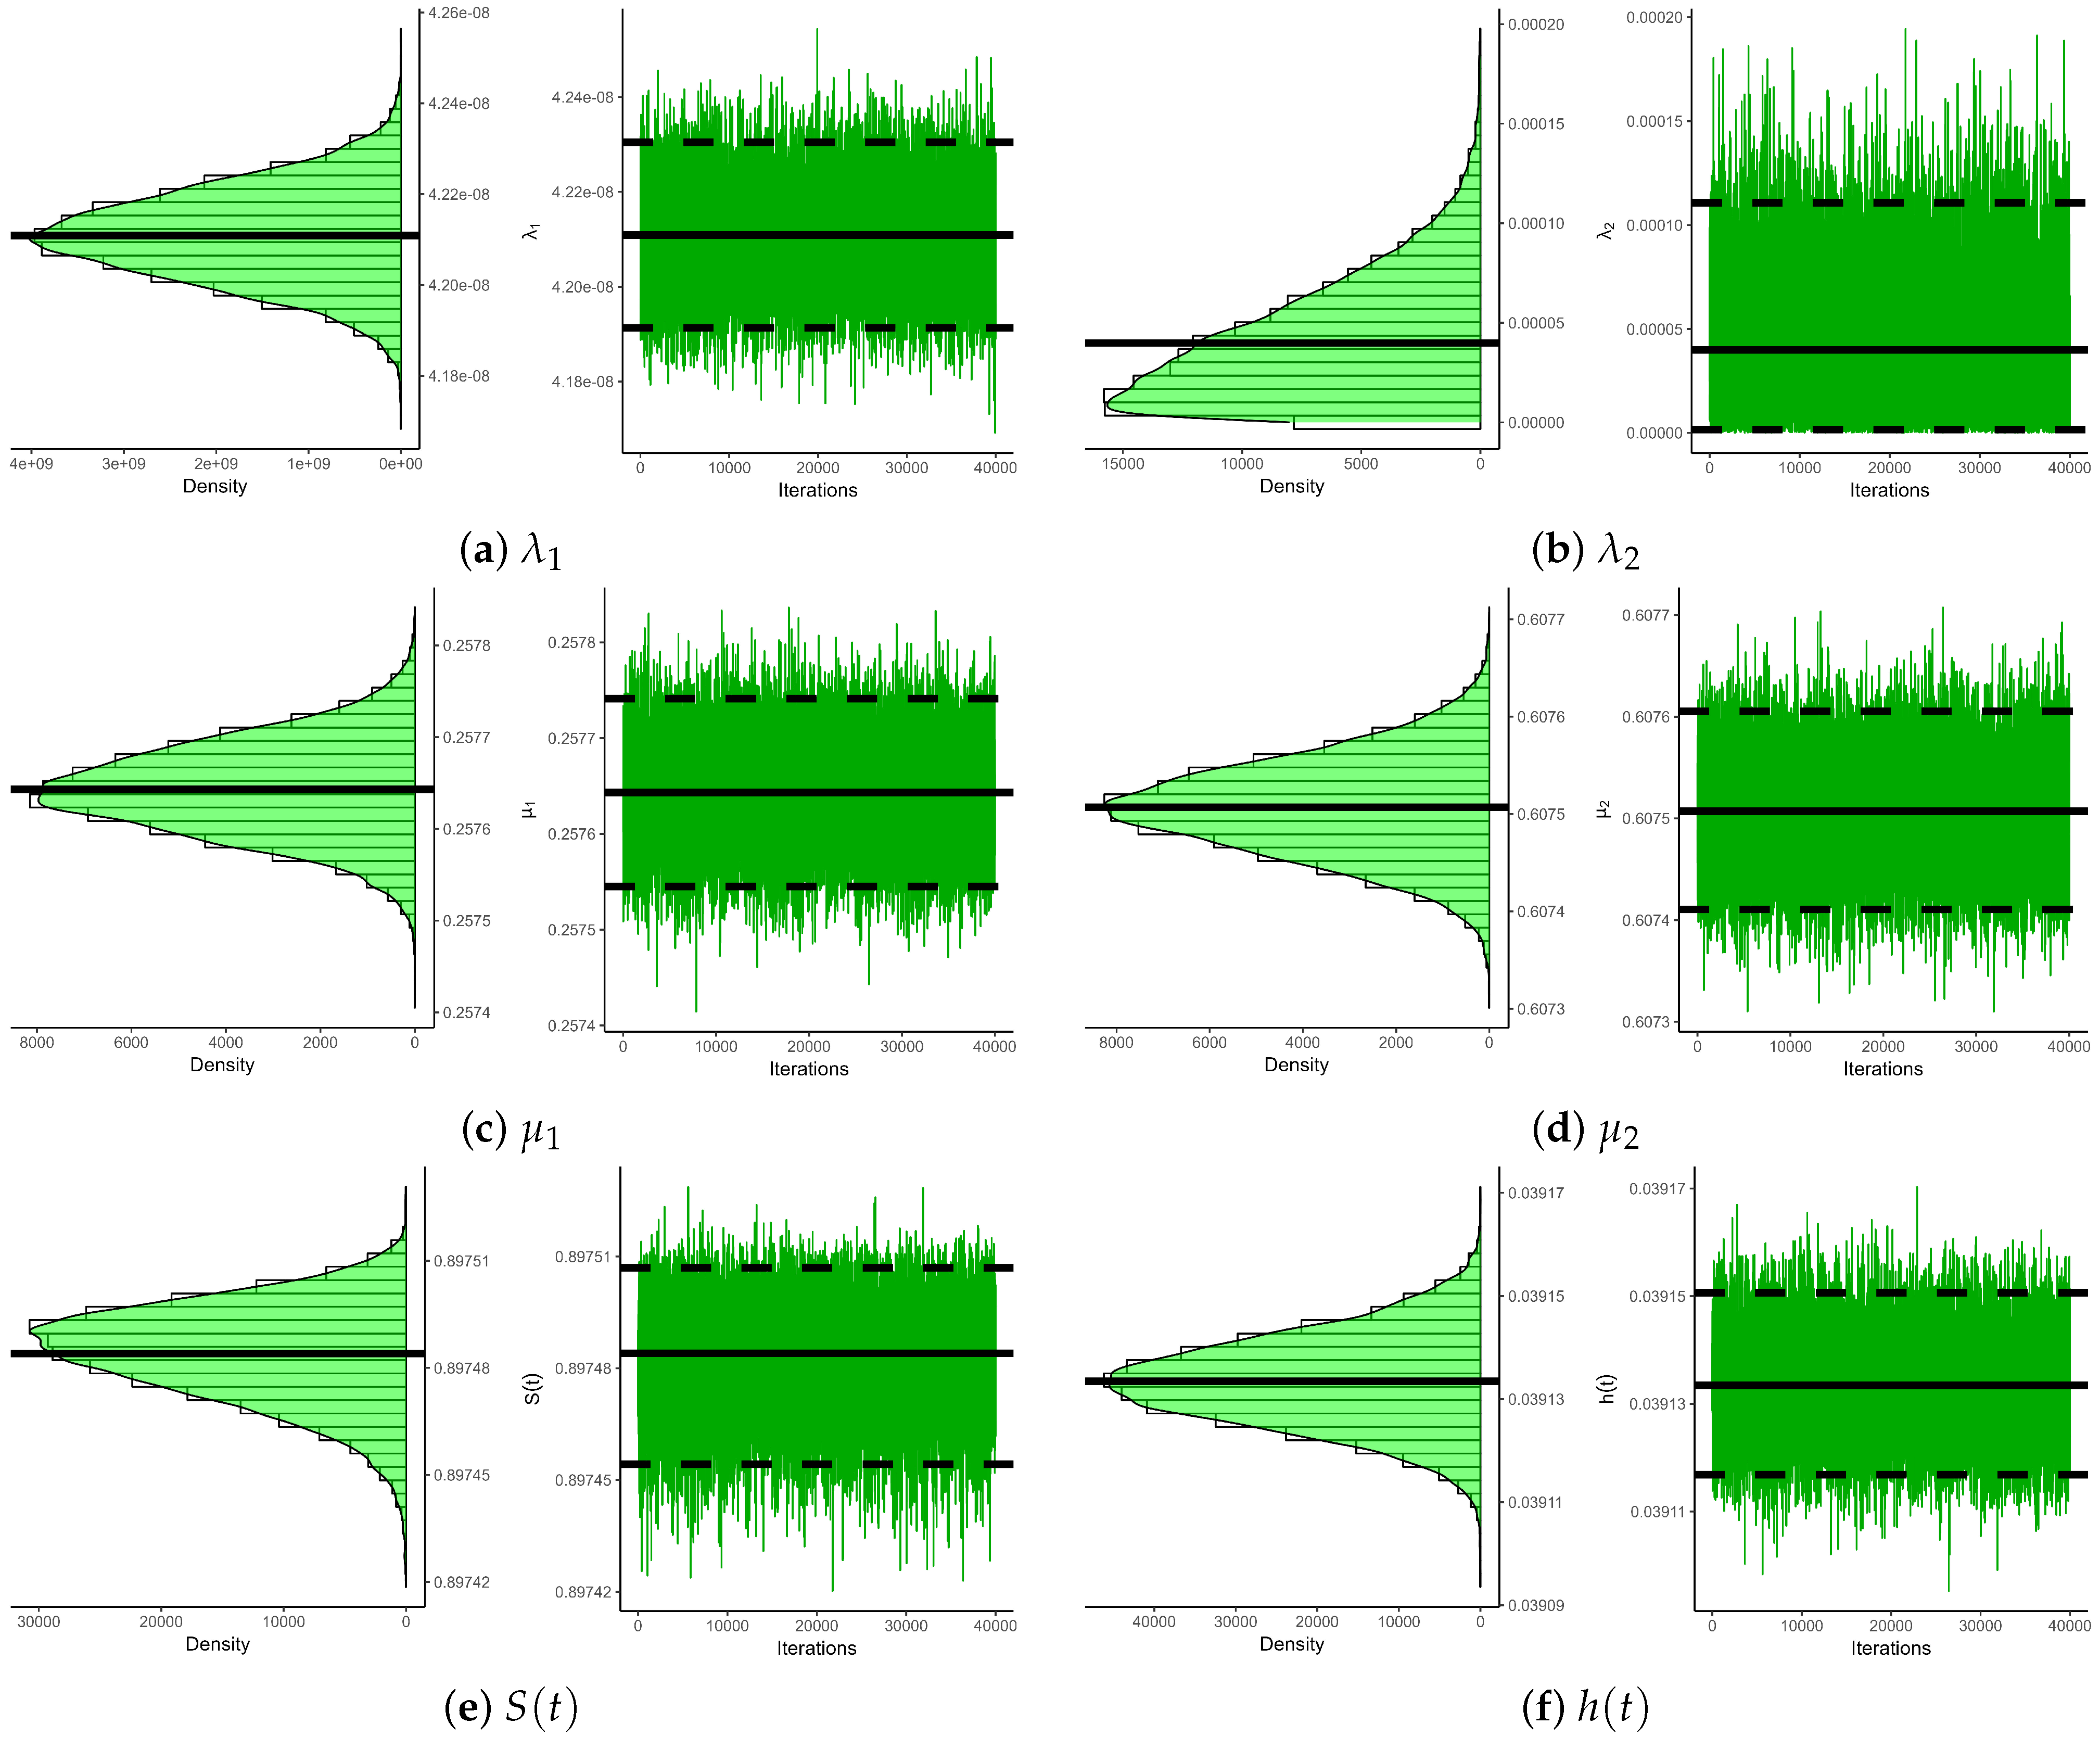
Figure 5.
The trace diagrams of the Hj parameters in Monte Carlo simulations.
Figure 5.
The trace diagrams of the Hj parameters in Monte Carlo simulations.
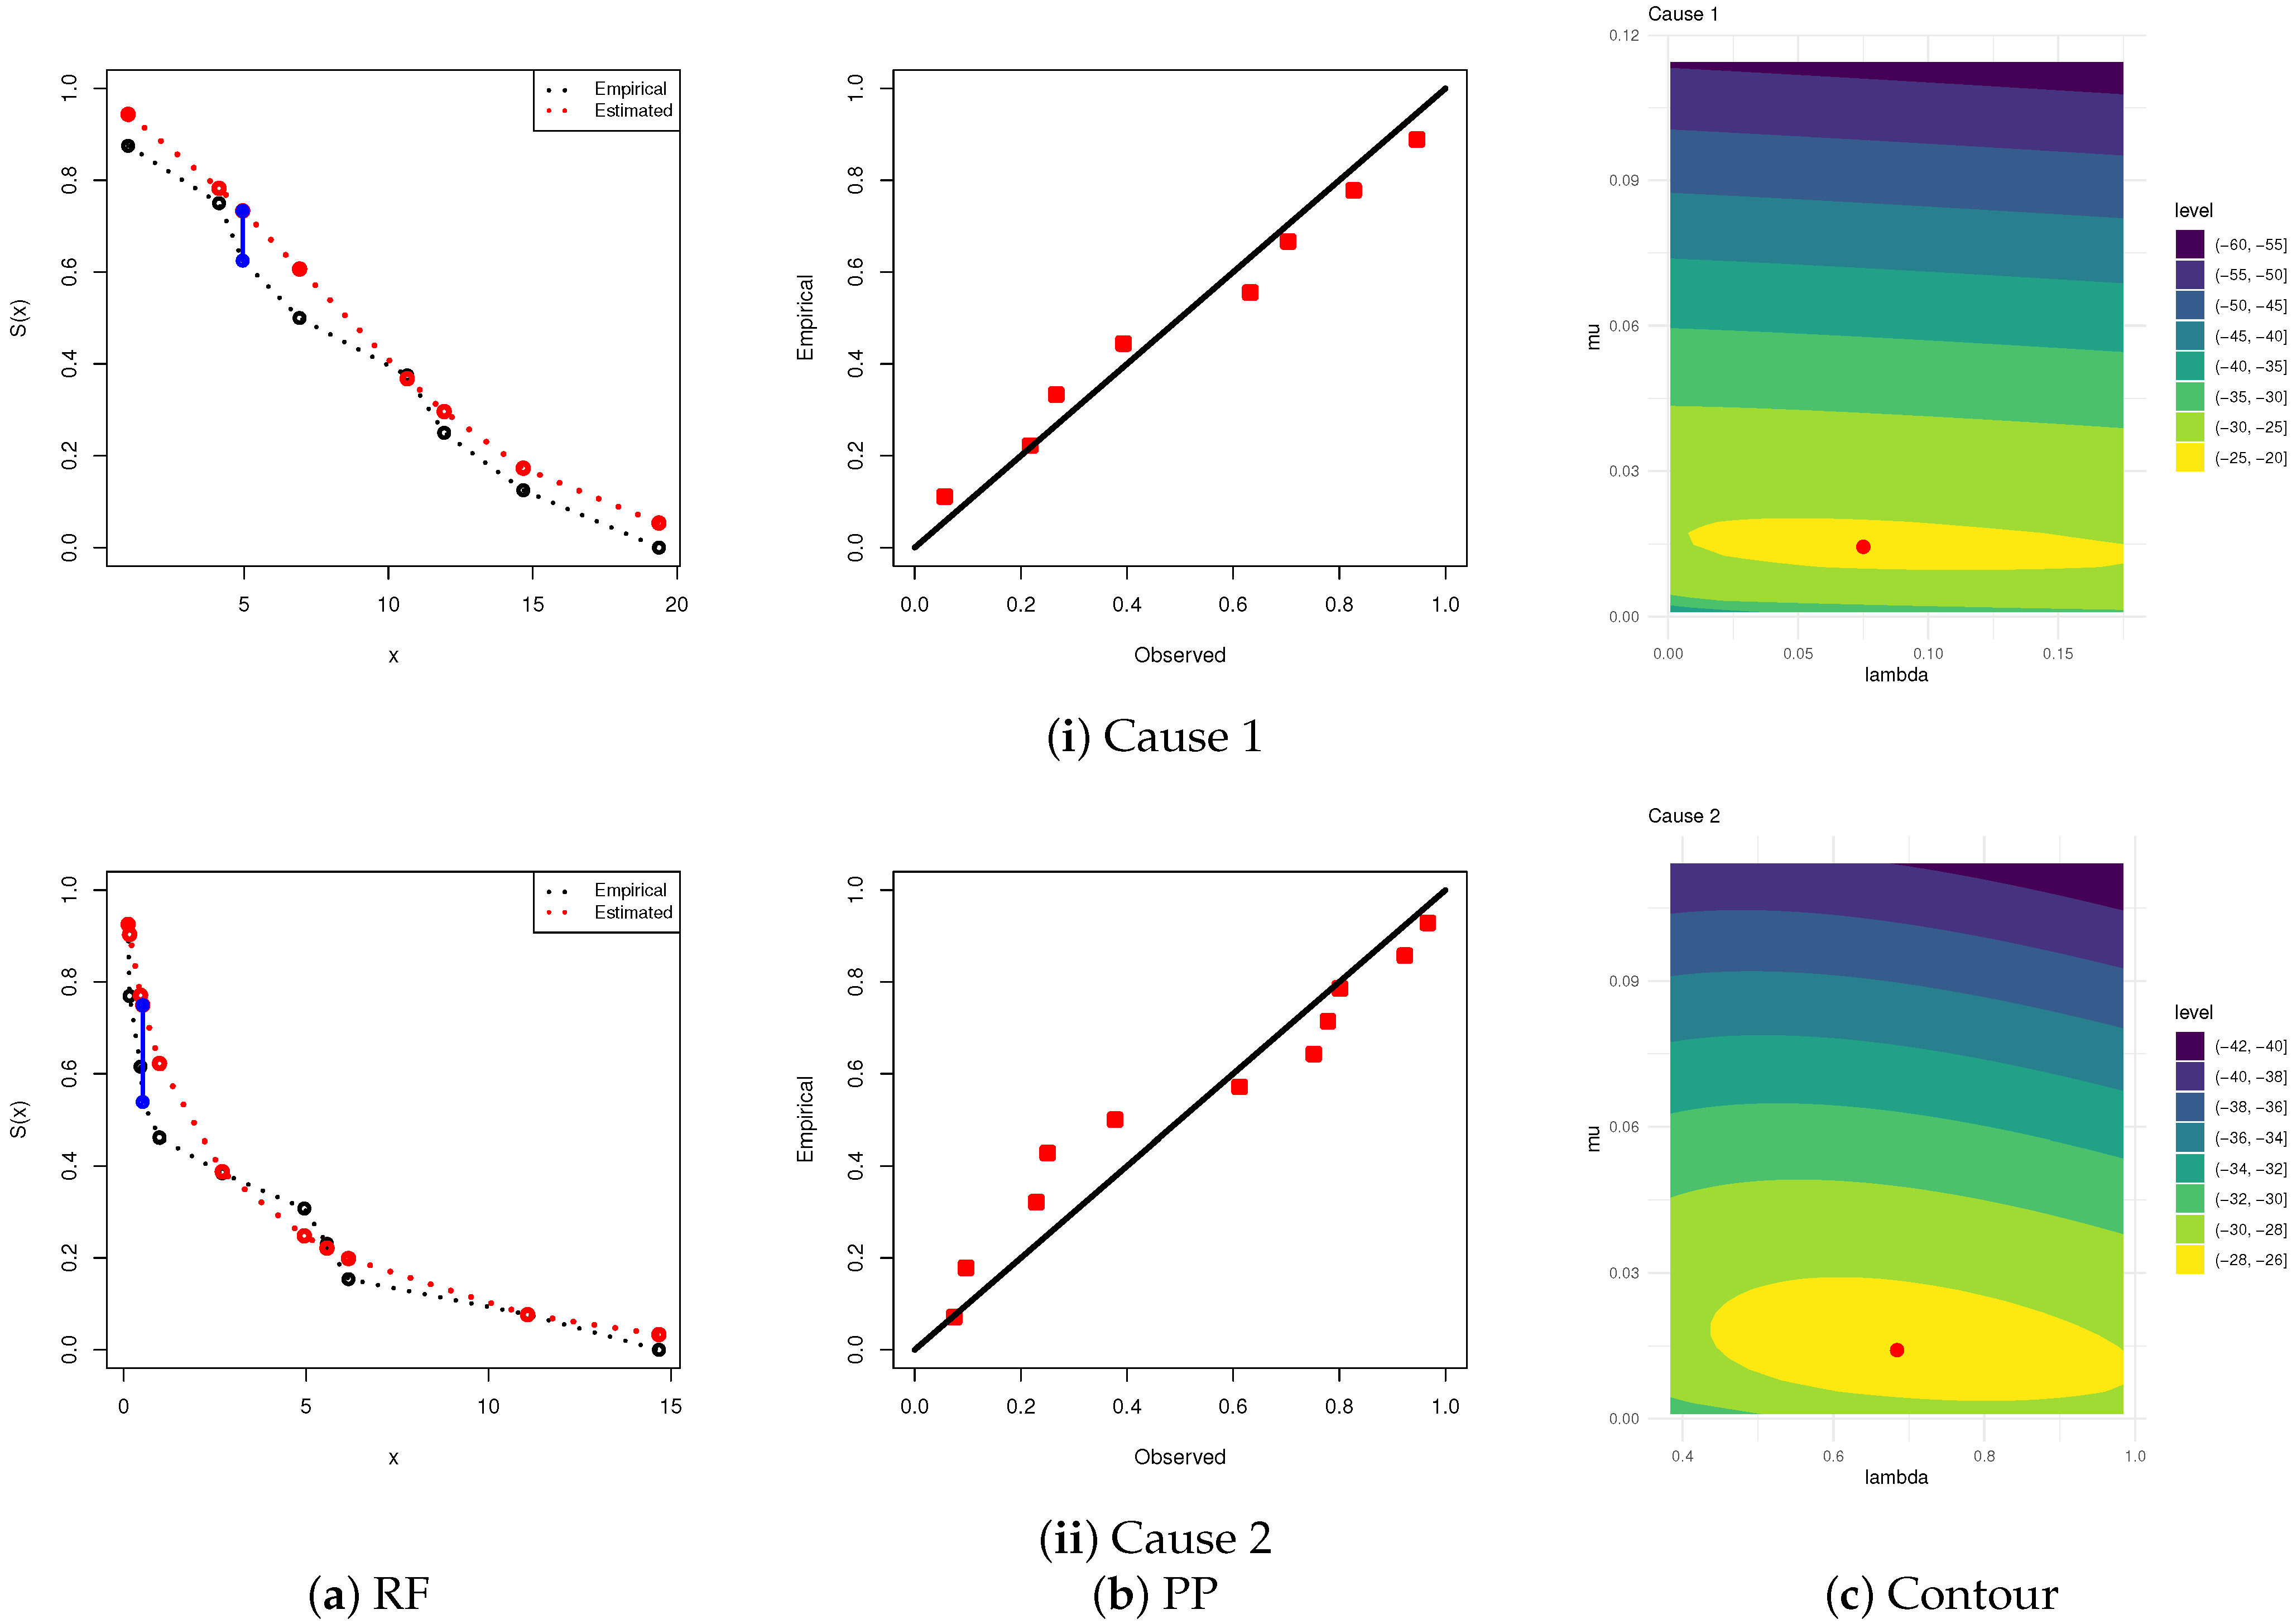
Figure 6.
Fitting diagrams of the Hj model from jute fiber data.
Figure 6.
Fitting diagrams of the Hj model from jute fiber data.
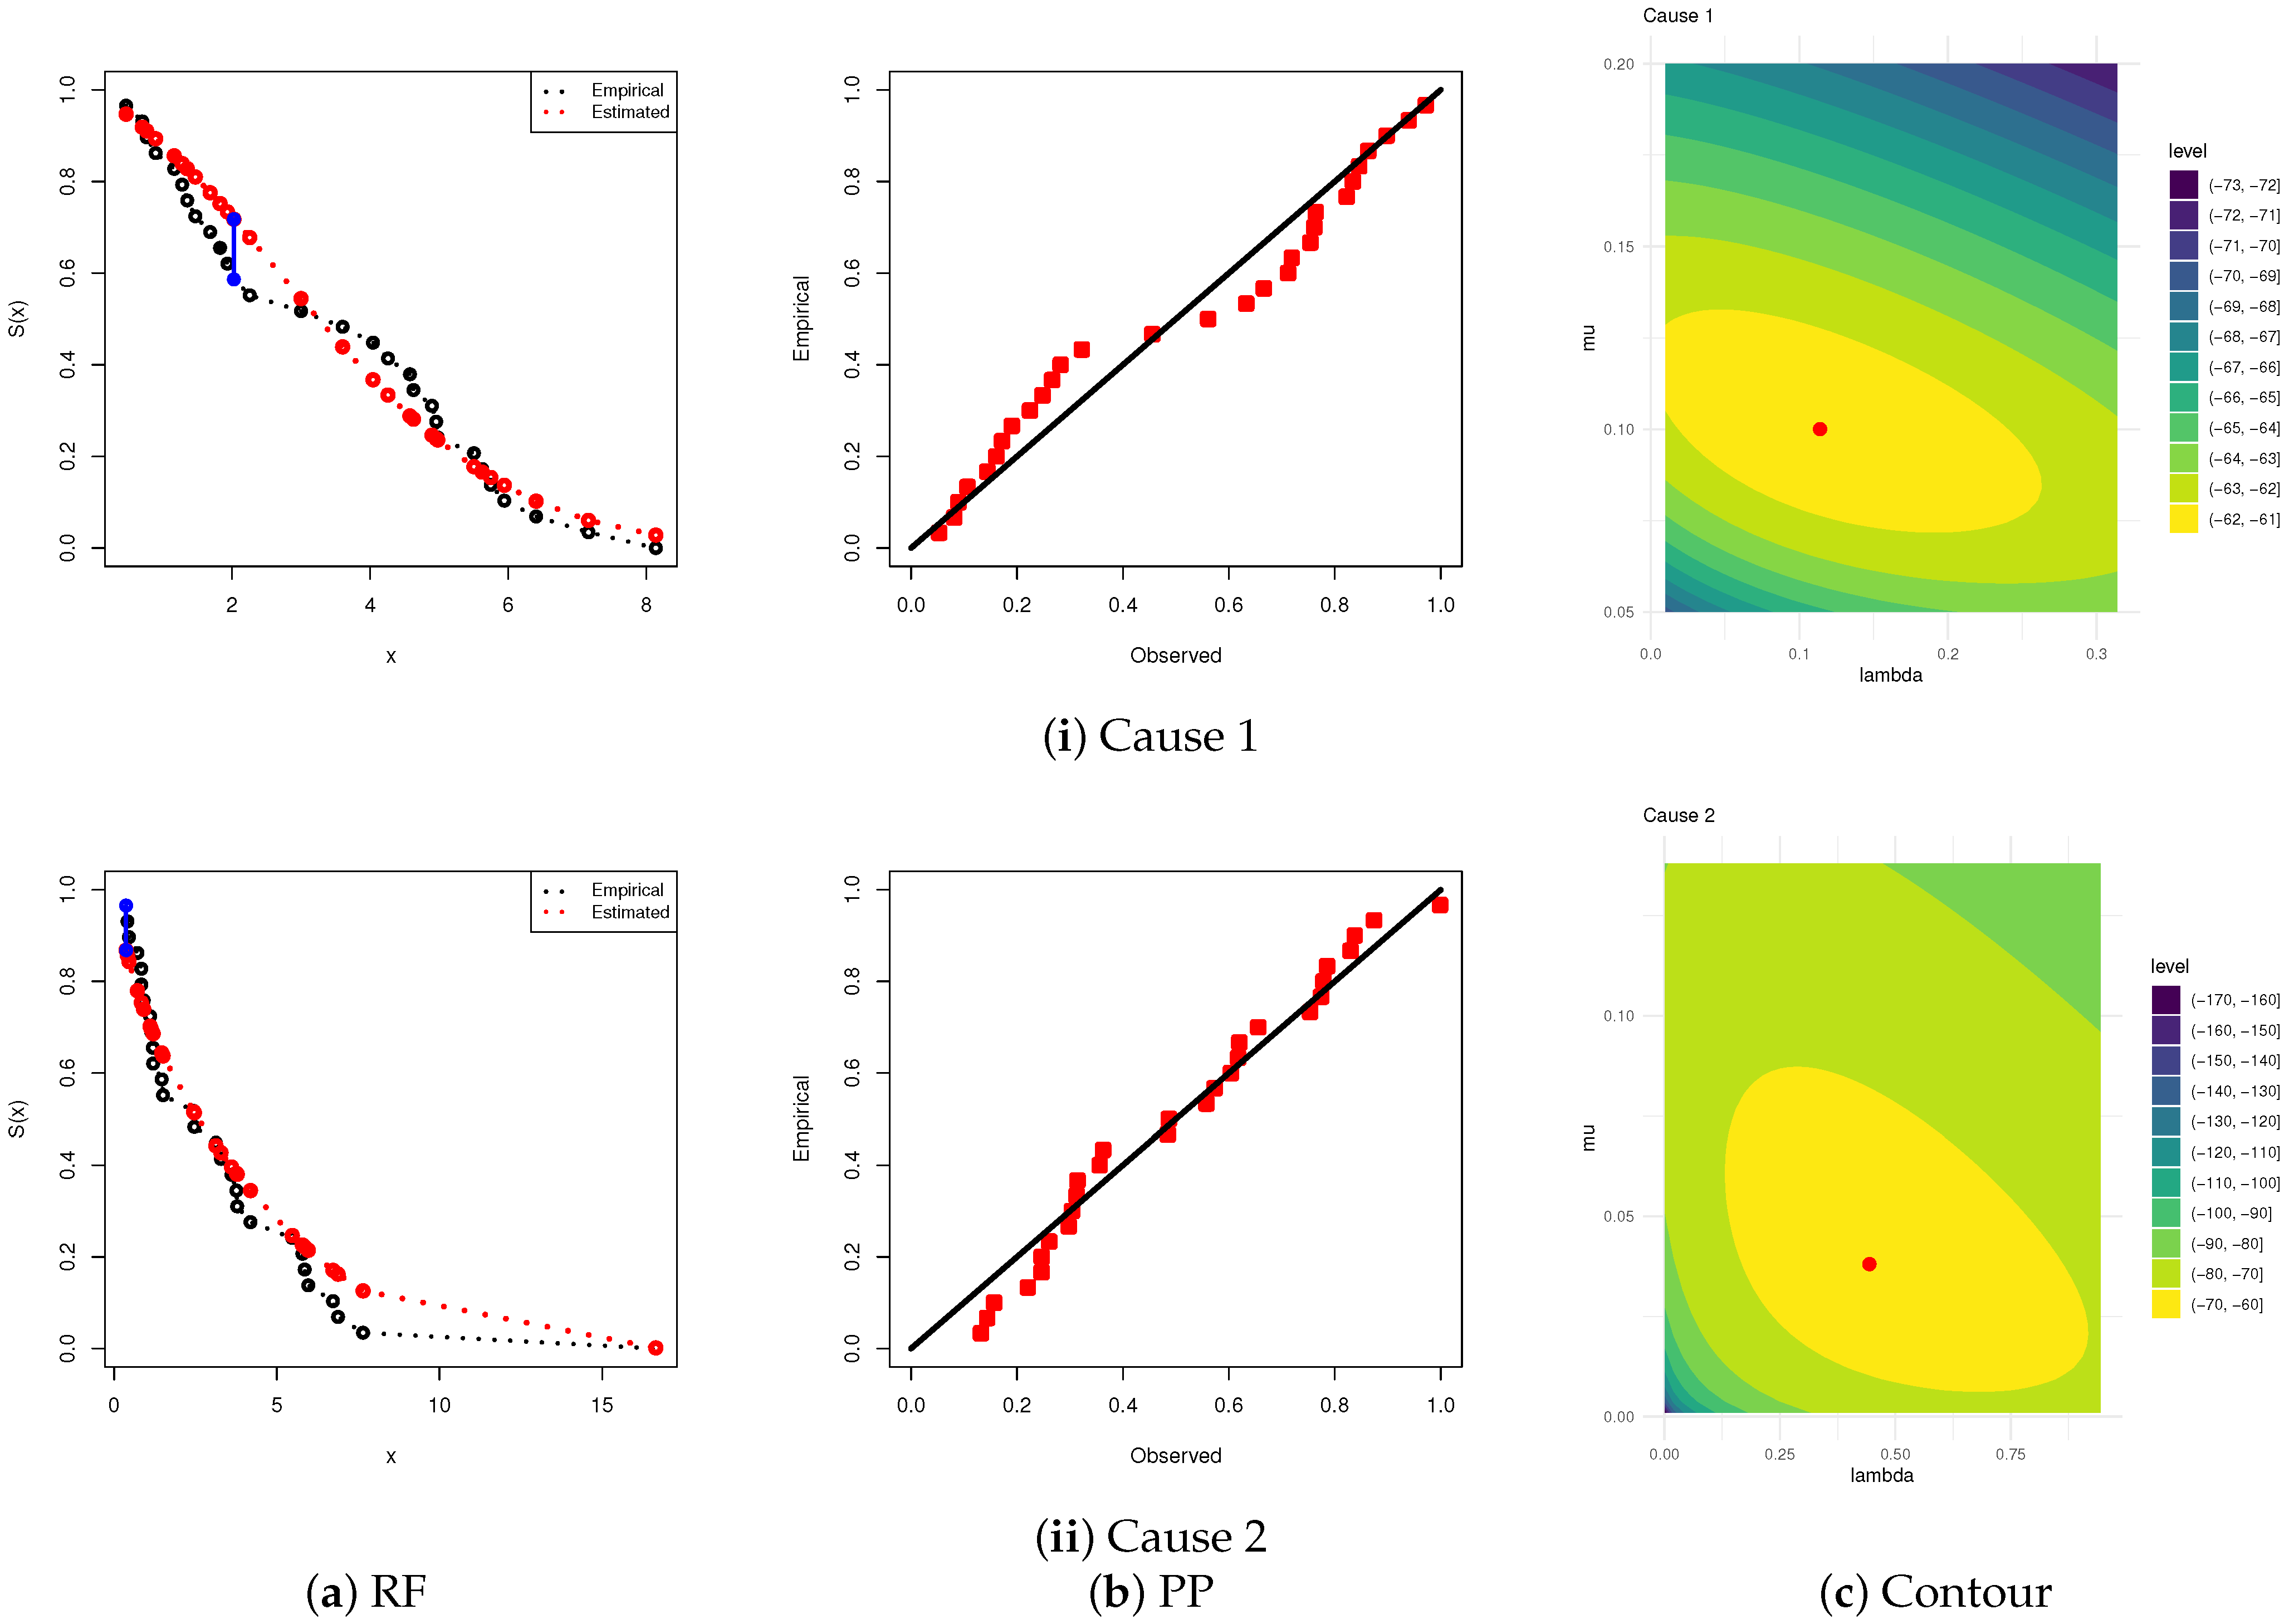
Figure 7.
The log-likelihood contours for and (for ) from jute fiber data.
Figure 7.
The log-likelihood contours for and (for ) from jute fiber data.
Figure 8.
Two MCMC plots of , (for ), , and from jute fiber data.
Figure 8.
Two MCMC plots of , (for ), , and from jute fiber data.
Figure 9.
Fitting diagrams of the Hj model from electrical appliance data.
Figure 9.
Fitting diagrams of the Hj model from electrical appliance data.
Figure 10.
The log-likelihood contours for and (for ) from electrical appliance data.
Figure 10.
The log-likelihood contours for and (for ) from electrical appliance data.
Figure 11.
Two MCMC plots of , (for ), , and from electrical appliance data.
Figure 11.
Two MCMC plots of , (for ), , and from electrical appliance data.
Table 1.
The point estimation results of .
Table 1.
The point estimation results of .
| | | | |
|---|
| | | MLE | Bayes | | MLE | Bayes |
|---|
| Prior→ | | | | | A | B | | | | | A | B |
|---|
| | | MPE | RMSE | MRAB | MPE | RMSE | MRAB | MPE | RMSE | MRAB | | MPE | RMSE | MRAB | MPE | RMSE | MRAB | MPE | RMSE | MRAB |
|---|
| | | |
| (30, 10) | 0.4 | 1.686 | 1.235 | 0.817 | 1.310 | 1.189 | 0.794 | 1.470 | 0.791 | 0.780 | | 1.570 | 1.225 | 1.581 | 0.640 | 1.178 | 0.788 | 1.653 | 0.518 | 0.442 |
| | 0.8 | 1.425 | 1.146 | 0.754 | 1.634 | 1.012 | 0.661 | 1.574 | 0.796 | 0.442 | | 1.524 | 1.120 | 1.469 | 0.854 | 0.989 | 0.648 | 1.446 | 0.711 | 0.400 |
| (30, 20) | 0.4 | 1.524 | 1.205 | 0.780 | 1.655 | 1.179 | 0.705 | 1.741 | 1.068 | 0.444 | | 1.476 | 1.188 | 1.493 | 0.615 | 1.075 | 0.701 | 1.339 | 0.748 | 0.424 |
| | 0.8 | 1.500 | 1.078 | 0.712 | 1.387 | 0.986 | 0.646 | 1.851 | 0.777 | 0.413 | | 1.310 | 1.033 | 1.580 | 0.548 | 0.943 | 0.619 | 1.606 | 0.704 | 0.398 |
| (50, 20) | 0.4 | 1.573 | 1.003 | 0.651 | 1.528 | 0.758 | 0.489 | 1.748 | 0.726 | 0.394 | | 1.607 | 0.986 | 1.634 | 0.664 | 0.753 | 0.485 | 1.564 | 0.658 | 0.329 |
| | 0.8 | 1.493 | 0.916 | 0.592 | 1.390 | 0.716 | 0.451 | 1.696 | 0.596 | 0.321 | | 1.584 | 0.908 | 1.590 | 0.901 | 0.694 | 0.440 | 1.483 | 0.542 | 0.292 |
| (50, 40) | 0.4 | 1.436 | 0.967 | 0.633 | 1.379 | 0.741 | 0.459 | 1.532 | 0.698 | 0.333 | | 1.635 | 0.957 | 1.445 | 0.564 | 0.710 | 0.446 | 1.727 | 0.581 | 0.322 |
| | 0.8 | 1.485 | 0.888 | 0.574 | 1.611 | 0.693 | 0.437 | 1.708 | 0.584 | 0.293 | | 1.488 | 0.870 | 1.586 | 0.394 | 0.677 | 0.435 | 1.531 | 0.529 | 0.281 |
| (80, 30) | 0.4 | 1.525 | 0.858 | 0.557 | 1.572 | 0.680 | 0.432 | 1.661 | 0.527 | 0.286 | | 1.521 | 0.825 | 1.484 | 0.739 | 0.675 | 0.420 | 1.415 | 0.506 | 0.263 |
| | 0.8 | 1.629 | 0.715 | 0.432 | 1.399 | 0.667 | 0.415 | 1.544 | 0.488 | 0.256 | | 1.572 | 0.693 | 1.419 | 0.433 | 0.580 | 0.365 | 1.527 | 0.468 | 0.235 |
| (80, 60) | 0.4 | 1.551 | 0.796 | 0.508 | 1.776 | 0.675 | 0.419 | 1.396 | 0.507 | 0.265 | | 1.414 | 0.735 | 1.469 | 0.338 | 0.601 | 0.368 | 1.482 | 0.480 | 0.246 |
| | 0.8 | 1.499 | 0.639 | 0.400 | 1.685 | 0.601 | 0.383 | 1.740 | 0.463 | 0.249 | | 1.628 | 0.621 | 1.390 | 0.285 | 0.517 | 0.315 | 1.413 | 0.443 | 0.227 |
| | | |
| (30, 10) | 0.4 | 0.554 | 0.492 | 0.793 | 0.429 | 0.400 | 0.790 | 0.523 | 0.380 | 0.752 | | 0.584 | 0.464 | 0.791 | 0.429 | 0.389 | 0.755 | 0.516 | 0.368 | 0.749 |
| | 0.8 | 0.519 | 0.450 | 0.737 | 0.499 | 0.344 | 0.668 | 0.545 | 0.328 | 0.642 | | 0.513 | 0.430 | 0.702 | 0.511 | 0.343 | 0.661 | 0.555 | 0.313 | 0.599 |
| (30, 20) | 0.4 | 0.526 | 0.457 | 0.773 | 0.512 | 0.398 | 0.706 | 0.417 | 0.352 | 0.688 | | 0.508 | 0.443 | 0.740 | 0.520 | 0.368 | 0.702 | 0.512 | 0.328 | 0.640 |
| | 0.8 | 0.500 | 0.445 | 0.703 | 0.461 | 0.339 | 0.661 | 0.392 | 0.303 | 0.590 | | 0.526 | 0.417 | 0.666 | 0.492 | 0.333 | 0.633 | 0.416 | 0.280 | 0.538 |
| (50, 20) | 0.4 | 0.491 | 0.421 | 0.664 | 0.474 | 0.323 | 0.632 | 0.451 | 0.288 | 0.507 | | 0.630 | 0.409 | 0.644 | 0.528 | 0.320 | 0.590 | 0.480 | 0.253 | 0.408 |
| | 0.8 | 0.466 | 0.404 | 0.659 | 0.636 | 0.261 | 0.471 | 0.380 | 0.207 | 0.373 | | 0.595 | 0.383 | 0.629 | 0.437 | 0.258 | 0.462 | 0.486 | 0.181 | 0.316 |
| (50, 40) | 0.4 | 0.541 | 0.409 | 0.662 | 0.467 | 0.286 | 0.526 | 0.472 | 0.210 | 0.377 | | 0.662 | 0.399 | 0.634 | 0.517 | 0.263 | 0.479 | 0.513 | 0.205 | 0.359 |
| | 0.8 | 0.531 | 0.393 | 0.612 | 0.515 | 0.199 | 0.348 | 0.540 | 0.177 | 0.306 | | 0.480 | 0.377 | 0.590 | 0.438 | 0.195 | 0.341 | 0.465 | 0.174 | 0.291 |
| (80, 30) | 0.4 | 0.539 | 0.297 | 0.519 | 0.529 | 0.193 | 0.324 | 0.455 | 0.174 | 0.288 | | 0.629 | 0.197 | 0.334 | 0.304 | 0.187 | 0.289 | 0.457 | 0.168 | 0.243 |
| | 0.8 | 0.468 | 0.164 | 0.285 | 0.479 | 0.145 | 0.241 | 0.431 | 0.126 | 0.203 | | 0.478 | 0.155 | 0.259 | 0.426 | 0.137 | 0.211 | 0.494 | 0.114 | 0.187 |
| (80, 60) | 0.4 | 0.481 | 0.248 | 0.303 | 0.496 | 0.182 | 0.274 | 0.480 | 0.166 | 0.237 | | 0.698 | 0.187 | 0.296 | 0.470 | 0.167 | 0.272 | 0.518 | 0.142 | 0.217 |
| | 0.8 | 0.587 | 0.154 | 0.259 | 0.535 | 0.135 | 0.203 | 0.523 | 0.115 | 0.175 | | 0.467 | 0.153 | 0.245 | 0.505 | 0.126 | 0.198 | 0.512 | 0.110 | 0.163 |
Table 2.
The point estimation results of .
Table 2.
The point estimation results of .
| | | | |
|---|
| | | MLE | Bayes | | MLE | Bayes |
|---|
| Prior→ | | | | | A | B | | | | | A | B |
|---|
| | | MPE | RMSE | MRAB | MPE | RMSE | MRAB | MPE | RMSE | MRAB | | MPE | RMSE | MRAB | MPE | RMSE | MRAB | MPE | RMSE | MRAB |
|---|
| | | |
| (30, 10) | 0.4 | 0.536 | 1.776 | 2.612 | 0.591 | 0.361 | 0.683 | 0.527 | 0.345 | 0.668 | | 0.603 | 1.706 | 2.442 | 0.548 | 0.346 | 0.672 | 0.293 | 0.338 | 0.626 |
| | 0.8 | 0.547 | 1.501 | 2.250 | 0.537 | 0.329 | 0.554 | 0.494 | 0.279 | 0.512 | | 0.541 | 1.457 | 2.207 | 0.523 | 0.280 | 0.521 | 0.457 | 0.262 | 0.483 |
| (30, 20) | 0.4 | 0.578 | 1.690 | 2.522 | 0.460 | 0.341 | 0.659 | 0.475 | 0.289 | 0.541 | | 0.515 | 1.680 | 2.439 | 0.516 | 0.330 | 0.568 | 0.328 | 0.277 | 0.516 |
| | 0.8 | 0.525 | 1.459 | 2.205 | 0.499 | 0.313 | 0.515 | 0.516 | 0.259 | 0.466 | | 0.412 | 1.345 | 2.189 | 0.432 | 0.275 | 0.496 | 0.364 | 0.251 | 0.457 |
| (50, 20) | 0.4 | 0.689 | 1.265 | 1.934 | 0.531 | 0.293 | 0.496 | 0.528 | 0.237 | 0.424 | | 0.590 | 1.239 | 1.927 | 0.528 | 0.269 | 0.468 | 0.340 | 0.228 | 0.419 |
| | 0.8 | 0.405 | 1.193 | 1.717 | 0.478 | 0.267 | 0.484 | 0.491 | 0.213 | 0.380 | | 0.484 | 1.109 | 1.696 | 0.473 | 0.243 | 0.429 | 0.543 | 0.209 | 0.365 |
| (50, 40) | 0.4 | 0.649 | 1.228 | 1.879 | 0.544 | 0.284 | 0.494 | 0.527 | 0.227 | 0.409 | | 0.595 | 1.202 | 1.838 | 0.517 | 0.256 | 0.448 | 0.216 | 0.214 | 0.407 |
| | 0.8 | 0.481 | 1.069 | 1.684 | 0.455 | 0.236 | 0.441 | 0.477 | 0.195 | 0.341 | | 0.487 | 1.056 | 1.663 | 0.473 | 0.210 | 0.537 | 0.333 | 0.191 | 0.325 |
| (80, 30) | 0.4 | 0.521 | 0.925 | 0.607 | 0.597 | 0.206 | 0.345 | 0.460 | 0.175 | 0.314 | | 0.510 | 0.763 | 0.369 | 0.574 | 0.198 | 0.341 | 0.448 | 0.173 | 0.265 |
| | 0.8 | 0.484 | 0.598 | 0.306 | 0.425 | 0.180 | 0.319 | 0.521 | 0.154 | 0.241 | | 0.296 | 0.484 | 0.291 | 0.396 | 0.165 | 0.467 | 0.331 | 0.138 | 0.224 |
| (80, 60) | 0.4 | 0.538 | 0.677 | 0.327 | 0.523 | 0.197 | 0.324 | 0.524 | 0.165 | 0.254 | | 0.502 | 0.520 | 0.317 | 0.488 | 0.186 | 0.528 | 0.241 | 0.148 | 0.234 |
| | 0.8 | 0.521 | 0.453 | 0.249 | 0.516 | 0.158 | 0.216 | 0.516 | 0.134 | 0.182 | | 0.600 | 0.374 | 0.232 | 0.517 | 0.143 | 0.604 | 0.168 | 0.125 | 0.175 |
| | | |
| (30, 10) | 0.4 | 1.681 | 1.249 | 0.815 | 1.384 | 1.177 | 0.766 | 1.727 | 1.162 | 0.757 | | 1.653 | 1.215 | 0.804 | 1.594 | 1.164 | 0.760 | 1.629 | 1.085 | 0.593 |
| | 0.8 | 1.627 | 1.115 | 0.730 | 1.478 | 1.008 | 0.646 | 1.322 | 0.977 | 0.575 | | 1.508 | 1.073 | 0.654 | 1.436 | 1.008 | 0.584 | 1.692 | 0.887 | 0.509 |
| (30, 20) | 0.4 | 1.710 | 1.156 | 0.758 | 1.689 | 1.099 | 0.674 | 1.653 | 1.031 | 0.586 | | 1.531 | 1.131 | 0.741 | 1.722 | 1.046 | 0.664 | 1.515 | 1.023 | 0.577 |
| | 0.8 | 1.678 | 1.076 | 0.697 | 1.590 | 0.949 | 0.528 | 1.400 | 0.793 | 0.484 | | 1.474 | 1.048 | 0.619 | 1.638 | 0.903 | 0.504 | 1.531 | 0.725 | 0.452 |
| (50, 20) | 0.4 | 1.621 | 0.930 | 0.534 | 1.579 | 0.856 | 0.492 | 1.659 | 0.679 | 0.423 | | 1.497 | 0.898 | 0.507 | 1.586 | 0.768 | 0.480 | 1.479 | 0.668 | 0.403 |
| | 0.8 | 1.526 | 0.888 | 0.492 | 1.576 | 0.715 | 0.443 | 1.559 | 0.572 | 0.351 | | 1.667 | 0.840 | 0.449 | 1.499 | 0.591 | 0.352 | 1.644 | 0.560 | 0.325 |
| (50, 40) | 0.4 | 1.673 | 0.902 | 0.501 | 1.556 | 0.794 | 0.472 | 1.322 | 0.590 | 0.365 | | 1.520 | 0.870 | 0.498 | 1.471 | 0.764 | 0.463 | 1.589 | 0.577 | 0.354 |
| | 0.8 | 1.513 | 0.869 | 0.460 | 1.550 | 0.576 | 0.338 | 1.579 | 0.523 | 0.313 | | 1.475 | 0.785 | 0.446 | 1.462 | 0.547 | 0.315 | 1.472 | 0.507 | 0.289 |
| (80, 30) | 0.4 | 1.623 | 0.803 | 0.454 | 1.744 | 0.557 | 0.307 | 1.473 | 0.500 | 0.247 | | 1.628 | 0.780 | 0.312 | 1.568 | 0.524 | 0.302 | 1.526 | 0.466 | 0.225 |
| | 0.8 | 1.465 | 0.482 | 0.262 | 1.526 | 0.446 | 0.225 | 1.469 | 0.367 | 0.204 | | 1.517 | 0.449 | 0.229 | 1.464 | 0.439 | 0.222 | 1.660 | 0.259 | 0.187 |
| (80, 60) | 0.4 | 1.568 | 0.798 | 0.297 | 1.681 | 0.492 | 0.247 | 1.376 | 0.444 | 0.223 | | 1.552 | 0.493 | 0.289 | 1.648 | 0.455 | 0.235 | 1.486 | 0.324 | 0.219 |
| | 0.8 | 1.474 | 0.416 | 0.213 | 1.438 | 0.397 | 0.180 | 1.648 | 0.285 | 0.164 | | 1.663 | 0.398 | 0.198 | 1.548 | 0.393 | 0.176 | 1.549 | 0.233 | 0.152 |
Table 3.
The point estimation results of and .
Table 3.
The point estimation results of and .
| | | | |
|---|
| | | MLE | Bayes | | MLE | Bayes |
|---|
| Prior→ | | | | | A | B | | | | | A | B |
|---|
| | | MPE | RMSE | MRAB | MPE | RMSE | MRAB | MPE | RMSE | MRAB | | MPE | RMSE | MRAB | MPE | RMSE | MRAB | MPE | RMSE | MRAB |
|---|
| | | |
| (30, 10) | 0.4 | 0.813 | 0.145 | 0.176 | 0.906 | 0.138 | 0.168 | 0.871 | 0.127 | 0.153 | | 0.810 | 0.144 | 0.174 | 0.896 | 0.137 | 0.167 | 0.856 | 0.055 | 0.055 |
| | 0.8 | 0.818 | 0.127 | 0.151 | 0.869 | 0.110 | 0.136 | 0.864 | 0.082 | 0.115 | | 0.817 | 0.120 | 0.147 | 0.871 | 0.096 | 0.124 | 0.866 | 0.046 | 0.045 |
| (30, 20) | 0.4 | 0.818 | 0.134 | 0.162 | 0.926 | 0.122 | 0.147 | 0.902 | 0.095 | 0.126 | | 0.817 | 0.133 | 0.161 | 0.927 | 0.122 | 0.147 | 0.903 | 0.049 | 0.047 |
| | 0.8 | 0.818 | 0.118 | 0.143 | 0.889 | 0.094 | 0.122 | 0.877 | 0.064 | 0.101 | | 0.943 | 0.118 | 0.133 | 0.925 | 0.091 | 0.115 | 0.892 | 0.045 | 0.045 |
| (50, 20) | 0.4 | 0.848 | 0.120 | 0.131 | 0.915 | 0.090 | 0.113 | 0.885 | 0.058 | 0.086 | | 0.851 | 0.110 | 0.130 | 0.907 | 0.087 | 0.109 | 0.875 | 0.042 | 0.038 |
| | 0.8 | 0.832 | 0.100 | 0.120 | 0.888 | 0.081 | 0.092 | 0.883 | 0.050 | 0.064 | | 0.830 | 0.092 | 0.109 | 0.879 | 0.073 | 0.089 | 0.874 | 0.032 | 0.029 |
| (50, 40) | 0.4 | 0.851 | 0.107 | 0.129 | 0.927 | 0.087 | 0.107 | 0.903 | 0.053 | 0.074 | | 0.847 | 0.100 | 0.118 | 0.930 | 0.086 | 0.101 | 0.906 | 0.036 | 0.034 |
| | 0.8 | 0.831 | 0.092 | 0.109 | 0.928 | 0.072 | 0.083 | 0.915 | 0.049 | 0.059 | | 0.828 | 0.091 | 0.108 | 0.924 | 0.071 | 0.082 | 0.912 | 0.029 | 0.028 |
| (80, 30) | 0.4 | 0.849 | 0.088 | 0.103 | 0.902 | 0.068 | 0.079 | 0.888 | 0.045 | 0.046 | | 0.850 | 0.085 | 0.098 | 0.899 | 0.062 | 0.070 | 0.885 | 0.017 | 0.026 |
| | 0.8 | 0.828 | 0.073 | 0.086 | 0.907 | 0.058 | 0.067 | 0.903 | 0.037 | 0.031 | | 0.827 | 0.064 | 0.074 | 0.917 | 0.054 | 0.059 | 0.911 | 0.018 | 0.018 |
| (80, 60) | 0.4 | 0.845 | 0.083 | 0.096 | 0.951 | 0.063 | 0.073 | 0.939 | 0.041 | 0.035 | | 0.841 | 0.075 | 0.086 | 0.950 | 0.059 | 0.068 | 0.938 | 0.020 | 0.021 |
| | 0.8 | 0.828 | 0.058 | 0.064 | 0.962 | 0.052 | 0.058 | 0.956 | 0.034 | 0.027 | | 0.826 | 0.057 | 0.063 | 0.961 | 0.044 | 0.049 | 0.955 | 0.016 | 0.015 |
| | | |
| (30, 10) | 0.4 | 0.947 | 0.827 | 0.954 | 0.857 | 0.803 | 0.937 | 0.479 | 0.765 | 0.891 | | 0.726 | 0.815 | 0.935 | 0.903 | 0.780 | 0.824 | 0.571 | 0.450 | 0.437 |
| | 0.8 | 0.866 | 0.774 | 0.902 | 0.771 | 0.709 | 0.824 | 0.569 | 0.506 | 0.553 | | 0.873 | 0.763 | 0.888 | 0.764 | 0.688 | 0.798 | 0.551 | 0.386 | 0.524 |
| (30, 20) | 0.4 | 0.864 | 0.786 | 0.914 | 0.684 | 0.758 | 0.882 | 0.150 | 0.529 | 0.625 | | 0.870 | 0.799 | 0.913 | 0.696 | 0.757 | 0.880 | 0.173 | 0.424 | 0.591 |
| | 0.8 | 0.855 | 0.753 | 0.873 | 0.877 | 0.678 | 0.787 | 0.396 | 0.436 | 0.486 | | 0.093 | 0.722 | 0.835 | 0.761 | 0.648 | 0.748 | 0.324 | 0.374 | 0.425 |
| (50, 20) | 0.4 | 0.676 | 0.708 | 0.822 | 0.812 | 0.639 | 0.735 | 0.348 | 0.434 | 0.446 | | 0.647 | 0.702 | 0.812 | 0.853 | 0.613 | 0.732 | 0.416 | 0.366 | 0.396 |
| | 0.8 | 0.841 | 0.661 | 0.768 | 0.746 | 0.587 | 0.660 | 0.377 | 0.418 | 0.413 | | 0.881 | 0.616 | 0.713 | 0.795 | 0.538 | 0.605 | 0.423 | 0.342 | 0.354 |
| (50, 40) | 0.4 | 0.651 | 0.694 | 0.806 | 0.741 | 0.613 | 0.731 | 0.227 | 0.422 | 0.426 | | 0.697 | 0.654 | 0.751 | 0.708 | 0.590 | 0.681 | 0.182 | 0.358 | 0.375 |
| | 0.8 | 0.859 | 0.617 | 0.704 | 0.752 | 0.538 | 0.681 | 0.216 | 0.410 | 0.396 | | 0.736 | 0.608 | 0.688 | 0.766 | 0.526 | 0.688 | 0.229 | 0.331 | 0.321 |
| (80, 30) | 0.4 | 0.663 | 0.606 | 0.684 | 0.867 | 0.499 | 0.760 | 0.337 | 0.361 | 0.375 | | 0.657 | 0.595 | 0.671 | 0.881 | 0.478 | 0.733 | 0.352 | 0.329 | 0.310 |
| | 0.8 | 0.879 | 0.524 | 0.594 | 0.845 | 0.414 | 0.796 | 0.273 | 0.329 | 0.326 | | 0.908 | 0.481 | 0.539 | 0.799 | 0.358 | 0.744 | 0.230 | 0.287 | 0.266 |
| (80, 60) | 0.4 | 0.706 | 0.598 | 0.675 | 0.741 | 0.468 | 0.814 | 0.102 | 0.347 | 0.347 | | 0.751 | 0.557 | 0.623 | 0.738 | 0.458 | 0.684 | 0.101 | 0.294 | 0.286 |
| | 0.8 | 0.884 | 0.488 | 0.446 | 0.690 | 0.349 | 0.849 | 0.054 | 0.317 | 0.308 | | 0.913 | 0.451 | 0.432 | 0.811 | 0.339 | 0.642 | 0.056 | 0.273 | 0.243 |
Table 4.
The point estimation results of .
Table 4.
The point estimation results of .
| | MLE | Bayes |
|---|
| | | | | | Prior-A | Prior-B |
|---|
| | | MPE | RMSE | MRAB | MPE | RMSE | MRAB | MPE | RMSE | MRAB |
|---|
|
| (30, 10) | 0.4 | 0.391 | 0.400 | 0.472 | 0.368 | 0.364 | 0.454 | 0.303 | 0.354 | 0.398 |
| | 0.8 | 0.801 | 0.376 | 0.454 | 0.757 | 0.360 | 0.450 | 0.767 | 0.341 | 0.347 |
| (30, 20) | 0.4 | 0.402 | 0.389 | 0.460 | 0.441 | 0.363 | 0.453 | 0.437 | 0.346 | 0.378 |
| | 0.8 | 0.809 | 0.364 | 0.454 | 0.887 | 0.353 | 0.449 | 0.881 | 0.336 | 0.321 |
| (50, 20) | 0.4 | 0.426 | 0.356 | 0.451 | 0.329 | 0.346 | 0.448 | 0.299 | 0.329 | 0.289 |
| | 0.8 | 0.804 | 0.121 | 0.277 | 0.758 | 0.107 | 0.270 | 0.767 | 0.110 | 0.241 |
| (50, 40) | 0.4 | 0.402 | 0.326 | 0.448 | 0.442 | 0.336 | 0.446 | 0.439 | 0.312 | 0.243 |
| | 0.8 | 0.814 | 0.111 | 0.265 | 0.888 | 0.105 | 0.253 | 0.882 | 0.107 | 0.191 |
| (80, 30) | 0.4 | 0.410 | 0.109 | 0.259 | 0.389 | 0.103 | 0.244 | 0.292 | 0.097 | 0.182 |
| | 0.8 | 0.803 | 0.104 | 0.239 | 0.746 | 0.096 | 0.221 | 0.753 | 0.082 | 0.140 |
| (80, 60) | 0.4 | 0.415 | 0.106 | 0.253 | 0.443 | 0.102 | 0.242 | 0.441 | 0.085 | 0.177 |
| | 0.8 | 0.805 | 0.102 | 0.234 | 0.890 | 0.093 | 0.219 | 0.887 | 0.080 | 0.115 |
|
| (30, 10) | 0.4 | 0.407 | 0.389 | 0.456 | 0.397 | 0.362 | 0.451 | 0.353 | 0.349 | 0.376 |
| | 0.8 | 0.806 | 0.359 | 0.454 | 0.817 | 0.346 | 0.449 | 0.816 | 0.333 | 0.317 |
| (30, 20) | 0.4 | 0.423 | 0.376 | 0.455 | 0.406 | 0.356 | 0.450 | 0.380 | 0.340 | 0.368 |
| | 0.8 | 0.809 | 0.345 | 0.449 | 0.793 | 0.341 | 0.446 | 0.795 | 0.328 | 0.310 |
| (50, 20) | 0.4 | 0.408 | 0.334 | 0.445 | 0.279 | 0.337 | 0.446 | 0.330 | 0.321 | 0.265 |
| | 0.8 | 0.805 | 0.112 | 0.275 | 0.768 | 0.119 | 0.268 | 0.787 | 0.107 | 0.241 |
| (50, 40) | 0.4 | 0.426 | 0.313 | 0.440 | 0.644 | 0.326 | 0.444 | 0.392 | 0.309 | 0.243 |
| | 0.8 | 0.814 | 0.109 | 0.263 | 0.788 | 0.110 | 0.251 | 0.818 | 0.094 | 0.185 |
| (80, 30) | 0.4 | 0.403 | 0.104 | 0.259 | 0.290 | 0.103 | 0.244 | 0.293 | 0.082 | 0.177 |
| | 0.8 | 0.803 | 0.101 | 0.234 | 0.746 | 0.095 | 0.217 | 0.753 | 0.075 | 0.138 |
| (80, 60) | 0.4 | 0.410 | 0.103 | 0.251 | 0.443 | 0.101 | 0.240 | 0.441 | 0.079 | 0.170 |
| | 0.8 | 0.805 | 0.096 | 0.231 | 0.890 | 0.092 | 0.211 | 0.887 | 0.071 | 0.110 |
Table 5.
The 95% interval estimation results of .
Table 5.
The 95% interval estimation results of .
| | | |
|---|
| | | ACI | BCI | ACI | BCI |
|---|
| Prior→ | | | | A | B | | | A | B |
|---|
| | | AIL | CP | AIL | CP | AIL | CP | AIL | CP | AIL | CP | AIL | CP |
|---|
| | | |
| (30, 10) | 0.4 | 3.188 | 0.847 | 1.142 | 0.912 | 0.987 | 0.914 | 2.924 | 0.850 | 0.999 | 0.913 | 0.928 | 0.915 |
| | 0.8 | 2.560 | 0.853 | 0.920 | 0.915 | 0.885 | 0.917 | 2.272 | 0.857 | 0.897 | 0.916 | 0.847 | 0.919 |
| (30, 20) | 0.4 | 2.818 | 0.851 | 0.993 | 0.914 | 0.951 | 0.916 | 2.571 | 0.854 | 0.982 | 0.915 | 0.900 | 0.917 |
| | 0.8 | 2.256 | 0.856 | 0.883 | 0.917 | 0.851 | 0.919 | 2.078 | 0.860 | 0.876 | 0.918 | 0.837 | 0.921 |
| (50, 20) | 0.4 | 1.915 | 0.860 | 0.877 | 0.918 | 0.809 | 0.920 | 1.893 | 0.862 | 0.864 | 0.919 | 0.785 | 0.922 |
| | 0.8 | 1.658 | 0.866 | 0.860 | 0.919 | 0.710 | 0.922 | 1.591 | 0.867 | 0.829 | 0.920 | 0.694 | 0.924 |
| (50, 40) | 0.4 | 1.897 | 0.864 | 0.874 | 0.918 | 0.754 | 0.921 | 1.662 | 0.865 | 0.856 | 0.920 | 0.709 | 0.923 |
| | 0.8 | 1.585 | 0.868 | 0.814 | 0.921 | 0.687 | 0.923 | 1.454 | 0.870 | 0.777 | 0.922 | 0.687 | 0.925 |
| (80, 30) | 0.4 | 1.439 | 0.872 | 0.779 | 0.923 | 0.678 | 0.925 | 1.415 | 0.872 | 0.768 | 0.924 | 0.671 | 0.927 |
| | 0.8 | 1.272 | 0.877 | 0.585 | 0.928 | 0.579 | 0.930 | 1.240 | 0.878 | 0.584 | 0.929 | 0.563 | 0.931 |
| (80, 60) | 0.4 | 1.329 | 0.875 | 0.678 | 0.925 | 0.619 | 0.927 | 1.253 | 0.876 | 0.637 | 0.926 | 0.590 | 0.928 |
| | 0.8 | 1.227 | 0.878 | 0.541 | 0.929 | 0.499 | 0.931 | 1.145 | 0.879 | 0.574 | 0.930 | 0.494 | 0.932 |
| | | |
| (30, 10) | 0.4 | 2.442 | 0.864 | 0.814 | 0.924 | 0.726 | 0.925 | 2.349 | 0.866 | 0.737 | 0.925 | 0.701 | 0.927 |
| | 0.8 | 1.954 | 0.871 | 0.627 | 0.930 | 0.550 | 0.931 | 1.912 | 0.873 | 0.606 | 0.931 | 0.502 | 0.933 |
| (30, 20) | 0.4 | 2.395 | 0.866 | 0.716 | 0.927 | 0.639 | 0.928 | 2.184 | 0.868 | 0.653 | 0.928 | 0.625 | 0.930 |
| | 0.8 | 1.773 | 0.873 | 0.590 | 0.931 | 0.517 | 0.932 | 1.742 | 0.875 | 0.576 | 0.932 | 0.495 | 0.934 |
| (50, 20) | 0.4 | 1.629 | 0.876 | 0.578 | 0.932 | 0.488 | 0.933 | 1.614 | 0.878 | 0.529 | 0.933 | 0.451 | 0.935 |
| | 0.8 | 1.554 | 0.880 | 0.486 | 0.935 | 0.431 | 0.936 | 1.524 | 0.882 | 0.462 | 0.936 | 0.416 | 0.938 |
| (50, 40) | 0.4 | 1.600 | 0.878 | 0.533 | 0.933 | 0.451 | 0.934 | 1.593 | 0.879 | 0.508 | 0.934 | 0.427 | 0.936 |
| | 0.8 | 1.516 | 0.882 | 0.433 | 0.936 | 0.414 | 0.937 | 1.437 | 0.884 | 0.423 | 0.937 | 0.406 | 0.938 |
| (80, 30) | 0.4 | 1.464 | 0.883 | 0.391 | 0.937 | 0.377 | 0.938 | 1.398 | 0.885 | 0.387 | 0.938 | 0.368 | 0.939 |
| | 0.8 | 1.295 | 0.886 | 0.331 | 0.938 | 0.268 | 0.939 | 1.243 | 0.887 | 0.320 | 0.939 | 0.248 | 0.941 |
| (80, 60) | 0.4 | 1.392 | 0.885 | 0.370 | 0.937 | 0.356 | 0.938 | 1.328 | 0.886 | 0.360 | 0.938 | 0.337 | 0.940 |
| | 0.8 | 1.261 | 0.887 | 0.234 | 0.940 | 0.210 | 0.941 | 1.222 | 0.888 | 0.228 | 0.941 | 0.196 | 0.941 |
Table 6.
The 95% interval estimation results of .
Table 6.
The 95% interval estimation results of .
| | | |
|---|
| | | ACI | BCI | ACI | BCI |
|---|
| Prior→ | | | | A | B | | | A | B |
|---|
| | | AIL | CP | AIL | CP | AIL | CP | AIL | CP | AIL | CP | AIL | CP |
|---|
| | | |
| (30, 10) | 0.4 | 3.852 | 0.842 | 0.857 | 0.907 | 0.693 | 0.908 | 3.533 | 0.844 | 0.814 | 0.909 | 0.640 | 0.910 |
| | 0.8 | 3.437 | 0.849 | 0.673 | 0.915 | 0.575 | 0.914 | 3.393 | 0.851 | 0.646 | 0.917 | 0.565 | 0.916 |
| (30, 20) | 0.4 | 3.585 | 0.847 | 0.778 | 0.911 | 0.612 | 0.912 | 3.428 | 0.849 | 0.690 | 0.913 | 0.566 | 0.914 |
| | 0.8 | 3.254 | 0.852 | 0.563 | 0.919 | 0.523 | 0.921 | 3.197 | 0.854 | 0.542 | 0.920 | 0.492 | 0.922 |
| (50, 20) | 0.4 | 2.995 | 0.855 | 0.546 | 0.921 | 0.501 | 0.922 | 2.845 | 0.857 | 0.538 | 0.923 | 0.475 | 0.924 |
| | 0.8 | 2.688 | 0.858 | 0.480 | 0.924 | 0.456 | 0.925 | 2.424 | 0.860 | 0.479 | 0.926 | 0.452 | 0.927 |
| (50, 40) | 0.4 | 2.871 | 0.857 | 0.515 | 0.922 | 0.490 | 0.923 | 2.742 | 0.859 | 0.506 | 0.924 | 0.467 | 0.925 |
| | 0.8 | 2.347 | 0.862 | 0.454 | 0.925 | 0.430 | 0.926 | 2.209 | 0.864 | 0.445 | 0.927 | 0.419 | 0.928 |
| (80, 30) | 0.4 | 2.191 | 0.864 | 0.439 | 0.926 | 0.406 | 0.927 | 1.908 | 0.866 | 0.409 | 0.928 | 0.363 | 0.929 |
| | 0.8 | 1.754 | 0.870 | 0.352 | 0.930 | 0.339 | 0.931 | 1.564 | 0.872 | 0.348 | 0.931 | 0.325 | 0.933 |
| (80, 60) | 0.4 | 1.985 | 0.867 | 0.404 | 0.928 | 0.361 | 0.929 | 1.745 | 0.869 | 0.382 | 0.930 | 0.356 | 0.931 |
| | 0.8 | 1.549 | 0.872 | 0.343 | 0.931 | 0.309 | 0.932 | 1.391 | 0.874 | 0.330 | 0.932 | 0.314 | 0.934 |
| | | |
| (30, 10) | 0.4 | 2.634 | 0.885 | 1.737 | 0.889 | 1.531 | 0.893 | 2.593 | 0.886 | 1.633 | 0.891 | 1.489 | 0.894 |
| | 0.8 | 2.246 | 0.890 | 1.399 | 0.894 | 1.207 | 0.898 | 2.229 | 0.891 | 1.375 | 0.896 | 1.178 | 0.899 |
| (30, 20) | 0.4 | 2.571 | 0.887 | 1.665 | 0.891 | 1.315 | 0.895 | 2.455 | 0.888 | 1.563 | 0.893 | 1.282 | 0.896 |
| | 0.8 | 2.212 | 0.891 | 1.251 | 0.895 | 1.167 | 0.899 | 2.172 | 0.892 | 1.247 | 0.897 | 0.972 | 0.900 |
| (50, 20) | 0.4 | 2.100 | 0.892 | 1.162 | 0.896 | 1.101 | 0.900 | 2.072 | 0.893 | 1.141 | 0.898 | 0.916 | 0.901 |
| | 0.8 | 1.740 | 0.896 | 1.118 | 0.900 | 0.926 | 0.904 | 1.705 | 0.897 | 1.075 | 0.902 | 0.844 | 0.905 |
| (50, 40) | 0.4 | 2.073 | 0.893 | 1.139 | 0.897 | 0.954 | 0.901 | 1.974 | 0.894 | 1.115 | 0.899 | 0.862 | 0.902 |
| | 0.8 | 1.696 | 0.898 | 1.107 | 0.902 | 0.896 | 0.906 | 1.635 | 0.899 | 1.067 | 0.904 | 0.800 | 0.907 |
| (80, 30) | 0.4 | 1.511 | 0.901 | 1.084 | 0.906 | 0.869 | 0.909 | 1.479 | 0.902 | 1.001 | 0.907 | 0.792 | 0.910 |
| | 0.8 | 1.220 | 0.906 | 0.970 | 0.909 | 0.780 | 0.913 | 1.182 | 0.907 | 0.874 | 0.910 | 0.724 | 0.913 |
| (80, 60) | 0.4 | 1.447 | 0.903 | 1.004 | 0.908 | 0.853 | 0.911 | 1.342 | 0.904 | 0.959 | 0.909 | 0.784 | 0.912 |
| | 0.8 | 1.169 | 0.908 | 0.854 | 0.911 | 0.732 | 0.914 | 1.094 | 0.909 | 0.845 | 0.912 | 0.646 | 0.915 |
Table 7.
The 95% interval estimation results of and .
Table 7.
The 95% interval estimation results of and .
| | | |
|---|
| | | ACI | BCI | ACI | BCI |
|---|
| Prior→ | | | | A | B | | | A | B |
|---|
| | | AIL | CP | AIL | CP | AIL | CP | AIL | CP | AIL | CP | AIL | CP |
|---|
| | | |
| (30, 10) | 0.4 | 0.462 | 0.932 | 0.117 | 0.944 | 0.104 | 0.946 | 0.289 | 0.934 | 0.107 | 0.946 | 0.095 | 0.948 |
| | 0.8 | 0.410 | 0.935 | 0.099 | 0.945 | 0.091 | 0.947 | 0.240 | 0.937 | 0.098 | 0.947 | 0.087 | 0.949 |
| (30, 20) | 0.4 | 0.434 | 0.933 | 0.102 | 0.944 | 0.097 | 0.946 | 0.275 | 0.935 | 0.102 | 0.946 | 0.090 | 0.948 |
| | 0.8 | 0.384 | 0.936 | 0.095 | 0.945 | 0.088 | 0.947 | 0.219 | 0.938 | 0.092 | 0.947 | 0.082 | 0.949 |
| (50, 20) | 0.4 | 0.275 | 0.939 | 0.093 | 0.945 | 0.083 | 0.948 | 0.190 | 0.941 | 0.091 | 0.947 | 0.079 | 0.950 |
| | 0.8 | 0.221 | 0.940 | 0.085 | 0.947 | 0.079 | 0.949 | 0.182 | 0.942 | 0.084 | 0.949 | 0.075 | 0.951 |
| (50, 40) | 0.4 | 0.230 | 0.940 | 0.090 | 0.946 | 0.080 | 0.948 | 0.184 | 0.941 | 0.089 | 0.948 | 0.078 | 0.950 |
| | 0.8 | 0.204 | 0.941 | 0.080 | 0.947 | 0.074 | 0.949 | 0.179 | 0.943 | 0.079 | 0.949 | 0.072 | 0.951 |
| (80, 30) | 0.4 | 0.193 | 0.941 | 0.077 | 0.948 | 0.071 | 0.950 | 0.173 | 0.943 | 0.077 | 0.950 | 0.071 | 0.952 |
| | 0.8 | 0.152 | 0.943 | 0.065 | 0.950 | 0.062 | 0.952 | 0.149 | 0.944 | 0.064 | 0.951 | 0.060 | 0.953 |
| (80, 60) | 0.4 | 0.186 | 0.942 | 0.071 | 0.949 | 0.068 | 0.951 | 0.158 | 0.944 | 0.070 | 0.951 | 0.067 | 0.953 |
| | 0.8 | 0.145 | 0.944 | 0.057 | 0.950 | 0.055 | 0.952 | 0.141 | 0.945 | 0.056 | 0.952 | 0.054 | 0.954 |
| | | |
| (30, 10) | 0.4 | 1.109 | 0.942 | 0.785 | 0.946 | 0.689 | 0.949 | 1.093 | 0.943 | 0.733 | 0.947 | 0.632 | 0.950 |
| | 0.8 | 1.017 | 0.943 | 0.692 | 0.947 | 0.576 | 0.950 | 0.989 | 0.944 | 0.646 | 0.948 | 0.568 | 0.951 |
| (30, 20) | 0.4 | 1.084 | 0.943 | 0.726 | 0.947 | 0.624 | 0.950 | 1.002 | 0.944 | 0.714 | 0.948 | 0.603 | 0.951 |
| | 0.8 | 0.985 | 0.944 | 0.638 | 0.948 | 0.566 | 0.951 | 0.855 | 0.945 | 0.610 | 0.949 | 0.548 | 0.955 |
| (50, 20) | 0.4 | 0.781 | 0.947 | 0.559 | 0.950 | 0.518 | 0.953 | 0.760 | 0.948 | 0.521 | 0.951 | 0.491 | 0.954 |
| | 0.8 | 0.744 | 0.948 | 0.424 | 0.952 | 0.390 | 0.954 | 0.735 | 0.949 | 0.407 | 0.953 | 0.361 | 0.955 |
| (50, 40) | 0.4 | 0.767 | 0.947 | 0.546 | 0.951 | 0.487 | 0.954 | 0.754 | 0.948 | 0.515 | 0.952 | 0.371 | 0.955 |
| | 0.8 | 0.696 | 0.950 | 0.382 | 0.954 | 0.330 | 0.956 | 0.669 | 0.951 | 0.357 | 0.954 | 0.318 | 0.958 |
| (80, 30) | 0.4 | 0.659 | 0.951 | 0.335 | 0.955 | 0.316 | 0.958 | 0.623 | 0.952 | 0.322 | 0.956 | 0.305 | 0.959 |
| | 0.8 | 0.609 | 0.953 | 0.259 | 0.957 | 0.253 | 0.960 | 0.549 | 0.954 | 0.258 | 0.958 | 0.245 | 0.961 |
| (80, 60) | 0.4 | 0.631 | 0.953 | 0.310 | 0.957 | 0.275 | 0.959 | 0.598 | 0.954 | 0.295 | 0.958 | 0.275 | 0.960 |
| | 0.8 | 0.576 | 0.954 | 0.233 | 0.958 | 0.204 | 0.961 | 0.518 | 0.955 | 0.221 | 0.959 | 0.198 | 0.961 |
Table 8.
The interval estimation results of .
Table 8.
The interval estimation results of .
| | 95% ACI | 95% BCI |
|---|
| | | | | Prior-A | Prior-B |
|---|
| | | AIL | CP | AIL | CP | AIL | CP |
|---|
|
| (30, 10) | 0.4 | 0.427 | 0.951 | 0.376 | 0.954 | 0.348 | 0.957 |
| | 0.8 | 0.388 | 0.953 | 0.322 | 0.956 | 0.279 | 0.959 |
| (30, 20) | 0.4 | 0.413 | 0.952 | 0.360 | 0.955 | 0.333 | 0.958 |
| | 0.8 | 0.359 | 0.953 | 0.298 | 0.956 | 0.268 | 0.959 |
| (50, 20) | 0.4 | 0.330 | 0.954 | 0.287 | 0.957 | 0.259 | 0.960 |
| | 0.8 | 0.287 | 0.956 | 0.256 | 0.959 | 0.240 | 0.962 |
| (50, 40) | 0.4 | 0.299 | 0.956 | 0.271 | 0.959 | 0.251 | 0.961 |
| | 0.8 | 0.273 | 0.957 | 0.246 | 0.960 | 0.226 | 0.962 |
| (80, 30) | 0.4 | 0.267 | 0.957 | 0.239 | 0.960 | 0.219 | 0.963 |
| | 0.8 | 0.245 | 0.958 | 0.217 | 0.961 | 0.167 | 0.964 |
| (80, 60) | 0.4 | 0.252 | 0.958 | 0.228 | 0.961 | 0.175 | 0.964 |
| | 0.8 | 0.213 | 0.960 | 0.197 | 0.962 | 0.153 | 0.965 |
|
| (30, 10) | 0.4 | 0.413 | 0.952 | 0.357 | 0.955 | 0.334 | 0.957 |
| | 0.8 | 0.378 | 0.954 | 0.318 | 0.957 | 0.269 | 0.960 |
| (30, 20) | 0.4 | 0.406 | 0.953 | 0.346 | 0.956 | 0.325 | 0.958 |
| | 0.8 | 0.368 | 0.954 | 0.286 | 0.957 | 0.257 | 0.960 |
| (50, 20) | 0.4 | 0.321 | 0.955 | 0.279 | 0.958 | 0.251 | 0.961 |
| | 0.8 | 0.269 | 0.957 | 0.250 | 0.960 | 0.236 | 0.963 |
| (50, 40) | 0.4 | 0.280 | 0.957 | 0.268 | 0.960 | 0.241 | 0.962 |
| | 0.8 | 0.257 | 0.958 | 0.239 | 0.961 | 0.221 | 0.963 |
| (80, 30) | 0.4 | 0.247 | 0.958 | 0.230 | 0.961 | 0.200 | 0.964 |
| | 0.8 | 0.222 | 0.960 | 0.211 | 0.962 | 0.157 | 0.965 |
| (80, 60) | 0.4 | 0.239 | 0.959 | 0.218 | 0.962 | 0.167 | 0.965 |
| | 0.8 | 0.197 | 0.961 | 0.186 | 0.964 | 0.148 | 0.966 |
Table 9.
Newly transformed jute fiber data.
Table 9.
Newly transformed jute fiber data.
| Time [Cause] |
|---|
| 0.3675 [2] | 0.4081 [2] | 0.4558 [2] | 0.4666 [1] | 0.7009 [1] | 0.7146 [2] | 0.7638 [1] | 0.8355 [2] | 0.8364 [2] | 0.8942 [1], |
| 0.9072 [2] | 1.1045 [2] | 1.1385 [2] | 1.1630 [1] | 1.1896 [2] | 1.1986 [2] | 1.2781 [1] | 1.3509 [1] | 1.4596 [2] | 1.4696 [1], |
| 1.5029 [2] | 1.6837 [1] | 1.8266 [1] | 1.9342 [1] | 2.0275 [1] | 2.2565 [1] | 2.4443 [2] | 2.4633 [2] | 3.0000 [1] | 3.1286 [2], |
| 3.2831 [2] | 3.6027 [1] | 3.6084 [2] | 3.7581 [2] | 3.7822 [2] | 4.0425 [1] | 4.1902 [2] | 4.2597 [1] | 4.5771 [1] | 4.6287 [1], |
| 4.8966 [1] | 4.9568 [1] | 4.9794 [1] | 5.4744 [2] | 5.5042 [1] | 5.6239 [1] | 5.7486 [1] | 5.7860 [2] | 5.8557 [2] | 5.9440 [1], |
| 5.9670 [2] | 6.4048 [1] | 6.7262 [2] | 6.8816 [2] | 7.1636 [1] | 7.6514 [2] | 8.1387 [1] | 16.6492 [2] | | |
Table 10.
Fitting the Hj model from jute fiber data.
Table 10.
Fitting the Hj model from jute fiber data.
| Cause | Par. | MLE (Std.Er) | 95% ACI [IW] | KS (p-Value) |
|---|
| Cause 1 | | 0.1139 (0.1117) | (0.0015, 0.3328) [0.3313] | 0.1314 (0.6505) |
| | | 0.1001 (0.0257) | (0.0496, 0.1505) [0.1009] | |
| Cause 2 | | 0.4439 (0.1468) | (0.1561, 0.7317) [0.5755] | 0.1320 (0.6458) |
| | | 0.0381 (0.0152) | (0.0084, 0.0678) [0.0594] | |
Table 11.
Two APTIIC competing risk samples with binomial removals from jute fiber data.
Table 11.
Two APTIIC competing risk samples with binomial removals from jute fiber data.
| | : and |
| i | 1 | 2 | 3 | 4 | 5 | 6 | 7 | 8 | 9 | 10 |
| 22 | 13 | 4 | 0 | 0 | 0 | 0 | 0 | 0 | 0 |
| 2 | 1 | 1 | 2 | 2 | 2 | 2 | 1 | 2 | 2 |
| 0.3675 | 0.4666 | 0.7009 | 0.8355 | 0.9072 | 1.1385 | 1.1896 | 1.2781 | 1.4596 | 1.5029 |
| | : and |
| i | 1 | 2 | 3 | 4 | 5 | 6 | 7 | 8 | 9 | 10 |
| 17 | 11 | 3 | 0 | 0 | 0 | 0 | 0 | 0 | 0 |
| 2 | 2 | 1 | 1 | 1 | 2 | 1 | 2 | 2 | 1 |
| 0.3675 | 0.4558 | 0.4666 | 0.7009 | 0.7638 | 0.8355 | 0.8942 | 0.9072 | 1.1385 | 1.1630 |
| i | 11 | 12 | 13 | 14 | 15 | 16 | 17 | 18 | 19 | 20 |
| 0 | 0 | 0 | 0 | 0 | 0 | 0 | 0 | 0 | 0 |
| 1 | 1 | 2 | 1 | 1 | 1 | 1 | 2 | 1 | 2 |
| 1.2781 | 1.3509 | 1.5029 | 1.6837 | 1.9342 | 2.0275 | 2.2565 | 2.4633 | 3.0000 | 3.7822 |
Table 12.
Estimates of , , , and from jute fiber data.
Table 12.
Estimates of , , , and from jute fiber data.
| Sample | Par. | MLE | ACI |
|---|
| | | Bayes | BCI |
|---|
| | | Est. | S.Err | Lower | Upper | IW |
|---|
| | 4.21 × | 5.00 × | 0.0000 | 1.02 × | 1.02 × |
| | | 4.21 × | 1.00 × | 4.19 × | 4.23 × | 3.91 × |
| | | 2.64 × | 4.43 × | 0.0000 | 8.94 × | 8.94 × |
| | | 3.99 × | 4.99 × | 1.54 × | 1.11 × | 1.09 × |
| | | 2.58 × | 1.49 × | 0.0000 | 5.49 × | 5.49 × |
| | | 2.58 × | 4.98 × | 2.58 × | 2.58 × | 1.96 × |
| | | 6.08 × | 2.30 × | 1.57 × | 0.11 × | 9.00 × |
| | | 6.08 × | 4.97 × | 6.07 × | 6.08 × | 1.95 × |
| | | 8.97 × | 3.07 × | 8.37 × | 9.58 × | 1.20 × |
| | | 8.97 × | 1.98 × | 8.97 × | 8.98 × | 5.27 × |
| | | 3.91 × | 2.70 × | 0.0000 | 9.21 × | 9.21 × |
| | | 3.91 × | 9.28 × | 3.91 × | 3.92 × | 3.38 × |
| | | 2.23 × | 2.58 × | 1.72 × | 2.73 × | 1.01 × |
| | | 1.82 × | 4.06 × | 1.34 × | 2.37 × | 1.03 × |
| | 4.25 × | 1.94 × | 4.45 × | 8.06 × | 7.62 × |
| | | 4.25 × | 1.00 × | 4.23 × | 4.27 × | 3.93 × |
| | | 5.96 × | 1.23 × | 0.0000 | 2.46 × | 2.46 × |
| | | 3.99 × | 5.01 × | 1.62 × | 1.13 × | 1.12 × |
| | | 3.96 × | 1.14 × | 1.72 × | 6.20 × | 4.48 × |
| | | 3.96 × | 4.99 × | 3.96 × | 3.96 × | 1.94 × |
| | | 2.46 × | 8.71 × | 7.54 × | 4.17 × | 3.41 × |
| | | 2.46 × | 4.92 × | 2.46 × | 2.46 × | 1.92 × |
| | | 9.23 × | 1.66 × | 8.90 × | 9.55 × | 6.50 × |
| | | 9.23 × | 2.04 × | 9.23 × | 9.23 × | 5.47 × |
| | | 2.44 × | 1.11 × | 2.55 × | 4.62 × | 4.36 × |
| | | 2.44 × | 8.76 × | 2.43 × | 2.44 × | 2.74 × |
| | | 6.59 × | 1.09 × | 4.45 × | 8.72 × | 4.27 × |
| | | 6.18 × | 4.07 × | 4.30 × | 8.37 × | 4.07 × |
Table 13.
Summary for statistics of , , and from jute fiber data.
Table 13.
Summary for statistics of , , and from jute fiber data.
| Sample | Par. | Mean | Mode | | | | Std.D | Sk. |
|---|
| | 4.21 × | 4.19 × | 4.20 × | 4.21 × | 4.22 × | 1.00 × | 8.83 × |
| | | 3.99 × | 1.17 × | 1.59 × | 3.40 × | 5.77 × | 3.00 × | 9.84 × |
| | | 2.58 × | 2.58 × | 2.58 × | 2.58 × | 2.58 × | 4.98 × | 2.56 × |
| | | 6.08 × | 6.08 × | 6.07 × | 6.08 × | 6.08 × | 4.97 × | 2.14 × |
| | | 8.97 × | 8.97 × | 8.97 × | 8.97 × | 8.97 × | 1.34 × | −5.21 × |
| | | 3.91 × | 3.91 × | 3.91 × | 3.91 × | 3.91 × | 8.61 × | 4.46 × |
| | 4.25 × | 4.27 × | 4.25 × | 4.25 × | 4.26 × | 1.00 × | −6.80 × |
| | | 3.99 × | 4.81 × | 1.56 × | 3.38 × | 5.76 × | 3.04 × | 0.11 × |
| | | 3.96 × | 3.96 × | 3.96 × | 3.96 × | 3.96 × | 4.99 × | 3.69 × |
| | | 2.46 × | 2.46 × | 2.46 × | 2.46 × | 2.46 × | 4.92 × | −2.39 × |
| | | 9.23 × | 9.23 × | 9.23 × | 9.23 × | 9.23 × | 1.40 × | −5.39 × |
| | | 2.44 × | 2.44 × | 2.44 × | 2.44 × | 2.44 × | 7.02 × | 1.76 × |
Table 14.
Times to failure of 21 electrical appliances.
Table 14.
Times to failure of 21 electrical appliances.
| Time [Cause] |
|---|
| 0.12 [2] | 0.16 [2] | 0.16 [2] | 0.46 [2] | 0.46 [2] | 0.52 [2] | 0.98 [1] | 0.98 [2] | 2.70 [2] | 4.13 [1] | 4.95 [1] |
| 4.95 [2] | 5.57 [2] | 6.16 [2] | 6.92 [1] | 10.65 [1] | 11.07 [2] | 11.93 [1] | 14.67 [1] | 14.67 [2] | 19.37 [1] | |
Table 15.
Fitting the Hj model from electrical appliance data.
Table 15.
Fitting the Hj model from electrical appliance data.
| Cause | Par. | MLE (Std.Er) | 95% ACI [IW] | KS (p-Value) |
|---|
| Cause 1 | | 0.0750 (0.1030) | (0.0000, 0.2770) [0.2770] | 0.1322 (0.9950) |
| | | 0.0144 (0.0062) | (0.0022, 0.0266) [0.0244] | |
| Cause 2 | | 0.6843 (0.2473) | (0.1996, 1.1691) [0.9694] | 0.2109 (0.6093) |
| | | 0.0141 (0.0111) | (0.0014, 0.0358) [0.0344] | |
Table 16.
Two APTIIC competing risk samples with binomial removals from electrical appliance data.
Table 16.
Two APTIIC competing risk samples with binomial removals from electrical appliance data.
| | : and |
|---|
| i | 1 | 2 | 3 | 4 | 5 | 6 | 7 | 8 | 9 | 10 |
| 4 | 4 | 0 | 0 | 0 | 0 | 0 | 0 | 0 | 0 |
| 2 | 2 | 2 | 2 | 1 | 2 | 1 | 2 | 2 | 2 |
| 0.12 | 0.16 | 0.46 | 0.52 | 0.98 | 2.70 | 4.13 | 4.95 | 5.57 | 6.16 |
| | : and |
| i | 1 | 2 | 3 | 4 | 5 | 6 | 7 | 8 | 9 | 10 |
| 2 | 2 | 0 | 0 | 0 | 0 | 0 | 0 | 0 | 0 |
| 2 | 2 | 2 | 2 | 1 | 2 | 1 | 1 | 2 | 2 |
| 0.12 | 0.16 | 0.46 | 0.52 | 0.98 | 2.70 | 4.13 | 4.95 | 5.57 | 6.16 |
| i | 11 | 12 | 13 | 14 | 15 | | | | | |
| 0 | 0 | 0 | 0 | 0 | | | | | |
| 1 | 1 | 1 | 1 | 1 | | | | | |
| 6.92 | 10.65 | 11.93 | 14.67 | 19.37 | | | | | |
Table 17.
Estimates of , , , and from electrical appliance data.
Table 17.
Estimates of , , , and from electrical appliance data.
| Sample | Par. | MLE | ACI |
|---|
| | | Bayes | BCI |
|---|
| | | Est. | S.Err | Lower | Upper | IW |
|---|
| | 7.40 × | 1.32 × | 0.0000 | 3.33 × | 3.33 × |
| | | 7.41 × | 9.98 × | 5.45 × | 9.38 × | 3.93 × |
| | | 3.92 × | 2.10 × | 0.0000 | 8.03 × | 8.03 × |
| | | 3.92 × | 1.01 × | 3.73 × | 4.12 × | 3.91 × |
| | | 2.00 × | 2.65 × | 0.0000 | 7.19 × | 7.19 × |
| | | 2.08 × | 8.74 × | 4.84 × | 3.87 × | 3.38 × |
| | | 5.56 × | 3.70 × | 0.0000 | 1.28 × | 1.28 × |
| | | 5.56 × | 9.59 × | 3.69 × | 7.45 × | 3.76 × |
| | | 8.20 × | 8.07 × | 6.62 × | 9.78 × | 3.16 × |
| | | 8.20 × | 4.87 × | 8.10 × | 8.29 × | 1.90 × |
| | | 1.72 × | 2.49 × | 0.0000 | 6.60 × | 6.60 × |
| | | 1.73 × | 2.33 × | 1.28 × | 2.20 × | 9.13 × |
| | | 1.45 × | 4.41 × | 5.90 × | 2.32 × | 1.73 × |
| | | 1.27 × | 1.85 × | 5.74 × | 2.19 × | 1.62 × |
| | 3.68 × | 6.50 × | 0.0000 | 1.64 × | 1.64 × |
| | | 3.68 × | 9.93 × | 3.48 × | 3.87 × | 3.90 × |
| | | 2.89 × | 1.09 × | 7.48 × | 5.03 × | 4.28 × |
| | | 2.89 × | 1.00 × | 2.87 × | 2.91 × | 3.90 × |
| | | 1.41 × | 5.82 × | 2.67 × | 2.55 × | 2.28 × |
| | | 1.41 × | 9.89 × | 1.21 × | 1.60 × | 3.89 × |
| | | 1.33 × | 1.60 × | 0.0000 | 3.27 × | 3.27 × |
| | | 7.27 × | 9.12 × | 2.78 × | 2.05 × | 2.03 × |
| | | 8.75 × | 4.50 × | 7.87 × | 9.63 × | 1.76 × |
| | | 8.75 × | 5.24 × | 8.74 × | 8.76 × | 2.03 × |
| | | 6.08 × | 8.49 × | 0.0000 | 2.27 × | 2.27 × |
| | | 6.10 × | 1.62 × | 5.78 × | 6.41 × | 6.32 × |
| | | 5.41 × | 2.61 × | 2.81 × | 1.05 × | 1.02 × |
| | | 5.13 × | 2.76 × | 1.43 × | 1.10 × | 9.53 × |
Table 18.
Summary for statistics of , , and from electrical appliance data.
Table 18.
Summary for statistics of , , and from electrical appliance data.
| Sample | Par. | Mean | Mode | | | | St.D | Sk. |
|---|
| | 7.41 × | 6.02 × | 6.73 × | 7.41 × | 8.09 × | 9.98 × | 1.34 × |
| | | 3.92 × | 3.79 × | 3.85 × | 3.92 × | 3.99 × | 1.01 × | −6.51 × |
| | | 2.08 × | 1.89 × | 1.46 × | 2.04 × | 2.66 × | 8.71 × | 2.55 × |
| | | 5.56 × | 4.01 × | 4.90 × | 5.56 × | 6.20 × | 9.59 × | 2.66 × |
| | | 8.20 × | 8.19 × | 8.17 × | 8.20 × | 8.23 × | 4.87 × | 2.66 × |
| | | 1.73 × | 1.50 × | 1.57 × | 1.73 × | 1.89 × | 2.33 × | 9.83 × |
| | 3.68 × | 3.79 × | 3.61 × | 3.68 × | 3.75 × | 9.93 × | −1.63 × |
| | | 2.89 × | 2.88 × | 2.88 × | 2.89 × | 2.90 × | 1.00 × | 8.72 × |
| | | 1.41 × | 1.30 × | 1.34 × | 1.41 × | 1.48 × | 9.89 × | −7.92 × |
| | | 7.27 × | 1.00 × | 2.89 × | 6.10 × | 1.06 × | 5.52 × | 0.11 × |
| | | 8.75 × | 8.75 × | 8.74 × | 8.75 × | 8.75 × | 5.17 × | 7.81 × |
| | | 6.10 × | 6.12 × | 5.99 × | 6.10 × | 6.21 × | 1.61 × | −9.61 × |


