Abstract
To ensure the reliability and security of machine learning classification models when deployed in the open world, it is crucial that these models can detect out-of-distribution (OOD) data that exhibits semantic shifts from the in-distribution (ID) data used during training. This necessity has spurred extensive research on OOD detection. Previous methods required a large amount of finely labeled OOD data for model training, which is costly or performed poorly in open-world scenarios. To address these limitations, we propose a novel method named focus on important samples (FIS) in this paper. FIS leverages model-predicted OOD scores to identify and focus on important samples that are more beneficial for model training. By learning from these important samples, our method aims to achieve reliable OOD detection performance while reducing training costs and the risk of overfitting training data, thereby enabling the model to better distinguish between ID and OOD data. Extensive experiments across diverse OOD detection scenarios demonstrate that FIS achieves superior performance compared to existing approaches, highlighting its robust and efficient OOD detection performance in practical applications.
MSC:
68T07
1. Introduction
When machine learning models are deployed in open-world environments, they often encounter inputs from out-of-distribution (OOD) data, which exhibit semantic shifts from id-distribution (ID) data used during training [1,2,3]. It is imperative that models avoid making predictions on OOD data, especially in safety-critical domains [4,5], such as autonomous driving and medical diagnosis [6]. In these fields, making arbitrary predictions on OOD data can lead to catastrophic consequences. This concern has spurred significant research on OOD detection in the field of reliable machine learning in recent years [7,8,9,10,11,12].
OOD detection involves two main tasks: accurately predicting ID data and effectively detecting OOD data [10,13,14]. Existing methods can be broadly categorized into two types based on whether they introduce additional training data [15]. The first type trains a model using only ID data to achieve accurate classification and then employs post-processing methods based on model outputs to distinguish between ID and OOD data [16,17,18,19]. For example, [13,20] design scoring functions that better capture the distinct patterns of ID and OOD data, [15,18] use different distance metrics to differentiate ID and OOD data based on features extracted by the model, and [13,21,22] rely on gradient-based information to make this distinction. However, due to the lack of explicit OOD knowledge, these methods, despite theoretical guarantees, often fall short of achieving powerful OOD detection performance.
The second type of method uses additional auxiliary data to enhance the ability of the pre-trained model to detect OOD data. For instance, refs. [6,23] design various OOD data generation methods to create a diverse set of OOD data for model training, while others expand the coverage of OOD data through different methods to improve the ability of the model to detect OOD data [1,24]. These methods generally outperform the first category in OOD detection. However, these methods trend focus on acquiring more OOD data for training, with little attention paid to fully leveraging the potential of existing OOD data. Motivated by this gap, in this paper, we analyze the usefulness of different data for model training and propose a method that efficiently utilizes existing data to train the model.
In Section 3, we empirically demonstrate through experiments the significant variations in the impacts of different data samples on model training. Unlike classical active learning paradigms [25], which typically prioritize more challenging samples for training, our findings reveal that OOD data correctly classified by a pre-trained model are more beneficial for OOD detection training. Conversely, more difficult OOD samples are found to exert a negative influence on model training.
The samples that the model can confidently and correctly classify, which are referred to as easily distinguishable samples, play a pivotal role during fine-tuning. Consequently, a principled approach for OOD fine-tuning involves preferentially selecting such readily classifiable samples for training. Implementing this strategy necessitates developing a rigorous methodology to systematically assess and identify samples that exhibit higher distinguishability to the model.
Fortunately, prior research conducted by [1,26] has shown that pre-trained models exhibit inherent capabilities for OOD detection to a certain extent. Building on this insight, we can use the OOD scores predicted by pre-trained models to identify samples that it can correctly recognize samples based on a certain threshold. By fine-tuning the model using these important samples, we can enhance its OOD detection ability.
In Section 4, we design an efficient training algorithm named focus on important samples (FIS) that iteratively performs prediction and training, as illustrated in Figure 1. This iterative process enables the model to learn from key samples that are more conducive to training. Ultimately, this approach not only ensures accurate classification of ID data but also maximizes its capability to effectively identify OOD data.
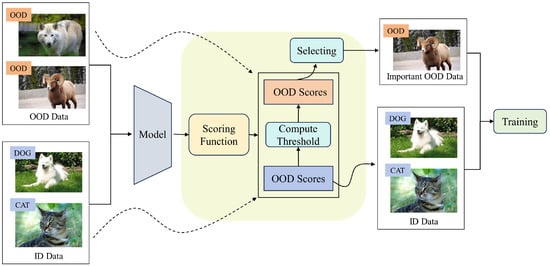
Figure 1.
An overview of our proposed method FIS. We first calculate the OOD scores for both ID and OOD data. Based on the OOD scores of the ID data, we determine a threshold that can correctly identify 95% of the ID data. We then select the OOD data with scores below this threshold to be used as the auxiliary OOD training data.
We conducted comprehensive and rigorous experiments across a variety of OOD detection scenarios. Consistently across all experimental settings, our method achieved superior OOD detection performance by using only a subset of the data, outperforming methods that utilized the entire dataset. This demonstrates the reliability of our proposed approach in practical applications. Furthermore, we performed extensive ablation studies, which confirmed the robustness of our method.
We summarize the main contributions of this paper as follows:
- We empirically analyzed the varying impacts of different data on model training through comparative experiments, demonstrating that samples that the model can correctly identify play a more critical role in the OOD detection fine-tuning stage.
- We proposed a highly efficient and targeted method for utilizing training data, which selects samples that are more beneficial to model training based on the OOD scores predicted by the model during the training process.
- Through extensive experiments, we validated the efficiency, reliability, and robustness of our proposed method, FIS, in OOD detection training.
The organization of this paper is as follows: in Section 2, we introduce and explain the key concepts and notations relevant to this study. In Section 3, we analyze the varying impacts of different data on model performance during the training process. In Section 4, we propose the FIS algorithm, which efficiently leverages data to optimize training performance. In Section 5, we conduct extensive experiments to validate the reliability and robustness of our method. Finally, in the last section, we conclude this paper.
2. Preliminary
In this section, we provide a comprehensive introduction to the key concepts relevant to this paper and explain the key notations.
We consider the multi-class classification task. Let and denote the input space and label space corresponding to the ID distribution, respectively. Then, denote as the ID distribution defined over , and is the OOD distribution. Let Y be a random variable from space , i.e., , and let be a random variable from unknown OOD label space. We have , which means that the ID sample and OOD sample have different label space [26]. Then, we can define the ID training data as follows:
Furthermore, the goal of OOD detection can be defined as follows:
Definition 1
(OOD Detection [26]). OOD detection primarily accomplishes two tasks: (a) correctly classifying ID samples and (b) enabling the model to detect OOD samples that may be encountered during the inference phase.
These two goals are achieved through the design of different OOD scoring functions. We present the formal definition of the OOD scoring function as follows:
Definition 2
(OOD Scoring Function [1]). With a pre-trained classifier , the OOD scoring function maps the input to a value, i.e., , such that the input data can be classified as ID or OOD data via a level-set estimation, i.e.,
where is the binary decision between ID and OOD, and λ is a pre-defined parameter.
Existing approaches leverage pre-trained classifiers and utilize the information from logit outputs [10,13,16,17,27,28,29], embedding features [15,18,30,31,32,33,34], or gradient information [13,21,22] to devise various OOD scoring functions. Recent research has focused on employing non-parametric methods to design efficient scoring functions [18]. To facilitate better understanding and ease the exposition in subsequent sections, we provide two commonly used OOD scoring functions below.
Maximum Softmax Prediction (MSP): This is a widely known baseline proposed by [10] that employs the maximum value from the softmax output distribution as an indicator for OOD detection, with the scoring function provided in the following:
where indicates the j-th softmax output. In an ideal scenario, OOD data should not correspond to any specific class in the predictions, resulting in uniformly low softmax values across all dimensions. However, in practice, MSP is prone to errors due to the widely known problem of overconfident predictions [10,16].
MaxLogit Prediction (MLP): Ref. [35] proposed an enhanced approach to MSP by utilizing maximal logits rather than softmax probabilities for constructing the scoring function, namely,
where represents the j-th dimension of the model output vector. Empirical results demonstrate that the MLP score outperforms MSP, particularly in scenarios with large ID label spaces, making it a prevalent choice in practical applications.
Building on these scoring functions, [36] proposed using additional auxiliary OOD data to fine-tune models, a method widely known as outlier exposure (OE). This innovative approach allows models to learn from OOD data and has demonstrated strong performance. Since then, numerous studies have been based on OE. Our method is also grounded in OE, and we provide the classic definition of OE below.
Outlier Exposure (OE): [36]. Given the ID training data and the additional auxiliary OOD data set , we defined the following:
where is the auxiliary OOD distribution. We use instead of because the auxiliary OOD distribution may not perfectly match the true OOD distribution [24]. Then, OE aims to fine-tune the model to enhance its ability to detect OOD samples. Specifically, the training is processed by minimizing the following empirical risk:
where improves the model ability to classify ID data, which can be written as follows:
and enhances the model’s ability to detect OOD data, which can be written as follows:
OE-based methods allow models to be further fine-tuned, thereby exhibiting more powerful OOD detection performance [16,36,37]. Accordingly, various studies have designed more efficient fine-tuning approaches from different perspectives, such as sampling strategies [37,38,39], adversarial robust learning [15,38,40], meta-learning [41,42], and regularization strategies [43]. Some research has also explored various outlier synthesis strategies when OOD data are difficult to obtain [6,23,44]. Although outlier exposure often yields positive results, the discrepancy between auxiliary data and real OOD data largely limits their effectiveness in real-world detection. In recent studies, [1,24] investigated using data generation to expand the coverage of auxiliary OOD data to reduce the gap between distributions and achieve better performance. Unlike previous methods that aimed to obtain more data, our approach focuses on screening a small amount of data that are more important for OOD detection training, allowing the OOD data to fine-tune the model. Based on the above discussion, this paper primarily addresses the following problem.
Problem Setup: Previous methods either exhibit suboptimal performance or require a large amount of additional OOD data to assist model training, which can be highly resource-intensive, especially in large-scale complex systems or when dealing with massive datasets [39,45]. The primary challenge addressed in this paper is how to fully leverage available data to train the model efficiently. To achieve this, we need to tackle two key questions: first, which data are more important for model training? Second, how can we identify and locate these important data? We will address these two questions in the subsequent sections.
3. Data Importance Analysis
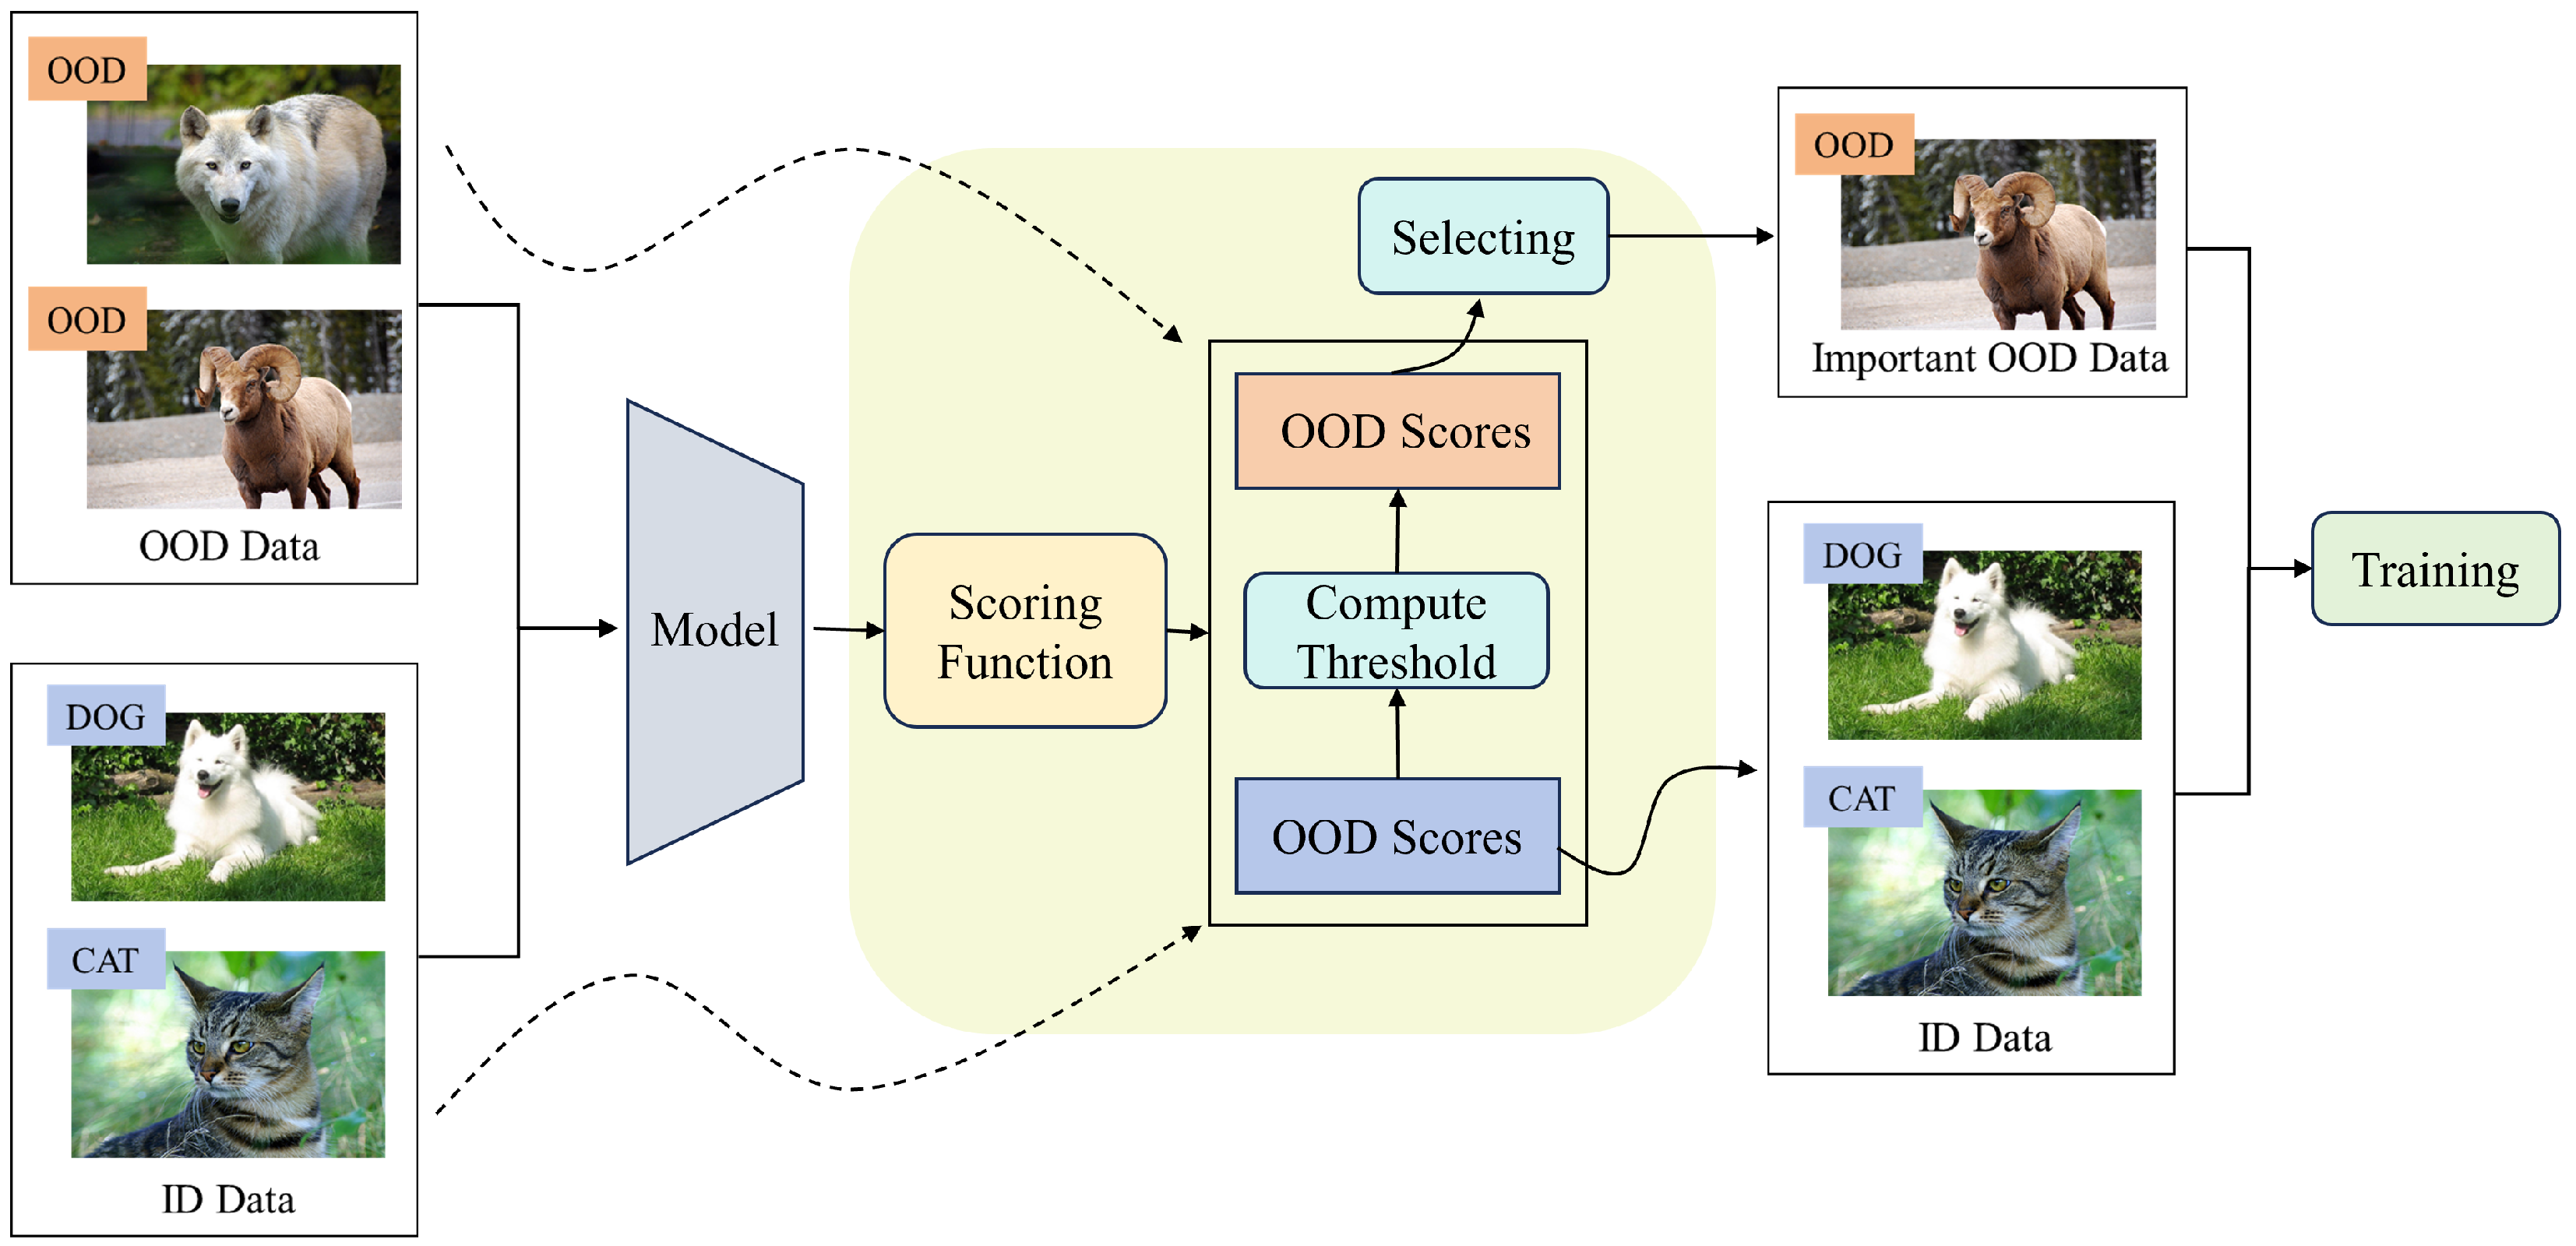
In this section, we conduct experiments using CIFAR-100 as ID data, Tiny-ImageNet-200 as auxiliary OOD data, and Textures as the test OOD dataset to systematically analyze which types of data are most beneficial for OOD detection training. The main results are summarized in Figure 2.

Figure 2.
The experimental results to analyze which data are more important for OOD detection training, where denotes training using a complete set of OOD samples, represents training exclusively with OOD samples that were correctly identified by the pre-trained model, and indicates training solely with OOD samples that were misclassified by the pre-trained model. (a) Temporal evolution of the FPR95 (false positive rate at 95% true positive rate) metric during the training process. (b) Final comparative performance evaluation across different training regimes.
Given that the FPR95 metric is optimized by lower values, our experimental findings reveal an intriguing phenomenon: when training with more challenging OOD data, the training performance begins to deteriorate after several iterations. Conversely, when utilizing OOD data that the pre-trained model can correctly detect, the model converges more rapidly than when using all OOD data for training. The final results further indicate that training with the most difficult OOD data yields the poorest performance, whereas training exclusively with OOD data that the pre-trained model can correctly detect outperforms training with all auxiliary OOD data.
We conduct further experiments to fine-tune the model using as auxiliary OOD data. Meanwhile, is employed as OOD data for testing to evaluate the OOD detection performance. The selected dataset sizes are as follows: contains 29,275 samples, and contains 37,575 samples, resulting in a ratio of to of approximately 1.28:1. The results are presented in Table 1. It can be observed that fine-tuning the model using the entire OOD dataset yields nearly identical performance compared to fine-tuning using only . Moreover, the time required for fine-tuning with is less than half of that required when using . It is important to note that encompasses the portion of the data, whereas does not include .

Table 1.
Comparison of the OOD detection performance when serves as test OOD data. The results are expressed as percentages. indicates larger or smaller values are preferred.
We can infer from these observations that among the auxiliary OOD data, the samples that are more beneficial for model training are those relatively simple OOD instances that the pre-trained classifier can accurately detect. This is likely because these correctly detected OOD data possess more distinctive features compared to ID data, enabling the model to benefit from learning these patterns. In contrast, the OOD data that the model fails to detect exhibit lower distinguishability from ID data, thereby potentially impairing the ability of the model to learn to differentiate between ID and OOD data.
Therefore, it is sufficient to identify and utilize simpler OOD data that the pre-trained model can accurately distinguish for training purposes. We will subsequently propose a specific algorithm to achieve this.
4. Methodology
Based on the analysis presented in Section 3, we now introduce a specific training algorithm in this section. The detailed procedure of the algorithm is summarized in Algorithm 1.
We first evaluate the ID data to determine the OOD score threshold that correctly identifies 95% of the ID samples, i.e.,
We subsequently evaluate the auxiliary OOD data to identify samples with OOD scores lower than the threshold . These samples are selected as the auxiliary data for the training process, which can be formally formulated as follows:
In practical implementations, it is often not necessary to employ the entire dataset . Specifically, we can sort the data within based on their corresponding OOD scores in ascending order and then select a subset from the top, such as the top 10% of the data. This approach can significantly reduce computational costs. The experimental results presented in the following chapter demonstrate that even with the use of only the top 10% of the data, it is possible to achieve commendable performance levels.
| Algorithm 1. FIS: Focus on Important Samples. |
| Require: The ID training dataset ; the auxiliary OOD dataset ; the pre-trained classifier ; the trade-off parameters . Ensure: The OOD detector .
|
During training, we follow the same approach as OE, minimizing the empirical risk , where we employ the multi-class cross-entropy loss as , and adopt the loss function used in the classic OE method as , i.e., the cross-entropy from the model output distribution to the uniform distribution.
5. Results
In this section, we evaluate the performance of our proposed method, FIS, across various OOD detection scenarios. The experimental outcomes consistently demonstrate the superior efficacy of FIS.
5.1. Experiment Setup
We begin by detailing our experimental setup.
Datasets:
- ID datasets: CIFAR-10 [46] and CIFAR-100 [46].
- OOD datasets: SVHN [47], Places365 [48], LSUN-Resize [49], Tiny-ImageNet-200 [50], TinyImage-300k [36], LSUN-Crop [49], and Textures [51].
Metrics:
- FPR95: False positive rate at 95% true positive rate.
- AUROC: The area under the receiver operating characteristic curve.
- ID ACC.: The classification accuracy on ID data.
Baselines:
- Post-hoc methods: GODIN [52], MSP [10], ReAct [17], Energy [16], Mahalanobis [15], MaxLogit [35], ODIN [13], KNN [18], DICE [53], Gram [30], GradNorm [21], ViM [31], and ASH [54].
- Fine-tuning methods: OE [36], CSI [55], SSD+ [56], MixOE [57], LogitNorm [58], MOS [29], ATOM [39], and VOS [6].
Backbones: We employ the Wide-ResNet-40-2 [59] as the backbone network for the main experiments. We conduct an ablation study by employing ResNet-18 [60].
Training Details: We train the model using stochastic gradient descent [61] and set the epoch to be 10, the initial learning rate to be 0.001 with cosine decay [62], and the batch size to be 128 for both ID and auxiliary training OOD data. We utilize the MLP score as the OOD score to identify important OOD data and to evaluate OOD detection performance. The selection strategy can be adjusted based on the type of auxiliary OOD data employed. By default, the selection strategy involves using OOD scoring to identify auxiliary OOD data prior to training. We will further elaborate on this in the subsequent discussion.
5.2. Main Results
CIFAR Benckmarks: The results on CIFAR benchmarks with auxiliary OOD data Tiny-ImageNet-200 are presented in Table 2 and Table 3, where FIS outperforms all other approaches, thereby demonstrating its reliability and superiority. We highlight two key points: firstly, FIS employs only a small amount of auxiliary OOD data, indicating that more training data do not necessarily lead to better performance. The use of a limited yet more helpful and relevant subset of data can achieve performance comparable to, or even surpass, that of using a larger dataset. Secondly, while enhancing the OOD detection capabilities of the model, FIS also maintains high classification accuracy on ID data. This is attributable to the fact that the auxiliary OOD data we use possess more distinguishable features compared to ID data, thus not interfering with the training of ID tasks.
Table 2.
Comparison between FIS and advanced methods on the CIFAR-10 benchmark. indicates larger or smaller values are preferred. Results are percentages. Bold font indicates the best results in a column.
Table 3.
Comparison between FIS and advanced methods on the CIFAR-100 benchmark. indicates larger or smaller values are preferred. Results are percentages. Bold font indicates the best results in a column.
Near-OOD Setups: To assess the performance of our method under more challenging near-OOD detection scenarios, we conduct experiments using CIFAR-10 as the ID data, Tiny-ImageNet-200 as the auxiliary OOD data, and CIFAR-100 as the test OOD data. The experimental results are detailed in Table 4. Our method once again demonstrates superiority over alternative approaches, thereby validating its robustness and reliability under extreme conditions. This is due to the same rationale: the auxiliary OOD data selected by our method exhibit more distinguishable features compared to ID data, which enables the model to more effectively learn to differentiate between ID and OOD data.
Table 4.
Comparison between FIS and advanced methods on the challenging near-OOD setting. indicates larger or smaller values are preferred. Bold font indicates the best results in a column.
Backbones: To evaluate the performance of our approach on different models, we conducted an ablation study using ResNet-18 as the backbone network with CIFAR-10 as the ID data and Textures as the test OOD data. The results of these experiments are presented in Table 5. The findings indicate that our method maintains an advantage when ResNet-18 serves as the model architecture, thereby substantiating the robustness of our approach across different model configurations.
Table 5.
Comparison between FIS and advanced methods on the CIFAR-10 benchmark when ResNet-18 serves as the backbone network. indicates larger or smaller values are preferred. Bold font indicates the best results in a column.
Scores: The main idea of our method is to select important data from an auxiliary OOD dataset that are more conducive to OOD detection training. Although our previous experiments were conducted based on the MLP score, our new approach is not limited to this particular OOD score. To further explore our idea, we conducted experiments using different OOD scores on two CIFAR benchmarks. The results are depicted in Table 6, where Places365 serves as the test OOD data. Across both ID datasets, employing the MLP, MSP, and energy scores to filter more critical OOD detection data yielded better performance than using the entire dataset. It is noteworthy that our method is agnostic to the scoring function; different scoring functions produced consistent outcomes.
Table 6.
The experimental results across OOD scores. The results are expressed as percentages. indicates larger or smaller values are preferred.
Additionally, the scoring function used for data selection can differ from the one used during the testing phase, as demonstrated by the experimental results shown in Table 7. The MSP+MLP results, which used the MSP score for data selection and the MLP score for testing, not only outperformed the outcomes from using all OOD data but also surpassed those from using the MLP score for both data selection and testing. This indicates that the data selection and training processes are distinct from each other; data selection is solely intended to identify data that are more beneficial for model training.
Table 7.
The results using different scoring for selecting auxiliary OOD data and for testing. indicates larger or smaller values are preferred.
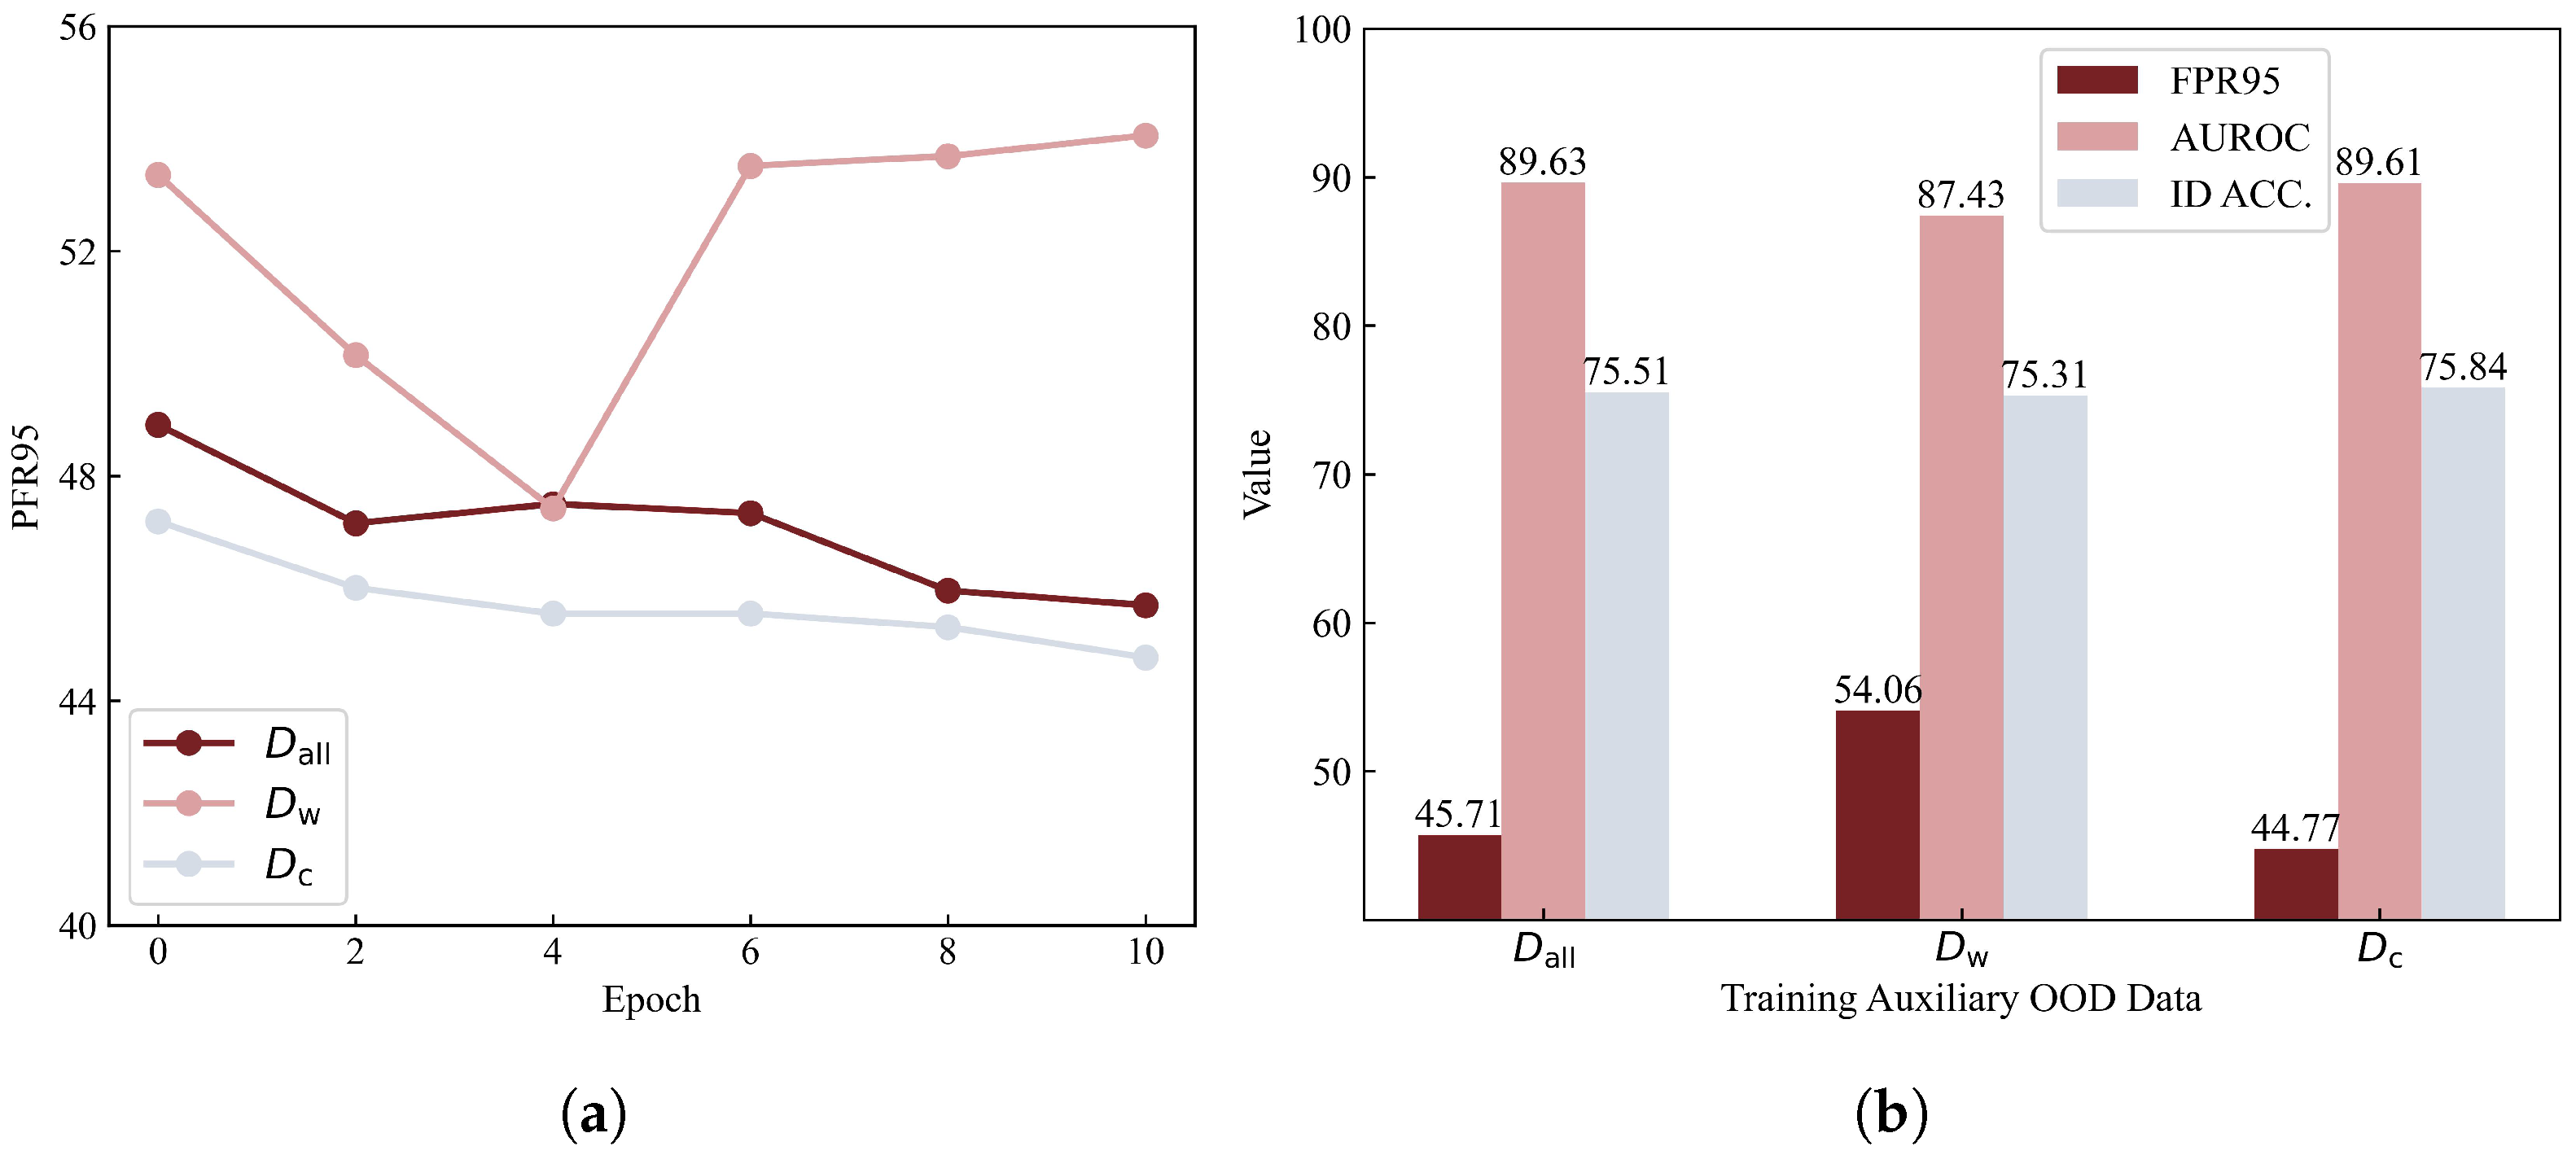
Ablation Study on Parameter : We conducted the ablation study on the parameter . The experimental results are summarized in Figure 3a, with CIFAR-10 as the ID data, TinyImage-300k as the auxiliary OOD data, and Places365 as the test OOD data. As observed, the training time cost decreased with an increase in , while the OOD detection performance also varied accordingly. Our default setting of was chosen to minimize the training cost. However, if enhanced OOD detection performance is desired, the value of can be further adjusted, for example, to 0.7 or 0.8.

Figure 3.
(a) The ablation study on the parameter . (b) The experimental results of significance tests. The *** indicates that the p-value of the paired-sample t-test is less than 0.001.
Significance Test: To further substantiate that the advantages of our method are not attributable to random factors, we conducted additional significance analyses. To draw statistically robust conclusions, multiple replicates of the experiments were essential. Therefore, we focused on comparing our method with two closest-performing methods, OE and ATOM. The experimental setup mirrored that used in the CIFAR-10 benchmark. The experimental results are presented in Figure 3b, where each method was subjected to 30 independent replicates. We employed the paired-sample t-test to evaluate the statistical significance of the results. The results demonstrate that our method significantly outperforms the others, thereby validating its effectiveness.
Cost Evaluation: We conducted further experiments to compare the time–cost required by our method and other methods. The results are presented in Table 8. It can be observed that the time required for fine-tuning the model using the comparison methods was more than twice that of our method. This demonstrates that our method achieves excellent OOD detection performance while significantly reducing the training cost.
Table 8.
Comparison of time–cost between FIS and advanced methods.
Selection Strategy: We also conducted further ablation studies on our selection strategy. The results are presented in Table 9, where CIFAR-10 serves as the ID dataset. Tiny-ImageNet-200 contained 70,000 training samples, while TinyImage-300k was a more complex dataset with 300,000 training samples. For the relatively simpler auxiliary OOD dataset, more frequent selections can lead to increasingly refined choices, which may cause overfitting of the model. In contrast, for more challenging and complex datasets, more frequent data selection during training is beneficial. Therefore, the strategy for selecting auxiliary OOD data is dependent on the characteristics of existing datasets.
Table 9.
Ablation study on the selection strategy. indicates larger or smaller values are preferred.
5.3. Discussion
Here, we summarize the strengths and limitations of our method. Strengths: (a) Our method can train the model using a smaller subset of data that is more beneficial for training, thereby reducing the training cost. (b) Since the selected data are more advantageous for OOD detection fine-tuning, our method achieves better performance compared to other approaches. (c) Our method allows the use of different OOD scoring functions for data selection rather than being restricted to a single OOD scoring function, thus providing flexibility in adjustment. Limitations: (a) Although our method uses a smaller and more beneficial dataset for training, similar to other methods that employ auxiliary OOD data, it still requires the initial collection of a pool of auxiliary OOD data for selection purposes. (b) For simpler datasets, overly frequent data selection may pose a risk of overfitting.
6. Conclusions
In this paper, we conducted experimental analyses to identify data that are more beneficial for OOD detection training. We found that OOD data correctly detected by a well-trained classifier are more advantageous. This is because they possess features that are more distinguishable from ID data. As a result, they can help the model learn to differentiate between ID and OOD data without negatively impacting the classification learning of ID data. Furthermore, fine-tuning the model using only a small subset of the most beneficial data reduces the training cost. Based on these findings, we proposed a method called FIS, which uses OOD scores to select training data from OOD datasets. Our extensive experiments demonstrated the reliability and superiority of FIS. We believe our work will provide valuable insights for future research in the field of OOD detection.
Author Contributions
Conceptualization, Z.H.; Methodology, Z.H.; Validation, G.S.; Formal analysis, Z.H.; Investigation, G.W.; Data curation, Y.Z.; Writing—original draft, J.W.; Writing—review and editing, Z.H.; visualization, J.W. All authors have read and agreed to the published version of the manuscript.
Funding
This research was funded by the National Natural Science Foundation of China grant number 62376282.
Data Availability Statement
All data utilized in this study were sourced from publicly available datasets, and the methods for data acquisition are detailed in the cited articles.
Conflicts of Interest
The authors declare no conflicts of interest. The funders had no role in the design of the study; in the collection, analyses, or interpretation of data; in the writing of the manuscript. The decision to publish the results was made by the authors with the consent of the funders.
References
- Wang, Q.; Ye, J.; Liu, F.; Dai, Q.; Kalander, M.; Liu, T.; Hao, J.; Han, B. Out-of-distribution detection with implicit outlier transformation. In Proceedings of the ICLR, Kigali, Rwanda, 1–5 May 2023. [Google Scholar]
- Ataeiasad, F.; Elizondo, D.; Ramírez, S.C.; Greenfield, S.; Deka, L. Out-of-Distribution Detection with Memory-Augmented Variational Autoencoder. Mathematics 2024, 12, 3153. [Google Scholar] [CrossRef]
- Qiao, J.; Zhong, C.; Zhu, P.; Tang, K. Advscod: Bayesian-based out-of-distribution detection via curvature sketching and adversarial sample enrichment. Mathematics 2023, 11, 692. [Google Scholar] [CrossRef]
- Ramachandra, B.; Jones, M.J.; Vatsavai, R.R. A Survey of Single-Scene Video Anomaly Detection. IEEE Trans. Pattern Anal. Mach. Intell. 2022, 44, 2293–2312. [Google Scholar] [CrossRef] [PubMed]
- Lan, L.; Teng, X.; Zhang, J.; Zhang, X.; Tao, D. Learning to purification for unsupervised person re-identification. IEEE Trans. Image Process. 2023, 32, 3338–3353. [Google Scholar] [CrossRef]
- Du, X.; Wang, Z.; Cai, M.; Li, Y. VOS: Learning What You Don’t Know by Virtual Outlier Synthesis. In Proceedings of the ICLR, Online, 25–29 April 2022. [Google Scholar]
- Li, F.; Wang, Y.; Du, X.; Li, X.; Yu, G. Out-of-Distribution Node Detection Based on Graph Heat Kernel Diffusion. Mathematics 2024, 12, 2942. [Google Scholar] [CrossRef]
- Yang, J.; Zhou, K.; Li, Y.; Liu, Z. Generalized out-of-distribution detection: A survey. arXiv 2021, arXiv:2110.11334. [Google Scholar] [CrossRef]
- Barz, B.; Rodner, E.; Garcia, Y.G.; Denzler, J. Detecting Regions of Maximal Divergence for Spatio-Temporal Anomaly Detection. IEEE Trans. Pattern Anal. Mach. Intell. 2019, 41, 1088–1101. [Google Scholar] [CrossRef]
- Hendrycks, D.; Gimpel, K. A baseline for detecting misclassified and out-of-distribution examples in neural networks. In Proceedings of the ICLR, Toulon, France, 24–26 April 2017. [Google Scholar]
- Jeong, J.; Lee, M.; Yun, S.; Han, K.; Kim, J. RODA-OOD: Robust Domain Adaptation from Out-of-Distribution Data. Mathematics 2024, 12, 3895. [Google Scholar] [CrossRef]
- Qian, X.; Gao, S.; Deng, W.; Wang, W. Improving oriented object detection by scene classification and task-aligned focal loss. Mathematics 2024, 12, 1343. [Google Scholar] [CrossRef]
- Liang, S.; Li, Y.; Srikant, R. Enhancing The Reliability of Out-of-distribution Image Detection in Neural Networks. In Proceedings of the ICLR, Vancouver, BC, Canada, 30 April–3 May 2018. [Google Scholar]
- Li, S.; Li, N.; Jing, M.; Ji, C.; Cheng, L. Evaluation of Ten Deep-Learning-Based Out-of-Distribution Detection Methods for Remote Sensing Image Scene Classification. Remote Sens. 2024, 16, 1501. [Google Scholar] [CrossRef]
- Lee, K.; Lee, K.; Lee, H.; Shin, J. A Simple Unified Framework for Detecting Out-of-Distribution Samples and Adversarial Attacks. In Proceedings of the NeurIPS, Montréal, QC, Canada, 3–8 December 2018. [Google Scholar]
- Liu, W.; Wang, X.; Owens, J.D.; Li, Y. Energy-based out-of-distribution detection. In Proceedings of the NeurIPS, Online, 6–12 December 2020. [Google Scholar]
- Sun, Y.; Guo, C.; Li, Y. React: Out-of-distribution Detection with Rectified Activations. In Proceedings of the NeurIPS, Virtual, 6–14 December 2021. [Google Scholar]
- Sun, Y.; Ming, Y.; Zhu, X.; Li, Y. Out-of-Distribution Detection with Deep Nearest Neighbors. In Proceedings of the ICML, Baltimore, MD, USA, 17–23 July 2022. [Google Scholar]
- Blouvshtein, L.; Cohen-Or, D. Outlier Detection for Robust Multi-Dimensional Scaling. IEEE Trans. Pattern Anal. Mach. Intell. 2019, 41, 2273–2279. [Google Scholar] [CrossRef] [PubMed]
- Bendale, A.; Boult, T.E. Towards Open Set Deep Networks. In Proceedings of the CVPR, Las Vegas, NV, USA, 27–30 June 2016. [Google Scholar]
- Huang, R.; Geng, A.; Li, Y. On the Importance of Gradients for Detecting Distributional Shifts in the Wild. In Proceedings of the NeurIPS, Virtual, 6–14 December 2021. [Google Scholar]
- Igoe, C.; Chung, Y.; Char, I.; Schneider, J. How Useful are Gradients for OOD Detection Really? arXiv 2022, arXiv:2205.10439. [Google Scholar]
- Lee, K.; Lee, H.; Lee, K.; Shin, J. Training Confidence-calibrated Classifiers for Detecting Out-of-distribution Samples. In Proceedings of the ICLR, Vancouver, BC, Canada, 30 April–3 May 2018. [Google Scholar]
- Wang, Q.; Fang, Z.; Zhang, Y.; Liu, F.; Li, Y.; Han, B. Learning to augment distributions for out-of-distribution detection. Adv. Neural Inf. Process. Syst. 2023, 36, 73274–73286. [Google Scholar]
- Teng, X.; Lan, L.; Zhao, J.; Li, X.; Tang, Y. Highly efficient active learning with tracklet-aware co-cooperative annotators for person re-identification. IEEE Trans. Neural Netw. Learn. Syst. 2023, 35, 15687–15700. [Google Scholar] [CrossRef] [PubMed]
- Fang, Z.; Li, Y.; Lu, J.; Dong, J.; Han, B.; Liu, F. Is Out-of-Distribution Detection Learnable? arXiv 2022, arXiv:2210.14707. [Google Scholar]
- Wang, H.; Liu, W.; Bocchieri, A.; Li, Y. Can Multi-label Classification Networks Know What They Don’t Know? In Proceedings of the NeurIPS, Virtual, 6–14 December 2021. [Google Scholar]
- Lakshminarayanan, B.; Pritzel, A.; Blundell, C. Simple and scalable predictive uncertainty estimation using deep ensembles. In Proceedings of the NeurIPS, Long Beach, CA, USA, 4–9 December 2017. [Google Scholar]
- Huang, R.; Li, Y. Mos: Towards scaling out-of-distribution detection for large semantic space. In Proceedings of the IEEE/CVF Conference on Computer Vision and Pattern Recognition, Nashville, TN, USA, 20–25 June 2021; pp. 8710–8719. [Google Scholar]
- Sastry, C.S.; Oore, S. Detecting out-of-distribution examples with gram matrices. In Proceedings of the International Conference on Machine Learning, PMLR, Virtual Event, 13–18 July 2020; pp. 8491–8501. [Google Scholar]
- Wang, H.; Li, Z.; Feng, L.; Zhang, W. ViM: Out-Of-Distribution with Virtual-logit Matching. In Proceedings of the CVPR, New Orleans, LA, USA, 18–24 June 2022. [Google Scholar]
- Lin, Z.; Roy, S.D.; Li, Y. Mood: Multi-level out-of-distribution detection. In Proceedings of the CVPR, Nashville, TN, USA, 20–25 June 2021. [Google Scholar]
- Morteza, P.; Li, Y. Provable guarantees for understanding out-of-distribution detection. In Proceedings of the AAAI, Online, 22 February–1 March 2022. [Google Scholar]
- Luo, Y.; Wang, Z.; Huang, Z.; Baktashmotlagh, M. Progressive graph learning for open-set domain adaptation. In Proceedings of the International Conference on Machine Learning, PMLR, Virtual Event, 13–18 July 2020; pp. 6468–6478. [Google Scholar]
- Hendrycks, D.; Basart, S.; Mazeika, M.; Mostajabi, M.; Steinhardt, J.; Song, D. Scaling out-of-distribution detection for real-world settings. In Proceedings of the ICML, Baltimore, MD, USA, 17–23 July 2022. [Google Scholar]
- Hendrycks, D.; Mazeika, M.; Dietterich, T.G. Deep Anomaly Detection with Outlier Exposure. In Proceedings of the ICLR, New Orleans, LA, USA, 6–9 May 2019. [Google Scholar]
- Ming, Y.; Fan, Y.; Li, Y. Poem: Out-of-distribution detection with posterior sampling. In Proceedings of the International Conference on Machine Learning, PMLR, Online, 28 November–9 December 2022; pp. 15650–15665. [Google Scholar]
- Li, Y.; Vasconcelos, N. Background data resampling for outlier-aware classification. In Proceedings of the CVPR, Seattle, WA, USA, 13–19 June 2020. [Google Scholar]
- Chen, J.; Li, Y.; Wu, X.; Liang, Y.; Jha, S. Atom: Robustifying out-of-distribution detection using outlier mining. In Proceedings of the ECML, Bilbao, Spain, 13–17 September 2021. [Google Scholar]
- Hein, M.; Andriushchenko, M.; Bitterwolf, J. Why ReLU Networks Yield High-Confidence Predictions Far Away From the Training Data and How to Mitigate the Problem. In Proceedings of the CVPR, Long Beach, CA, USA, 15–20 June 2019. [Google Scholar]
- Jeong, T.; Kim, H. OOD-MAML: Meta-learning for few-shot out-of-distribution detection and classification. NeurIPS 2020, 33, 3907–3916. [Google Scholar]
- Katz-Samuels, J.; Nakhleh, J.B.; Nowak, R.; Li, Y. Training ood detectors in their natural habitats. In Proceedings of the ICML, Baltimore, MD, USA, 17–23 July 2022. [Google Scholar]
- Van Amersfoort, J.; Smith, L.; Teh, Y.W.; Gal, Y. Uncertainty estimation using a single deep deterministic neural network. In Proceedings of the ICML, Virtual Event, 13–18 July 2020. [Google Scholar]
- Vernekar, S.; Gaurav, A.; Abdelzad, V.; Denouden, T.; Salay, R.; Czarnecki, K. Out-of-distribution detection in classifiers via generation. arXiv 2019, arXiv:1910.04241. [Google Scholar]
- Bitterwolf, J.; Meinke, A.; Augustin, M.; Hein, M. Breaking Down Out-of-Distribution Detection: Many Methods Based on OOD Training Data Estimate a Combination of the Same Core Quantities. In Proceedings of the ICML, Baltimore, MD, USA, 17–23 July 2022. [Google Scholar]
- Krizhevsky, A.; Hinton, G. Learning Multiple Layers of Features from Tiny Images; Technical Report TR-2009; University of Toronto: Toronto, ON, Canada, 2009. [Google Scholar]
- Netzer, Y.; Wang, T.; Coates, A.; Bissacco, A.; Wu, B.; Ng, A.Y. Reading digits in natural images with unsupervised feature learning. In Proceedings of the NeurIPS Workshop on Deep Learning and Unsupervised Feature Learning, Virtual, 6–14 December 2011. [Google Scholar]
- Zhou, B.; Lapedriza, À.; Khosla, A.; Oliva, A.; Torralba, A. Places: A 10 Million Image Database for Scene Recognition. IEEE Trans. Pattern Anal. Mach. Intell. 2018, 40, 1452–1464. [Google Scholar] [CrossRef]
- Yu, F.; Seff, A.; Zhang, Y.; Song, S.; Funkhouser, T.; Xiao, J. Lsun: Construction of a large-scale image dataset using deep learning with humans in the loop. arXiv 2015, arXiv:1506.03365. [Google Scholar]
- Le, Y.; Yang, X. Tiny imagenet visual recognition challenge. CS 231N 2015, 7, 3. [Google Scholar]
- Cimpoi, M.; Maji, S.; Kokkinos, I.; Mohamed, S.; Vedaldi, A. Describing Textures in the Wild. In Proceedings of the CVPR, Columbus, OH, USA, 23–28 June 2014. [Google Scholar]
- Hsu, Y.C.; Shen, Y.; Jin, H.; Kira, Z. Generalized odin: Detecting out-of-distribution image without learning from out-of-distribution data. In Proceedings of the IEEE/CVF Conference on Computer Vision and Pattern Recognition, Seattle, WA, USA, 13–19 June 2020; pp. 10951–10960. [Google Scholar]
- Sun, Y.; Li, Y. Dice: Leveraging sparsification for out-of-distribution detection. In Proceedings of the European Conference on Computer Vision, Tel Aviv, Israel, 23–27 October 2022; Springer: Berlin/Heidelberg, Germany, 2022; pp. 691–708. [Google Scholar]
- Djurisic, A.; Bozanic, N.; Ashok, A.; Liu, R. Extremely simple activation shaping for out-of-distribution detection. arXiv 2022, arXiv:2209.09858. [Google Scholar]
- Tack, J.; Mo, S.; Jeong, J.; Shin, J. CSI: Novelty Detection via Contrastive Learning on Distributionally Shifted Instances. In Proceedings of the NeurIPS, Online, 6–12 December 2020. [Google Scholar]
- Sehwag, V.; Chiang, M.; Mittal, P. SSD: A Unified Framework for Self-Supervised Outlier Detection. In Proceedings of the ICLR, Virtual Event, 3–7 May 2021. [Google Scholar]
- Zhang, J.; Inkawhich, N.; Linderman, R.; Chen, Y.; Li, H. Mixture outlier exposure: Towards out-of-distribution detection in fine-grained environments. In Proceedings of the IEEE/CVF Winter Conference on Applications of Computer Vision, Waikoloa, HI, USA, 2–7 January 2023; pp. 5531–5540. [Google Scholar]
- Wei, H.; Xie, R.; Cheng, H.; Feng, L.; An, B.; Li, Y. Mitigating neural network overconfidence with logit normalization. In Proceedings of the International Conference on Machine Learning, PMLR, Online, 28 November–9 December 2022; pp. 23631–23644. [Google Scholar]
- Zagoruyko, S.; Komodakis, N. Wide Residual Networks. In Proceedings of the BMVC, York, UK, 19–22 September 2016. [Google Scholar]
- He, K.; Zhang, X.; Ren, S.; Sun, J. Deep residual learning for image recognition. In Proceedings of the CVPR, Las Vegas, NV, USA, 27–30 June 2016. [Google Scholar]
- Duchi, J.; Hazan, E.; Singer, Y. Adaptive subgradient methods for online learning and stochastic optimization. J. Mach. Learn. Res. 2011, 12, 2121–2159. [Google Scholar]
- Loshchilov, I.; Hutter, F. SGDR: Stochastic Gradient Descent with Warm Restarts. In Proceedings of the ICLR, Toulon, France, 24–26 April 2017. [Google Scholar]
Disclaimer/Publisher’s Note: The statements, opinions and data contained in all publications are solely those of the individual author(s) and contributor(s) and not of MDPI and/or the editor(s). MDPI and/or the editor(s) disclaim responsibility for any injury to people or property resulting from any ideas, methods, instructions or products referred to in the content. |
© 2025 by the authors. Licensee MDPI, Basel, Switzerland. This article is an open access article distributed under the terms and conditions of the Creative Commons Attribution (CC BY) license (https://creativecommons.org/licenses/by/4.0/).