Article

Risk Assessment Method of Railway Engineering Technology Innovation in Complex Areas

1
National Key Laboratory of High Speed Railway Track System, China Academy of Railway Sciences Corporation Limited, Beijing 100081, China
2
Railway Engineering Research Institute, China Academy of Railway Sciences Corporation Limited, Beijing 100081, China
3
China Academy of Railway Sciences Corporation Limited, Beijing 100081, China
4
School of Urban Economics and Management, Beijing University of Civil Engineering and Architecture, Beijing 102616, China
5
School of Civil Engineering, Central South University, Changsha 410075, China
*
Authors to whom correspondence should be addressed.
Mathematics 2025, 13(12), 1970; https://doi.org/10.3390/math13121970
Submission received: 10 April 2025 / Revised: 12 May 2025 / Accepted: 11 June 2025 / Published: 14 June 2025

Abstract

:
Extreme climatic conditions and active geological factors posed challenges in evaluating disaster risk trends in railway construction projects and identifying key influencing factors. Traditional technology is difficult to adapt to the exploration and unknown construction process of railway engineering in complex and difficult areas. Therefore, there is an urgent need for technological innovation. The study used the Vague set theory method to screen and determine a list of risk factors for railway engineering technology innovation in complex areas, including 5 primary risk indicators and 26 secondary risk indicators. Based on this, an evaluation system for risk factors of railway engineering technology innovation in complex areas was established. Secondly, this study combined the Analytic Hierarchy Process (AHP) and Entropy Weight Method (EWM) with a cloud model to comprehensively evaluate risks and create cloud maps. Based on the calculation results, the risk level of railway engineering technology innovation risk factors in complex areas is obtained as environmental factors > technological factors > social factors > management factors > resource factors. The “combination weighting-cloud model” framework adopted in this study effectively overcomes the problem of insufficient representation of traditional single weighting method by integrating subjective and objective weight optimization and dynamic risk coupling analysis and significantly improves the multidimensional adaptability and dynamic evaluation accuracy.

1. Introduction

The railway is the core power source and key infrastructure of the national economic and social development, bearing an important livelihood mission. However, the railway network layout of China’s railway construction is not perfect, and the regional layout is uneven, especially the sparse railway network in the central and western regions, which seriously restricts the local social and economic development [1]. Therefore, it is necessary to speed up the railway construction in the central and western regions, further expand the coverage of the road network, and transfer to the complex areas such as the western plateau and mountains with overlapping terrain. Railway engineering construction is a complex system engineering, which has the characteristics of a long construction period, many participating units, and high quality standards [2]. In the field of railway engineering, “complex and dangerous areas” specifically refer to those special areas whose natural geographical conditions are extreme, engineering technology challenges are huge, ecological environment is sensitive and social impact is far-reaching, which significantly increase the difficulty of railway planning, construction, and operation. Railway engineering in complex areas is a super project, which has the basic characteristics of general railway engineering. The threat of various disaster risks always exist in different stages of the whole lifecycle of the Sichuan–Tibet Railway. At the same time, due to the overlapping effect of multiple repeated complex environments such as the natural environment and social environment in complex areas, railway engineering in complex areas is unique. However, human beings’ lack of awareness of the overlapping effect of multiple repeated complex environments has resulted in a large number of uncertainty and ambiguity problems [3]. The interaction between multiple complex environments and extremely arduous projects has brought many technical problems. Before the emergence of some technical problems that are impossible to predict, the traditional technology cannot deal with a construction process full of the unknown, and some technical problems need to be iterated repeatedly to obtain efficient solutions. Therefore, it is urgent to carry out technological innovation.
Technological innovation innovates technology through a series of innovation activities [4], including the generation of ideas, research, and the application of results. “Innovation” was first mentioned by Austrian economist Joseph Schumpeter in his book economic development theory, published in 1912. Innovation is the driving force of economic growth and development, and it is the core idea of technological innovation theory at the root [5]. Scholars from various countries have also carried out a lot of research on railway engineering technology innovation. In terms of technological innovation in railway engineering project construction management, Huang et al. [6] proposed a lifecycle assessment model to quantify the construction and demolition waste (CDW) generated by railway engineering projects, and verified it with the case of Yunnan Guangxi railway. However, the study used a single weighting method, and the results were biased. Kaewunruen et al. [7] established and analyzed the world’s first 6D BIM for lifecycle management of railway turnout system, which improved maintenance efficiency and effect by integrating information from various dimensions, and achieved a balance in economy, management, and sustainability. However, the study did not take into account sociocultural influences. Ciccone et al. [8] introduced the pilot project along the Cancello–Benevento railway line, aiming to realize the operation management, evaluation, and value management of railway infrastructure along the line through digital infrastructure. Saleh et al. [9] proposed an intelligent Petri net (IPN) model to optimize the maintenance and operation of railway sections and provide a promising solution for optimizing the gravel maintenance in railway operation.
In terms of technological innovation in railway engineering safety management, Liu [10] proposed a new method based on knowledge mapping to explore railway operation accidents, aiming to reveal the potential laws of accidents by describing accidents and hazards in heterogeneous networks. Lefsrud et al. [11] discussed the problems existing in the practice of implementing the safety management system (SMS) in the Canadian railway industry, and put forward suggestions to improve the implementation of SMS based on performance-based supervision and risk management, so as to encourage railway companies to continuously improve and innovate. Hidrov et al. [12] developed a model framework and applied the concept of reliability, availability, and maintainability (RAM) contained in the European en50126 standard to the management of railway infrastructure to realize the management of reliable, available, and maintainable railway infrastructure. The study focused on the reliability of the equipment, but did not consider management and technology. Sadeghi et al. [13] proposed a new railway track condition index considering the comfort of rail passengers, and developed a new algorithm to optimize the current maintenance method to prioritize and arrange maintenance activities.
Technological innovation is an activity in which technological change promotes economic development. At each stage, there are a variety of uncertain potential factors, which lead to the high risk of technological innovation. George et al. [14] identified seven primary risk factors for technological innovation in small and medium-sized enterprises (SMEs): technological risks, market risks, financial risks, production risks, management risks, policy risks, and cultural risks. Ma et al. [15] explored how green technological innovation is influenced by environmental regulation, digital finance, and their interactive effects, which drive regional disparities and reveal spatial- and policy-related risks in innovation. The index selection of this study provides ideas for the technical innovation risk of railway in complex and dangerous areas. Anzola-Román et al. [16] empirically demonstrated the positive impacts of internal R&D and external innovation sources on technological innovation, as well as the critical role of organizational innovation in enabling technological advancements. In addressing technological innovation risk management, Li et al. [17] proposed a modified probabilistic linguistic VIKOR (PL-VIKOR) method to evaluate risks in innovation projects. This approach systematically incorporates the relationships between alternative solutions and ideal benchmarks, enhancing the objectivity of risk assessments under probabilistic linguistic term sets. Hao et al. [18] introduced a novel early-warning method based on artificial neural networks (ANNs) to manage risks in dynamic and complex innovation environments. The effectiveness of this method was validated through structural analysis, indicator representation, and empirical simulations, demonstrating its robustness in risk prediction and mitigation. However, this method is more dependent on historical data training, which is difficult to apply in the railway field in complex and dangerous areas where data is scarce.
  • Scholars’ research on railway engineering technology innovation mostly focuses on traditional railway projects, with insufficient in-depth studies on railway projects in complex and hazardous areas. Compared to traditional railway projects, these areas face more severe high-cold, oxygen-deficient environments, frequent geological disasters, and extreme conditions that lead to differences in the applicability of technologies. Engineering in complex and hazardous areas requires integration of geology, ecology, sociology, and other disciplines, but interdisciplinary collaboration has not been fully integrated, leading to existing technological innovation research being unsuitable for these areas.
  • Currently, research on the factors influencing technological innovation risks by experts both domestically and internationally mainly focuses on management, technology, and finance, with little consideration given to the impact of social and natural environments on technological innovation. The extreme climate and ecological sensitivity in complex and challenging regions directly affect the success or failure of technological innovation. In ethnic regions, technical solutions must also take into account issues such as religious and cultural protection. Natural and social risks can amplify technological risks through a “cascade effect.” Therefore, the risks to be considered in technological innovation for railway projects in complex and challenging regions are more complex.
At present, studies by domestic and international scholars on risk factors in technological innovation primarily focus on management, technology, finance, and other aspects, rarely considering the impact of social environment, natural environment, and other factors on technological innovation. The risks to be considered in the technological innovation of railway engineering in complex and dangerous areas will be more complex.
The dependence on technological innovation, as well as its required depth and scope, for railway projects in complex areas is significantly higher than in ordinary railway projects. The complexity and danger of the engineering implementation environment in these areas is unprecedented, making it difficult to apply previous engineering experiences to railway construction. As a result, railway projects in complex areas cannot simply adopt existing technical standards and specifications but must rely on technological innovation as the foundation, progressively achieving standardization and normalization during the implementation process. Therefore, various risks will emerge throughout the technological innovation process in complex area railway projects. To mitigate the risks associated with technological innovation and improve its effectiveness, this study analyzes the particularities of technological innovation in complex area railway projects and identifies risk factors during different stages. A preliminary list of risk factors for technological innovation in such projects is established, and the Vague set theory method is applied to screen risk indicators. This results in a final list of risk factors for technological innovation in complex area railway projects, which is used to build an evaluation system for these risk factors. Furthermore, this study combines the Analytic Hierarchy Process (AHP) and Entropy Weight Method (EWM) to assign weights to the risk indicators, and the cloud model is employed for a comprehensive risk evaluation. Based on the calculation results, the risk levels of the technological innovation risk factors in complex area railway projects are determined, the main risk factors are identified, and the findings are analyzed accordingly.
The rest of this paper is as follows. Section 2 describes the identification of influencing factors. Section 3 introduces the research methods and describes the variables and parameters to be confirmed. Section 4 provides the results of the analysis. Finally, Section 5 summarizes the results of this study.

2. Identification of Influencing Factors

2.1. Initial List of Indicators

The technological innovation process in railway projects in complex areas is a result of the engineering demands. This study structures the process into three phases: the planning and design phase, the problem–resolution phase, and the construction implementation phase. In the planning and design stage, the tasks include thoroughly analyzing innovation demands, determining feasible solutions, and formulating plans. Due to the fragile ecological environment in complex areas, it is essential to consider how to protect ecological resources and the environment during the planning process. Harsh climatic conditions and variable geological structures increase the difficulty of surveying and design, making it challenging to accurately define project requirements. The problem-solving stage is the core phase of technological innovation, testing the innovation capabilities of the main participants. This stage also involves multiple professional fields and stakeholders, making coordination among personnel particularly challenging. The implementation stage is the critical phase for the application and validation of technological innovation outcomes. It is accompanied by multiple risks, such as insufficient technological maturity, compatibility issues, and increased implementation difficulty. After reviewing the various literature and conducting field investigations, a preliminary list of factors influencing technological innovation in railway projects in complex areas was compiled and categorized. The list includes a total of 37 factors, which are divided into five categories: social factors, environmental factors, technological factors, resource factors, and management factors.

2.1.1. Social Factors

Social factors refer to non-technical determinants directly affecting civil livelihoods embedded within the technological innovation process of railway projects in complex areas, distinct from natural environmental constraints. These factors interact with one another and collectively influence the decision-making, planning, implementation, and outcomes of railway engineering technological innovation. They serve as the essential background and conditions for the innovation activities in railway engineering. The operation of an organization is inseparable from the local cultural context. Therefore, for an organization to overcome technological innovation bottlenecks, the influence of culture is essential. Some scholars have explored the impact of Confucian culture on technological innovation from the perspective of employees [19]. However, within the vast land of China, various cultures have flourished, and people in complex areas also possess other forms of clan culture that have a profound impact on economic and social development. In complex areas, where there are rich cultural resources and fragile ecological environments, careful consideration is required during the technological innovation process to avoid conflicts and prevent negative public opinion. In addition, complex areas are often remote, with railway lines located in uninhabited or resource-scarce regions, where conditions such as transportation and energy are poor [20]. These factors can have a certain impact on the implementation of technological innovation outcomes. Therefore, the preliminary identified risk indicators for social factors are as follows (Table 1):

2.1.2. Environmental Factors

Environmental factors refer to the integrated environmental system in which railway construction in complex areas takes place, consisting of various natural elements such as the atmosphere, rocks and minerals, topography, landforms, and biological communities (Table 2). These natural elements often exhibit extremity, variability, and uncertainty in complex areas. In the article, “complex areas” mainly refers to complex and hazardous regions in western China, characterized by complex geological conditions, harsh climatic environments, high altitudes, and frequent natural disasters [28]. These factors directly increase the difficulty of preliminary surveying and design, making it challenging to accurately define project requirements, which in turn leads to various issues during the implementation of feasible solutions. In addition, the ecological environment along the railway lines is sensitive. For technological innovation in railway engineering to achieve green and sustainable development, it is necessary to coordinate the relationship with the ecological environment [29].

2.1.3. Management Factors

Management factors refer to all relevant elements involved in project planning, organization, leadership, and control in the process of technological innovation in railway engineering in complex areas (Table 3). Given that such technological innovation constitutes a multi-stakeholder, extended-duration, and risk-intensive systemic endeavor, its management framework requires specialized integration. Therefore, during the management process, it can lead to organizational management imbalances. This article provides an in-depth analysis of management risks from multiple perspectives, including the strategic, organizational, and incentive levels. At the strategic level, a lack of leadership and decision-making ability, as well as a deficiency in project coordination skills and foresight among managers, can lead to erroneous decisions. At the organizational level, insufficient collaboration occurs as the technological innovation process involves numerous participants across multiple professional fields and departments, making collaborative management challenging. Achieving cross-departmental management and coordination is expected to increase knowledge spillover in innovation activities [31]. In addition, information management is crucial as it not only facilitates effective knowledge exchange [32], but also helps establish partnerships, integrate contributions, and coordinate cooperation [33]. The absence of an incentive mechanism at the motivation level leads to insufficient immediate rewards for innovation participants, resulting in a low willingness to invest and a lack of effective protection for innovative outcomes. Only by providing opportunities and incentives for employees can creative ideas be fostered [34].

2.1.4. Technological Factors

Technology is regarded as one of the most important strategic resources for organizations to establish a competitive advantage [47] (Table 4). Technological factors refer to elements related to technology itself that influence the outcomes of technological innovation. These factors play a critical role in the technological innovation process of railway projects in complex areas and are rooted in the “basic capabilities—application effectiveness—sustainability” framework. The basic layer involves technological accumulation and integration, which form the foundation of technological innovation. Insufficient technological accumulation and defects in interdisciplinary technology integration lead to a lack of theoretical support for technological innovation. The application layer is directly related to the actual performance and safety of the technology. On one hand, under the extreme conditions of complex areas, the technical constraints of innovation outcomes may be amplified. Moreover, insufficient technological maturity or robust safety protocols would compromise the operational feasibility of implementation. On the other hand, insufficient maturity and compatibility can lead to application failure. The sustainability aspect concerns long-term competitiveness, where a short lifecycle or poor environmental adaptability may affect the continued application of the technology.

2.1.5. Resource Factors

Resource factors refer to the total sum of various resource elements that directly influence the technological innovation process in railway projects in complex areas (Table 5). These resource elements include, but are not limited to, personnel, materials, machinery, and capital. They serve as the material foundation and guarantee the smooth progress and realization of technological innovation. Innovative organizations require valuable personnel, as they are the engine for achieving or maintaining competitive positions of the future [52]. However, in complex areas, innovation projects tend to be long-term and large in scale, with significant talent loss. The lack of infrastructure in complex areas leads to delays in the supply of necessary materials and machinery, posing major challenges for the implementation of innovation outcomes [19]. Railway engineering innovation projects in complex areas require substantial funding, and errors in early-stage planning or unforeseen environmental damage events during the implementation phase can lead to a shortage of funds, thereby affecting the efficiency of innovation activities.

2.2. Indicator Screening

Based on the relevant literature, the risk factor indicators for technological innovation in railway projects in complex areas have been effectively identified, covering multiple perspectives. To maintain rigor, these risk factor indicators need to be optimized and screened; otherwise, the analysis results may contain certain biases. The Vague theory method allows for effective quantitative screening of indicators, avoiding much of the subjectivity found in other methods, and enabling efficient identification and judgment of risk factors. Chen Q [56] combined the G1 sequence method with the anti-entropy weighting method to obtain subjective and objective weights, respectively. They used a game theory aggregation model to determine the weight of indicator combinations and constructed a fuzzy comprehensive evaluation model for intelligence processing systems using Vague set theory. Fuzzy sets describe the membership degree of fuzzy concepts using interval values rather than single values, which, to some extent, gives them stronger capabilities in handling fuzzy information [57]. In response to the high dimensionality, dynamic evolution, and cognitive ambiguity of complex regional risks, fuzzy set theory outperforms traditional methods like FRA in computational efficiency, uncertainty quantification, and model scalability.
Definition 1 
([58,59,60]). Let U = x 1 , x 2 , , x i be a domain. The Vague set on U is denoted as A, and x i any element of U.
Definition 2 
([60,61,62]). The membership degree of x i A is represented by the true membership function  t A  and the false membership function f A respectively. It is expressed as:
t A : U 0,1 ,   f A :U 0,1  and satisfies 0 ≤   t A x i + f A x i   ≤ 1. The value of any element x in A can be represented as   t A x i , 1 f A ( x i ) .
Definition 3 
([61]).   π A ( x i ) = 1 t A ( x i ) f A x i is the hesitation degree of x i  with respect to A. The larger the value of π A ( x i ) , the more unknown information there is regarding x with respect to A.
Surveys were distributed to 10 experts with extensive experience in the field, inviting them to assess the importance of the 37 risk indicators selected. The assessment scores for the indicators were as follows: 1, 2, and 3, representing “not important”, “uncertain”, and “important”, respectively. After collecting the completed questionnaires, the number of experts who considered each risk indicator as important, not important, or uncertain was counted. The values of t A x i ,   f A x i , and π A   ( x i ) were then calculated.
t A ( x i ) = Number of people who think it is important/Total number of people,
f A x i = Number of people who think it is not important/Total number of people,
π A x i = Number of people who are uncertain/Total number of people.
Definition 4. 
Sorting function S A x i = t A x i f A x i + α β π A x i . To rank the Vague values using S A ( x i ) . The values of α and β are divided into two cases:
When  t A x i f A x i = 0,  S A   x i   = α β π A   ( x i ) , and the values of α  and  β  are determined by the expert’s attitude toward the importance of the risk factor.
When  t A ( x i ) f A ( x i ) 0 ,  S A x i = ( α β ) ( 1 + π A ( x i ) ) ,   α = t A ( x i ) ,   β = f A ( x i ) .
Among them, α and β satisfy the conditions 0 α 1 , 0 β 1 and 0 α + β 1 . The specific calculated values are shown in the Table 6.

2.3. Indicator Determination

Based on the actual project conditions and discussions with the expert group, this study classifies values S A ( x i ) 0 . 30 as key indicators, which are included in the key indicator set B, while S A ( x i ) > 0 . 30 are excluded. In summary, 26 key risk indicators were selected. These are shown in the Table 7:

3. Model Construction

3.1. Determination of Combined Weights

3.1.1. AHP Determines Subjective Weights

Based on the analysis of the risk factors for technological innovation in railway projects in complex areas, experts in the industry were invited to perform pairwise comparisons and scoring for 5 first-level indicators and 26 second-level indicators using the 1–9 scale method, constructing the judgment matrix. The judgment matrix was then calculated, and on this basis, a fuzzy consistent preference relation was established. Ultimately, the geometric mean method was applied to determine indicator weights, with the results summarized in the Table 8.

3.1.2. EMW Determines Objective Weights

This paper uses the Entropy Weight Method to objectively assign weights to the risk indicators of technological innovation in complex area railway projects. Ten industry experts were invited to participate in the railway technology innovation project in complex and challenging areas, with their professional backgrounds covering engineering technology, ecological protection, and project management. All members of the expert group have over 15 years of industry experience, and their professional qualifications cover key aspects such as railway surveying and design, construction technology research and development, and environmental protection. The number of experts was determined through rigorous calculations; preliminary research found that when the sample size reached eight people, the Kendall coordination coefficient stabilized (W > 0.7), and ultimately, ten people were selected to enhance the robustness of the results. To avoid groupthink, a three-stage prevention mechanism was adopted: first, anonymous back-to-back consultations were conducted to eliminate authoritative influence; second, the Delphi method was used for three rounds of opinion iteration, with preliminary statistical parameters provided for experts to reference and adjust in each round; finally, fuzzy comprehensive evaluation was introduced to weight extreme opinions. The impact of railway engineering technology innovation on complex areas was scored according to risk indicators, using a percentage system, as shown in Table 9.
Based on the scoring results, the objective weights for the risk evaluation indicators of technological innovation in complex area railway projects are calculated, as shown in Table 10.

3.1.3. Determine the Combination Weight

The final weights are obtained by optimizing the combined weights using the AHP-EWM. Suppose the weight coefficients of the technological innovation risk evaluation indicators determined by the AHP and EWM are denoted as V = ( V 1 , V 2 , , V n ) and W = ( W 1 , W 2 , , W n ), respectively. The weight coefficients for each evaluation indicator W j are then calculated by combining the subjective weights obtained from the AHP method with the objective weights obtained from the EWM, according to the formula.
W j = V i W i 1 n V i W i
The final weights of the technological innovation risk factors for complex area railway projects are determined, as shown in Table 11.

3.2. Cloud Model Construction

3.2.1. Determine Standard Cloud

Reasonable classification of risk levels is the foundation for scientifically constructing the standard cloud model. The technological innovation risks of complex area railway projects are divided into five levels, and the risk level interval values are estimated according to [0, 10], represented by linguistic values with a certain degree of ambiguity: low, relatively low, moderate, relatively high, and high. The interval domain [ C m i n , C m a x ] corresponds to each risk level (Table 12).
The calculation formula for the numerical characteristics of the risk evaluation standard cloud C v is as follows:
E x v = C m a x + C m i n 2
E n v = C m a x C m i n 6
H e v = k
In the formula, E x v represents the expected value, which reflects the center of the cloud model’s distribution and is the point that most accurately represents the concept of the risk level of technological innovation in complex area railway projects. E n v is the entropy, which reflects the fuzziness of the evaluation indicators. H e v is the hyper-entropy, which reflects the degree of aggregation of the cloud droplets. Through multiple adjustments, when k is set to 0.03, the effect of risk composite cloud in the cloud model is more intuitive and clearer. The standard cloud calculated by the formula is as follows (Table 13):

3.2.2. Determine Evaluation Cloud and Comprehensive Cloud

Ten experts were invited to score the cost risk factors using the 1–10 scale method, which serves as the raw data (Table 14 and Table 15). Based on this, the three numerical characteristics of the evaluation cloud C j , namely C j   ( E x j , E n j , H e j ), are calculated using the following formulas [63].
E x j = 1 n i = 1 n x i j
E n j = π 2 × 1 n i = 1 n x i j E x j
H e j = S j 2 E n j 2
S j 2 = i = 1 n x i j E x j 2 n 1
where n is the number of experts, m is the number of risk indicators, x i j (i = 1, 2 , ,n; j = 1, 2 , ,m) represents the score given by the i -th expert to the j -th risk indicator, and S j 2 is the sample variance.

4. Result Analysis

This study uses MATLAB(R2024a) software to plot cloud diagrams, compare the comprehensive clouds generated by secondary and primary indicators with the standard cloud, and determine the risk level by analyzing the position of the comprehensive cloud and the standard cloud within the same cloud diagram, as well as the values of the comprehensive cloud.

4.1. Determination of Social Risk Factor Level

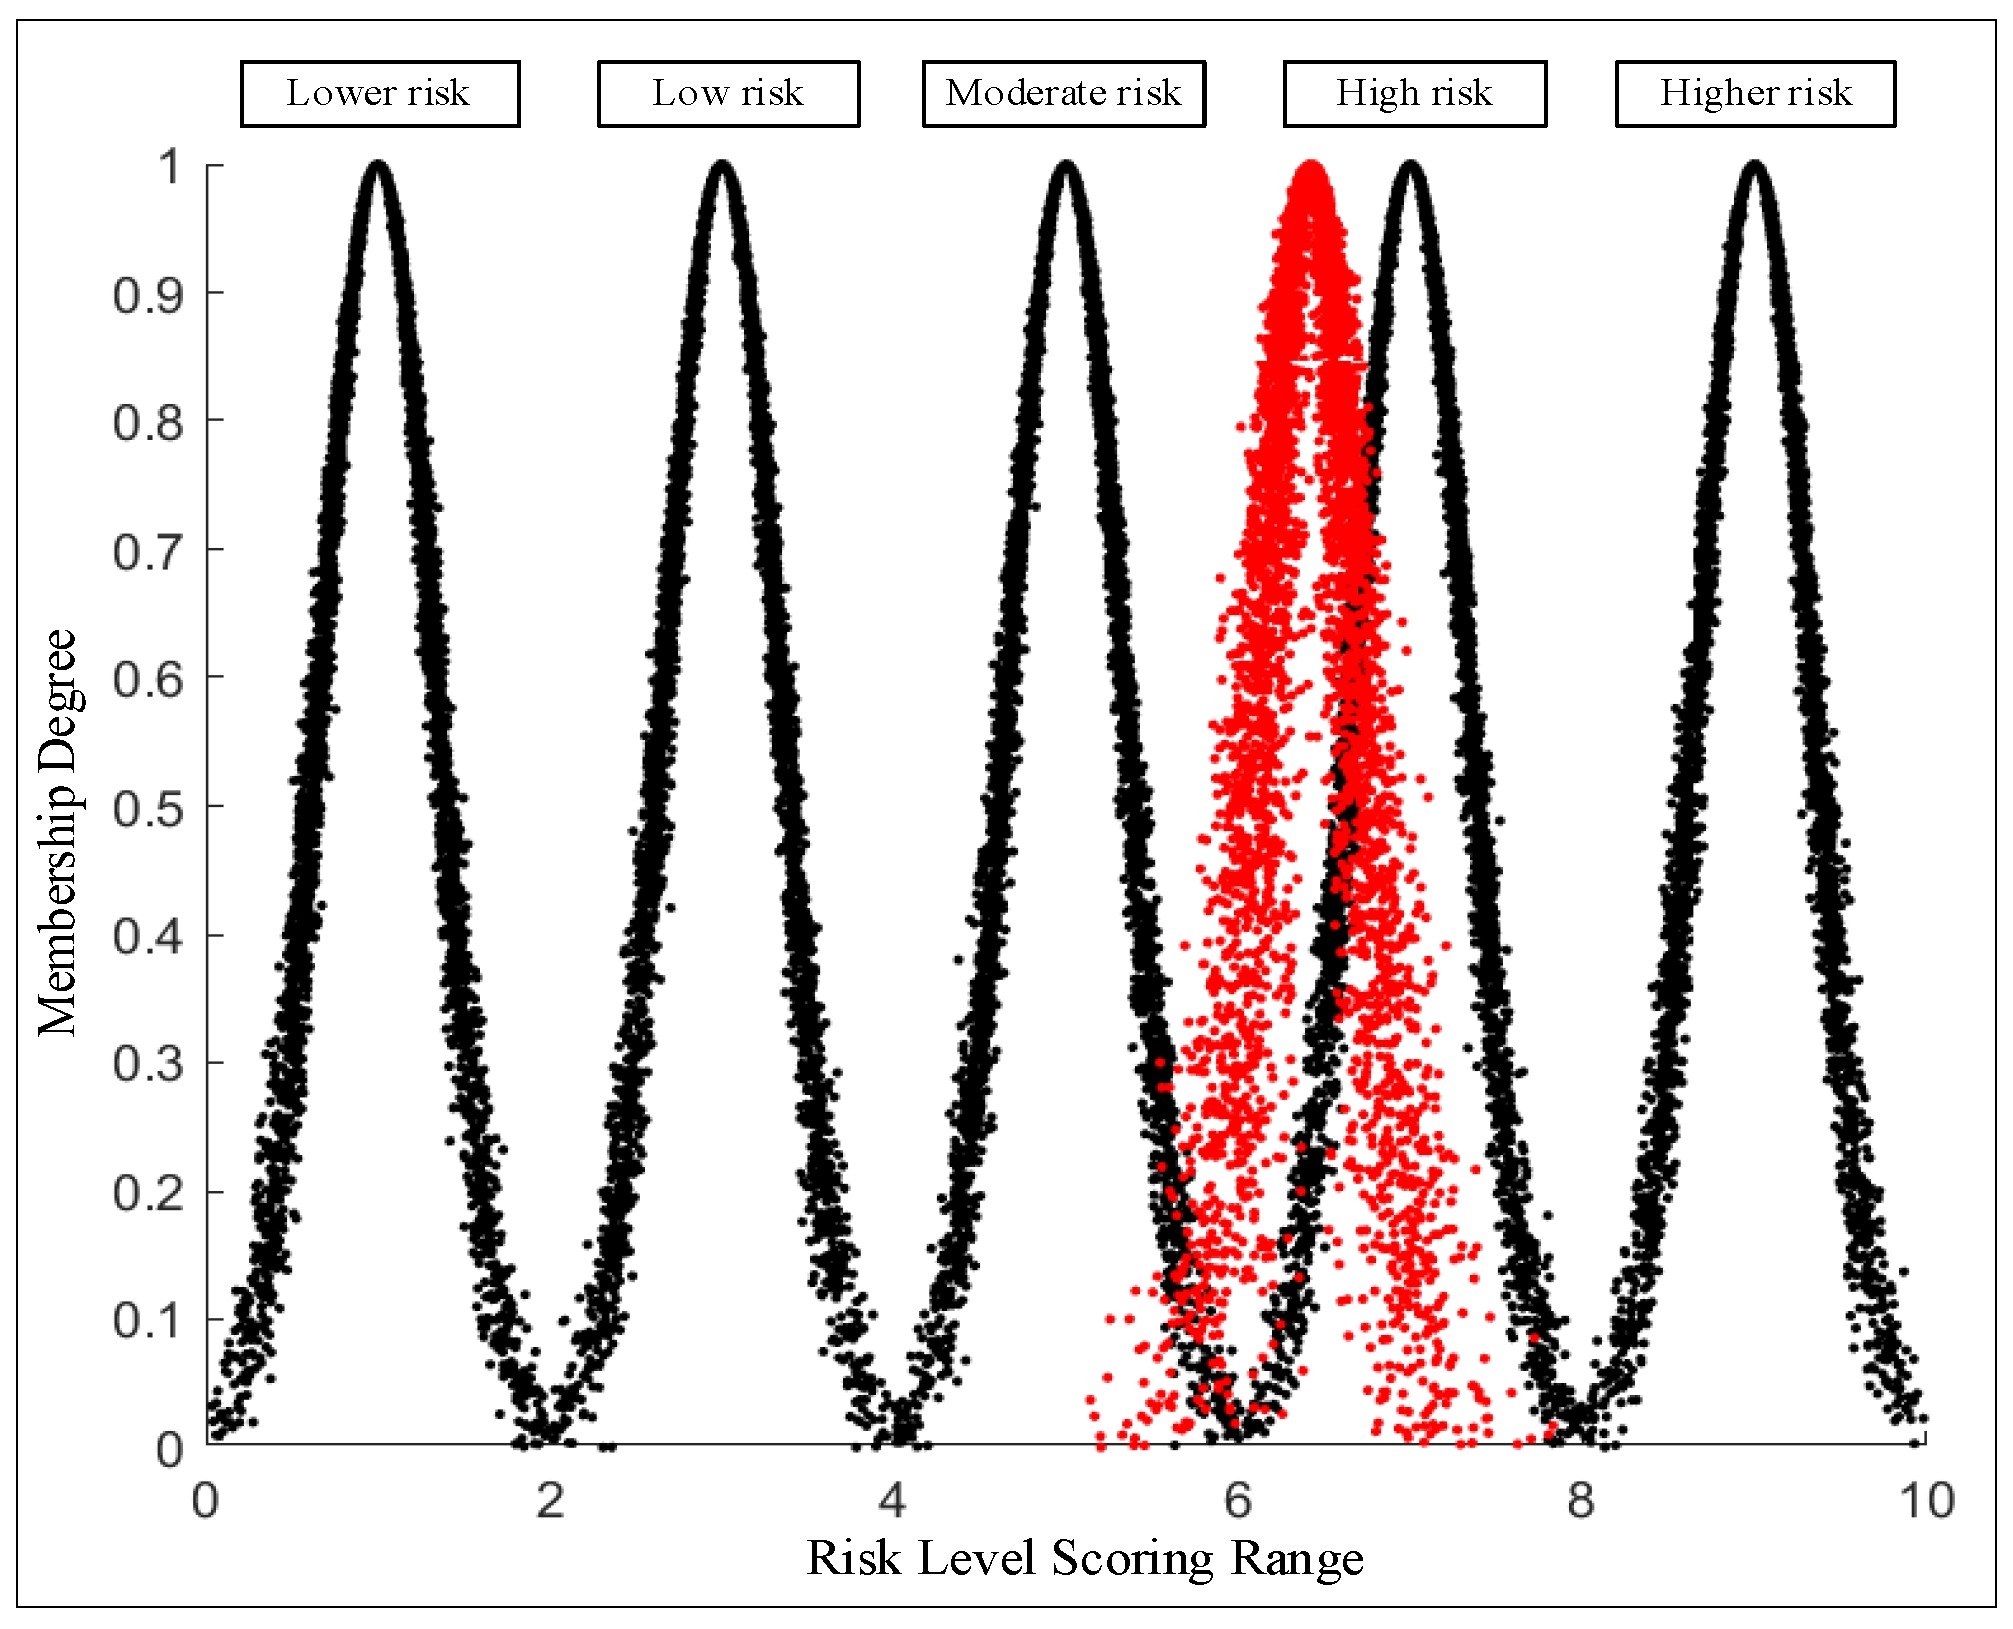
The comprehensive cloud of social risk factors is (6.4202, 0.2849, 0.0995), and the generated social risk comparison cloud diagram is shown in Figure 1.
By analyzing Cloud Diagram 1 and the comprehensive cloud calculation results, it can be concluded that the comprehensive cloud of social risk factors primarily falls within the risk level score interval of 6–8. Through comparison, the social risk level is determined to be high risk. Similarly, within the social risk factors, all are in the high-risk level. The ranking of risk severity is as follows: insufficient energy supply > inconvenient transportation > cultural and religious conflicts > poor medical conditions > poor communication conditions.

4.2. Determination of Environmental Risk Factor Level

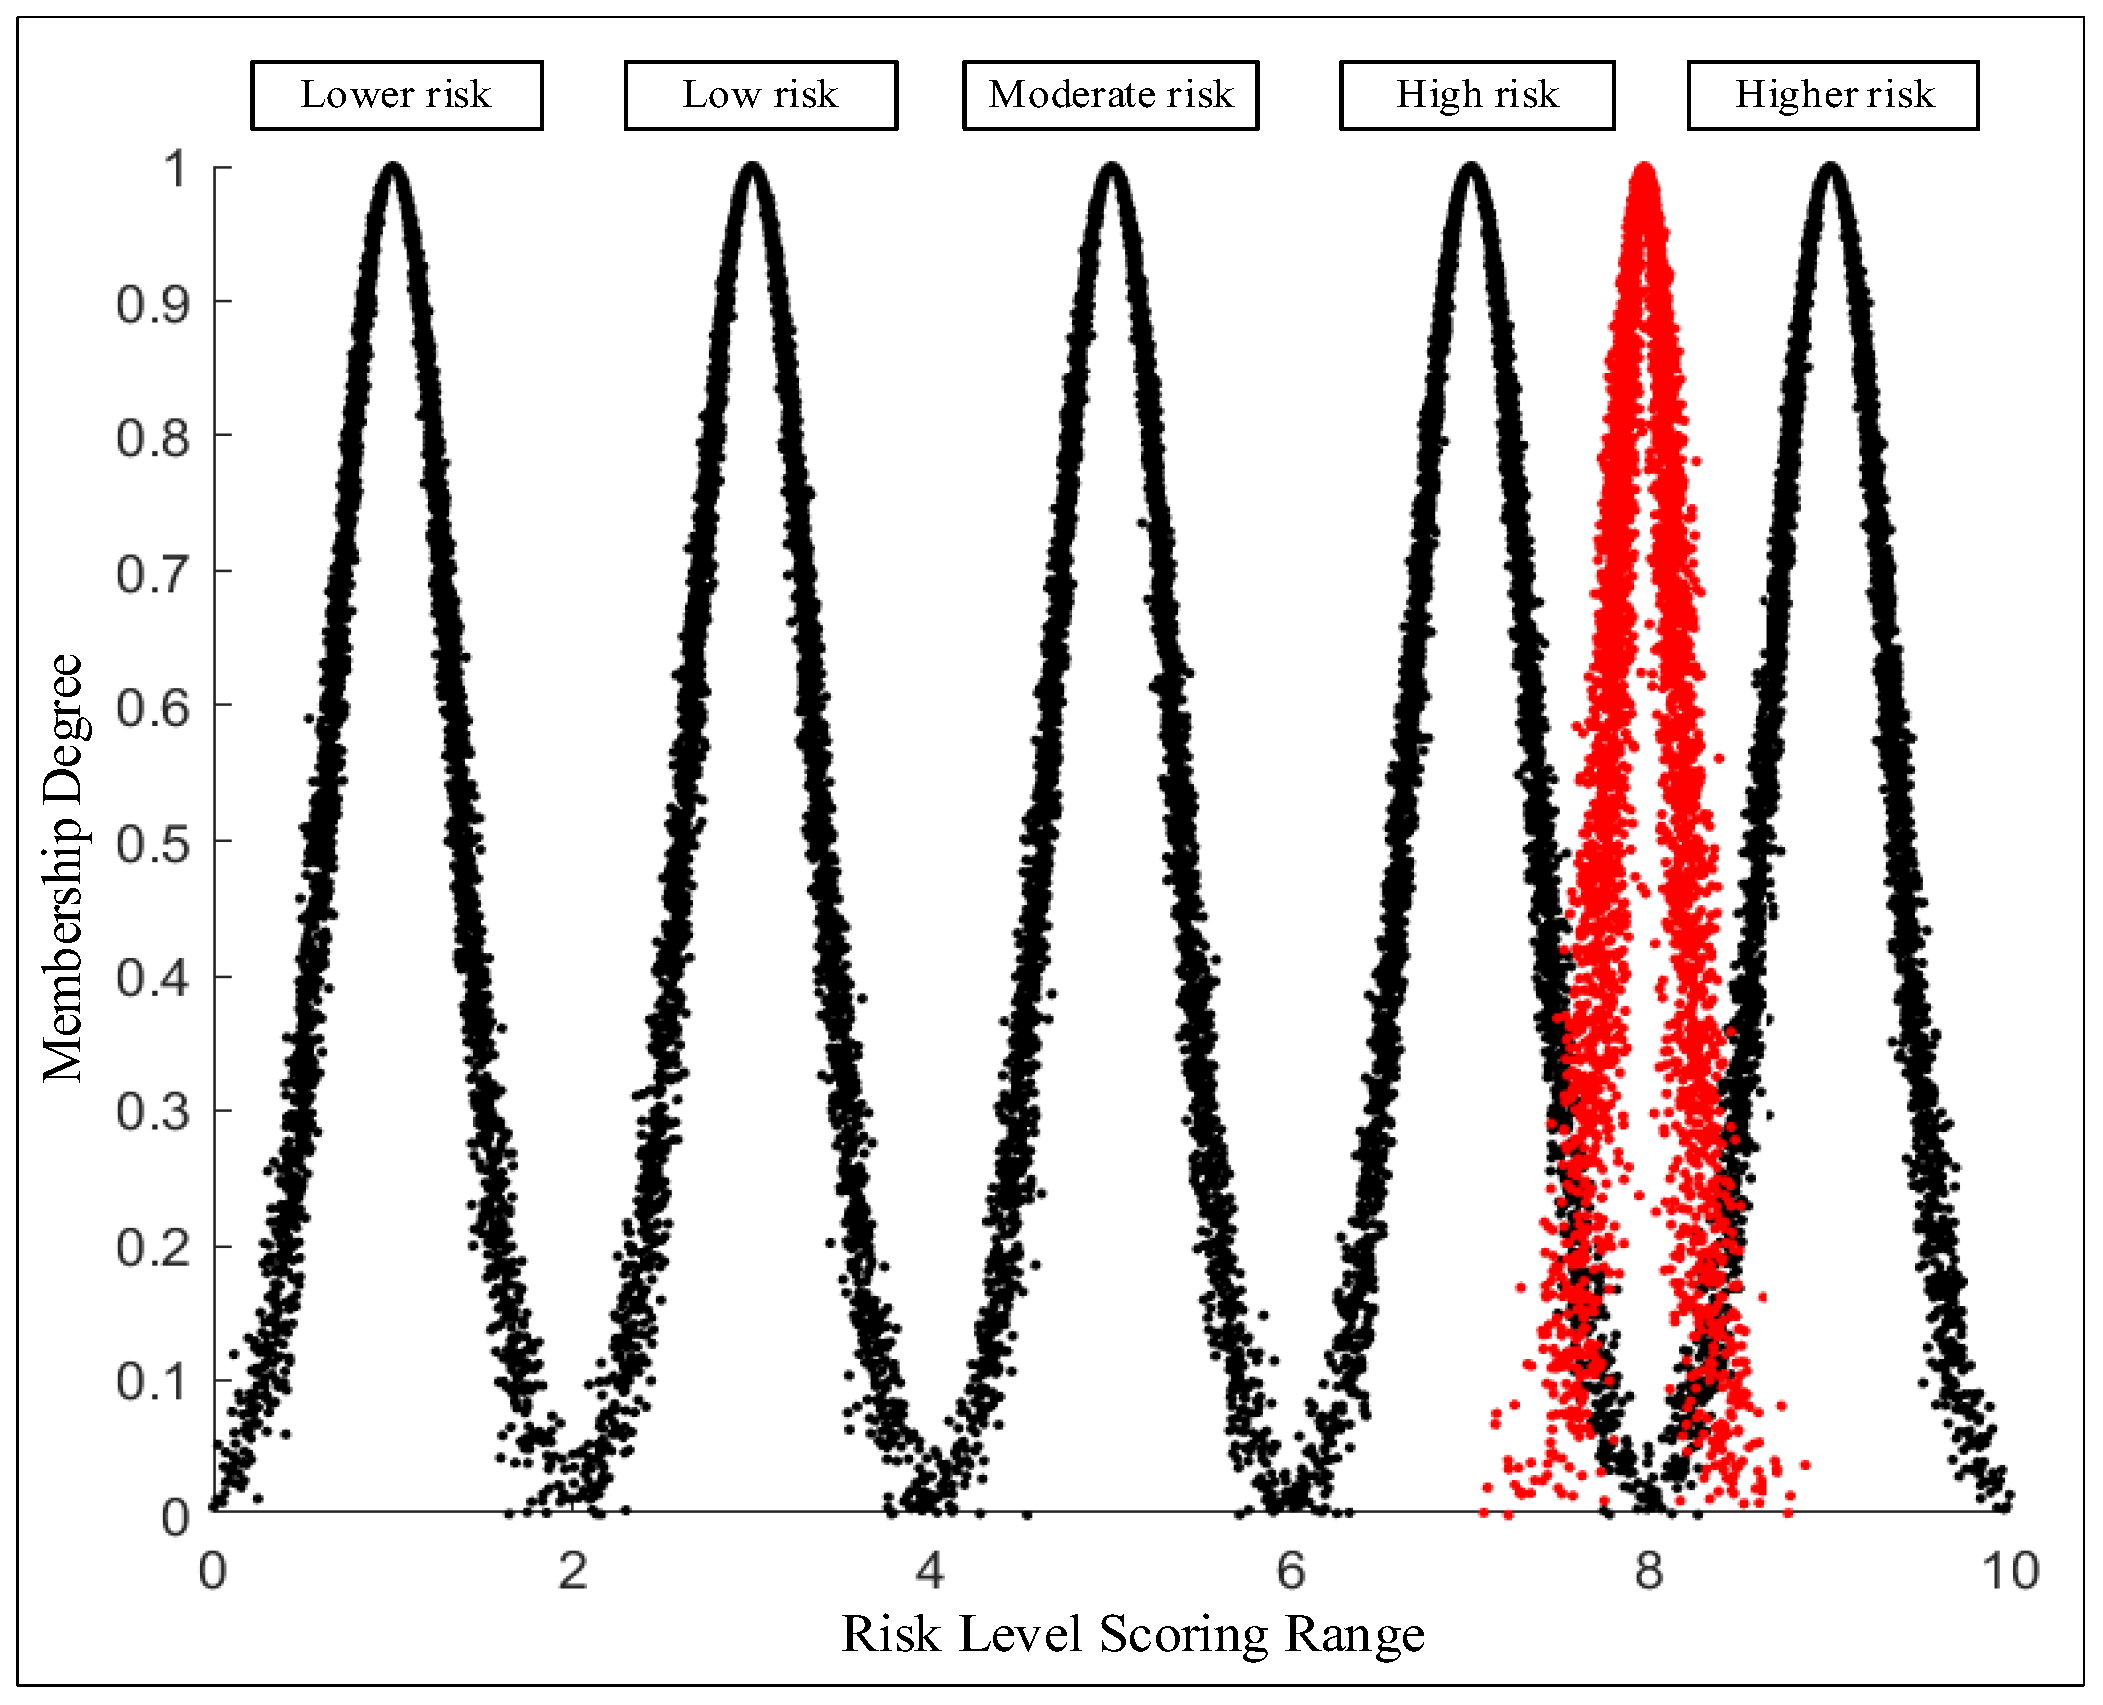
The comprehensive cloud of environmental risk factors is (8.3995, 0.2441, 0.1094), and the generated risk comparison cloud diagram is shown in Figure 2.
By analyzing Cloud Diagram 2 and the comprehensive cloud calculation results, it can be concluded that the comprehensive cloud of environmental risk factors primarily falls within the risk level score interval of 8–10. Through comparison, the environmental risk level is determined to be high risk. Similarly, after analysis, it can be concluded that all risk factors within the environmental risks are at the high-risk level. The ranking of risk severity is as follows: fragile ecological environment > unstable geological structure > frequent disasters > intense ultraviolet radiation > low atmospheric oxygen content > low temperature.

4.3. Determination of Management Risk Factor Level

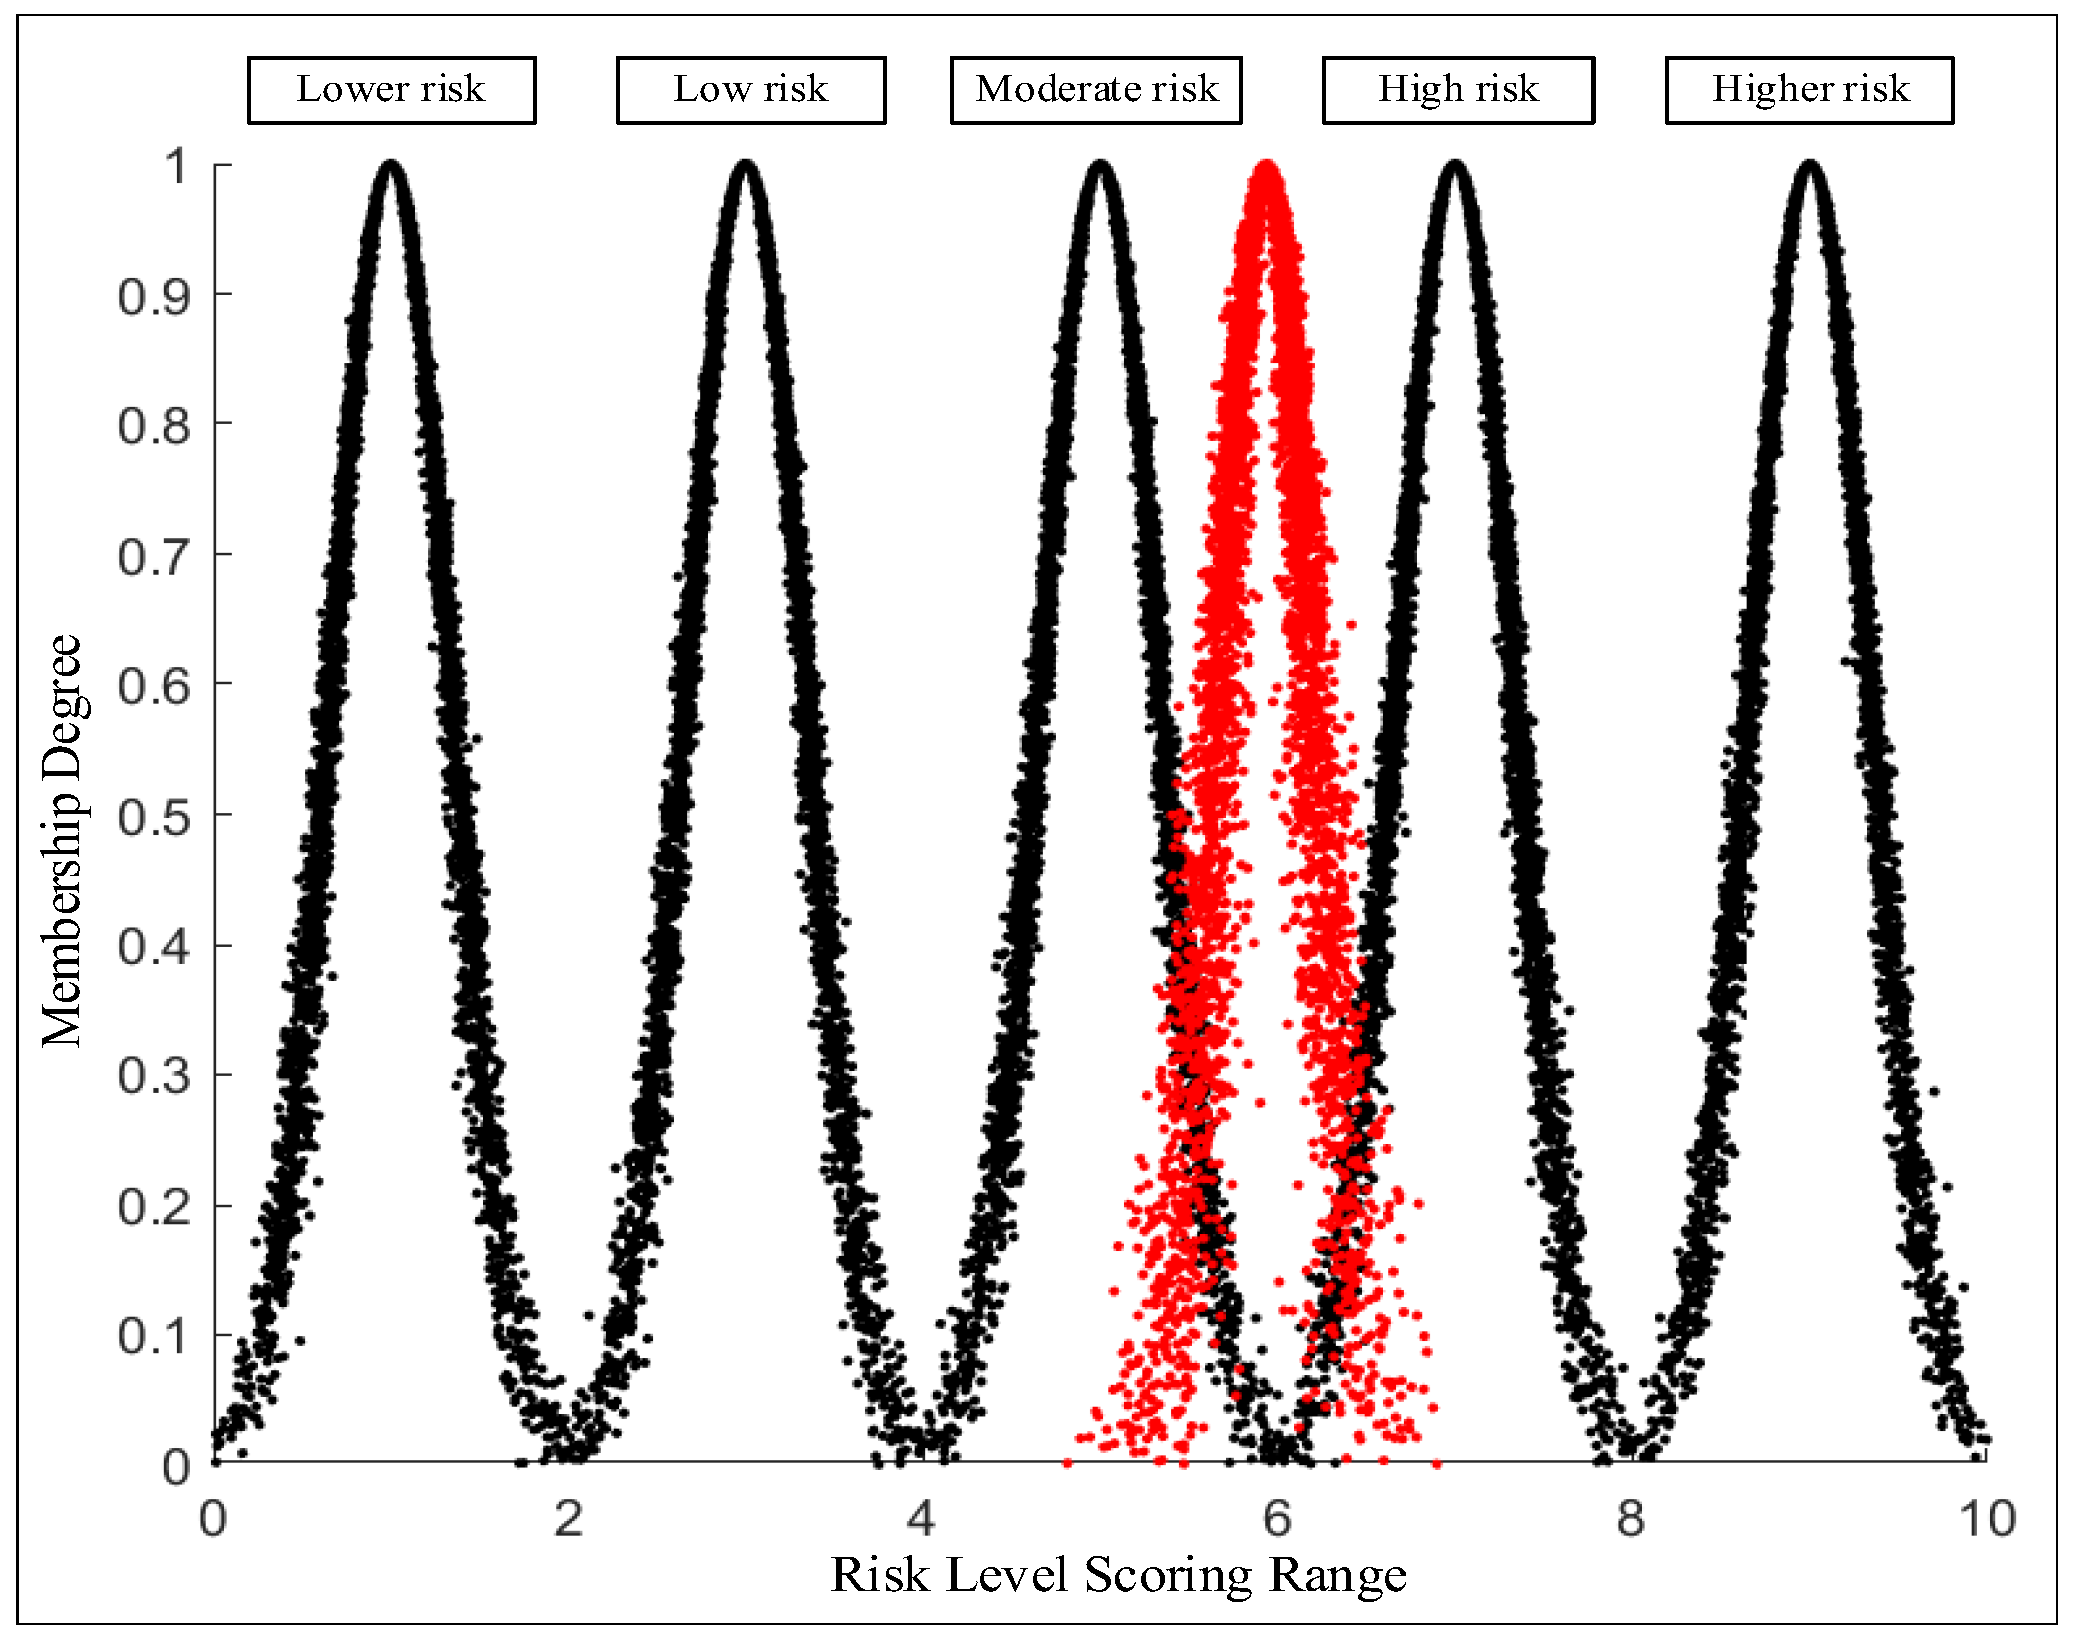
The comprehensive cloud of management risk factors is (5.9369, 0.2530, 0.0713), and the generated risk comparison cloud diagram is shown in Figure 3.
By analyzing Cloud Diagram 3 and the comprehensive cloud calculation results, it can be concluded that the comprehensive cloud of management risk factors primarily falls within the risk level score interval of 5–6. Through comparison, the management risk level is determined to be medium risk. Similarly, after analysis, it can be concluded that within management risks, poor organizational coordination is at a higher risk level, while the other risk factors are at the medium-risk level. The ranking of risk severity is as follows: poor organizational coordination > insufficient intellectual property protection > imperfect technological innovation incentive mechanism > insufficient information management level > leadership management level and capability are inadequate.

4.4. Determination of Technological Risk Factor Level

The comprehensive cloud of technological risk factors is (7.9635, 0.1888, 0.0565), and the generated risk comparison cloud diagram is shown in Figure 4.
By analyzing Cloud Diagram 4 and the comprehensive cloud calculation results, it can be concluded that the comprehensive cloud of technological risk factors primarily falls within the risk level score interval of 7–8. Through comparison, the technological risk level is determined to be high risk. Similarly, after analysis, it can be concluded that within technological risks, the mismatch between new technologies and demands is at a higher risk level, while the other risk factors are also at high risk. The ranking of risk severity is as follows: mismatch between new technologies and demands > unsatisfactory technological maturity > poor environmental adaptability of new technologies > insufficient degree of technological integration > high application difficulty of technological innovation results > inadequate technological advancement.

4.5. Determination of Resource Risk Factor Level

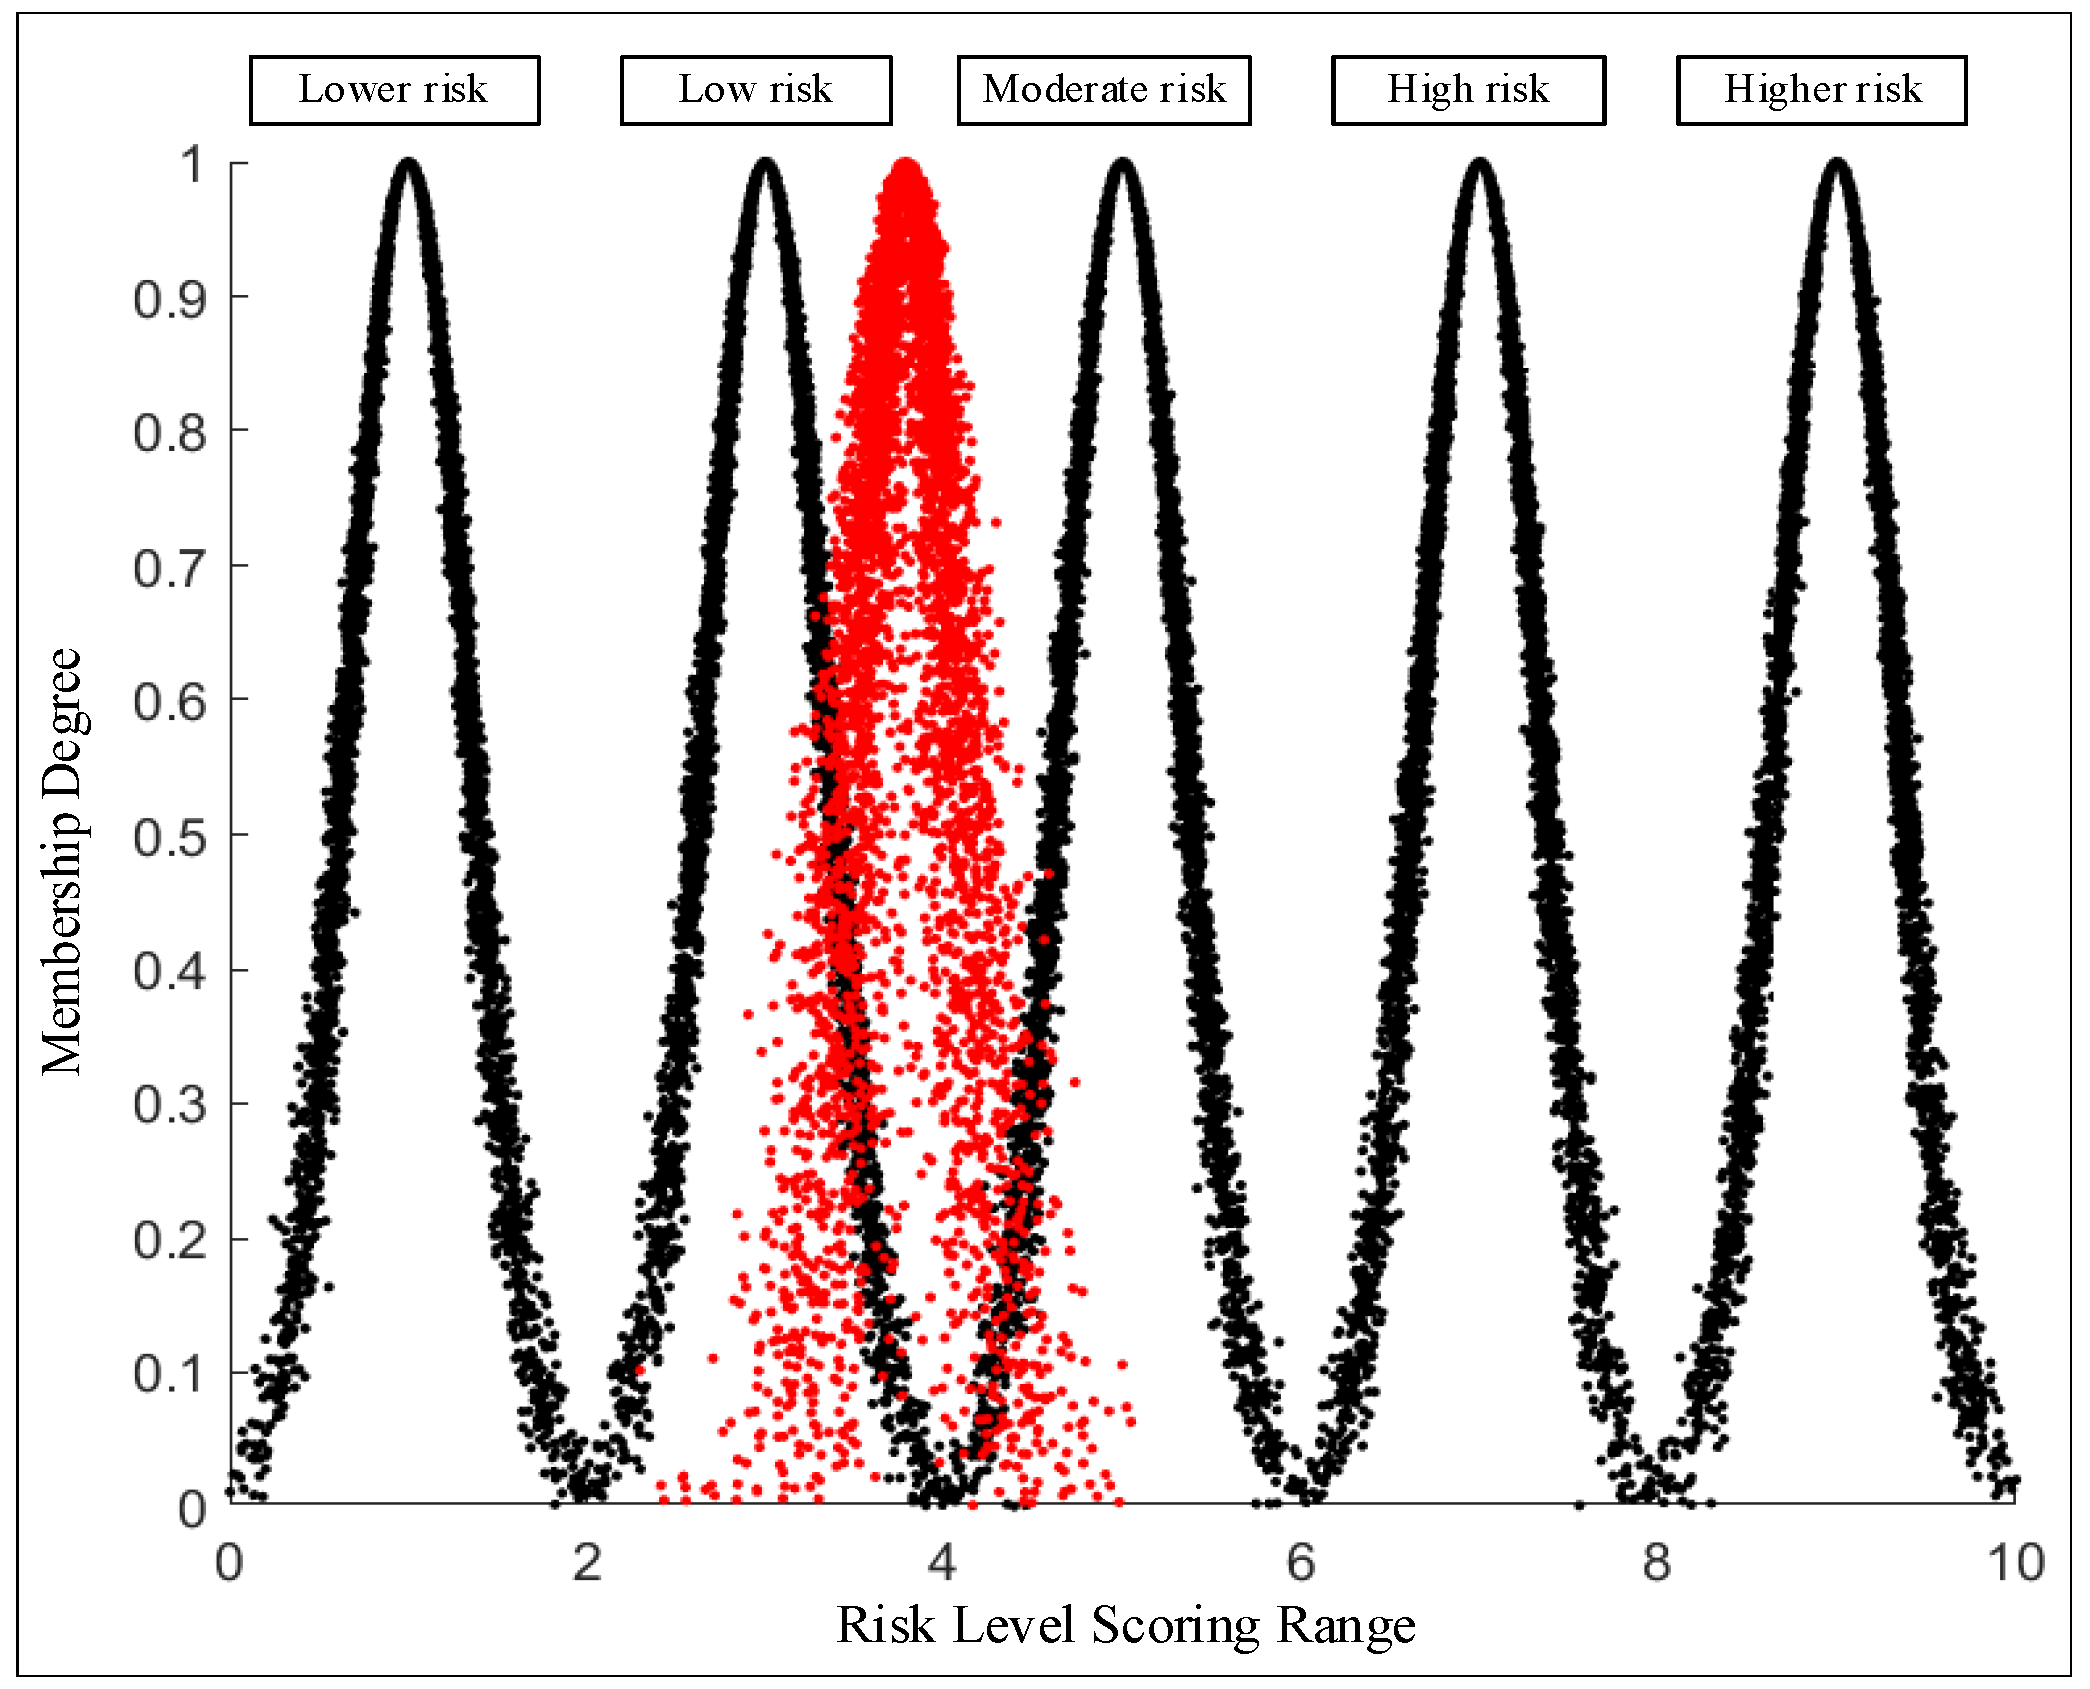
The comprehensive cloud of resource risk factors is (3.7848, 0.2687, 0.1154), and the generated risk comparison cloud diagram is shown in Figure 5.
The analysis of Cloud Diagram 5 and the comprehensive cloud calculation results shows that the resource risk comprehensive cloud mainly falls within the risk level score range of 3–4. Based on the comparison, the resource risk level is determined to be low risk. Similarly, through analysis, it can be concluded that all risk factors in resource risk are at a low-risk level. The risk severity ranking is as follows: loss of technological innovation personnel > insufficient technological innovation capability of the research team > untimely supply of funds > low level of material and equipment support.
Based on the results of the comprehensive cloud and cloud diagrams, the risk levels can be ranked as follows: environmental factors > technological factors > social factors > management factors > resource factors. Environmental factors are characterized by complexity and uncontrollability, placing high demands on technological innovation; technological factors involve numerous technological challenges and issues related to updates and iterations, requiring continuous breakthroughs and innovation; social factors indirectly affect the progress and cost control of technological innovation projects; management factors, through effective organizational coordination and risk prevention measures, can reduce risks; while resource factors, due to their high controllability and strong substitutability, occupy the lowest position in the risk level ranking.

5. Conclusions

In this study, we employed the combined weighting-cloud model method to deeply explore the risk factors of technological innovation in complex regional railway engineering. After reviewing a large number of references, we first screened 37 risk indicators and then used the Vague set theory method to screen and confirm 26 secondary risk indicators of 5 primary risk indicators. We determined the weights using the Analytic Hierarchy Process (AHP) and the Entropy Weight Method (EWM) and combined them with the cloud model. We determined the cloud parameters, generated cloud diagrams, and ultimately reached the following conclusions:
  • The ranking of risk factors for technological innovation in complex regional railway engineering shows that the risk level of environmental factors > technological factors > social factors > management factors > resource factors. Among the secondary indicators under the primary indicators, the highest risk factors include fragile ecological environment, mismatch between new technologies and demands, insufficient energy supply, poor organizational coordination, loss of technological innovation personnel, and others. The risk levels of these factors were quantified and visualized through cloud diagrams, providing clear priorities to guide resource allocation and policy formulation.
  • The establishment and application of the combined weighting-cloud model helps us better understand the various risk factors in the technological innovation process of complex regional railway engineering, offering a new perspective for risk management. Based on the analysis, the results emphasize that policymakers and project managers should comprehensively consider various factors and develop effective strategies to control the risks of technological innovation in complex regional railway projects.
  • Based on the high-risk level due to environmental factors, it is recommended to establish an “ecological-technological collaborative control mechanism.” First, during the project planning phase, a dynamic ecological carrying capacity assessment system should be introduced, integrating remote sensing monitoring and GIS spatial analysis technologies to develop tiered protection plans. Second, an environmentally adaptive railway construction technology package should be developed, leveraging BIM technology to conduct ecological impact simulations and iterative optimization of construction plans. Additionally, an ecological restoration performance traceability platform should be established, using blockchain technology to store and visualize data on vegetation recovery rates, soil and water conservation coefficients, and other indicators throughout their lifecycle, forming a closed-loop management process of “monitoring-restoration-assessment” to ensure that ecological protection measures are implemented concurrently with engineering projects and are dynamically balanced.
  • For technical risk factors, it is recommended to implement the “Technical Adaptability Enhancement Project.” On one hand, it is recommended to establish a dual-dimensional matching evaluation matrix of “demand-technology,” accurately converting complex terrain parameters into technical performance requirements, and compile the “Special Geological Railway Technology Innovation Standard System.” On the other hand, it is recommended to set up a collaborative innovation laboratory for industry, academia, and research, focusing on key technologies such as intelligent geological advance forecasting systems and self-sensing support structures. When monitoring data shows that the technical deviation exceeds the threshold, the system automatically triggers a multi-disciplinary collaborative optimization scheme generation mechanism, recommending the optimal technical adjustment path through machine learning algorithms, achieving forward-looking prevention and dynamic correction of technical risks.
This study provides a new perspective and method for understanding the risks of technological innovation in complex regional railway engineering, and its findings have significant theoretical and practical value in promoting technological progress and sustainable development in related fields.

Author Contributions

Conceptualization, C.C.; methodology, C.C.; software, S.T. and H.G.; formal analysis, Y.S. and Y.C.; investigation, C.C. and Y.S.; resources, Y.C.; data curation, X.L. and H.G.; writing—original draft, C.C. and S.T.; writing—review and editing, Y.S. and Y.C.; supervision, X.L. All authors have read and agreed to the published version of the manuscript.

Funding

This paper was supported by Research Project of China Academy of Railway Sciences Group Co., Ltd. [grant number 2022YJ130].

Data Availability Statement

All the relevant data are already included in the main manuscript.

Conflicts of Interest

Yuefeng Shi and Chaoxun Cai were employed by China Academy of Railway Sciences Corporation Limited. Shiyu Tian, Yongjun Chen, and Honghao Guan are the members of Beijing University of Civil Engineering and Architecture. Xiaojian Li is a member of Central South University. All authors declare that the research was conducted in the absence of any commercial or financial relationships that could be construed as a potential conflict of interest.

References

  1. Pan, L.; Tian, Y.; Ma, S.; Dai, W.; Chen, L. Research on Reliability Allocation Method for Traction Power Supply System of Electrified Railways in Mountainous Areas. IEEE Access 2024, 12, 38917–38926. [Google Scholar] [CrossRef]
  2. Wang, Y.; Wang, Z.; Ma, T.; Li, G.; Tie, H. Research on the realization path of railway intelligent construction based on system engineering. Sustainability 2022, 14, 6945. [Google Scholar] [CrossRef]
  3. Cui, P.; Ge, Y.; Li, S.; Li, Z.; Xu, X.; Zhou, G.G.; Chen, H.; Wang, H.; Lei, Y.; Zhou, L.; et al. Scientific challenges in disaster risk reduction for the Sichuan—Tibet Railway. Eng. Geol. 2022, 309, 106837. [Google Scholar] [CrossRef]
  4. Dasgupta, P.; Stiglitz, J. Industrial structure and the nature of innovative activity. Econ. J. 1980, 90, 266–293. [Google Scholar] [CrossRef]
  5. Giuliani, E.; Bell, M. The micro-determinants of meso-level learning and innovation: Evidence from a Chilean wine cluster. Res. Policy 2005, 34, 47–68. [Google Scholar] [CrossRef]
  6. Huang, J.; Yin, Y.; Zheng, L.; Zhang, S.; Zhao, Q.; Chen, H. Life cycle assessment of construction and demolition waste from railway engineering projects. Comput. Intell. Neurosci. 2022, 2022, 6145755. [Google Scholar] [CrossRef] [PubMed]
  7. Kaewunruen, S.; Lian, Q. Digital twin aided sustainability-based lifecycle management for railway turnout systems. J. Clean. Prod. 2019, 228, 1537–1551. [Google Scholar] [CrossRef]
  8. Ciccone, A.; Stasio, S.D.; Asprone, D.; Salzano, A.; Nicolella, M. Application of openBIM for the management of existing railway infrastructure: Case study of the Cancello–Benevento railway line. Sustainability 2022, 14, 2283. [Google Scholar] [CrossRef]
  9. Saleh, A.; Remenyte-Prescott, R.; Prescott, D.; Chiachío, M. Intelligent and adaptive asset management model for railway sections using the iPN method. Reliab. Eng. Syst. Saf. 2024, 241, 109687. [Google Scholar] [CrossRef]
  10. Liu, J.; Schmid, F.; Li, K.; Zheng, W. A knowledge graph-based approach for exploring railway operational accidents. Reliab. Eng. Syst. Saf. 2021, 207, 107352. [Google Scholar] [CrossRef]
  11. Lefsrud, L.; Macciotta, R.; Nkoro, A. Performance-based regulations for safety management systems in the Canadian railway industry: An analytical discussion. Can. J. Civ. Eng. 2020, 47, 248–256. [Google Scholar] [CrossRef]
  12. Hidirov, S.; Guler, H. Reliability, availability and maintainability analyses for railway infrastructure management. Struct. Infrastruct. Eng. 2019, 15, 1221–1233. [Google Scholar] [CrossRef]
  13. Sadeghi, J.; Heydari, H.; Doloei, E.A. Improvement of railway maintenance approach by developing a new railway condition index. J. Transp. Eng. Part A Syst. 2017, 143, 04017037. [Google Scholar] [CrossRef]
  14. Hartmann, G.C.; Myers, M.B. Technical risk, product specifications, and market risk. In Taking Technical Risks: How Innovators, Executives, and Investors Manage High Tech Risks; Branscomb, L.M., Auerswald, P.E., Eds.; MIT Press: Cambridge, MA, USA, 2003; pp. 30–43. [Google Scholar]
  15. Ma, R.; Li, F.; Du, M. How does environmental regulation and digital finance affect green technological innovation: Evidence from China. Front. Environ. Sci. 2022, 10, 928320. [Google Scholar] [CrossRef]
  16. Anzola-Román, P.; Bayona-Sáez, C.; García-Marco, T. Organizational innovation, internal R&D and externally sourced innovation practices: Effects on technological innovation outcomes. J. Bus. Res. 2018, 91, 233–247. [Google Scholar]
  17. Li, L.; Chen, Q.; Li, X.; Gou, X. An improved PL-VIKOR model for risk evaluation of technological innovation projects with probabilistic linguistic term sets. Int. J. Fuzzy Syst. 2021, 23, 419–433. [Google Scholar] [CrossRef]
  18. Hao, Y.-H.; Li, W.-B.; Xu, X.-L. An early warning system for technological innovation risk management using artificial neural networks. In Proceedings of the 2007 International Conference on Management Science and Engineering, Harbin, China, 20–22 August 2007; pp. 2128–2133. [Google Scholar]
  19. Chen, Y.; Lin, P.; Tsao, H.-T.; Jin, S. How does Confucian culture affect technological innovation? Evidence from family enterprises in China. PLoS ONE 2022, 17, e0269220. [Google Scholar] [CrossRef]
  20. Bao, L.; Zhang, P.; Guo, Z.; Wang, W.; Zhu, Q.; Ding, Y. Supply–Demand Matching of Engineering Construction Materials in Complex Mountainous Areas Based on Complex Environment Two-Stage Stochastic Programing. Mathematics 2024, 12, 2683. [Google Scholar] [CrossRef]
  21. Esmailzadeh, M.; Noori, S.; Nouralizadeh, H.; Bogers, M.L.A.M. Investigating macro factors affecting the technological innovation system (TIS): A case study of Iran’s photovoltaic TIS. Energy Strategy Rev. 2020, 32, 100577. [Google Scholar] [CrossRef]
  22. Wu, J. Key Factors Influencing Enterprises Eco-technological Innovation. Tech. Econ. 2017, 36, 23–29. [Google Scholar]
  23. Zhu, C. Research on the Application of Hierarchical Analysis Method in Risk Evaluation of Technological Innovation. Master’s Thesis, Shanghai Jiao Tong Univinersity, Shanghai, China, 2012. [Google Scholar]
  24. Ma, Y.; Xue, L. Clan culture and enterprise technology innovation performance—Strategic response from the perspective of system complexity. Technol. Econ. 2024, 43, 121–133. [Google Scholar]
  25. Sun, R.; Liu, Y.; Gan, X. Study on key influencing factors of railway engineering construction management in complex and dangerous mountainous areas. Railr. Learn. J. 2021, 43, 163–170. [Google Scholar]
  26. Tang, Y. Research on Risk Management of Railway Bridge Engineering Technology in Western Dangerous Areas. Master’s Thesis, Central South University, Changsha, China, 2022. [Google Scholar]
  27. Liu, T.; Yang, X.; Guo, Y. Research on influencing factors of technological independent innovation of equipment manufacturing enterprises from the perspective of iceberg theory. Complexity 2021, 2021, 2551680. [Google Scholar] [CrossRef]
  28. Wang, P.; Wei, Q.; Zhao, G.; Wang, J.; Yin, Y. Safety Risk Identification Method for Railway Construction in Complex and Dangerous Areas. Sustainability 2022, 14, 13698. [Google Scholar] [CrossRef]
  29. Wan, B.; Bao, X.; Li, A. The Coupling Mechanism between Railway Alignment Design and Resource Environment in the Southwestern Mountainous Areas of China. Sustainability 2024, 16, 4572. [Google Scholar] [CrossRef]
  30. Dong, F. Research on Evaluation of the Application Effect of Technological Innovation in Large-Scale Complex Railway Engineering Construction. Master’s Thesis, Beijing Jiaotong University, Beijing, China, 2023. [Google Scholar]
  31. Haneda, S.; Ito, K. Organizational and human resource management and innovation: Which management practices are linked to product and/or process innovation? Res. Policy 2018, 47, 194–208. [Google Scholar] [CrossRef]
  32. Hwang, Y.; Lin, H.; Shin, D. Knowledge system commitment and knowledge sharing intention: The role of personal information management motivation. Int. J. Inf. Manag. 2018, 39, 220–227. [Google Scholar] [CrossRef]
  33. Rehm, S.-V.; Goel, L.; Junglas, I. Information management for innovation networks—An empirical study on the “who, what and how” in networked innovation. Int. J. Inf. Manag. 2016, 36, 348–359. [Google Scholar] [CrossRef]
  34. Sanz-Valle, R.; Jiménez-Jiménez, D. HRM and product innovation: Does innovative work behaviour mediate that relationship? Manag. Decis. 2018, 56, 1417–1429. [Google Scholar] [CrossRef]
  35. Wang, J.; Zhang, L. Research on the formation mechanism and influencing factors of technological innovation dynamic capability. Res. Tech. Econ. Manag. Study 2017, 10, 40–43. [Google Scholar]
  36. Zeng, L.; Zhang, J.; Chen, C. Research on key influencing factors of technology and management collaborative innovation in major construction projects. Technol. Adv. Steps Countermeas. 2016, 33, 7–11. [Google Scholar]
  37. Cheng, M.; Wang, J.; Yang, S.; Li, Q. The driving effect of technological innovation on green development: From the perspective of efficiency. Energy Policy 2024, 188, 114089. [Google Scholar] [CrossRef]
  38. Wang, R.; Qi, L.; Wang, L. Analysis of influencing factors and complex configuration of technological innovation in Chinese enterprises. Sci. Res. Manag. Texture 2024, 45, 42–52. [Google Scholar]
  39. Dai, S.; Li, Y.; Zhang, W. Framework of influencing factors and path of technology innovation alliance—Exploration based on grounded theory Journal of Sex Research. Technol. Prog. Countermeas. 2019, 36, 17–25. [Google Scholar]
  40. Chen, J. Research on Risk Evaluation and Control of Ah Enterprise Breakthrough Technological Innovation. Master’s Thesis, Northeast Petroleum University, Daqing, China, 2021. [Google Scholar]
  41. Wang, H.; Ding, J. Study on influencing factors of coordinated operation of military-civilian technology innovation system. Technol. Prog. Countermeas. 2016, 33, 112–116. [Google Scholar]
  42. Parry, M.E.; Song, X.M. Identifying new product successes in China. J. Prod. Innov. Manag. 1994, 11, 15–30. [Google Scholar] [CrossRef]
  43. Liu, Y.; Zhang, Q. Research on risk early warning index system of technological innovation in high-tech enterprises. J. Shenzhen Univ. (Humanit. Soc. Sci. Stud. Ed.) 2011, 28, 77–83. [Google Scholar]
  44. Elmuti, D.; Kathawala, Y. An overview of strategic alliances. Manag. Decis. 2001, 39, 205–218. [Google Scholar] [CrossRef]
  45. Wang, Q.; Jin, H.; Cai, C. Research on the dual risk network characteristics and evolution of railway engineering technology innovation based on SNA study carefully. J. Railw. Sci. Eng. 2024, 21, 4288–4298. [Google Scholar]
  46. Guo, Z.; Wang, Q. Technological innovation cooperative behavior analysis for mega construction projects based on TPB. J. Civ. Eng. Manag. 2024, 30, 494–507. [Google Scholar] [CrossRef]
  47. Liu, Y.; Wu, W.; Wang, Y. The impacts of technology management on product innovation: The role of technological capability. IEEE Access 2020, 8, 210722–210732. [Google Scholar] [CrossRef]
  48. Yin, Z. Research on the evaluation index system of technological innovation risk for small and medium-sized enterprises. J. Cent. Univ. Financ. Econ. 2011, 10, 78–81. [Google Scholar]
  49. Liu, Y. Research on Risk Evaluation of Technological Innovation in Construction Enterprises. Master’s Thesis, North China University of Technology, Beijing, China, 2018. [Google Scholar]
  50. Jiang, L. The risk and control of technological innovation in small and medium-sized enterprises. Value Eng. 2011, 30, 72–73. [Google Scholar]
  51. Miao, C.; Fang, D.; Sun, L.; Luo, Q.; Yu, Q. Driving effect of technology innovation on energy utilization efficiency in strategic emerging industries. J. Clean. Prod. 2018, 170, 1177–1184. [Google Scholar] [CrossRef]
  52. Rodríguez-Sánchez, J.-L.; Montero-Navarro, A.; Gallego-Losada, R. The opportunity presented by technological innovation to attract valuable human resources. Sustainability 2019, 11, 5785. [Google Scholar] [CrossRef]
  53. Ryu, D.; Baek, K.H.; Yoon, J. Open innovation with relational capital, technological innovation capital, and international performance in SMEs. Sustainability 2021, 13, 3418. [Google Scholar] [CrossRef]
  54. Lin, S.; Xie, Y.; Wang, Z.; Zhong, L.; Xiao, L.; Wang, S. Air pollution and technological innovation in China: A two-way dynamic perspective. In Environment, Development and Sustainability; Springer: Berlin/Heidelberg, Germany, 2024; pp. 1–21. [Google Scholar]
  55. Chen, Y.; Liu, J.; Xie, K. Risk in integrated leapfrogging mode of technological innovation. Kybernetes 2012, 41, 1423–1439. [Google Scholar] [CrossRef]
  56. Chen, Q.; Rao, S.; Wang, S. Performance evaluation of reconnaissance satellite intelligence processing system based on combined weighting method and Vague set. J. Chin. Acad. Electron. Sci. 2022, 17, 856–861. [Google Scholar]
  57. Zhang, Q.; Zhao, F.; Yang, J.; Wang, G. Three-way decisions of rough vague sets from the perspective of fuzziness. Inf. Sci. 2020, 523, 111–132. [Google Scholar] [CrossRef]
  58. Yager, R.R. On the measure of fuzziness and negation. II. Lattices. Inf. Control 1980, 44, 236–260. [Google Scholar] [CrossRef]
  59. Zadeh, L.A. Fuzzy sets. Inf. Control 1965, 8, 338–353. [Google Scholar] [CrossRef]
  60. Zhang, Q.; Zhao, F.; Yang, J. The uncertainty analysis of vague sets in rough approximation spaces. IEEE Access 2018, 7, 383–395. [Google Scholar] [CrossRef]
  61. Han, Y.; Han, P.; Yuan, B.; Zhang, Z.; Liu, L.; Panneerselvam, J. Design and Application of Vague Set Theory and Adaptive Grid Particle Swarm Optimization Algorithm in Resource Scheduling Optimization. J. Grid Comput. 2023, 21, 24. [Google Scholar] [CrossRef] [PubMed]
  62. Yang, D.; Tsai, W.-T. Linear Consensus Protocol Based on Vague Sets and Multi-Attribute Decision-Making Methods. Electronics 2024, 13, 2461. [Google Scholar] [CrossRef]
  63. Liu, J.-Q.; Wei, Q.; Wang, P. Risk assessment based on combined weighting-cloud model of tunnel construction. Teh. Vjesn. 2021, 28, 203–210. [Google Scholar]
Figure 1. Cloud diagram of social risk factors.
Mathematics 13 01970 g001
Figure 2. Cloud diagram of environmental risk factors.
Mathematics 13 01970 g002
Figure 3. Cloud diagram of management risk factors.
Mathematics 13 01970 g003
Figure 4. Cloud diagram of technological risk factors.
Mathematics 13 01970 g004
Figure 5. Cloud diagram of resource risk factors.
Mathematics 13 01970 g005
Table 1. Social risk factors indicators.
Primary Risk IndicatorsSecondary Risk IndicatorsReference
Social factorsPublic opinionEsmailzadeh, M. [21]; Wu, J. [22]
Cultural and religious conflictsZhu, C. [23]; Ma, Y. [24]
Insufficient cultural heritage protectionZhu, C. [23]
Poor communication conditionsSun, Y. [25]; Tang, Y. [26]
Inconvenient transportationLiu, T. [27]; Sun, Y. [25]
Insufficient energy supplySun, Y. [25]
Poor medical conditionsSun, Y. [25]
Table 2. Environmental risk factors indicators.
Primary Risk IndicatorsSecondary Risk IndicatorsReference
Environmental factorsFragile ecological environmentWu, J. [22];Tang, Y. [26]
Frequent disastersSun, Y. [25]
Intense ultraviolet radiationSun, Y. [25]
Low temperatureDong, F. [30]
Unstable geological structureTang, Y. [26]
Low atmospheric oxygen contentDong, F. [30]
Table 3. Management risk factors indicators.
Primary Risk IndicatorsSecondary Risk IndicatorsReference
Management factorsLeadership management level and capability are inadequateWang, J. [35]; Zeng, L. [36]
Insufficient intellectual property protectionFan, D. [37]; Liu, T. [27]
Lack of corporate leadershipWang, R. [38]
Imperfect benefit distribution mechanismDai, S. [39]; Chen, J. [40]
Poor organizational management capabilitiesWang, H. [41]; Parry, M. [42]
Project decision-making riskLiu, Y. [43]; Elmuti, D. [44]
Poor organizational coordinationWang, Q. [45]; Guo, Z. [46]
Insufficient information management levelDong, F. [30]; Liu, T. [27]
Imperfect technological innovation incentive mechanismWang, J. [35]; Anzola-Román, P. [16]
Table 4. Technological risk factors indicators.
Primary Risk IndicatorsSecondary Risk IndicatorsReference
Technological factorsInsufficient degree of technological integrationWang, Q. [45]; Dai, S. [39]
Inadequate technological advancementYin, Z. [48]; Parry, M. [42]
Unsatisfactory technological maturityWang, H. [41]; Liu, Y. [49]
Low technological safetyTang, Y. [26]
Mismatch between new technologies and demandJiang, L. [50]
High substitutability of technologyLiu, Y. [49]
Short technological lifecycleZhu, C. [23]
Insufficient technological accumulationZeng, L. [36]; Jiang, L. [50]
Uncertainty of technological effectivenessYin, Z. [48];
High application difficulty of technological innovation resultsZhang, N. [51]
Poor environmental adaptability of new technologiesWang, Q. [45]
Table 5. Resource risk factors indicators.
Primary Risk IndicatorsSecondary Risk IndicatorsReference
Resource factorsInsufficient technological innovation capability of the research teamRyu, D. [53]
Loss of technological innovation personnelLin, S. [54]; Chen, Y. [55]
Untimely supply of fundsLiu, T. [27]
Low level of material and equipment supportWang, Q. [45]
Table 6. Indicator selection process.
Serial NumberRisk Indicators t A ( x i ) π A ( x i ) f A ( x i ) S A ( x i )
1Public opinion0.10.30.6−0.65
2Cultural and religious conflicts0.60.20.20.48
3Insufficient cultural heritage protection0.20.10.7−0.55
4Poor communication conditions0.60.20.20.48
5Inconvenient transportation0.70.300.91
6Insufficient energy supply0.60.30.10.65
7Poor medical conditions0.70.10.20.55
8Fragile ecological environment0.70.20.10.72
9Frequent disasters0.50.40.10.56
10Intense ultraviolet radiation0.60.10.30.33
11Low temperature0.60.400.84
12Unstable geological structure0.60.30.10.65
13Low atmospheric oxygen content0.60.20.20.48
14Leadership management level and capability are inadequate0.70.10.20.55
15Insufficient intellectual property protection0.60.400.84
16Lack of corporate leadership0.30.50.20.15
17Imperfect benefit distribution mechanism0.30.20.5−0.24
18Poor organizational management capabilities0.50.10.40.11
19Project decision-making risk0.30.50.20.15
20Poor organizational coordination0.60.20.20.48
21Insufficient information management level0.50.40.10.56
22Imperfect technological innovation incentive mechanism0.50.40.10.56
23Insufficient degree of technological integration0.800.20.6
24Inadequate technological advancement0.70.300.91
25Unsatisfactory technological maturity0.70.20.10.72
26Low technological safety0.20.50.3−0.15
27Mismatch between new technologies and demand0.70.300.91
28High substitutability of technology0.40.30.30.13
29Short technological lifecycle0.20.50.3−0.15
30Insufficient technological accumulation0.20.40.4−0.28
31Uncertainty of technological effectiveness0.30.30.4−0.13
32High application difficulty of technological innovation results0.50.30.20.39
33Poor environmental adaptability of new technologies0.70.20.10.72
34Insufficient technological innovation capability of the research team0.70.300.91
35Loss of technological innovation personnel0.50.40.10.56
36Untimely supply of funds0.60.400.84
37Low level of material and equipment support0.60.20.20.48
Table 7. List of risk indicators.
Primary Risk IndicatorsSecondary Risk Indicators
Social factorsCultural and religious conflicts
Poor communication conditions
Inconvenient transportation
Insufficient energy supply
Poor medical conditions
Environmental factorsFragile ecological environment
Frequent disasters
Intense ultraviolet radiation
Low temperature
Unstable geological structure
Low atmospheric oxygen content
Management factorsLeadership management level and capability are inadequate
Insufficient intellectual property protection
Poor organizational coordination
Insufficient information management level
Imperfect technological innovation incentive mechanism
Technological factorsInsufficient degree of technological integration
Inadequate technological advancement
Unsatisfactory technological maturity
Mismatch between new technologies and demand
High application difficulty of technological innovation results
Poor environmental adaptability of new technologies
Resource factorsInsufficient technological innovation capability of the research team
Loss of technological innovation personnel
Untimely supply of funds
Low level of material and equipment support
Table 8. Determination of subjective weights for risk indicators.
Primary Risk IndicatorsWeightsSecondary Risk IndicatorsWeights
Social factors0.0513Cultural and religious conflicts0.0601
Poor communication conditions0.1033
Inconvenient transportation0.1603
Insufficient energy supply0.4276
Poor medical conditions0.2488
Environmental factors0.2607Fragile ecological environment0.0592
Frequent disasters0.3973
Intense ultraviolet radiation0.1935
Low temperature0.0711
Unstable geological structure0.1935
Low atmospheric oxygen content0.0854
Management factors0.0882Leadership management level and capability are inadequate0.0725
Insufficient intellectual property protection0.1553
Poor organizational coordination0.0725
Insufficient information management level0.2410
Imperfect technological innovation incentive mechanism0.4587
Technological factors0.4481Insufficient degree of technological integration0.0984
Inadequate technological advancement0.0682
Unsatisfactory technological maturity0.4149
Mismatch between new technologies and demand0.1856
High application difficulty of technological innovation results0.0473
Poor environmental adaptability of new technologies0.1856
Resource factors0.1517Insufficient technological innovation capability of the research team0.1348
Loss of technological innovation personnel0.0778
Untimely supply of funds0.2653
Low level of material and equipment support0.5221
Table 9. Scoring criteria for EWM.
Scoring CriteriaEvaluation Level
(90, 100]Very important
(80, 90]Quite important
(70, 80]Moderately important
(60, 70]Not important
[0, 60]Very not important
Table 10. Determination of objective weights for risk indicators.
Primary Risk IndicatorsWeightsSecondary Risk IndicatorsWeights
Social factors0.2200Cultural and religious conflicts0.5066
Poor communication conditions0.1352
Inconvenient transportation0.1352
Insufficient energy supply0.0870
Poor medical conditions0.1359
Environmental factors0.1932Fragile ecological environment0.1193
Frequent disasters0.1556
Intense ultraviolet radiation0.2599
Low temperature0.1484
Unstable geological structure0.1267
Low atmospheric oxygen content0.1900
Management factors0.1651Leadership management level and capability are inadequate0.4236
Insufficient intellectual property protection0.3024
Poor organizational coordination0.1787
Insufficient information management level0.0732
Imperfect technological innovation incentive mechanism0.0221
Technological factors0.1869Insufficient degree of technological integration0.1842
Inadequate technological advancement0.1738
Unsatisfactory technological maturity0.1317
Mismatch between new technologies and demand0.0951
High application difficulty of technological innovation results0.3035
Poor environmental adaptability of new technologies0.1118
Resource factors0.2349Insufficient technological innovation capability of the research team0.3178
Loss of technological innovation personnel0.3128
Untimely supply of funds0.1902
Low level of material and equipment support0.1792
Table 11. Determination of combined weights for indicators.
Primary Risk IndicatorsWeightsSecondary Risk IndicatorsWeights
Social factors0.0577Cultural and religious conflicts0.2221
Poor communication conditions0.1019
Inconvenient transportation0.1581
Insufficient energy supply0.2713
Poor medical conditions0.2466
Environmental factors0.2575Fragile ecological environment0.0414
Frequent disasters0.3627
Intense ultraviolet radiation0.2950
Low temperature0.0619
Unstable geological structure0.1438
Low atmospheric oxygen content0.0952
Management factors0.0744Leadership management level and capability are inadequate0.2594
Insufficient intellectual property protection0.3966
Poor organizational coordination0.1094
Insufficient information management level0.1490
Imperfect technological innovation incentive mechanism0.0856
Technological factors0.4282Insufficient degree of technological integration0.1319
Inadequate technological advancement0.0863
Unsatisfactory technological maturity0.3978
Mismatch between new technologies and demand0.1285
High application difficulty of technological innovation results0.1045
Poor environmental adaptability of new technologies0.1510
Resource factors0.1822Insufficient technological innovation capability of the research team0.2028
Loss of technological innovation personnel0.1152
Untimely supply of funds0.2389
Low level of material and equipment support0.4430
Table 12. Risk factors evaluation levels.
Risk LevelLower RiskLow RiskModerate RiskHigh RiskHigher Risk
Scoring criteria[0, 2)[2, 4)[4, 6)[6, 8)[8, 10]
Table 13. Standard cloud model parameters.
Risk LevelGrade IntervalCloud Model Characteristic Parameters
Lower risk[0, 2)(1, 0.333, 0.03)
Low risk[2, 4)(3, 0.333, 0.03)
Moderate risk[4, 6)(5, 0.333, 0.03)
High risk[6, 8)(7, 0.333, 0.03)
Higher risk[8, 10](9, 0.333, 0.03)
Table 14. Secondary indicator evaluation cloud parameters.
Primary Risk IndicatorsSecondary Risk IndicatorsCloud Parameters
Social factorsCultural and religious conflicts(6.38, 0.3008, 0.0491)
Poor communication conditions(6.27, 0.2883, 0.1216)
Inconvenient transportation(6.51, 0.2657, 0.0772)
Insufficient energy supply(6.53, 0.2707, 0.0655)
Poor medical conditions(6.34, 0.2958, 0.1876)
Environmental factorsFragile ecological environment(8.48, 0.2557, 0.2075)
Frequent disasters(8.42, 0.1755, 0.0110)
Intense ultraviolet radiation(8.40, 0.2757, 0.1988)
Low temperature(8.22, 0.3008, 0.1421)
Unstable geological structure(8.46, 0.2908, 0.1643)
Low atmospheric oxygen content(8.31, 0.2406, 0.0598)
Management factorsLeadership management level and capability are inadequate(5.87, 0.1554, 0.0201)
Insufficient intellectual property protection(5.97, 0.2883, 0.0382)
Poor organizational coordination(6.03, 0.2456, 0.1406)
Insufficient information management level(5.91, 0.2883, 0.1637)
Imperfect technological innovation incentive mechanism(5.94, 0.2607, 0.1301)
Technological factorsInsufficient degree of technological integration(7.92, 0.2958, 0.0591)
Inadequate technological advancement(7.90, 0.1755, 0.0836)
Unsatisfactory technological maturity(7.97, 0.0602, 0.0306)
Mismatch between new technologies and demand(8.09, 0.2406, 0.0556)
High application difficulty of technological innovation results(7.91, 0.2632, 0.1718)
Poor environmental adaptability of new technologies(7.95, 0.1880, 0.0277)
Resource factorsInsufficient technological innovation capability of the research team(3.87, 0.2381, 0.1377)
Loss of technological innovation personnel(3.93, 0.1955, 0.1140)
Untimely supply of funds(3.82, 0.2807, 0.1277)
Low level of material and equipment support(3.69, 0.2908, 0.0989)
Table 15. Cloud parameters for primary indicators evaluation.
Primary Risk IndicatorsComprehensive Evaluation Cloud Parameters
Social factors(6.4202, 0.2849, 0.0995)
Environmental factors(8.3995, 0.2441, 0.1094)
Management factors(5.9369, 0.2530, 0.0713)
Technological factors(7.9635, 0.1888, 0.0565)
Resource factors(3.7848, 0.2687, 0.1154)
Disclaimer/Publisher’s Note: The statements, opinions and data contained in all publications are solely those of the individual author(s) and contributor(s) and not of MDPI and/or the editor(s). MDPI and/or the editor(s) disclaim responsibility for any injury to people or property resulting from any ideas, methods, instructions or products referred to in the content.

