
Predictive Analysis of Carbon Emissions in China’s Construction Industry Based on GIOWA Model


Abstract
1. Introduction
2. Methodology
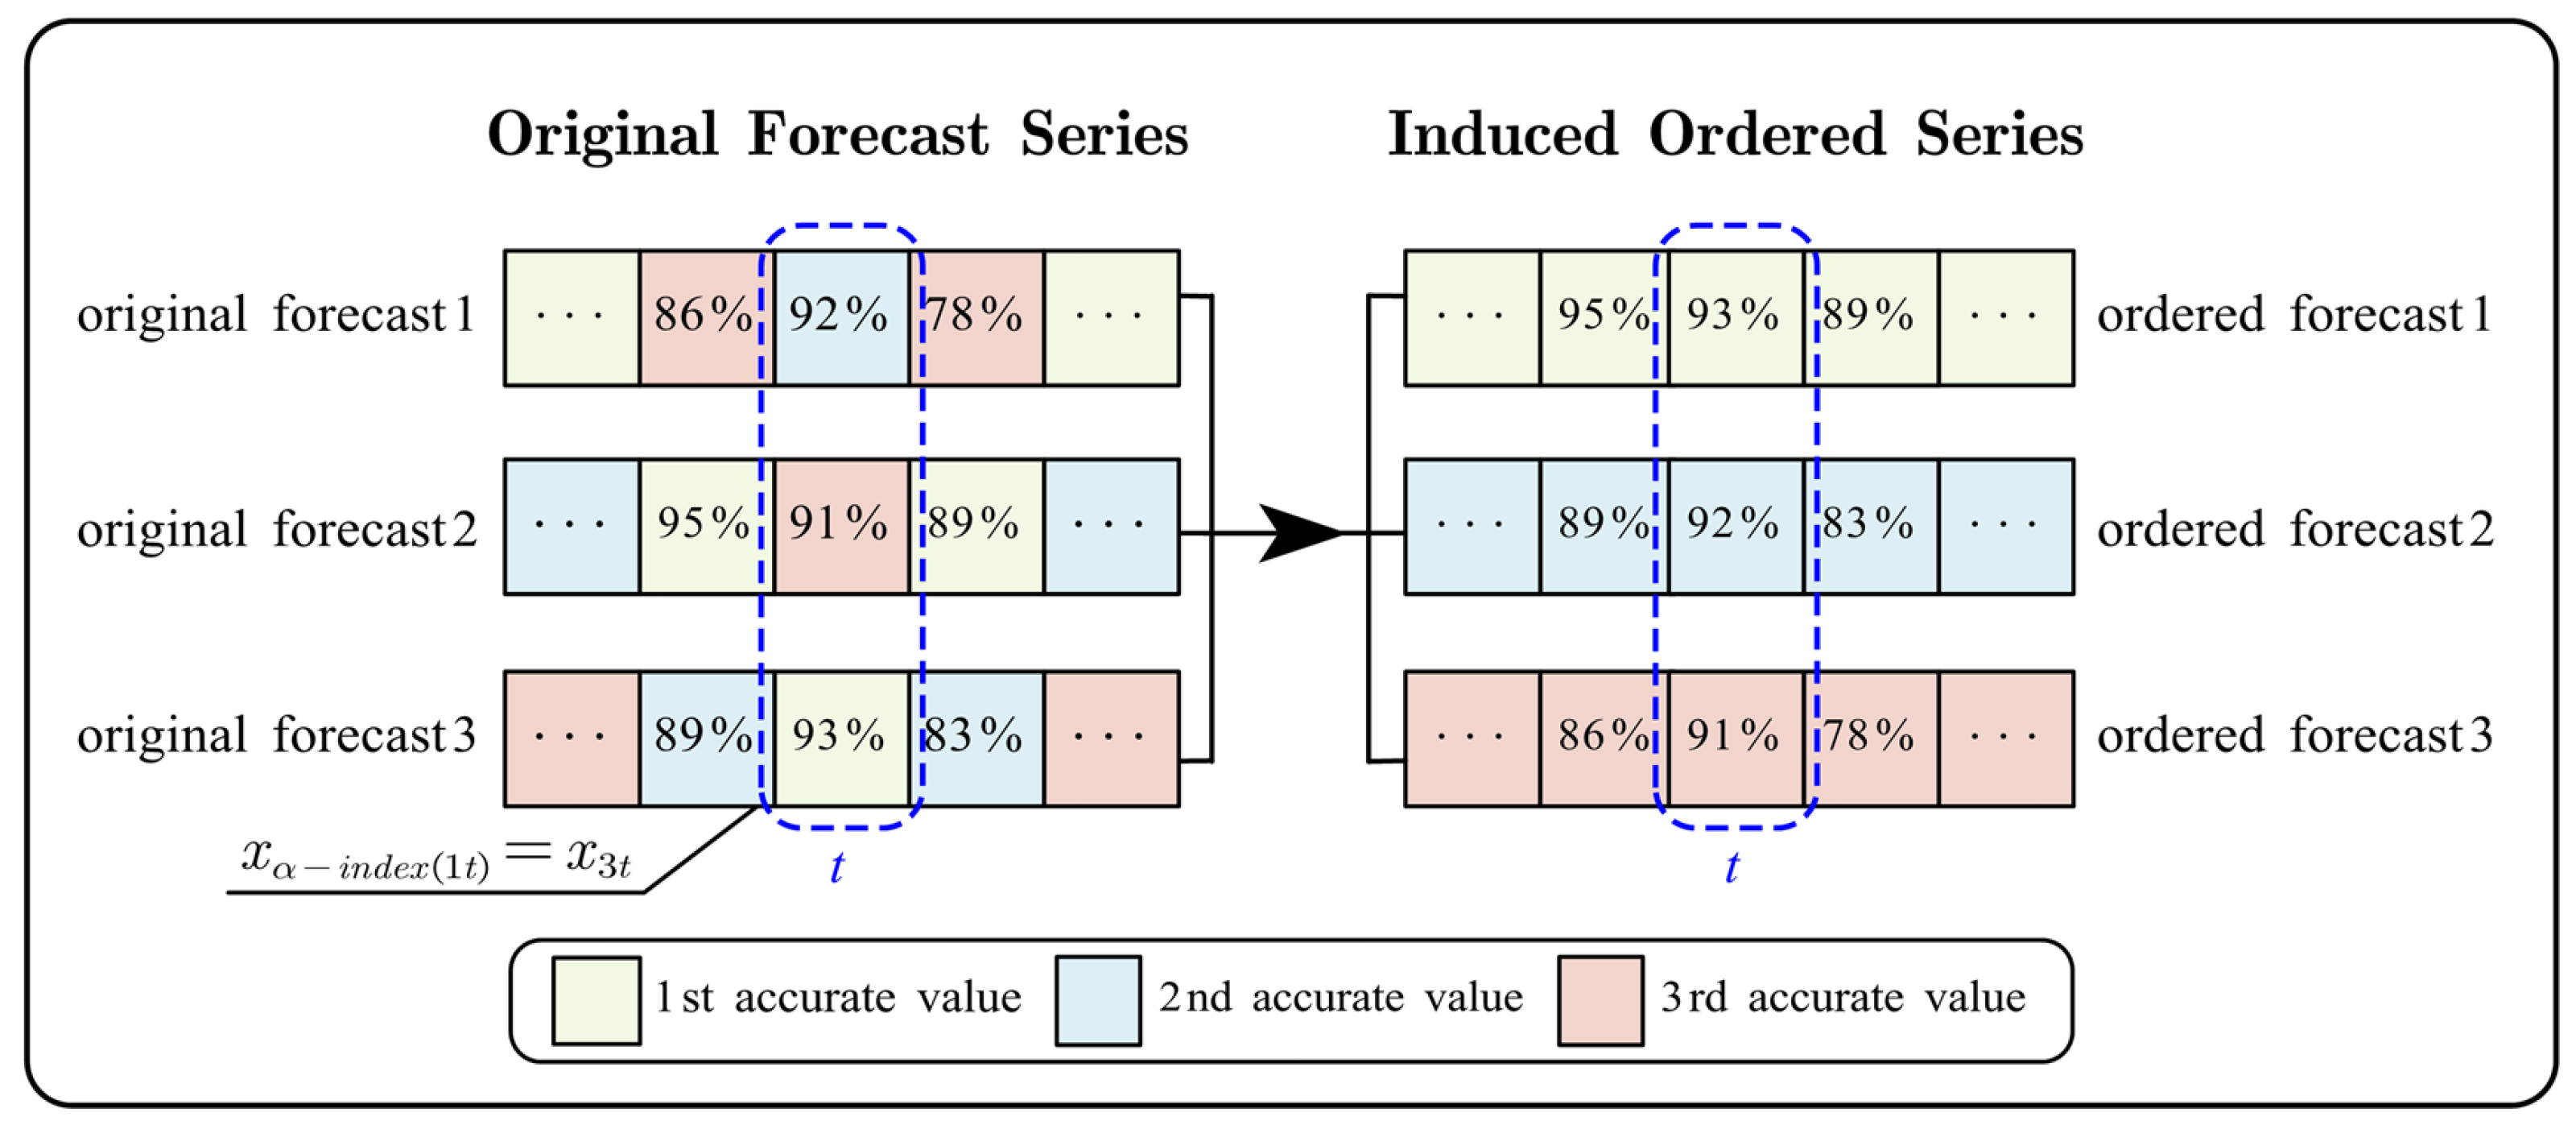
2.1. GIOWA Combination Forecasting Model
2.2. Individual Forecasting Models
2.2.1. Support Vector Regression Model
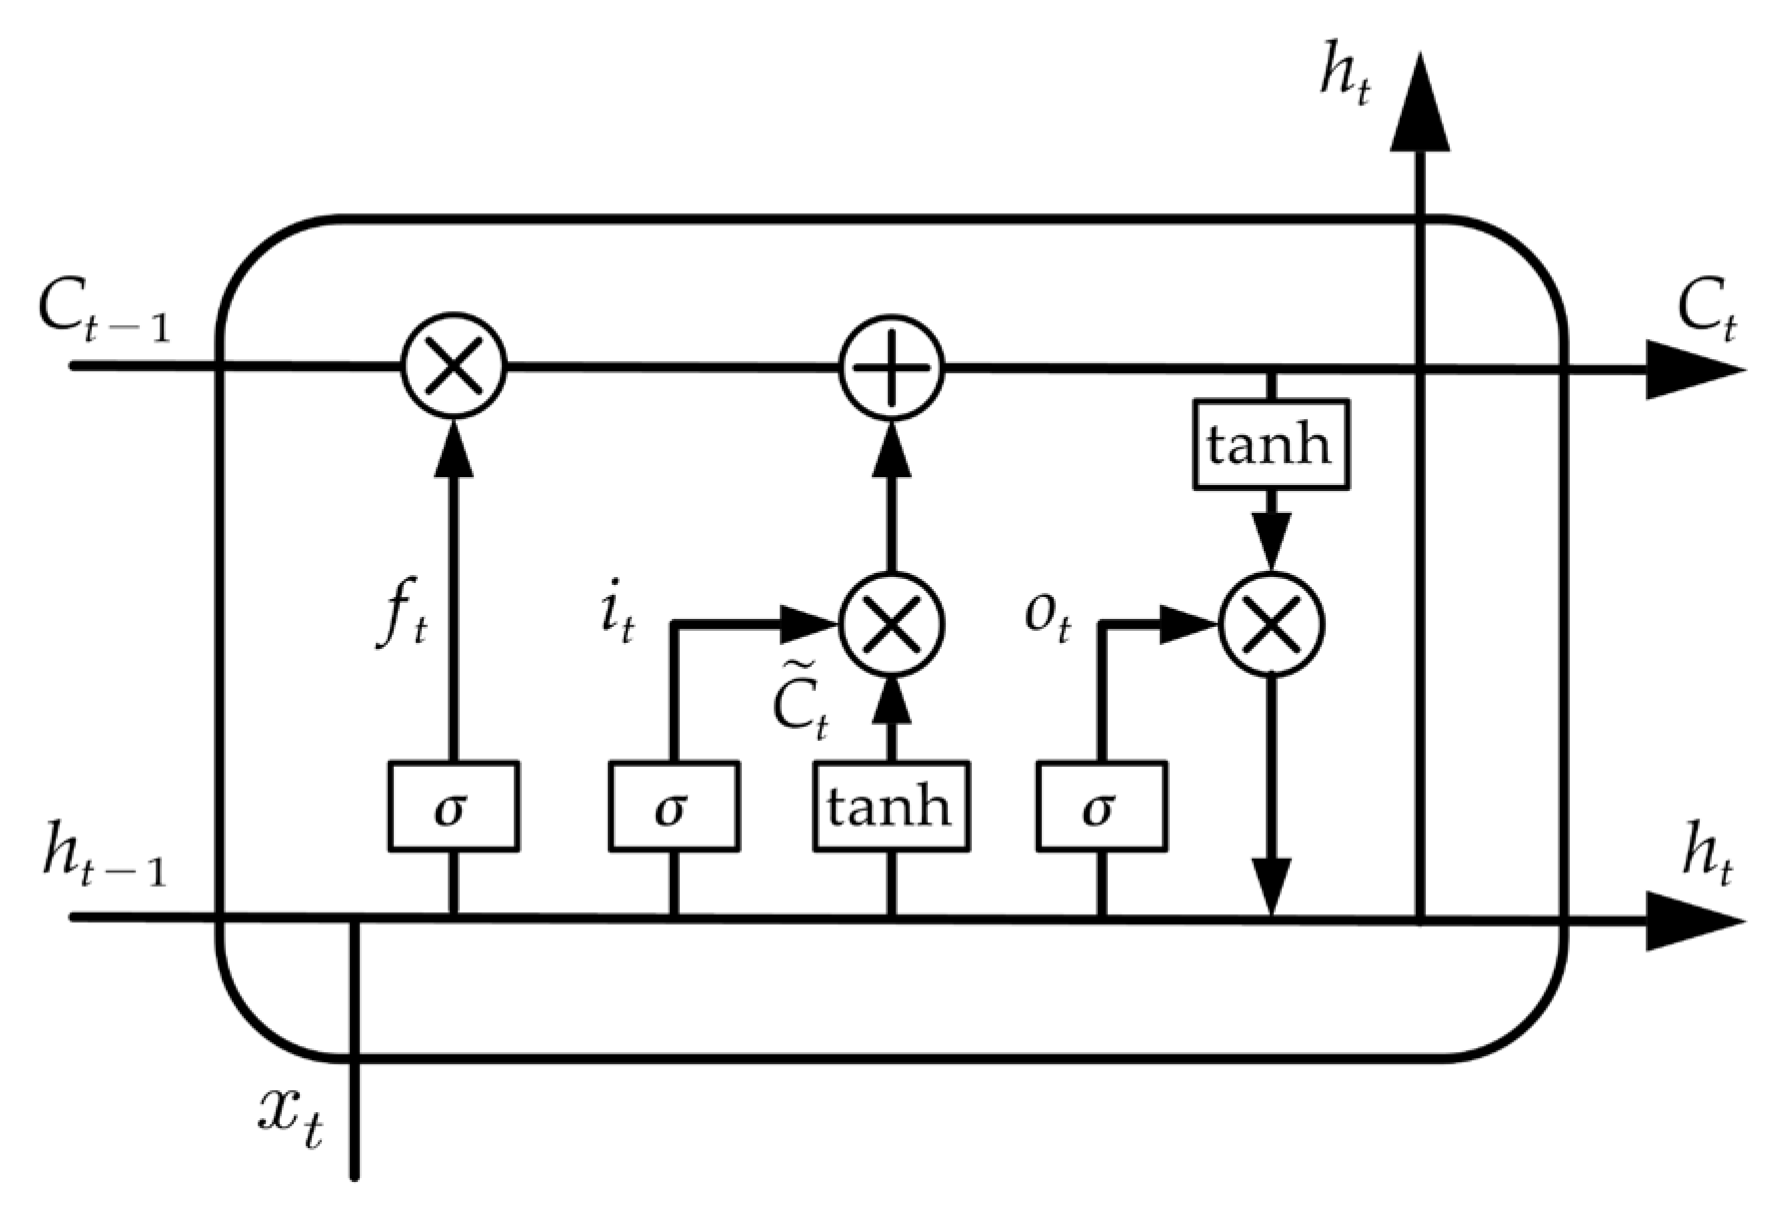
2.2.2. Long Short-Term Memory Neural Network
2.3. Evaluation Metrics
3. Case Study
3.1. In-Sample Forecasting Results and Analysis
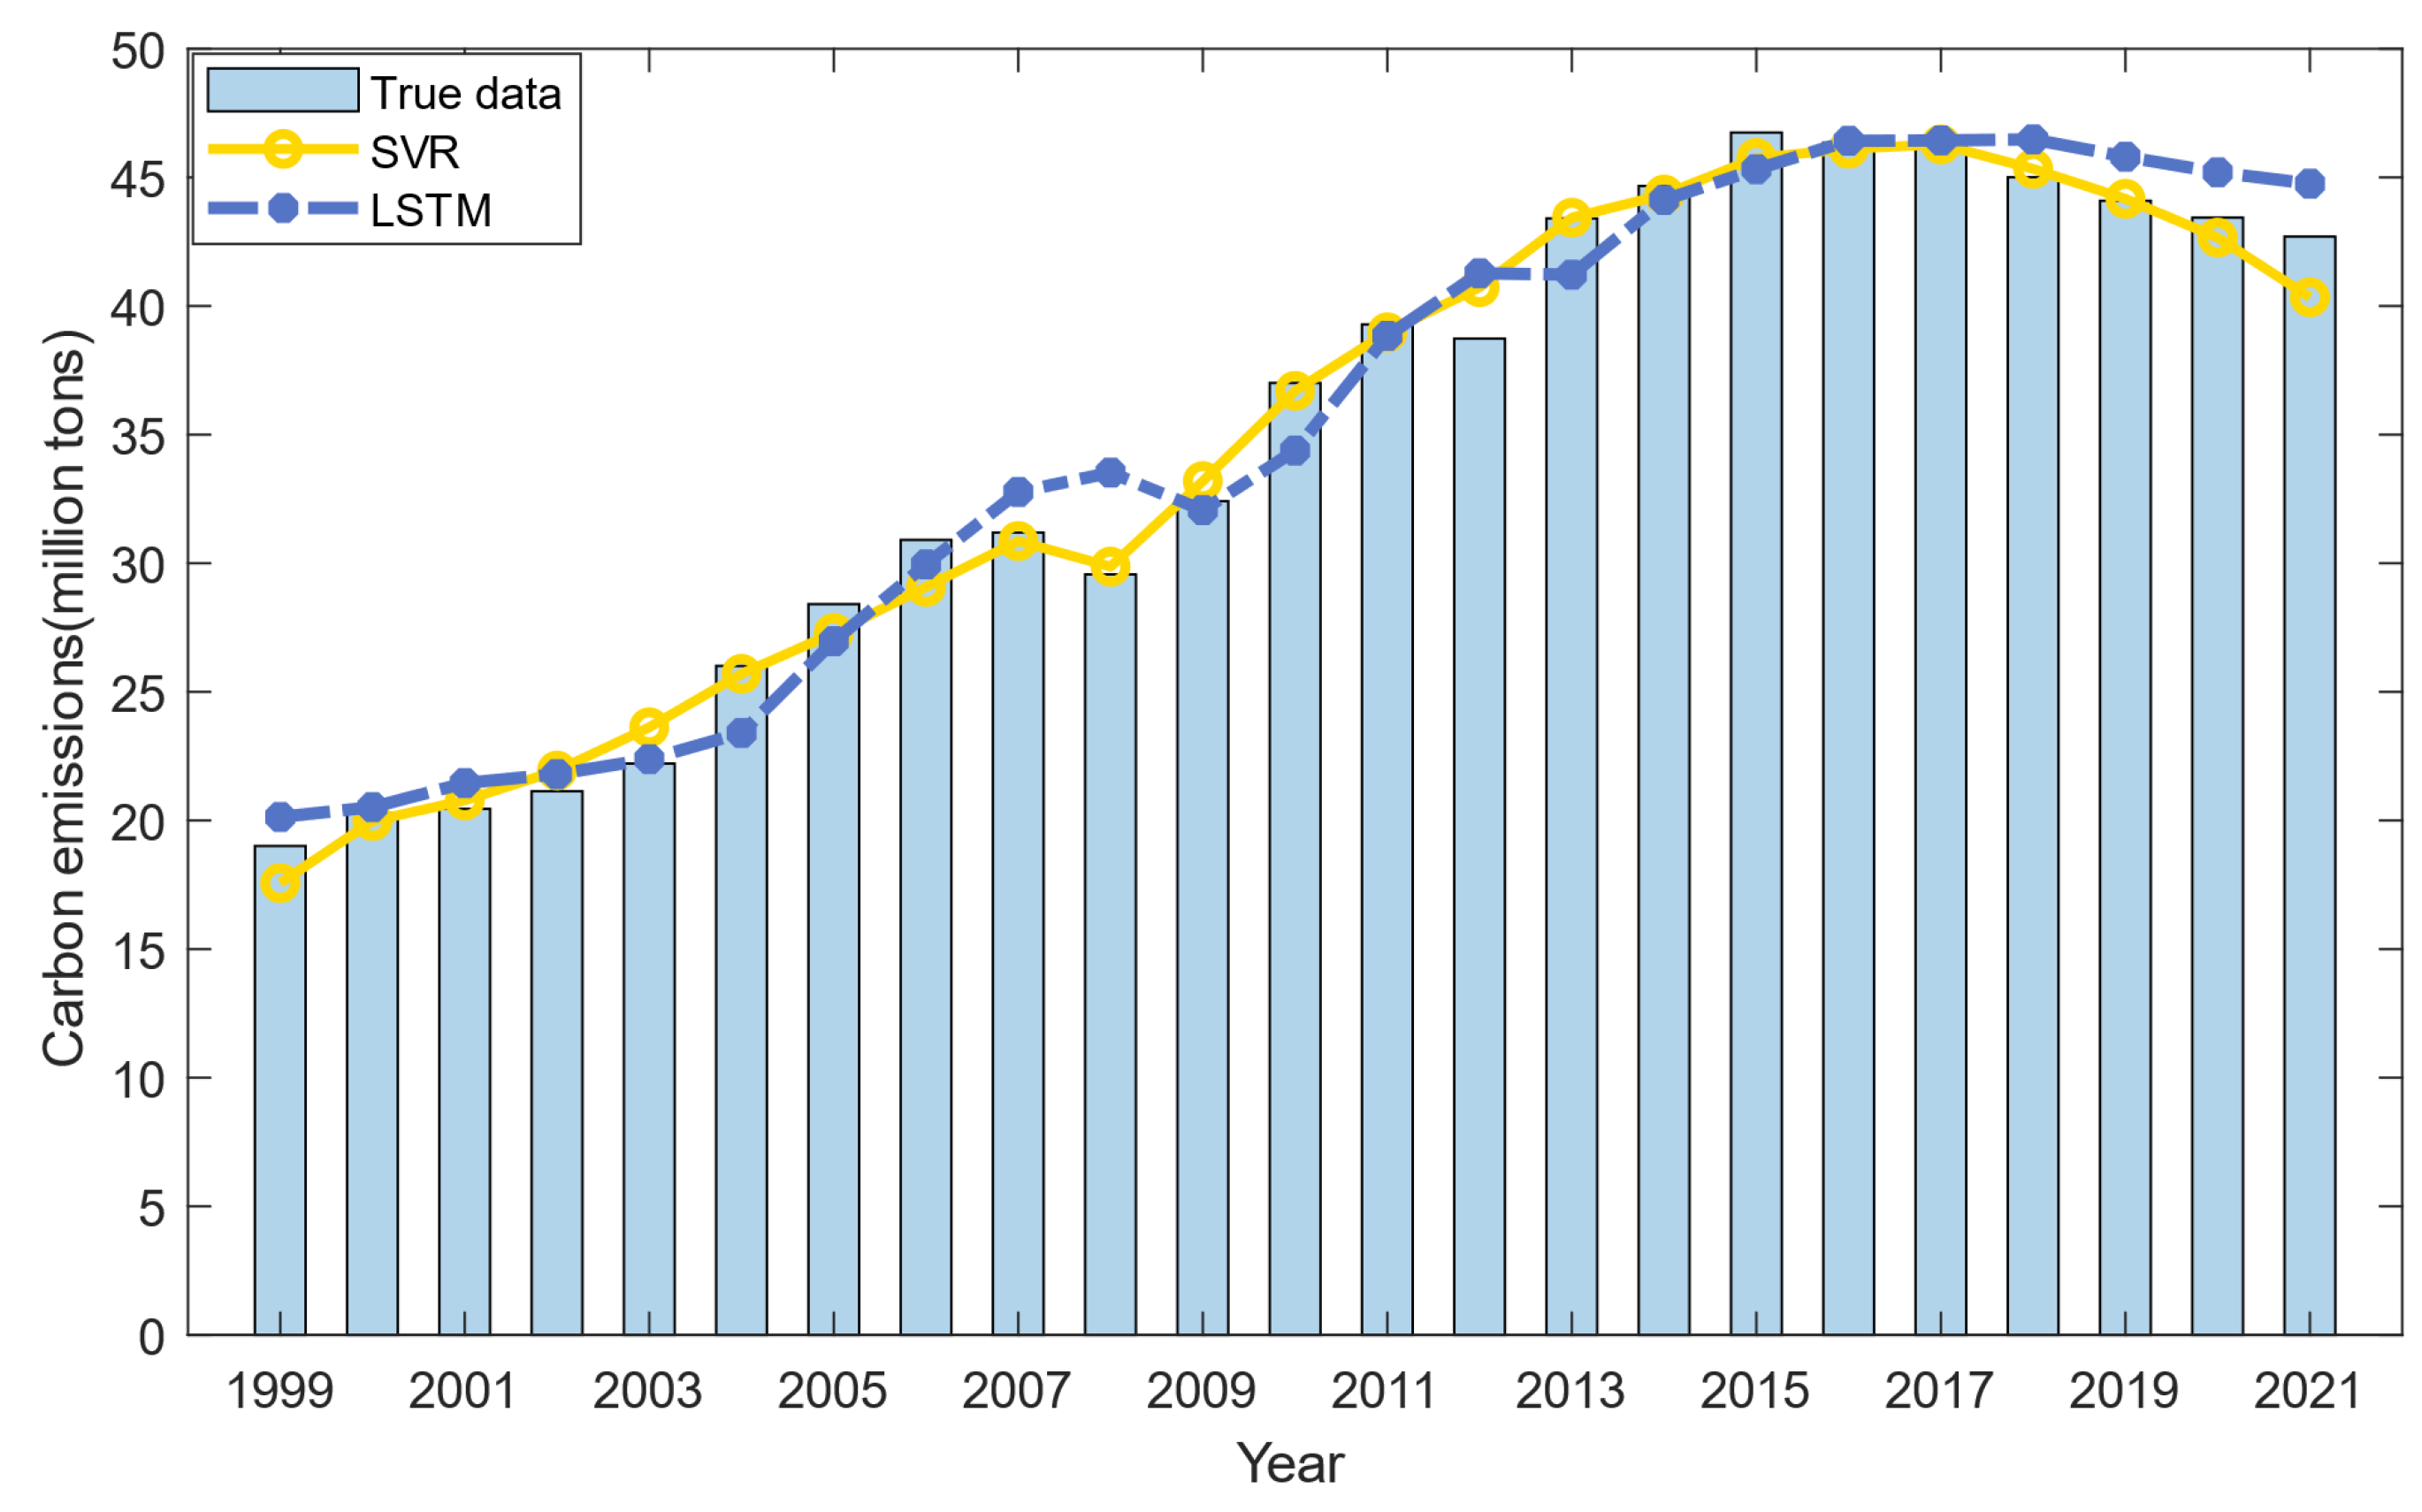
3.1.1. SVR-Based Predictions
3.1.2. LSTM-Based Predictions
3.1.3. GIOWA Combination Forecasting Results
3.2. Out-of-Sample Forecasting Results and Analysis
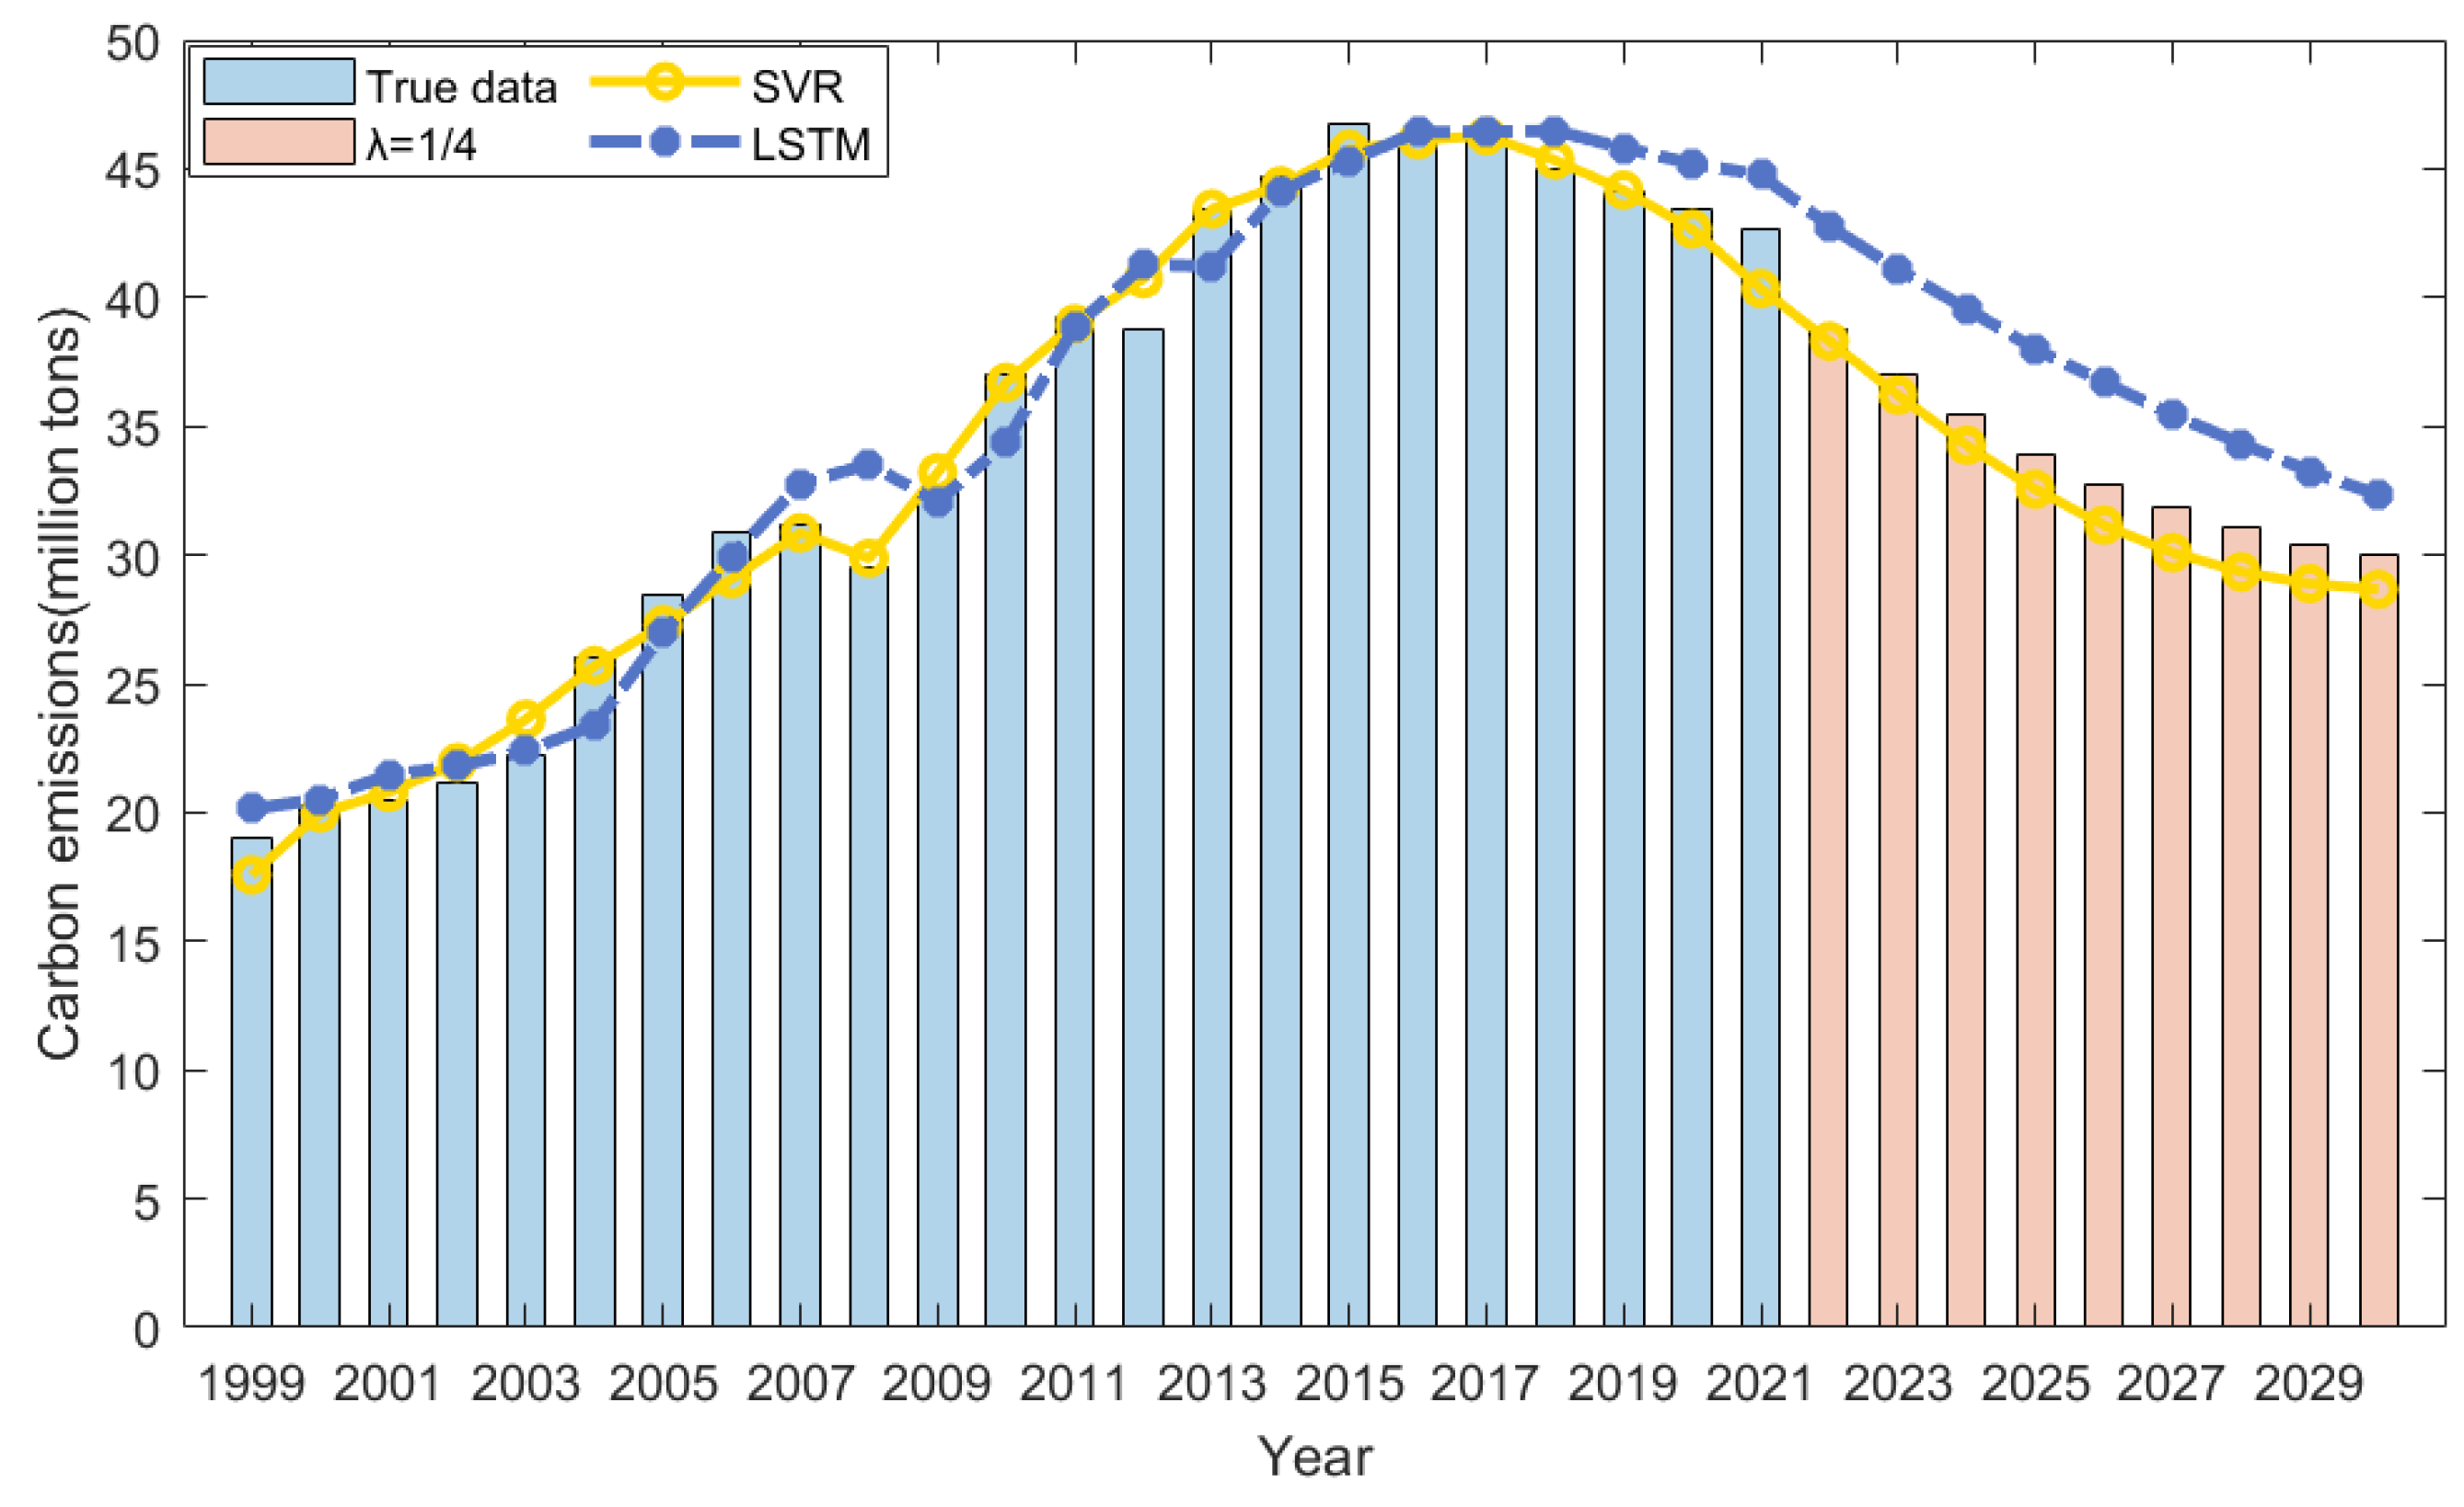
3.2.1. Prediction Results of Individual Models
3.2.2. Prediction Results of the GIOWA Model
4. Conclusions
- (1)
- Both SVR and LSTM models prove to be effective for forecasting carbon emissions in China’s construction industry, with their accuracy surpassing 95%. The prediction results of the SVR and LSTM models indicate that the carbon emissions in China’s construction industry will continue to decrease from 2022 to 2030. Therefore, the Chinese government should implement targeted strategies, including moderating the labor demands of the construction industry [61], advancing new-type urbanization [62], and optimizing the energy consumption structure [63,64], so as to sustain the downward trend in construction carbon emissions. Given that the residuals of the SVR and LSTM models exhibit opposite signs relative to the zero-error baseline, the prediction accuracy can be further enhanced with forecast combination techniques.
- (2)
- The GIOWA combination forecasting model demonstrates superior predictive performance across varying averaging exponent λ, with all prediction accuracy exceeding 98%, outperforming the individual models on four key error metrics including RMSRE and MAPE. Therefore, the GIOWA model is more effective and accurate in capturing nonlinear variation characteristics in construction carbon emissions and generating reliable projections. Based on the forecast results, the carbon emissions of the construction industry will reduce to 29.99 million tons of CO2 by 2030, representing a reduction of nearly 35% compared to the peak of 46.52 million tons in 2017. This indicates that the construction industry in China is transitioning from extensive development patterns to green intensive practices, attributable to China’s nationwide promotion of prefabricated buildings [65] and energy-efficient construction technologies [66,67]. However, given that a deceleration in the carbon emission reduction rate from 4.81% to 1.66% is projected during the forecast period, the Chinese government, the construction industry, and relevant sectors must collaborate closely to guarantee the timely realization of the dual carbon goals.
- (3)
- There are certain limitations in this study. Current analysis is established on national-level annual emission data due to availability constraints. Subsequent studies can employ provincial or municipal datasets with a quarterly or monthly frequency to enhance spatial resolution and temporal granularity, thereby facilitating real-time emission monitoring and the implementation of dynamic early-warning mechanisms. Additionally, the current research remains deficient in exploring the impact of uncertainty on the combination forecasting results. This gap will be addressed and investigated more thoroughly in future studies.
Author Contributions
Funding
Data Availability Statement
Conflicts of Interest
Abbreviations
| GIOWA | Generalized induced ordered weighted averaging |
| SVR | Support vector regression |
| LSTM | Long short-term memory |
| GM | Grey model |
| OWA | Ordered weighted averaging |
| IOWA | Induced ordered weighted averaging |
| IOWGA | Induced ordered weighted geometric averaging |
| IOWHA | Induced ordered weighted harmonic averaging |
| SSE | Sum of squared errors |
| TECCI | Total energy consumption of the construction industry |
| COPC | Construction output per capita |
| SA | Simple averaging |
| IVW | Inverse Variance Weighting |
| BMA | Bayesian Model Averaging |
| BGOC | Bates Granger optimal combination |
| MSE | Mean squared error |
| MAE | Mean absolute error |
| RMSRE | Root mean squared relative error |
| MAPE | Mean absolute percentage error |
References
- U.S. Congress. S. 4355—Clean Competition Act. Available online: https://www.congress.gov/bill/117th-congress/senate-bill/4355 (accessed on 13 September 2024).
- European Parliament and Council of the European Union. Regulation (EU) 2023/956 Establishing a Carbon Border Adjustment Mechanism. Available online: http://data.europa.eu/eli/reg/2023/956/oj (accessed on 17 September 2024).
- State Council of the People’s Republic of China. Opinions on Fully, Accurately, and Comprehensively Implementing New Development Concepts to Achieve Carbon Peaking and Carbon Neutrality. Available online: https://www.gov.cn/zhengce/2021-10/24/content_5644613.htm (accessed on 7 September 2024).
- Guan, Y.; Shan, Y.; Huang, Q.; Chen, H.; Wang, D.; Hubacek, K. Assessment to China’s Recent Emission Pattern Shifts. Earths Future 2021, 9, e2021EF002241. [Google Scholar] [CrossRef]
- Shan, Y.; Guan, D.; Zheng, H.; Ou, J.; Li, Y.; Meng, J.; Mi, Z.; Liu, Z.; Zhang, Q. China CO2 emission accounts 1997–2015. Sci. Data 2018, 5, 170201. [Google Scholar] [CrossRef] [PubMed]
- Shan, Y.; Huang, Q.; Guan, D.; Hubacek, K. China CO2 emission accounts 2016–2017. Sci. Data 2020, 7, 54. [Google Scholar] [CrossRef] [PubMed]
- Xu, J.; Guan, Y.; Oldfield, J.; Guan, D.; Shan, Y. China carbon emission accounts 2020–2021. Appl. Energy 2024, 360, 122837. [Google Scholar] [CrossRef]
- Wang, H.; Wei, Z.; Fang, T.; Xie, Q.; Li, R.; Fang, D. Carbon Emissions Prediction Based on the GIOWA Combination Forecasting Model: A Case Study of China. J. Clean. Prod. 2024, 445, 141340. [Google Scholar] [CrossRef]
- Ehrlich, P.R.; Holdren, J.P. Impact of Population Growth. Science 1971, 171, 1212–1217. [Google Scholar] [CrossRef]
- González-Torres, M.; Pérez-Lombard, L.; Coronel, J.; Maestre, I. Revisiting Kaya Identity to define an Emissions Indicators Pyramid. J. Clean. Prod. 2021, 317, 128328. [Google Scholar] [CrossRef]
- Dietz, T.; Rosa, E.A. Effects of Population and Affluence on CO2 Emissions. Proc. Natl. Acad. Sci. USA 1997, 94, 175–179. [Google Scholar] [CrossRef]
- Zhou, X.; Hu, P.; Cheng, P. Carbon Emission Accounting and Carbon Peak Prediction of China’s Construction Industry from a Life-Cycle Perspective. Chin. J. Environ. Sci. 2025, 46, 2020–2034. [Google Scholar]
- Zhang, S.; Huo, Z.; Zhai, C. Building Carbon Emission Scenario Prediction Using STIRPAT and GA-BP Neural Network Model. Sustainability 2022, 14, 9369. [Google Scholar] [CrossRef]
- Li, L.; Li, Y. The Spatial Relationship between CO2 Emissions and Economic Growth in the Construction Industry: Based on the Tapio Decoupling Model and STIRPAT Model. Sustainability 2023, 15, 528. [Google Scholar] [CrossRef]
- Kang, X.; Chen, L.; Wang, Y.; Liu, W. Analysis on the Spatial Correlation Network and Driving Factors of Carbon Emissions in China’s Logistics Industry. J. Environ. Manag. 2024, 366, 121916. [Google Scholar] [CrossRef] [PubMed]
- Bai, D.; Dong, Q.; Khan, S.A.R.; Li, J.; Wang, D.; Chen, Y.; Wu, J. Spatio-Temporal Heterogeneity of Logistics CO2 Emissions and Their Influencing Factors in China: An Analysis Based on Spatial Error Model and Geographically and Temporally Weighted Regression Model. Environ. Technol. Innov. 2022, 28, 102791. [Google Scholar] [CrossRef]
- Chen, L.; Pan, Y.; Zhang, D. Prediction of Carbon Emissions Level in China’s Logistics Industry Based on the PSO-SVR Model. Mathematics 2024, 12, 1980. [Google Scholar] [CrossRef]
- Wen, L.; Song, Q. The Forecasting Model Research of Rural Energy Transformation in Henan Province Based on STIRPAT Model. Environ. Sci. Pollut. Res. 2022, 29, 75550–75565. [Google Scholar] [CrossRef]
- Chen, J.; Jia, J.; Wang, L.; Zhong, C.; Wu, B. Carbon Reduction Countermeasure from a System Perspective for the Electricity Sector of Yangtze River Delta (China) by an Extended Logarithmic Mean Divisia Index (LMDI). Systems 2023, 11, 117. [Google Scholar] [CrossRef]
- Rao, C.; Zhang, Y.; Wen, J.; Xiao, X.; Goh, M. Energy Demand Forecasting in China: A Support Vector Regression-Compositional Data Second Exponential Smoothing Model. Energy 2023, 263, 125955. [Google Scholar] [CrossRef]
- Alhindawi, R.; Abu Nahleh, Y.; Kumar, A.; Shiwakoti, N. Projection of Greenhouse Gas Emissions for the Road Transport Sector Based on Multivariate Regression and the Double Exponential Smoothing Model. Sustainability 2020, 12, 9152. [Google Scholar] [CrossRef]
- Gao, M.; Yang, H.; Xiao, Q.; Goh, M. A Novel Method for Carbon Emission Forecasting Based on Gompertz’s Law and Fractional Grey Model: Evidence from American Industrial Sector. Renew. Energy 2022, 181, 803–819. [Google Scholar] [CrossRef]
- Zhang, R.; Mao, S.; Kang, Y. A Novel Traffic Flow Prediction Model: Variable Order Fractional Grey Model Based on an Improved Grey Evolution Algorithm. Exp. Syst. Appl. 2023, 224, 119943. [Google Scholar] [CrossRef]
- Zhang, S.; Wu, L.; Cheng, M.; Zhang, D. Prediction of Whole Social Electricity Consumption in Jiangsu Province Based on Metabolic FGM (1, 1) Model. Mathematics 2022, 10, 1791. [Google Scholar] [CrossRef]
- Sirisha, U.M.; Belavagi, M.C.; Attigeri, G. Profit Prediction Using ARIMA, SARIMA and LSTM Models in Time Series Forecasting: A Comparison. IEEE Access 2022, 10, 124715–124727. [Google Scholar] [CrossRef]
- Ning, L.; Pei, L.; Li, F. Forecast of China’s Carbon Emissions Based on ARIMA Method. Discret. Dyn. Nat. Soc. 2021, 2021, 1441942. [Google Scholar] [CrossRef]
- Zhong, W.; Zhai, D.; Xu, W.; Gong, W.; Yan, C.; Zhang, Y.; Qi, L. Accurate and Efficient Daily Carbon Emission Forecasting Based on Improved ARIMA. Appl. Energy 2024, 376, 124232. [Google Scholar] [CrossRef]
- Jiang, H.; Yin, J.; Wei, D.; Luo, X.; Ding, Y.; Xia, R. Industrial Carbon Emission Efficiency Prediction and Carbon Emission Reduction Strategies Based on Multi-Objective Particle Swarm Optimization-Backpropagation: A Perspective from Regional Clustering. Sci. Total Environ. 2024, 906, 167692. [Google Scholar] [CrossRef]
- Sun, W.; Huang, C. Predictions of Carbon Emission Intensity Based on Factor Analysis and an Improved Extreme Learning Machine from the Perspective of Carbon Emission Efficiency. J. Clean. Prod. 2022, 338, 130414. [Google Scholar] [CrossRef]
- Lv, Q.; Rashidi-Khaniabadi, A.; Zheng, R.; Zhou, T.; Mohammadi, M.-R.; Hemmati-Sarapardeh, A. Modelling CO2 diffusion coefficient in heavy crude oils and bitumen using extreme gradient boosting and Gaussian process regression. Energy 2023, 275, 127396. [Google Scholar] [CrossRef]
- Liu, M.; Qi, L.; Chen, H.; Luo, X.; Zhu, X.; Chen, C. Study on the Spatialization of Anthropogenic Carbon Emissions in China Based on SVR-ZSSR. Sci. Rep. 2023, 13, 1887. [Google Scholar] [CrossRef]
- Ahmed, A.A.; Badri, Y.; Shamseldin, A. Application of Nonlinear Gaussian Process Regression Models for CO2 Emissions Prediction. In Proceedings of the International Conference on Innovations in Information Technology, Al Ain, United Arab Emirates, 14–15 November 2023. [Google Scholar]
- Chen, H.; Wang, B.; Huang, Z. Greenhouse Gas Emission Prediction and Impact Analysis of Dual-Fuel Engine. Process. Saf. Environ. 2024, 191, 1–13. [Google Scholar] [CrossRef]
- Kumari, S.; Singh, S.K. Machine Learning-Based Time Series Models for Effective CO2 Emission Prediction in India. Environ. Sci. Pollut. Res. 2023, 30, 116601–116616. [Google Scholar] [CrossRef]
- Larsson, G.; Maire, M.; Shakhnarovich, G. FractalNet: Ultra-Deep Neural Networks without Residuals. arXiv 2016, arXiv:1605.07648. [Google Scholar]
- Shakhovska, N.; Shymanskyi, V.; Prymachenko, M. FractalNet-LSTM Model for Time Series Forecasting. Comput. Mater. Contin. 2025, 82, 4469–4484. [Google Scholar] [CrossRef]
- Li, Y. Forecasting Chinese Carbon Emissions Based on a Novel Time Series Prediction Method. Energy Sci. Eng. 2020, 8, 2274–2285. [Google Scholar] [CrossRef]
- Lichtendahl, K.C.; Winkler, R.L. Why do some combinations perform better than others? Int. J. Forecast. 2020, 36, 142–149. [Google Scholar] [CrossRef]
- Diebold, F.X.; Shin, M. Machine learning for regularized survey forecast combination: Partially-egalitarian LASSO and its derivatives. Int. J. Forecast. 2019, 35, 1679–1691. [Google Scholar] [CrossRef]
- Alexander, N.; Scherer, W.; Burkett, M. Extending the Markowitz model with dimensionality reduction: Forecasting efficient frontiers. In Proceedings of the 2021 Systems and Information Engineering Design Symposium, Charlottesville, VA, USA, 29–30 April 2021. [Google Scholar]
- Ortiz, R.; Contreras, M.; Mellado, C. Regression, Multicollinearity and Markowitz. Financ. Res. Lett. 2023, 58, 104550. [Google Scholar] [CrossRef]
- Botero, S.; García Mazo, C.M.; Moreno Arboleda, F.J. Power generation mix in Colombia including wind power: Markowitz portfolio efficient frontier analysis with machine learning. J. Open Innov. Technol. Mark. Complex. 2024, 10, 100402. [Google Scholar] [CrossRef]
- Nowotarski, J.; Raviv, E.; Trück, S.; Weron, R. An empirical comparison of alternative schemes for combining electricity spot price forecasts. Energy Econ. 2014, 46, 395–412. [Google Scholar] [CrossRef]
- Lv, X.; Yin, K.; Li, X. Grey Multivariate Variable Weight Combination Prediction Model and Its Application. Stat. Decis. 2022, 38, 25–29. [Google Scholar]
- Yager, R.R. On Ordered Weighted Averaging Aggregation Operators in Multicriteria Decision Making. IEEE Trans. Syst. Man Cybern. 1988, 18, 183–190. [Google Scholar] [CrossRef]
- Lu, P.; Yang, J.; Ye, L.; Zhang, N.; Wang, Y.; Di, J.; Gao, Z.; Wang, C.; Liu, M. A novel adaptively combined model based on induced ordered weighted averaging for wind power forecasting. Renew. Energy 2024, 226, 120350. [Google Scholar] [CrossRef]
- Yang, H.; Wang, M.; Li, G. A combined prediction model based on secondary decomposition and intelligence optimization for carbon emission. Appl. Math. Model 2023, 121, 484–505. [Google Scholar] [CrossRef]
- Cheng, X.; Chen, W. Research on Air Logistics Demand Forecasting Based on Induced Ordered Weighted Geometric Averaging Operator. J. Civ. Aviat. 2024, 8, 6–10+59. [Google Scholar]
- Li, S.; Wang, Q.; Jiang, X.; Li, R. The Negative Impact of the COVID-19 on Renewable Energy Growth in Developing Countries: Underestimated. J. Clean. Prod. 2022, 367, 132996. [Google Scholar] [CrossRef]
- Wang, Q.; Li, S.; Li, R. Will Trump’s coal revival plan work?—Comparison of results based on the optimal combined forecasting technique and an extended IPAT forecasting technique. Energy 2019, 169, 762–775. [Google Scholar] [CrossRef]
- Qiu, H.; Yang, Y.; Li, D. Research on Subgrade Settlement Prediction Based on Equidistance Processing and IOWHA Operator. Sci. Technol. Eng. 2022, 22, 8884–8892. [Google Scholar]
- Song, X.; Liang, G.; Li, C.; Chen, W. Electricity Consumption Prediction for Xinjiang Electric Energy Replacement. Math. Probl. Eng. 2019, 2019, 3262591. [Google Scholar] [CrossRef]
- Zhou, H.; Qi, F.; Liu, C.; Liu, G.; Xiao, G. Predicting combined carbon emissions in urban regions considering micro-level enterprise electricity consumption data and macro-level regional data. Front. Energy Res. 2024, 12, 1343318. [Google Scholar] [CrossRef]
- Du, Z.; Liu, Y.; Zhang, Z. Spatiotemporal Analysis of Influencing Factors of Carbon Emission in Public Buildings in China. Buildings 2022, 12, 424. [Google Scholar] [CrossRef]
- Lindemann, B.; Müller, T.; Vietz, H.; Jazdi, N.; Weyrich, M. A Survey on Long Short-Term Memory Networks for Time Series Prediction. In Proceedings of the 14th CIRP Conference on Intelligent Computation in Manufacturing Engineering, Naples, Italy, 15–17 July 2020. [Google Scholar]
- Millar, J.N.; Oliner, S.D.; Sichel, D.E. Time-To-Plan Lags for Commercial Construction Projects. Reg. Sci. Urban Econ. 2016, 59, 75–89. [Google Scholar] [CrossRef]
- National Bureau of Statistics of China. China Statistical Yearbook 2024; China Statistics Press: Beijing, China, 2024. Available online: https://www.stats.gov.cn/sj/ndsj/2024/indexeh.htm (accessed on 20 November 2024).
- National Development and Reform Commission. Notice on Carrying out Pilot Work for Low-Carbon Provinces and Cities. Available online: https://www.ndrc.gov.cn/xxgk/zcfb/tz/201008/t20100810_964674.html (accessed on 21 January 2025).
- Lei, Y.; Guo, M.; Zhao, D.; Cai, H.; Hu, D. Application of Grey Model GM(1, 1) to Ultra Short-Term Predictions of Universal Time. Artif. Satell. 2016, 51, 19–29. [Google Scholar] [CrossRef]
- State Council of the People’s Republic of China. The 14th Five-Year Plan for National Economic and Social Development of the People’s Republic of China and the Long-Range Objectives Through the Year 2035. Available online: https://www.gov.cn/xinwen/2021-03/13/content_5592681.htm (accessed on 7 February 2025).
- Ye, S. The Impact of Low-Carbon City Pilot Policy on Corporate Labor Demand: Demand Scale, Structural Adjustment and Mechanisms. J. Tech. Econ. Manag. 2024, 9, 87–92. [Google Scholar]
- Chen, W.; Wang, G.; Xu, N.; Ji, M.; Zeng, J. Promoting or Inhibiting? New-Type Urbanization and Urban Carbon Emissions Efficiency in China. Cities 2023, 140, 104429. [Google Scholar] [CrossRef]
- Zhang, J.; Liu, Y.; Saqib, N.; Waqas Kamran, H. An Empirical Study on the Impact of Energy Poverty on Carbon Intensity of the Construction Industry: Moderating Role of Technological Innovation. Front. Environ. Sci. 2022, 10, 929939. [Google Scholar] [CrossRef]
- Jiang, T.; Li, S.; Yu, Y.; Peng, Y. Energy-Related Carbon Emissions and Structural Emissions Reduction of China’s Construction Industry: The Perspective of Input–Output Analysis. Environ. Sci. Pollut. Res. 2022, 29, 39515–39527. [Google Scholar] [CrossRef]
- Wang, X.; Xie, S.; Wei, Z.; Wang, J. A Study on the Impact of China’s Prefabricated Building Policy on the Carbon Reduction Benefits of China’s Construction Industry Based on a Difference-in-Differences Method. Sustainability 2024, 16, 7606. [Google Scholar] [CrossRef]
- Lu, H.; Juan, Y.-K. Optimal Decision-Making Model for Selecting Residential Green Building Technologies in China. Front. Environ. Sci. 2022, 10, 973334. [Google Scholar] [CrossRef]
- Wu, H.; Deng, F.; Tan, H. Research on Parametric Design Method of Solar Photovoltaic Utilization Potential of Nearly Zero-Energy High-Rise Residential Building Based on Genetic Algorithm. J. Clean. Prod. 2022, 368, 133169. [Google Scholar] [CrossRef]


| Variables | Mean | Max | Min | Std. Dev |
|---|---|---|---|---|
| Construction CO2 emissions (million tons) | 33.37 | 46.75 | 15.27 | 10.63 |
| Construction workforce (million people) | 36.66 | 55.30 | 19.94 | 13.10 |
| Urban resident population (million people) | 656.03 | 914.25 | 394.49 | 163.94 |
| Urbanization rate | 0.49 | 0.65 | 0.32 | 0.10 |
| TECCI (Mtce) | 51.96 | 96.08 | 11.79 | 27.57 |
| COPC (kCNY/capita) | 240.40 | 532.41 | 43.43 | 155.54 |
| Errors | SVR | LSTM | λ = 1 | λ = −1 | λ → 0 | λ = 1/2 | λ = 1/4 |
|---|---|---|---|---|---|---|---|
| MSE | 0.9602 | 2.7804 | 0.5946 | 0.5946 | 0.5910 | 0.5926 | 0.5915 |
| MAE | 0.7362 | 1.3480 | 0.5970 | 0.5964 | 0.6027 | 0.5946 | 0.5944 |
| RMSRE | 3.26% | 5.14% | 2.37% | 2.37% | 2.35% | 2.36% | 2.36% |
| MAPE | 2.40% | 4.04% | 1.87% | 1.87% | 1.88% | 1.86% | 1.86% |
| Average accuracy | 97.60% | 95.96% | 98.13% | 98.13% | 98.12% | 98.14% | 98.14% |
| Errors | SA | IVW | BMA | BGOC | λ = 1 | λ = 1/2 | λ = 1/4 |
|---|---|---|---|---|---|---|---|
| MSE | 1.0636 | 0.8078 | 1.0140 | 0.8069 | 0.5946 | 0.5926 | 0.5915 |
| MAE | 0.8258 | 0.7365 | 0.7391 | 0.7391 | 0.5970 | 0.5946 | 0.5944 |
| RMSRE | 3.22% | 2.93% | 2.92% | 2.92% | 2.37% | 2.36% | 2.36% |
| MAPE | 2.55% | 2.36% | 2.53% | 2.37% | 1.87% | 1.86% | 1.86% |
| Average accuracy | 97.45% | 97.64% | 97.47% | 97.63% | 98.13% | 98.14% | 98.14% |
| Variables | MAPE | RMSRE | Accuracy |
|---|---|---|---|
| Construction workforce | 3.35% | 4.44% | 96.65% |
| Urban resident population | 0.49% | 0.57% | 99.51% |
| Urbanization rate | 0.34% | 0.39% | 99.66% |
| TECCI | 3.30% | 4.09% | 96.70% |
| Total construction output value | 1.25% | 1.39% | 98.75% |
| Year | Forecast Value | ||
|---|---|---|---|
| 2022 | 0.8920 | 0.1080 | 38.77 |
| 2023 | 0.8310 | 0.1690 | 37.00 |
| 2024 | 0.7730 | 0.2270 | 35.41 |
| 2025 | 0.7340 | 0.2660 | 33.94 |
| 2026 | 0.6990 | 0.3010 | 32.76 |
| 2027 | 0.6610 | 0.3390 | 31.83 |
| 2028 | 0.6480 | 0.3520 | 31.03 |
| 2029 | 0.6360 | 0.3640 | 30.42 |
| 2030 | 0.6290 | 0.3710 | 29.99 |
Disclaimer/Publisher’s Note: The statements, opinions and data contained in all publications are solely those of the individual author(s) and contributor(s) and not of MDPI and/or the editor(s). MDPI and/or the editor(s) disclaim responsibility for any injury to people or property resulting from any ideas, methods, instructions or products referred to in the content. |
© 2025 by the authors. Licensee MDPI, Basel, Switzerland. This article is an open access article distributed under the terms and conditions of the Creative Commons Attribution (CC BY) license (https://creativecommons.org/licenses/by/4.0/).
Share and Cite
Hu, T.; Bao, Z.; Zhang, B.; Gao, X. Predictive Analysis of Carbon Emissions in China’s Construction Industry Based on GIOWA Model. Mathematics 2025, 13, 1955. https://doi.org/10.3390/math13121955
Hu T, Bao Z, Zhang B, Gao X. Predictive Analysis of Carbon Emissions in China’s Construction Industry Based on GIOWA Model. Mathematics. 2025; 13(12):1955. https://doi.org/10.3390/math13121955
Chicago/Turabian StyleHu, Tianyue, Zhiheng Bao, Baiyang Zhang, and Xinnan Gao. 2025. "Predictive Analysis of Carbon Emissions in China’s Construction Industry Based on GIOWA Model" Mathematics 13, no. 12: 1955. https://doi.org/10.3390/math13121955
APA StyleHu, T., Bao, Z., Zhang, B., & Gao, X. (2025). Predictive Analysis of Carbon Emissions in China’s Construction Industry Based on GIOWA Model. Mathematics, 13(12), 1955. https://doi.org/10.3390/math13121955