Abstract
A natural phenomenon in applications is the interaction of quasi-periodic solutions of dynamical systems in a dissipative setting. We study the interactions of two of such ODE systems based on the construction of a nonlinear oscillator with thermostatic (energy) control. This leads to the emergence of complexity, torus doubling, and chaos. We find canards; 1-, 2-, and 3-tori; chaos, and hyperchaos. Detailed analysis is possible in the case of small oscillations and small interactions. Large-scale phenomena are studied by the construction of charts of parameter space using Lyapunov exponents.
MSC:
37M20; 37M21
1. Introduction
Interactions of two or more nonlinear oscillators generally produce complex dynamics with periodic solutions, tori, tori doubling, and chaos. A natural feature in real-life models is that the interactions are quasi-periodic, which means that the individual components have frequencies that are incommensurable. For a discussion of diophantine frequency vectors and the measure of Cantor sets in two-frequency systems, see [1], with many references also inspired by the conservative setting leading to families of invariant tori; we mention in this setting the basic paper [2].
Our focus is different from KAM theory and, with some exceptions, also from dissipative KAM theory, as we are especially interested in the practical context where we start with dissipative systems that are subsequently perturbed and lead to complex behaviour. This can produce bifurcations of isolated tori and their qualitative changes, whereas classical KAM theory is involved with conservative, usually Hamiltonian, systems where tori arise in dense sets, as well as families with positive measure. As we shall see, we will consider for our analysis a system with damping and thermostatic control, where the combination of two of such systems adds forcing and bifurcation phenomena.
Multifrequency oscillations arise in many applications of various disciplines such as mechanical engineering, laser systems, and electronic circuits; for a useful list of such applications in many fields, see [3] (in particular their references 1-23) and [4]. See also [5,6]. In [3,4], the emphasis is on the construction of charts of Lyapunov exponents for interacting self-excited systems. Such numerically obtained charts yield enormous inspiration for further analysis, but in our approach, we combine both analytic methods (averaging) and numerical bifurcation theory. This hybrid approach will be fruitful. A number of recent papers on quasi-perioidc bifurcations is concerned with maps; such an approach produces important general insight, but the relation with ODEs has yet to be established.
Important analytic tools are mathematically sound approximation techniques; see, for instance, [7] (ch. 9) and bifurcation theory; see, for instance, [8]. It is generally known that the equilibrium of a system of differential equations that for a certain parameter value has two imaginary eigenvalues can generate a periodic solution through Poincaré–Andronov–Hopf bifurcation. The generating periodic solution is a guiding center of the torus.
In a similar way, a periodic solution that is characterised by two imaginary eigenvalues or corresponding Lyapunov exponents may generate a torus through Neimark–Sacker bifurcation.
In the case of quasi-periodic interactions, it is natural to discover and identify tori. Usually, they branch off equilibria and periodic solutions. The first question is then whether they are normally hyperbolic or not. Starting with an autonomous system of ODEs, there will be at least one zero Lyapunov exponent. Are there more zeros, and when varying parameters, do we find Hopf and other bifurcations, tori doubling, and cascades of such phenomena leading to chaos?
Apart from normal form theory and averaging, we used numerical methods implemented in Mathematica, Matlab, and Matcont, see also [9,10]. The last one uses continuation methods to follow parameter changes that cause bifurcations. It turns out that the hybrid combination of analytic and numerical tools can be very inspiring.
What Is New?
To obtain insight in dissipative quasi-periodic bifurcations, we modify in Section 2 an important thermostatic control problem (Sprott A), which is a chaotic system formulated in [11,12]. Earlier studies of Sprott A giving more insight are [13,14]; in [15,16], the thermostatic control problem of [12] is linked to tori families, as is well known for conservative systems. The context of conservative systems is classical and interesting but in general less suitable for applications in engineering and other science fields that involve dissipation.
A new step in Section 2 is to introduce a two-dimensional basic oscillator with periodic solutions that are asynchronous; when adding a one-dimensional thermostatic control and assuming small oscillations, we find canard behaviour. Admitting larger amplitudes, we can identify periodic solutions in a resonance manifold through slow–fast dynamics.
In Section 3, we consider the six-dimensional interaction of two such components. If dissipation and thermostatic control are excluded, we have a system with two interacting quasi-periodic oscillators. To study the bifurcations of this system with dissipation, interaction and control are the central parts of this paper. When considering small oscillations and small interactions, one can use averaging to find single tori with one or two zero Lyapunov exponents. Combining canard initial values, the solutions converge to a flattened torus. Torus doubling arises, leading to a cascade of torus doublings. To obtain an overview of the phenomena, we constructed charts for larger values of dissipation and interactions. For each value of two parameters, one obtains either a 2-torus, a 3-torus, chaos, or hyperchaos.
Conclusions and a discussion finish the main part of the paper.
Appendix A lists the results that carry directly over from the two-components case to systems with n components.
2. One-Component Oscillations with Energy Control
An autonomous one-degree-of-freedom nonlinear oscillator with damping can be described by
with dissipation parameter . A dot above a variable is short for differentiation with respect to time. We assume that the function is analytic; near , it has a power series expansion starting with quadratic terms. If , we have no energy loss; in this case, the oscillator has the energy integral
with E a constant parameter depending on the initial conditions. In the conservative case (), Equation (1) has an infinite number of periodic solutions, with its period depending on . If is deleted in the equation, we have the synchronised case of the harmonic equation with all periods being equal ().
In chemical physics, see [17], one introduces a thermostatic control by adding an equation controlling the dissipative term by a new variable z, replacing with . The control can become negative, producing excitation if the energy (or another suitable quantity) characterising the oscillator is smaller than a chosen threshold, and can become positive, causing increased damping if the energy is larger than the threshold. Apart from using the energy of a nonlinear equation, we have with Equation (1), which defines the natural case of periodic solutions with the period dependent on the energy. To fix the ideas, we will choose
The thermostatic control z for the energy leads to the system
with parameters . The expression is not exactly representing the energy but measures the energy.
In [16], system (3) was studied in the case of ; this system is called Sprott B. We note that for small oscillations ( small) the solutions of the Sprott B system will upon first approximation describe the solutions of system (3) correctly; this will be made more precise later on. Replacing the equation for z by
with , the system is called Sprott A; see [11,12,15] and many references therein.
Choosing implies that we have no saddle equilibrium in the conservative oscillator (). Choosing negative c would change the dynamics for larger values of the initial energy; in Figure 1, we illustrate this for , where all solutions are periodic, and , producing saddles in the phase plane.
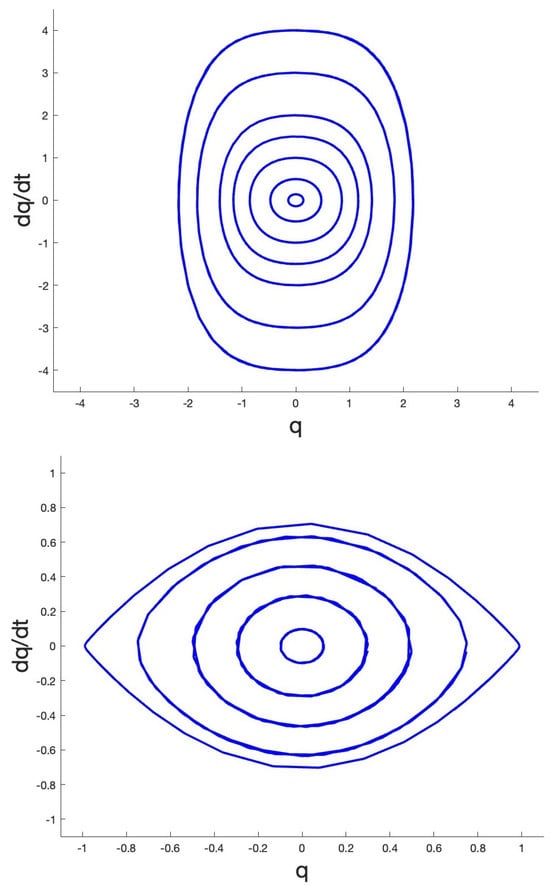
Figure 1.
Phase plane with periodic solutions of Equation . Upper side shows the case . Lower side shows the case producing 2 saddle equilibria at , and inside the 2 heteroclinic connections are periodic solutions.
Stability and Lyapunov exponents
In the sequel, we will look for periodic solutions and their stability. In Section 5.4 of [18], it is shown that if we have located a periodic solution of an autonomous system (such as (3)), linearisation near produces as one solution of the linearised system . In the case of system (3), this means that one of the three Lyapunov exponents will be zero.
Exact analytical solutions
We note that system (3) has no equilibria (critical points of the vector field). We find an unbounded invariant manifold if , with dynamics given by
The following result is well known.
Lemma 1.
Consider system (3) with ; as , all solutions are periodic but not synchronous.
A few examples of energy with , and corresponding period P are The cycles in the phase plane are shown in Figure 1 (upper); increasing shortens P.
Time reversal
We will use the concept of the time reversibility of system (3). Select . The system is characterised by time reversal if it is invariant for the following transformtion:
It is clear that system (3) shows time reversal. This concept will be used to apply dissipative KAM theory to system (3). For the general theory, see the introductions and statements in [19,20,21].
A second observation is that replacing with keeps the system invariant.
The phase flow is globally characterised by writing system (3) as a first-order ODE in 3-space and taking the divergence () of the vector field as
Suppose first that tends to a fixed nonzero number. If is positive definite, the flow is contracting, and if is negative definite, the flow is expanding. In the first case, we may find attracting solutions.
The symmetry conditions we have obtained allow in specific phase-space regions solutions with alternating and in particular T-periodic. If in the periodic case we have
together with the time reversal characteristic, the dissipative KAM theory will conclude to the existence of invariant tori.
Note that related but different types of control exist in neurodynamics that are called ‘gating’. An electro-physical signal fires a neuron if it exceeds a potential typical for the gates of the particular neuron. Such a control is different from thermostatic or energy control, as in realistic neuron models, a potential that is too small will leave the neuron inert. Such neuronal dynamical systems serve, however, as an inspiration in the present paper.
We expect that the study of systems with energy control will also be of use in other biophysical systems.
2.1. Small Oscillations near the z Axis, Canards
We scale . System (3) becomes
We apply averaging to system (5); see [22] or [7] for the theory. Here and in the sequel, we formulate and will formulate variational equations in amplitude–phase variables . Considering coupled systems of oscillators, will be vectors with subscripts , etc. Selecting and rescaling produces
Averaging over t while keeping fixed, we find
The solutions of system (6) are approximated to on an interval of time by the solutions of system (7).
The averaged system (7) contains a periodic approximate solution of the form
The approximation of the solution of system (5) with initial conditions found by expressions (8) has the error on the long timescale . It corresponds with the exact periodic solution obtained with nearby initial conditions.
There is a theoretical advantage giving more insight by using the timelike variable instead of t; s is indeed timelike, as the phase is varying slowly. Repeating the calculation, we have by averaging over s the averaged system
We have as a critical point of the averaged system (9). The determinant in the critical point does not vanish for , so the approximation (8) corresponds with an existing periodic solution of the original system that is -periodic in s. The eigenvalues in the critical point are , so the periodic solution is with the first approximation neutrally stable. A second-order approximation in does not change the picture qualitatively, as the time reversibility plays an essential role in producing an infinite set of KAM tori; see Figure 2. In these cases, alternates around . The periodic solution obtained above serves as an organising centre. The solutions are symmetric with respect to as predicted.
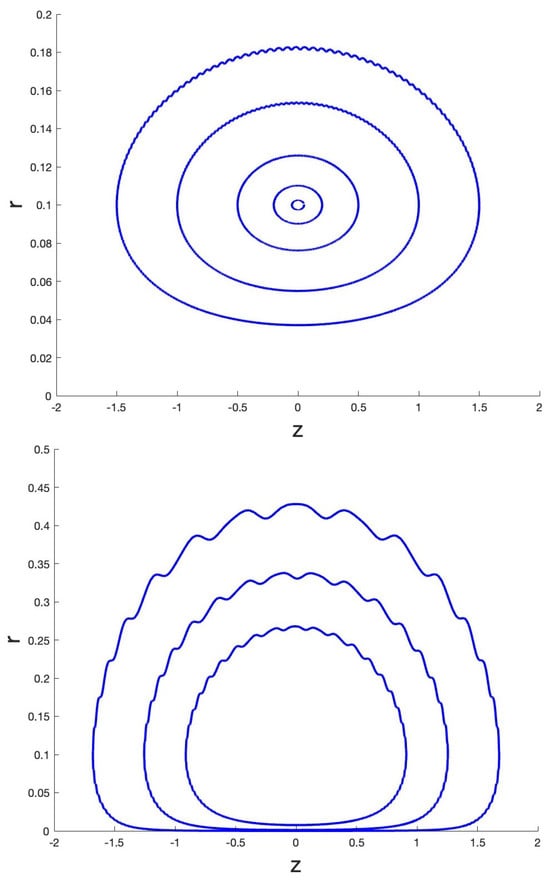
Figure 2.
Dynamics near the z axis based on system (3). Left side shows the closed curves in a diagram describing the tori around the periodic solution approximated by Equation (7). The initial conditions are with parameters , . Right canard behaviour near the z axis with initial conditions , with parameters is shown.
Families of invariant tori were observed earlier for the dissipative Sprott A system in [13,14], while the mathematical explanation by time reversal and symmetry was given in [15].
Canards Near the z Axis
The dynamics near the z axis, as shown in Figure 2, were obtained with parameter a . System (3) was designed to find a periodic solution by averaging close to the z axis. The system can also be interpreted as a slow–fast system with fast variables and slow variable z. According to the theory of slow–fast systems, see [23] and further references therein, a slow manifold will be given by (the z axis). The slow manifold is not normally hyperbolic, so the attraction or repelling is not necessarily exponential, but the explicit form makes characterisation easy. If we start with a positive value of and with , the solution will move closer to the slow manifold. As long as , will decrease because of dissipation. At time , and the term will produce excitation for . The slow manifold becomes unstable, but as the solutions are very close to the z axis, they will persist for some time in motion near the z axis; this is the canard phenomenon. The symmetry of the equations causes the jump-off point of the solutions to mirror the approach point; see Figure 2 (lower) again.
2.2. Generalisations
The results obtained thus far for the case and small oscillations carry over to the more general case with being polynomial or analytic, as well as odd, and . In particular, we have time reversibility producing invariant tori near the z axis around a periodic solution as the organising centre. Close to the z axis, we will find canard behaviour.
In this section, we drop the assumption of small oscillations.
A Family of Periodic Solutions
Consider again system (3) with small damping coefficient b and small nonlinear force; select . System (3) becomes
If , the solutions for are harmonic. Transforming system (10) for to amplitude–phase variables, it becomes a slow–fast system with slow variables and fast variable z as follows:
We can identify as a resonance manifold of system (11); for the theory, see [23], ch. 12, or [7], ch. 7. Another approach is to use iteration of an integral equation; see [23], ch. 10.2, or [7] in ch. 3. This would be an application of the Poincaré–Lindstedt (continuation) method.
We will use the asymptotic analysis of resonance manifolds, where the parameter plays an essential role. The standard theory can be found in [23] in ch. 12 or [7] in ch. 7. Consider a neighbourhood of the resonance manifold by introducing a local variable :
with as . Introducing in system (11), we find
A significant degeneration in the sense of singular perturbation theory gives the choice . Expanding while keeping terms , we have
Averaging over time produces as
Consider as a timelike variable and the dynamics of the variables . The Jacobian of the averaged equations of is not singular (its value is ), so according to the implicit function theorem, we have the existence of the periodic solution continued from the harmonic solution for .
Solving the averaged system, we find to be constant, corresponding with neutral stability for critical point in the resonance manifold. However, a first-order approximation in a resonance manifold will always yield conservative dynamics even if the original system is dissipative; see, for the general theory again, [23] in ch. 12 or [7] in ch. 7. So, we have to construct a second-order approximation to establish stability.
Expansion to leads to the system
However, the second-order averaging (see [23] or [7]) of system (13) does not change the neutral stability.
Numerical explorations for and nearby initial conditions show instability of and convergence to other solutions. See Figure 3 for the cases of orbits starting near and .
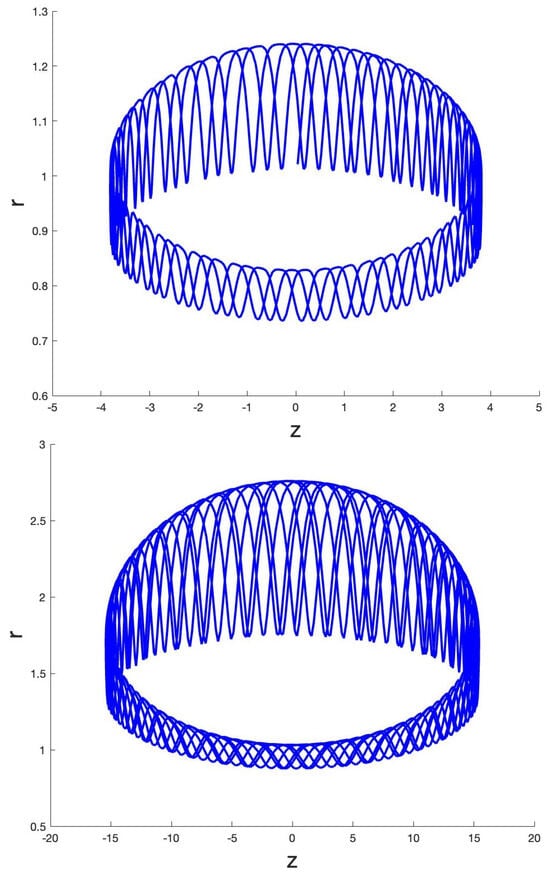
Figure 3.
Dynamics based on system (3) for 2 cases starting close to , with and parameters . In both cases, a torus emerges around .
3. A Coupled System of Two Controlled Oscillators
We extend system (3) to two coupled systems with a simple direct coupling. The coupling is not inspired by pendulum couplings but by the process of transmitting impulses to neigbouring components, as in neural systems. Consider the coupled system
The interaction constant will determine the interaction force. In system (17), the first component activates the second, and the second one activates the first. We assume that .
The result of Lemma 1 extends in the following form.
Lemma 2.
If , the corresponding solutions of system (17) are quasi-periodic, and they are periodic if the initial conditions are equal.
As we shall see, system (17) will produce for interactions of quasi-periodic oscillations with complicated dynamics. In [3,4], such two-frequency interactions were studied involving torus bifurcations and chaotic dynamics characterised by Lyapunov exponents. The nature of the coupling in [3,4] is different from our system (17) with more complicated dissipation. A common feature is that in both model systems, a form of self-excitation takes place.
System (17) can be written as a first-order system in 6-space with divergence:
So, in a region where , the flow contracts if, in the region , the flow expands.
Lemma 3.
If in system (17), we have a family of harmonic synchronised periodic solutions in the manifold of the form
If , we expect instability of the periodic solution because of resonance. It is natural to study the cases .
3.1. Small Interactions and Small Oscillations
Consider the case of small interactions , small deflections, and consequently small nonlinearity ; select .
As in Section 2.1, we can scale for the deflections for the velocities . Introducing amplitude–phase coordinates as before and by averaging as in Section 2.1, we find the system for approximations given by
Structurally stable critical points of the approximating vector field correspond with periodic solutions close to the critical points; see [7].
We have the critical values . Select for the combination angle . The equation for becomes
The case
This is clearly a degenerate case, as from (21), we have in the critical points , and so . The only requirement is , but with , it is not determined. The time series corresponding to the critical points is shown in Figure 4. As expected from the analysis of one component in Section 2, see also Figure 2, the canard behaviour becomes less prominent when decreasing . This is illustrated in Figure 4 and Figure 5, where . Choosing , we have canard behaviour. Decreasing the initial z values, we find the irregular pattern shown in Figure 6 for (and the same for ). This irregularity originates from the exponential closeness of the orbits to the slow manifold at the z axis, which is not normally hyperbolic.
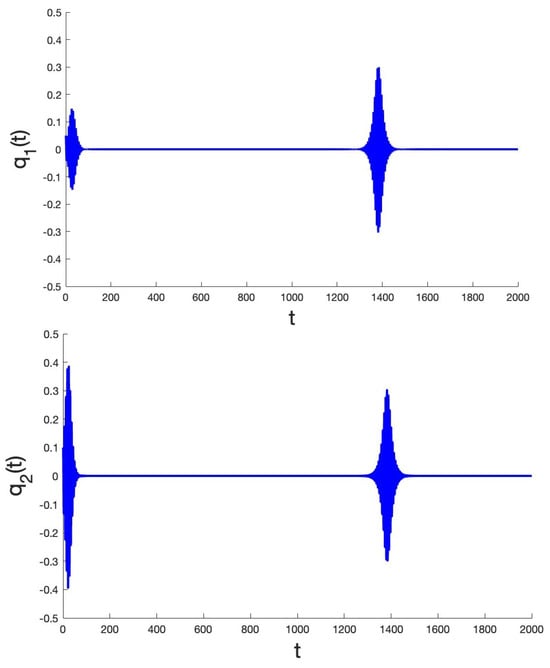
Figure 4.
Consider the critical point of system (20) and parameters . The time series of the corresponding periodic solution shows spiking caused by canard behaviour.
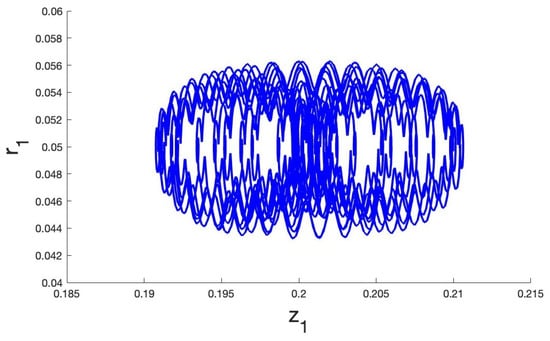
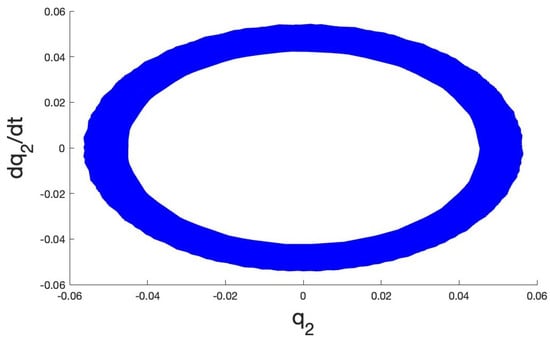
Figure 5.
Dynamics for small oscillations based on system (17), upper side shows the diagram, and lower side shows the diagram describing the projected tori around the periodic solution. The initial conditions are , with parameters .
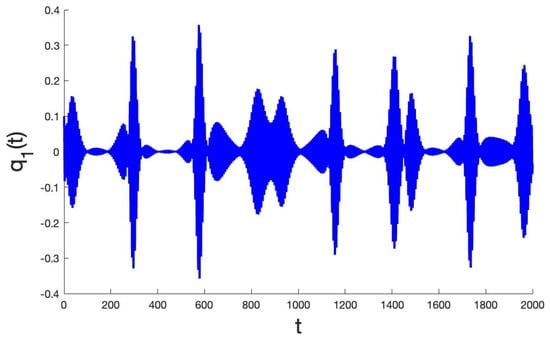
Figure 6.
Consider the critical point and parameters . The time series illustrates the case in which these initial z values show transition to canard behaviour.
Starting close to the critical point, the dynamics show instability. See Figure 5 for an example; the numerics based on system (17) suggest the presence of a torus.
- The case
This case also yields nontrivial equilibria. Requiring gives the following condition:
Note that Equation (22) implies that . Looking for roots of the amplitude equations yields
This gives the two nontrivial equilibria solutions in the case where .
The Jacobian matrix of system (20) at the nontrivial equilibriun in the case where and small oscillations is defined as follows:
The trace of the Jacobian (28) is
The trace vanishes to produce degenerate dynamics in the two cases as
In the second case, we have ; see Figure 5 again.
An analysis of the eigenvalues of the nontrivial equilibria for the case where reveals that the equilibria are of an unstable focus type. For the parameter values , we identify two nontrivial equilibria with and corresponding eigenvalues:
Further continuation of the equilibria with respect to the system’s parameters does not reveal any significant bifurcations.
3.1.1. Quasi-Periodic Motion and Associated Bifurcations
Interestingly, the averaged system (20) contains in the case where a stable periodic orbit, which is unrelated to the equilibria mentioned so far. This implies the presence in the original system of quasi-periodic motion in the form of a stable two-dimensional torus that can be depicted numerically starting in the neighborhood of the averaged stable cycle; see Figure 7 and Figure 8 for the Lyapunov exponents.
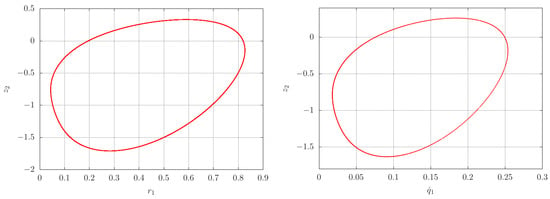
Figure 7.
Left: A stable cycle, with period , numerically obtained from the averaged system (20) with initial condition and parameters , . Right: Poincaré section () of system (17) projected onto the plane with initial condition and parameters , showing a closed curve corresponding with a two-dimensional torus.
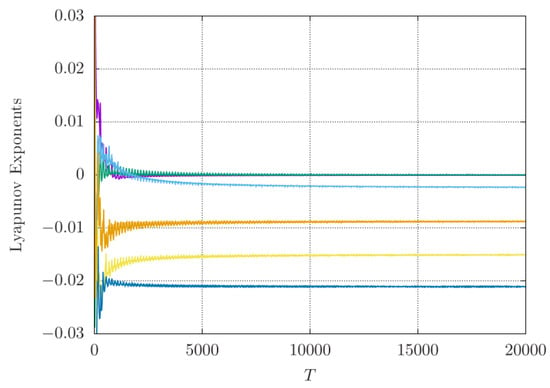
Figure 8.
Lyapunov exponents of the stable single torus (Figure 7, right), showing two zero exponents and four negative exponents. Different colours are used for different L-exponents.
Continuation of the limit cycle in the averaged system using as a control parameter reveals a supercritical period doubling at the critical value from which a stable cycle with double the period () emerges. The corresponding stable double torus in the original system has been numerically located near the double cycle as expected. See Figure 9, Figure 10 and Figure 11.
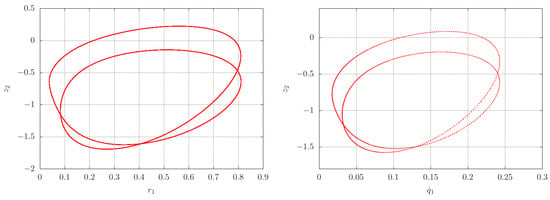
Figure 9.
Left: A stable double cycle projected on the plane, with period , numerically obtained from the averaged system (20) by continuation of the stable period 1 cycle. Right: Poincaré section () of system (17) projected onto the plane with initial condition and parameters , showing a closed curve corresponding with a two-dimensional double torus.
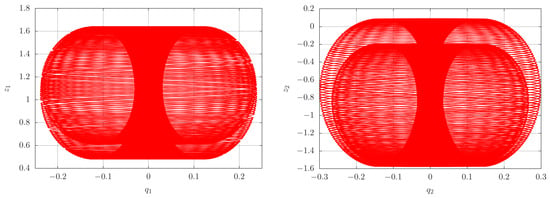
Figure 10.
Orbits starting from the same initial conditions as in Figure 7 (right) projected onto the plane (left) and the plane (right), illustrating the double torus.
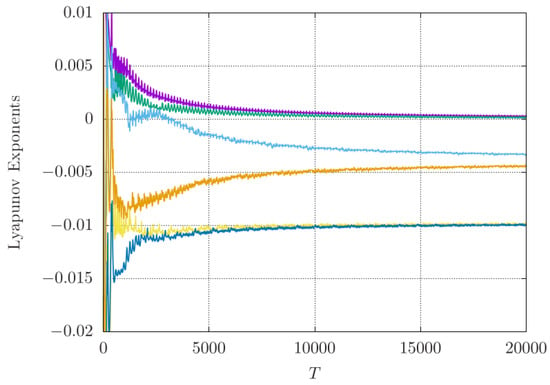
Figure 11.
Lyapunovexponents of the stable double torus, as depicted in Figure 9 (right), showing two zero exponents and the four negative exponents (Different colours are used for different L-exponents).
3.1.2. Chaos Through the Cascade of Period Doubling in Tori
Further continuation produces cascades of periodic doublings and corresponding tori, and so also chaos see Figure 12 and Figure 13.
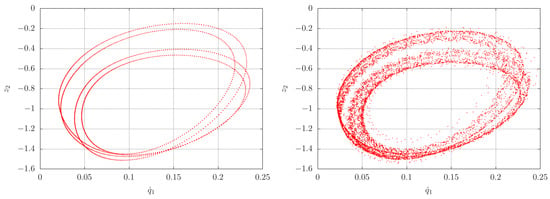
Figure 12.
Poincaré section (left) and (right).
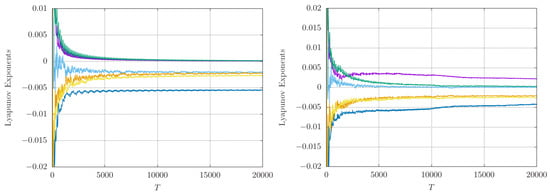
Figure 13.
Left: Lyapunov exponents of the stable double torus, , with two exponents equal to zero and the remaining four exponents negative. Right: Lyapunov exponents of the strange attractor after the cascade of period doubling at with one positive exponent, two zero exponents, and the remaining three negative. Different colours are used for different L-exponents.
3.1.3. Coexisting Period 2 Orbit
Tracking periodic orbits and analyzing their stability through continuation methods is crucial for detecting bifurcations and understanding the resulting dynamics, as well as the routes to chaos in the system under investigation. Using the numerical methods outlined in [24], an additional period 2 orbit was identified in the averaged system, which coexists with the period 1 cycle shown in Figure 7. This cycle has four complex multipliers on the unit circle and one real multiplier equal to 1. Because the cycle is only Lyapunov-stable, there is no guarantee that the corresponding two-dimensional torus exists in the original system. See Figure 14.
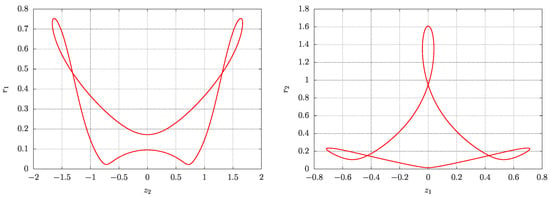
Figure 14.
Left: A numerically computed period 2 cycle with period from the averaged system (20) projected onto the – plane. The initial conditions are , , , , and , with parameters , , . Right: The same period 2 cycle now projected onto the – plane, illustrating its behaviour across different coordinate projections. The cycle has four complex multipliers on the unit circle and one real multiplier equal to 1.
Searching for the corresponding dynamics in the original system, starting near the Lyapunov-stable cycle of the averaged system, the following invariant set was identified. See Figure 15 and Figure 16.
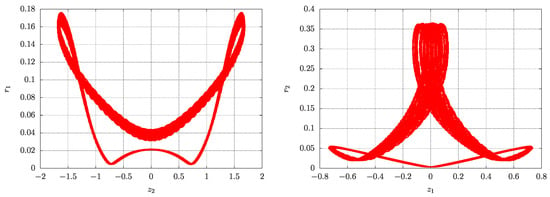
Figure 15.
Left: Orbit numerically computed from the original system (17) initiated near the stable cycle and projected onto the – plane. The initial conditions are , , , , , and , with parameters , , , , . Right: The same period 2 orbit now projected onto the – plane, highlighting its behaviour across different coordinate projections.
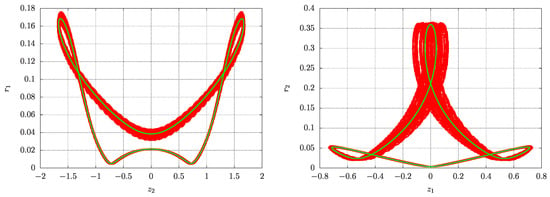
Figure 16.
Left: The orbit (in red) numerically computed from the original system (17), initialized near the stable cycle, along with the scaled stable cycle (in green) from the averaged system (20) projected onto the – plane. Right: The same orbits now projected onto the – plane, demonstrating the accuracy of the averaging method.
By searching for period 1 and period 2 periodic orbits in the averaged system with initial values , , and within the interval and ranging from −3 to 3 in increments of , eight additional periodic orbits were identified that coexist with the two cycles previously found. Four stable and four unstable orbits were identified. See illustrations in Figure 17.
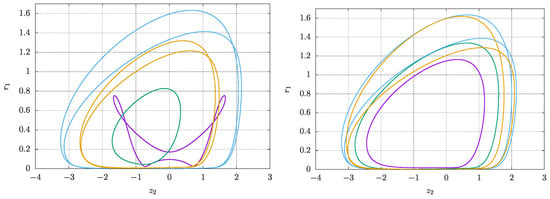
Figure 17.
Numerically computed stable periodic orbits of the averaged system obtained via the fixed point method applied to a Poincaré section. The orbits are projected onto the – plane with parameters , , , . Right: Corresponding unstable periodic orbits under the same parameter settings. Colours are used to identify separate orbits.
3.1.4. Interactions Involving Canards
As seen in Figure 18, the evolution of the two-particle system tends to canard behaviour. The dynamical evolution starts to stabilise after 15,000 time steps.
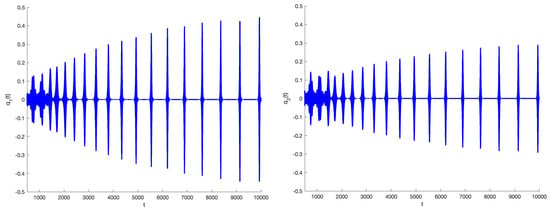
Figure 18.
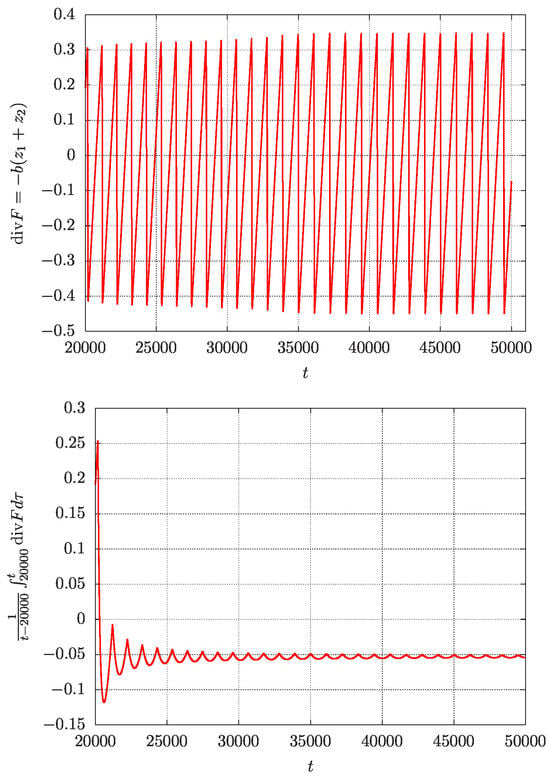
(left) and (right) in the case and initial conditions . The system evolves to canard behaviour with divergence (18) alternating in sign.
The canard character of the flow is shown in Figure 19, where the projected dynamics suggests a flattened torus; the variable takes negative and positive values, while takes mostly positive ones producing both attraction and repelling.
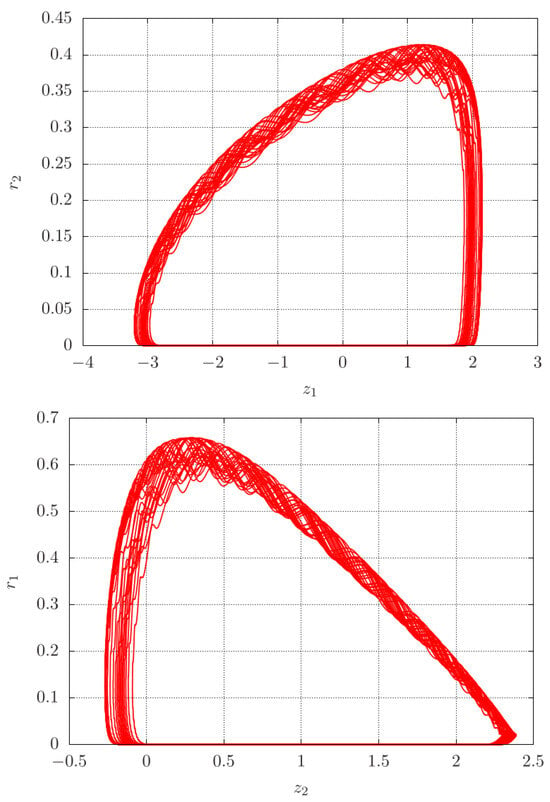
The Lyapunov exponents of the flow shown in Figure 19 have four exponents clustered near zero. In Figure 20 on the right side, we present an enlarged picture of the small exponents. We find both positive and negative spiky behaviour, suggesting a small fractal structure of the flattened torus of Figure 19. Additional information is shown in Figure 21, where we show the alternating divergence of the flow corresponding with alternating attraction and repelling.
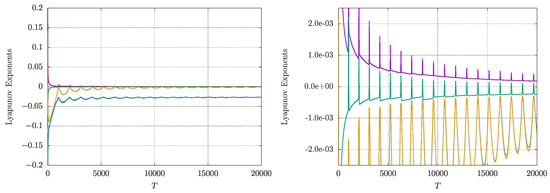
Figure 20.
Left: Lyapunov exponents of the flattened torus from Figure 19, illustrating two negative exponents and four exponents clustered near zero. Right: A magnified view of the left figure, highlighting the spiky behaviour of the four Lyapunov exponents close to zero. Colours correspond with different L-exponents.
3.2. Interactions of Larger Quasi-Periodic Solutions
Consider the dynamics when leaving the region of small oscillations. In the case of friction parameter b and interaction parameter still being small, we consider with interactions of quasi-periodic solutions. Selecting initial conditions for the coordinates and parameters , we obtain chaotic solutions; see Figure 22, where we have chosen . The Lyapunov exponents for the case are depicted in Figure 23. As usual ; varying c changes the dynamics but keeps chaos. The exponents are , The dynamics turn out to be hyperchaotic with two positive exponents.
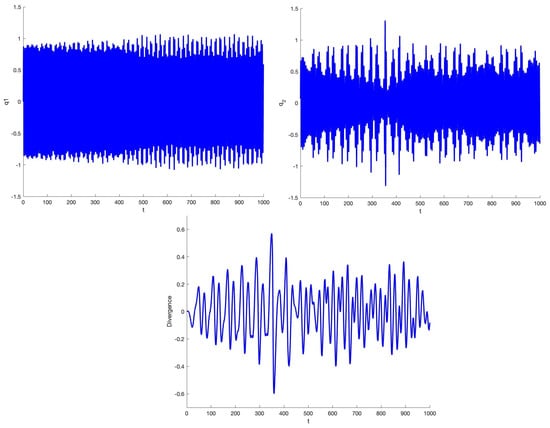
Figure 22.
Time series of 2 quasi-periodic oscillations based on Equation (17) with and with parameters . Top left side shows , top right shows , and figure below shows the strongly fluctuating divergence of the flow.
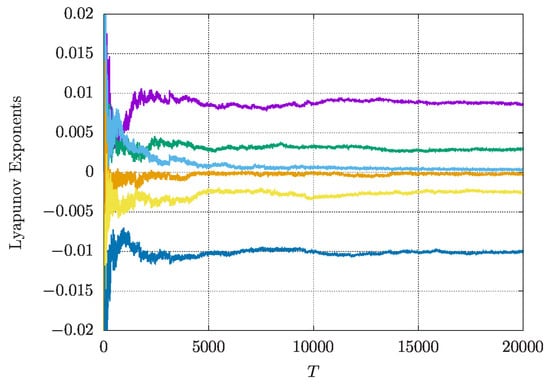
Figure 23.
Lyapunov-exponents of interactions of 2 quasi-periodic oscillations based on Equation (17) with initially and with parameters , . Colours correspond with different exponents.
Larger Interaction Parameter
Exploring systematically the case of values of , we find tori, chaos, and hyperchaos. The hyperchaos found in the system of Figure 23 with two associated L exponents was investigated with other phenomena for the values of between 0 and 1; see Figure 24. We find small islands (yellow) in a sea of chaotic cases (green). The chaotic cases are associated with one L exponent. In a neighbourhood of , we find two-dimensional tori (blue) as found earlier for the case of small interactions and small oscillations, but interestingly, we also have small dissipation sets of chaotic solutions. The picture of the phenomena of many of the cases in Figure 24 is very remarkable and not easy to predict analytically.
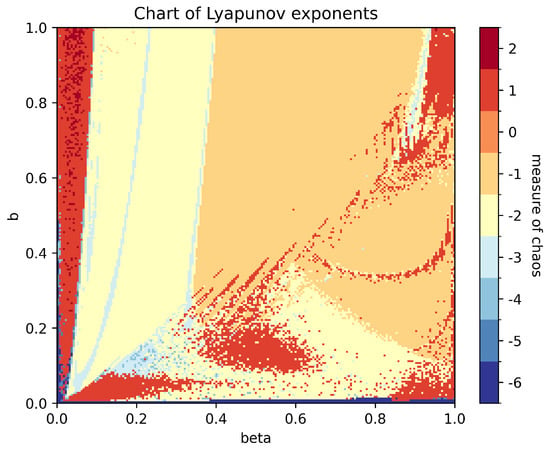
Figure 24.
Chart of parameters characterising interactions of 2 quasi-periodic oscillations based on Equation (17), , . The initial conditions are , , , , , and . The colouring scheme used corresponds to a classification based on the number of zero Lyapunov exponents, with a threshold of : any exponent with absolute value below this threshold is treated as zero. The values of the exponents, ranging from −6 to 2, are mapped to the colourmap as follows: dark blue regions indicate the absence of clear dynamics, with all six Lyapunov exponents near zero (undecided behaviour). Medium-dark blue corresponds to five exponents near zero, indicating a 5D torus, while medium blue (four near-zero exponents) corresponds to a 4D torus, and so on, with light blue corresponding to a 3D torus and yellow to a 2D torus, indicative of quasi-periodic behaviour. Orange regions correspond to systems with one zero exponent, representing periodic orbits, while regions in red and dark red indicate chaotic or hyperchaotic dynamics, with one or two positive Lyapunov exponents. For the calculation of the Lyapunov coefficients, integration was performed from to with a maximum time , and the expansion rates were calculated every 100 steps, resulting in 15,000 time steps used to compute the exponents. The integration was carried out using a 4th-order Runge–Kutta (RK4) scheme with step size .
Consider again system (17). Assume that , and . To study the emergence of tori for forced two-frequency oscillations, consider the system
For , we have the quasi-periodic solutions
with constants determined by the initial conditions. The interactions of these quasi-periodic solutions are shown for small values of b in Figure 25.
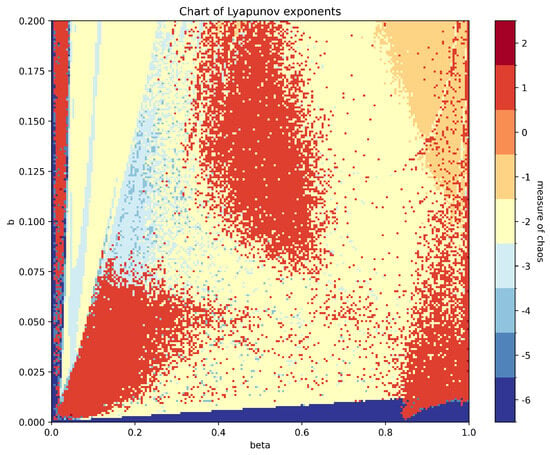
Figure 25.
Parameter chart for and , characterising the interactions of two quasi-periodic oscillations based on Equation (17), with fixed parameters , , and . The initial conditions are , , , , , and . The colouring scheme used corresponds to a classification based on the number of zero Lyapunov exponents, with a threshold of : any exponent with absolute value below this threshold is treated as zero. The values of the exponents, ranging from −6 to 2, are mapped to the colourmap as follows: dark blue regions indicate the absence of clear dynamics, with all six Lyapunov exponents near zero (undecided behaviour). Medium-dark blue corresponds to five exponents near zero, indicating a 5D torus, while medium blue (four near-zero exponents) corresponds to a 4D torus, and so on, with light blue corresponding to a 3D torus and yellow to a 2D torus, indicative of quasi-periodic behaviour. Orange regions correspond to systems with one zero exponent, representing periodic orbits, while regions in red and dark red indicate chaotic or hyperchaotic dynamics, with one or two positive Lyapunov exponents. For the calculation of the Lyapunov coefficients, integration was performed from to with a maximum time , and the expansion rates were calculated every 100 steps, resulting in 15,000 time steps used to compute the exponents.
If , the expressions of system (34) with constant amplitudes and phases are general quasi-periodic solutions of system (33). They describe for tori in phase space. We are interested in the bifurcations arising for . In Figure 24, we characterise these bifurcations by the Lyapunov exponents. We find periodic orbits (orange), 2- and 3-tori (resp. yellow and light blue), chaos (red), and hyperchaos (dark red spots).
The chart uses colours to represent the different dynamics based on the Lyapunov exponents of the system with the following cases:
- 0: All Lyapunov exponents are negative (no zeros). This indicates that the system settles to an equilibrium state.
- 1: One Lyapunov exponent is positive. This signifies the presence of chaos in the system.
- 2: Two Lyapunov exponents are positive. This corresponds to hyperchaos, where the system exhibits even more complex behaviour.
- −1: One Lyapunov exponent is zero, and all others are negative. This reflects a periodic orbit.
- −2: Two Lyapunov exponents are zero, and all others are negative. This corresponds to a T2 torus.
- −3 to −6: Increasing numbers of zero Lyapunov exponents, with all remaining exponents being negative. These represent higher-dimensional invariant tori with quasi-periodic behaviour.
As in most applications, the dissipation has to be fairly small; we zoom in for . We obtained and show the Lyapunov exponents in Figure 25.
4. Conclusions and Discussion
- Our paper essentially shows an efficient hybrid approach. Analysis, in particular averaging–normalisation and numerical bifurcation techniques, go hand in hand. Figure 15 is an example. The periodic solutions have been given by averaging and are indicated; the associated dynamics are added by numerics.
- The use of nonlinear oscillators enables us to study isolated quasi-periodic interactions. For two components (Section 3), the dynamics are essentially different from dissipative KAM theory.
- The interaction of two components in the sense of Section 3 is surprisingly rich, producing periodic solutions, 2- and 3-tori, chaotic, and hyperchaotic behaviour.
- Considering weak interactions and small oscillations, one already finds this rich collection of bifurcations. The chart in Figure 25 shows this for small b and .
- The thermostatic control used in the interacting systems originates from chemical physics. Applications of such a control to neural dynamics or economic models might be useful.
- In the analysis of dynamics, one can meet fractal manifolds that may show strange attraction. The use of Lyapunov exponents for fractal manifolds presents basic problems; improvements in the use of these exponents to compute Kaplan–Yorke dimensions will be discussed in a forthcoming paper [25].
Author Contributions
Conceptualization, Validation, Writing—original draft, T.B. and F.V. All authors have read and agreed to the published version of the manuscript.
Funding
This research received no external funding.
Data Availability Statement
The data that support the findings of this study are available from the corresponding author upon reasonable request.
Acknowledgments
High precision numerics were obtained using Matcont 5p3 ode 78 under Matlab R2023b.
Conflicts of Interest
The authors have no conflicts of interest.
Appendix A. Periodic Chains of n Coupled Systems
One can extend system (17) to more than two coupled components, but this poses a formidable problem. It is important to formulate in advance relevant questions for such complicated interacting chains, especially the question if and how the transmission of phenomena takes place in larger chains. This question has some relevance for neural dynamics. We restrict ourselves to some straightforward results. A few cases with will be used for illustration.
Extending system (17) to n coupled systems and again to simple direct coupling, we have the periodic chain
The interaction constant will determine the collective dynamics. In system (A1), the first component activates the second, the second one activates the third, etc. The component activates the first.
System (A1) can be written as a first-order system in -space with divergence
As in Section 3, the sign of the divergence will determine whether solutions will expand or contract locally.
Appendix A.1. Dynamics for Small Oscillations and Small Interactions
As in Section 2.1, we scale ; consider small interactions by selecting . Introducing amplitude–phase coordinates and averaging as in Section 2.1, we find the 3n-dimensional system for approximations:
For , a first illustration is presented in Figure A1, where we have small initial conditions and .
Appendix A.2. Equal Combination Angles and Control Parameters ai
A simple assumption is to choose in system (A3) the parameters and let the initial combination angles be equal.
Critical values
For a critical point of system (A3), we require that .
If initially and , the n amplitudes will be constant.
With these choices, system (A3) will have a critical point (equilibrium) corresponding with a periodic solution of system (A1).
To illustrate this, this we choose , so ; the combination angles and tend to the same values.
We show that in this case we can extend the analysis to obtain critical points of the averaged system (A3) and consequently periodic solutions of system (A1).
Selecting for these critical point components, we extend the symmetric solution discussed in Section 2.1 to four components. Assuming constant amplitudes, we need for the combination angles values . Substitution of the amplitude and angle values in the equations for the phases, we find that the combination angles are constant. This leads to two critical points and consequently two periodic solutions. The eigenvalues of the first equilibrium (i.e., the one with combination angles equal to zero) are
Using the parameters as in Figure A2, we find the first equilibrium is unstable.
As seen in Figure A2, the instability of the first equilibrium (case 1) is shown; the solution starting near equilibrium 1 moves to equilibrium 2 (case 2), where the z components tend to 1.
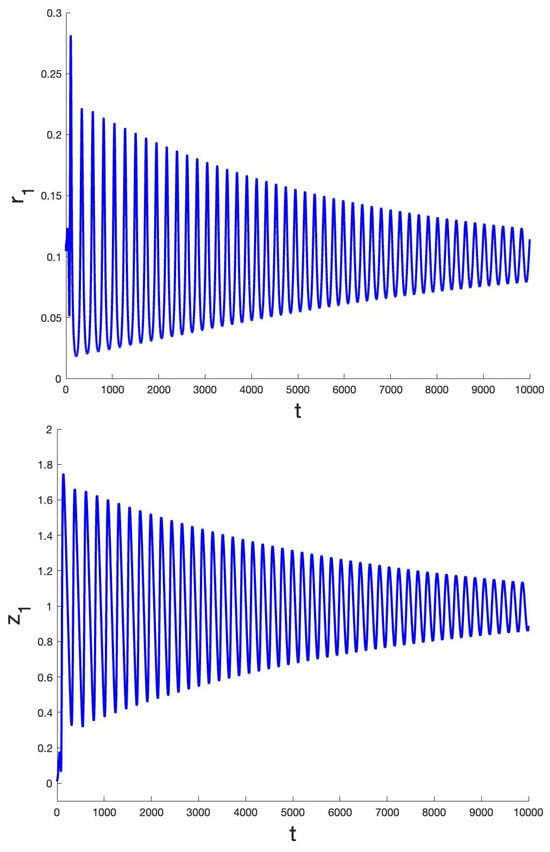
Figure A2.
Dynamics based on system (A1) for with projections and for 10,000 time steps. The initial conditions are taken near the critical point of case 1 in vector form with for the parameters . The components tend to the limiting values of case 2 (combination angles ).
Remark A1.
A different type of solution with equal combination angles but unequal zero z coordinates is possible. The combination angles are constant if . For to be constant, we find
This produces solutions with less symmetry. For the case , one can obtain explicit expressions with conditions for the parameters and for bifurcational behaviour.
References
- Broer, H.W.; Hanßmann, H.; Wagener, F. Parametrised KAM Theory, an Overview. Regul. Chaotic Dyn. 2025, 30, 408–450. [Google Scholar] [CrossRef]
- Broer, H.W.; Huitema, G.B.; Sevryuk, M.B. Quasi-Periodic Motions in Families of Dynamical Systems; Lecture Notes in Mathematics 1645; Springer: Berlin/Heidelberg, Germany, 1996. [Google Scholar]
- Kuznetsov, A.P.; Kuznetsov, S.P.; Shchegoleva, N.A.; Stankevich, N.V. Dynamics of coupled generators of quasiperiodic oscillations: Different types of synchronization and other phenomena. Physica D 2019, 398, 1–12. [Google Scholar] [CrossRef]
- Stankevich, N.V.; Shchegoleva, N.A.; Sataev, I.R.; Kuznetsov, A.P. Three dimensional torus breakdown and chaos with two zero Lyapunov exponents in coupled radio-physical generators. J. Comp. Nonl. Dyn. 2020, 15, 111001. [Google Scholar] [CrossRef]
- Komuro, M.; Kamiyama, K.; Endo, T.; Aihara, K. Quasi-Periodic Bifurcations of Higher-Dimensional Tori. Int. J. Bif. Chaos 2016, 26, 16300160. [Google Scholar] [CrossRef]
- Kuznetsov, A.P.; Sedova, Y.V. The Simplest Map with Three-Frequency Quasi-Periodicity and Quasi-Periodic Bifurcations. Int. J. Bif. Chaos 2016, 26, 1630019. [Google Scholar] [CrossRef]
- Verhulst, F. A Toolbox of Averaging Theorems, Ordinary and Partial Differential Equations; Surveys and Tutorials in the Applied Mathematical Sciences; Springer: Berlin/Heidelberg, Germany, 2023. [Google Scholar]
- Kuznetsov, Y.A. Elements of Applied Bifurcation Theory, 4th ed.; Applied Math. Sciences 112; Springer: Berlin/Heidelberg, Germany, 2023. [Google Scholar]
- Doedel, E.; Champneys, A.R.; Fairgrieve, T.F.; Kuznetsov, Y.A.; Sandstede, B.; Wang, X.J. AUTO97: Continuation and Bifurcation Software for Ordinary Differential Equations (with Hom-Cont); Concordia University: Montreal, QC, Canada, 1997. [Google Scholar]
- Matcont. Numerical Continuation and Bifurcation Program. Available online: http://www.matcont.ugent.be (accessed on 19 May 2025).
- Jafari, S.; Sprott, J.C.; Golpayegani, S. Elementary quadratic chaotic flows with no equilibria. Phys. Lett. A 2013, 377, 699–702. [Google Scholar] [CrossRef]
- Sprott, J.C. Some simple chaotic flows. Phys. Rev. E 1994, 50, R647–R650. [Google Scholar] [CrossRef] [PubMed]
- Messias, M.; Reinol, A.C. On the formation of hidden chaotic attractors and nested invariant tori in the Sprott A system. Nonlinear Dyn. 2017, 88, 807–821. [Google Scholar] [CrossRef]
- Messias, M.; Reinol, A.C. On the existence of periodic orbits and KAM tori in the Sprott A system: A special case of the Nose-Hoover oscillator. Nonlinear Dyn. 2018, 92, 1287–1297. [Google Scholar] [CrossRef]
- Bakri, T.; Verhulst, F. Time-reversal, tori families and canards in the Sprott A and NE9 systems. Chaos 2022, 32, 083119. [Google Scholar] [CrossRef] [PubMed]
- Bakri, T.; Verhulst, F. The Dynamics of the Sprott B System. Chaos 2024, 34, 103116. [Google Scholar] [CrossRef]
- Tuckerman, M.E. Statistical Mechanics: Theory and Molecular Simulation, 2nd ed.; Oxford University Press: Oxford, UK, 2017. [Google Scholar]
- Verhulst, F. Nonlinear Differential Equations and Dynamical Systems, 2nd ed.; Springer: Berlin/Heidelberg, Germany, 2000. [Google Scholar]
- Ciocci, M.-C.; Litvak-Hinenzon, A.; Broer, H.W. Survey on dissipative KAM theory including quasi-periodic bifurcation theory. Geom. Mech. Symmetry Peyresq Lect. 2005, 306, 303–355. [Google Scholar]
- Lamb, J.S.W.; Roberts, J.A.G. Time-reversal symmetry in dynamical systems: A survey. Physica D 1998, 112, 1–39. [Google Scholar] [CrossRef]
- Roberts, J.A.G.; Quispel, G.R.W. Chaos and time-reversal symmetry. Order and chaos in reversible dynamical systems. Phys. Rep. 1992, 216, 63–177. [Google Scholar] [CrossRef]
- Sanders, J.A.; Verhulst, F.; Murdock, J. Averaging Methods in Nonlinear Dynamical Systems, 2nd ed.; Springer: Berlin/Heidelberg, Germany, 2007. [Google Scholar]
- Verhulst, F. Methods and Applications of Singular Perturbations; Springer: Berlin/Heidelberg, Germany, 2005. [Google Scholar]
- Simo, C. On the analytical and numerical approximation of invariant manifolds. In Modern Methods in Celestial Mechanics; Editions Frontières: Paris, France, 1989. [Google Scholar]
- Bakri, T.; Verhulst, F. A note on the Kaplan-Yorke dimension. Int. J. Bif. Chaos 2025. acceped for publication. [Google Scholar]
Disclaimer/Publisher’s Note: The statements, opinions and data contained in all publications are solely those of the individual author(s) and contributor(s) and not of MDPI and/or the editor(s). MDPI and/or the editor(s) disclaim responsibility for any injury to people or property resulting from any ideas, methods, instructions or products referred to in the content. |
© 2025 by the authors. Licensee MDPI, Basel, Switzerland. This article is an open access article distributed under the terms and conditions of the Creative Commons Attribution (CC BY) license (https://creativecommons.org/licenses/by/4.0/).
