4.3.1. Results Analysis on the ASCERTAIN Dataset
Training Loss Evaluation
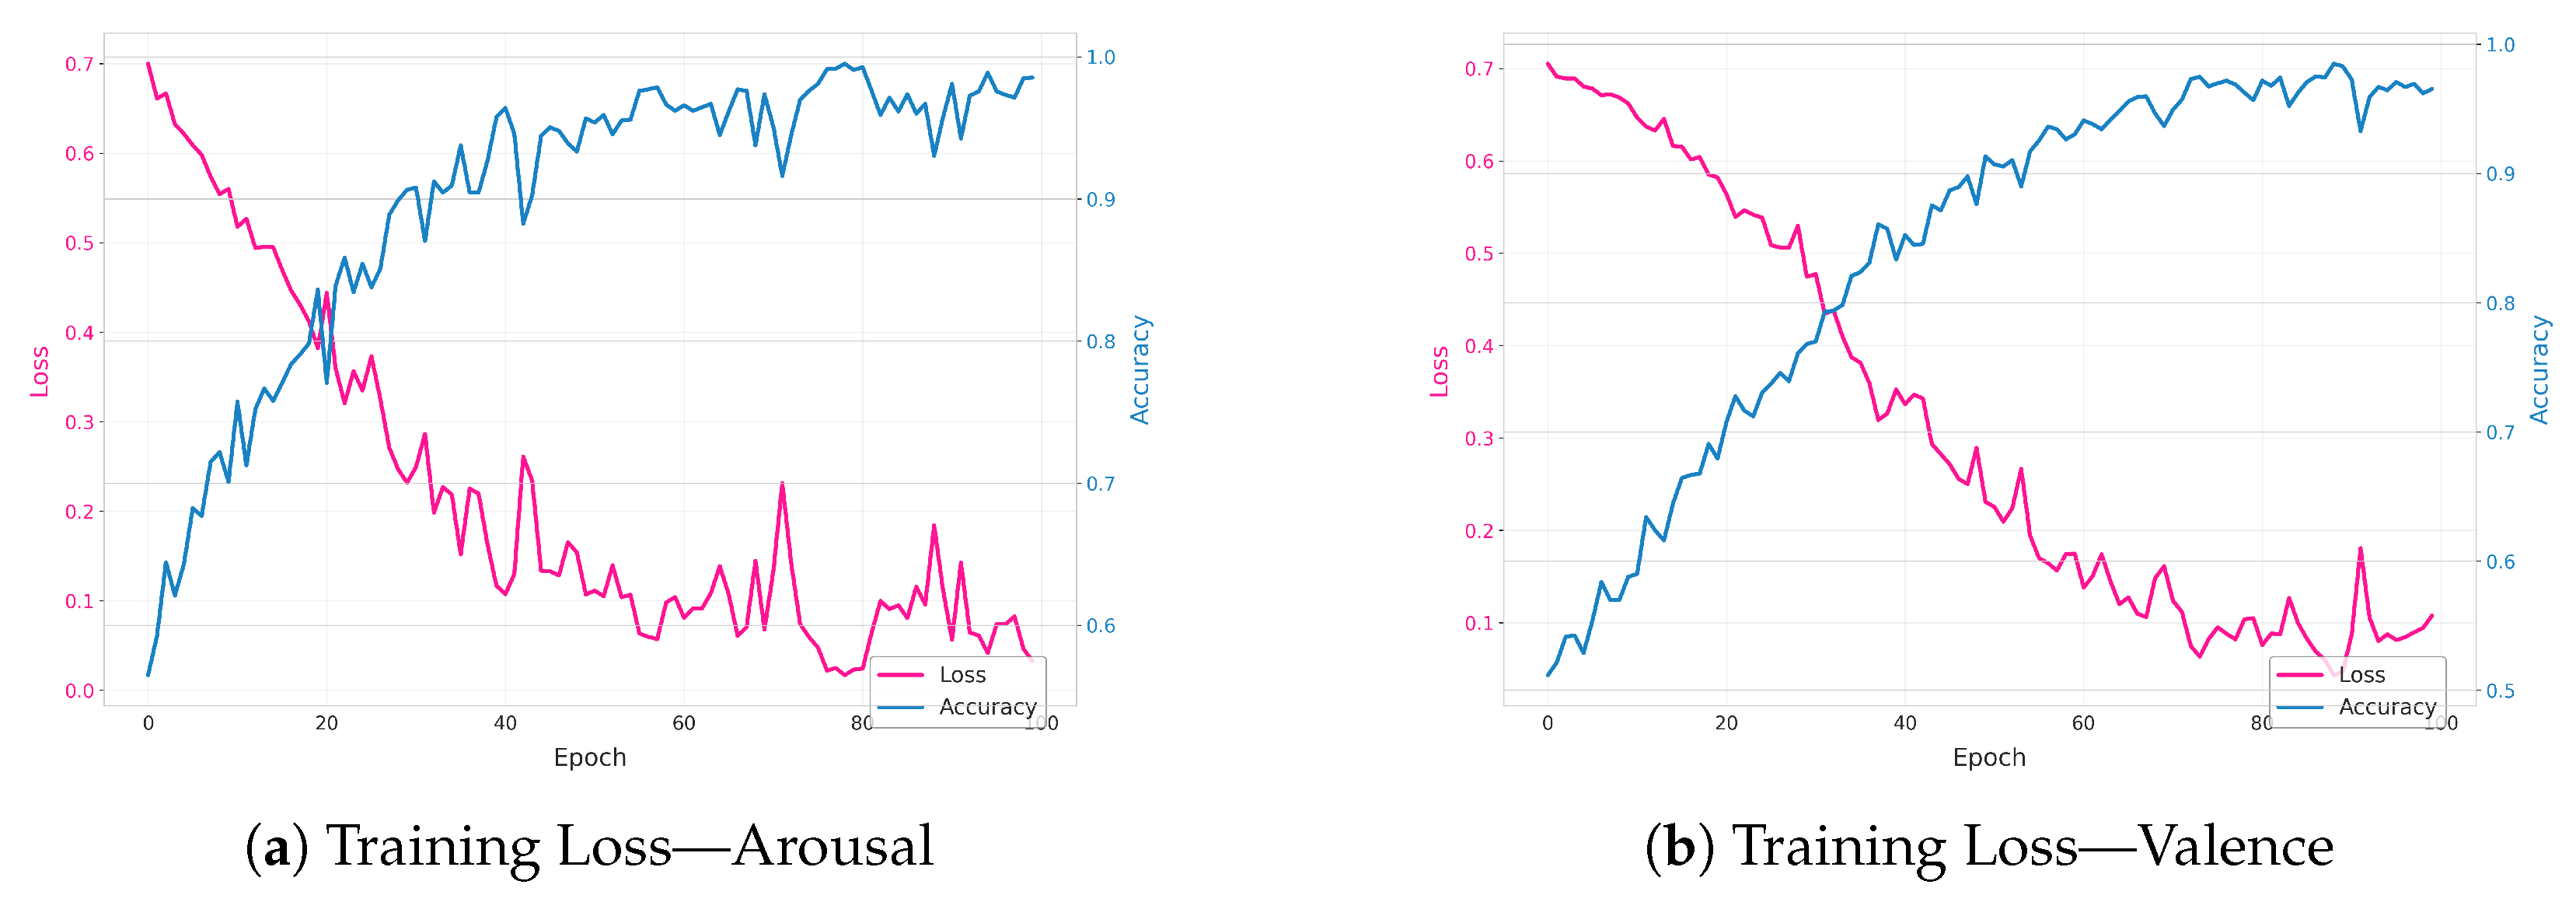
The plots in
Figure 6 showcase the losses that we obtained after training the proposed approach on the ASCERTAIN dataset focusing on both arousal and valence. In the first plot (arousal), the training loss (pink) starts relatively high but steadily falls as the model learns, while the accuracy (blue) steadily rises toward near-perfect levels. This behavior indicates that the model effectively captures arousal-related features over the training epochs; however, such high accuracy warrants checking against a separate test or validation set to rule out potential overfitting.
The second plot (valence) exhibits a similar pattern—loss decreases while accuracy increases—yet the trajectory shows a bit more fluctuation, suggesting that valence prediction may be a slightly trickier or noisier target. Periodic spikes in the loss, especially later in training, can occur when the optimizer encounters challenging batches or takes more aggressive steps. Nevertheless, the overall downward trend of the loss and upward trend of accuracy confirm that the model successfully learns from the valence data.
Model Performance
In this section, we present a thorough analysis of our model’s classification performance on both arousal and valence tasks. As summarized in
Table 1, we evaluated the model for accuracy, precision, recall, F1-score, G-mean, and AUC-ROC (Area Under the Receiver Operating Characteristic curve). It achieved consistently high values across both prediction setups. In particular, arousal prediction achieved an accuracy of 99.71%, precision of 100%, recall of 99.65%, F1 of 99.83%, G-mean of 99.38%, and an AUC-ROC of 99.99%. Meanwhile, valence prediction demonstrates an accuracy of 99.71%, precision of 99.92%, recall of 99.60%, F1 of 99.76%, G-mean of 99.73%, and a perfect AUC-ROC of 100%. These metrics collectively illustrate the model’s robust performance and high discriminative power in differentiating the emotional states within the ASCERTAIN dataset.
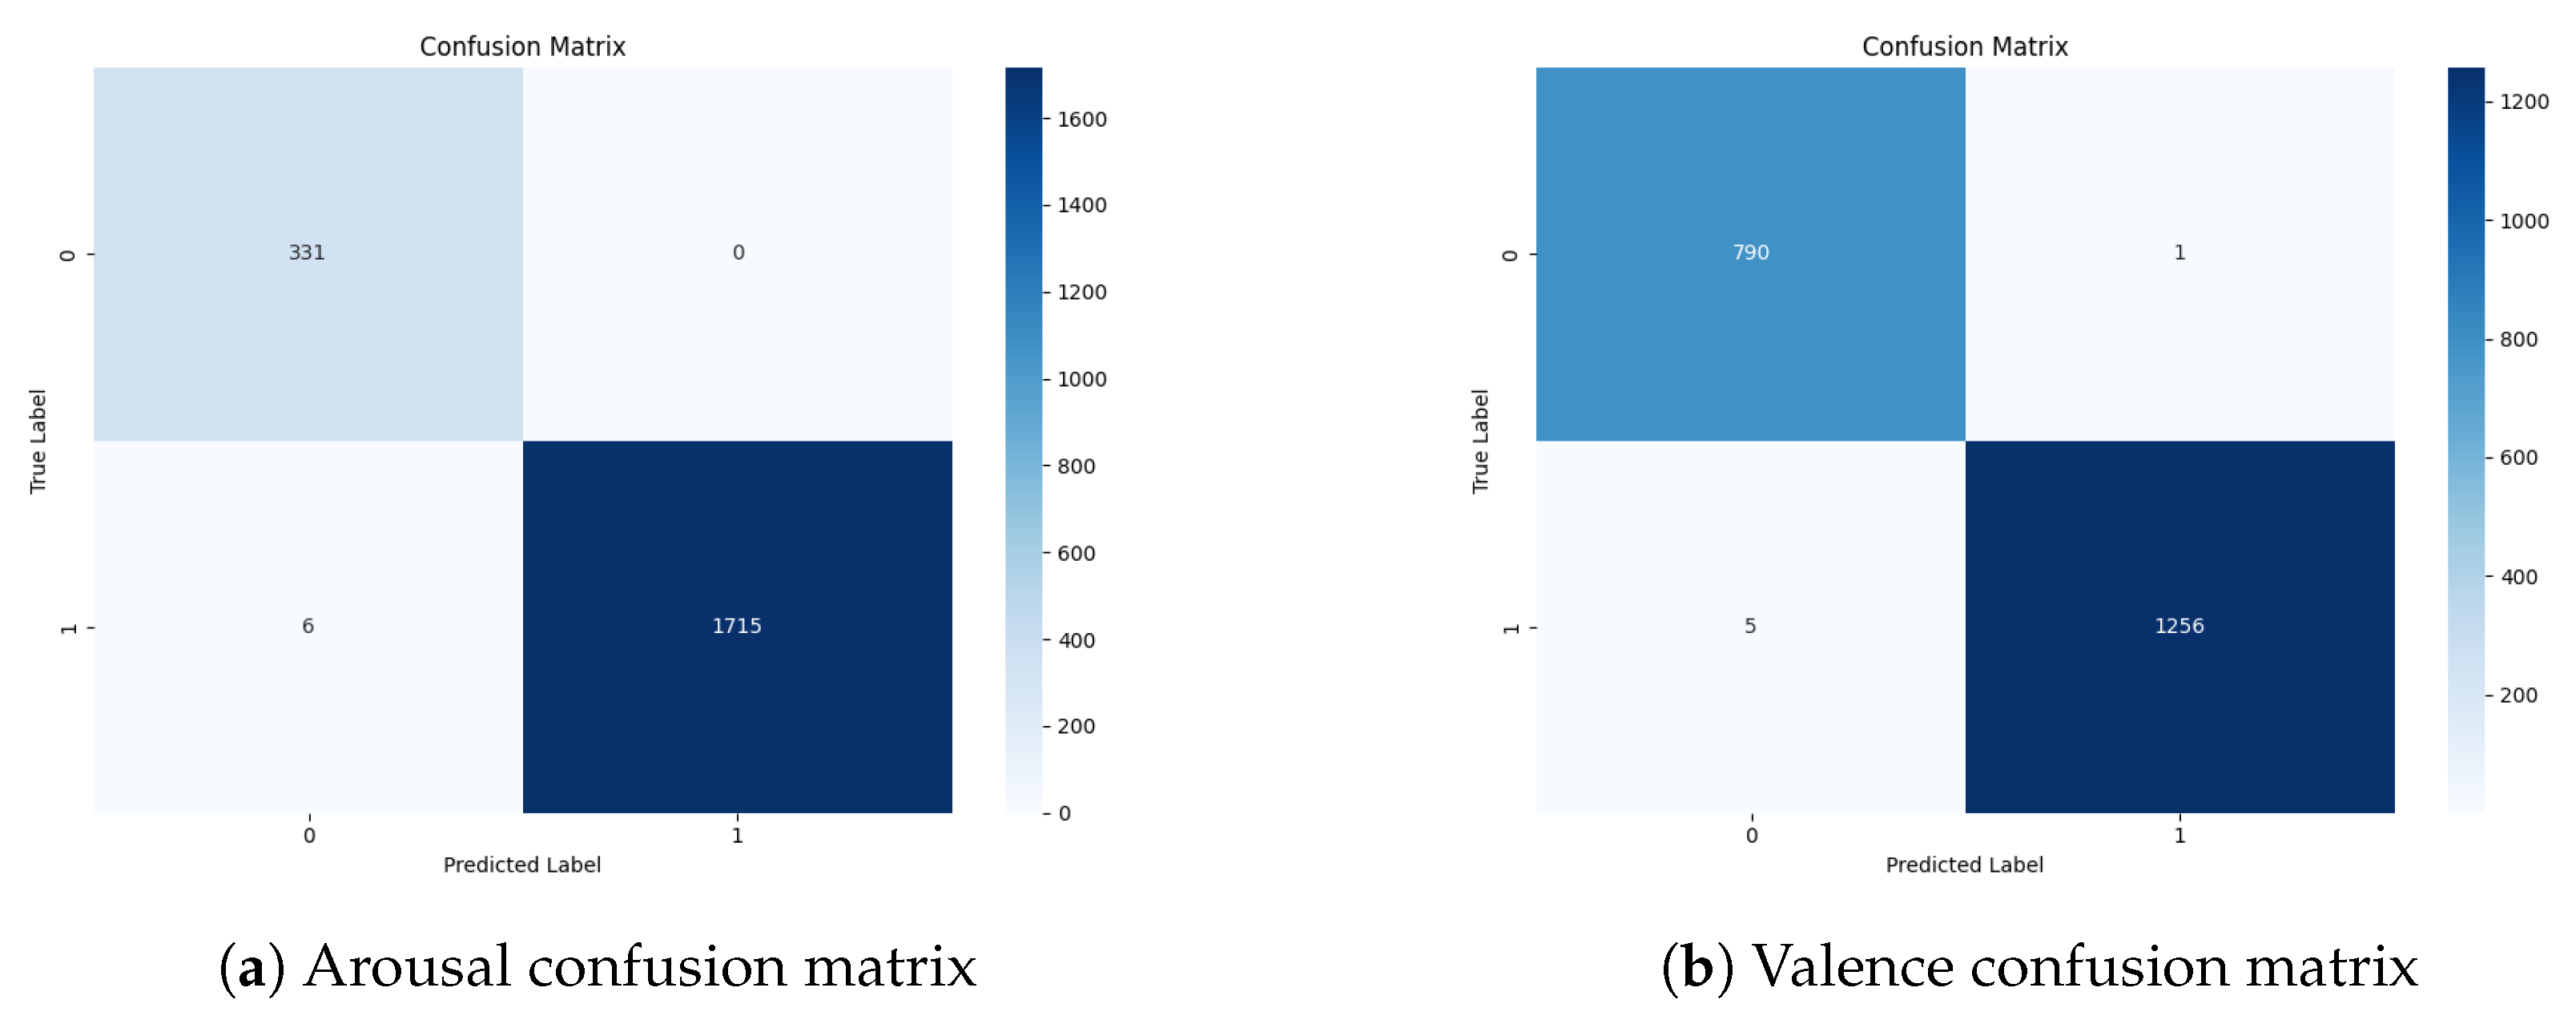
In
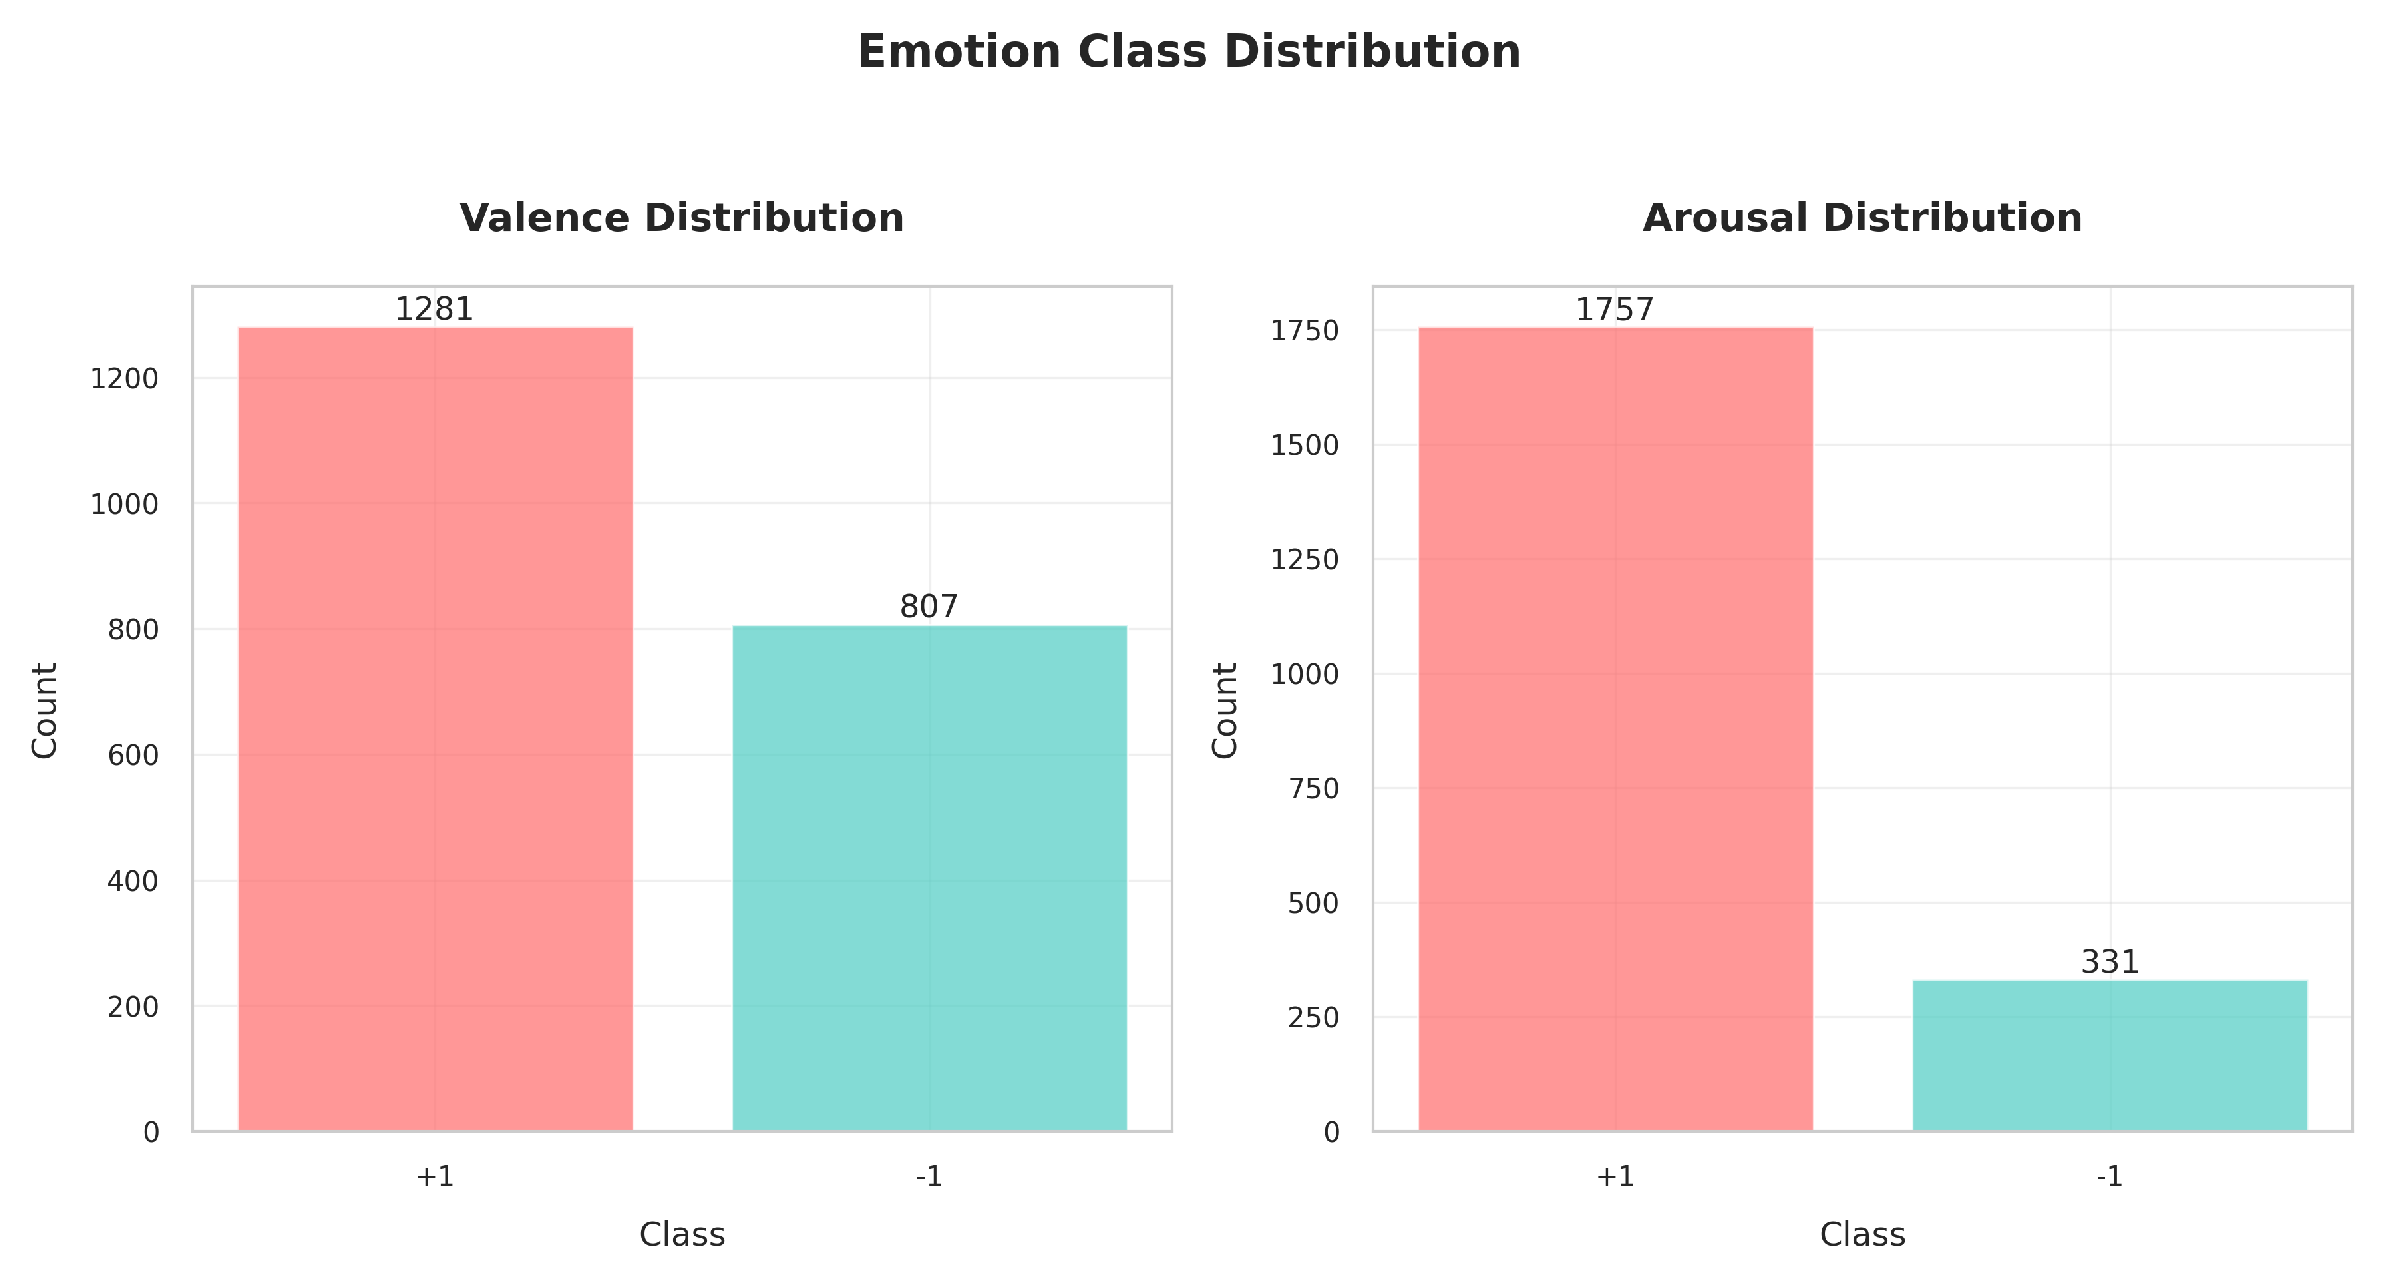
Figure 7, we present the confusion matrix for both prediction types. Focusing on the arousal confusion matrix, the model correctly identified 331 “low” arousal samples (true negatives) with zero false positives while accurately classifying 1715 “high” arousal samples (true positives) at the cost of only 6 misclassifications (false negatives). This near-perfect balance between precision (100%) and recall (99.65%) directly leads to a high F1-score of 99.83%, reflecting the model’s ability to consistently make correct predictions for both classes. The G-mean of 99.38% confirms that performance is not skewed toward any one class, while an AUC-ROC of 99.99% highlights the model’s excellent capacity to separate “low” and “high” arousal instances under various decision thresholds.
Turning to the valence confusion matrix, the model demonstrates similarly high fidelity: 790 “low” valence samples are correctly classified and only 1 is misclassified (false positive), while 1256 “high” valence samples are correctly identified with merely 5 false negatives. This yields a high precision of 99.92% and recall of 99.60%, contributing to an F1-score of 99.76%. Notably, the G-mean of 99.73% points to well-balanced performance across the two valence levels, and the flawless 100% AUC-ROC indicates the model’s ability to discriminate “low” vs. “high” valence over the full spectrum of potential classification thresholds. Overall, these results attest to the robustness and generalizability of our transformer-based approach for emotion classification with the ASCERTAIN dataset.
Visualization of Learned Feature Representations
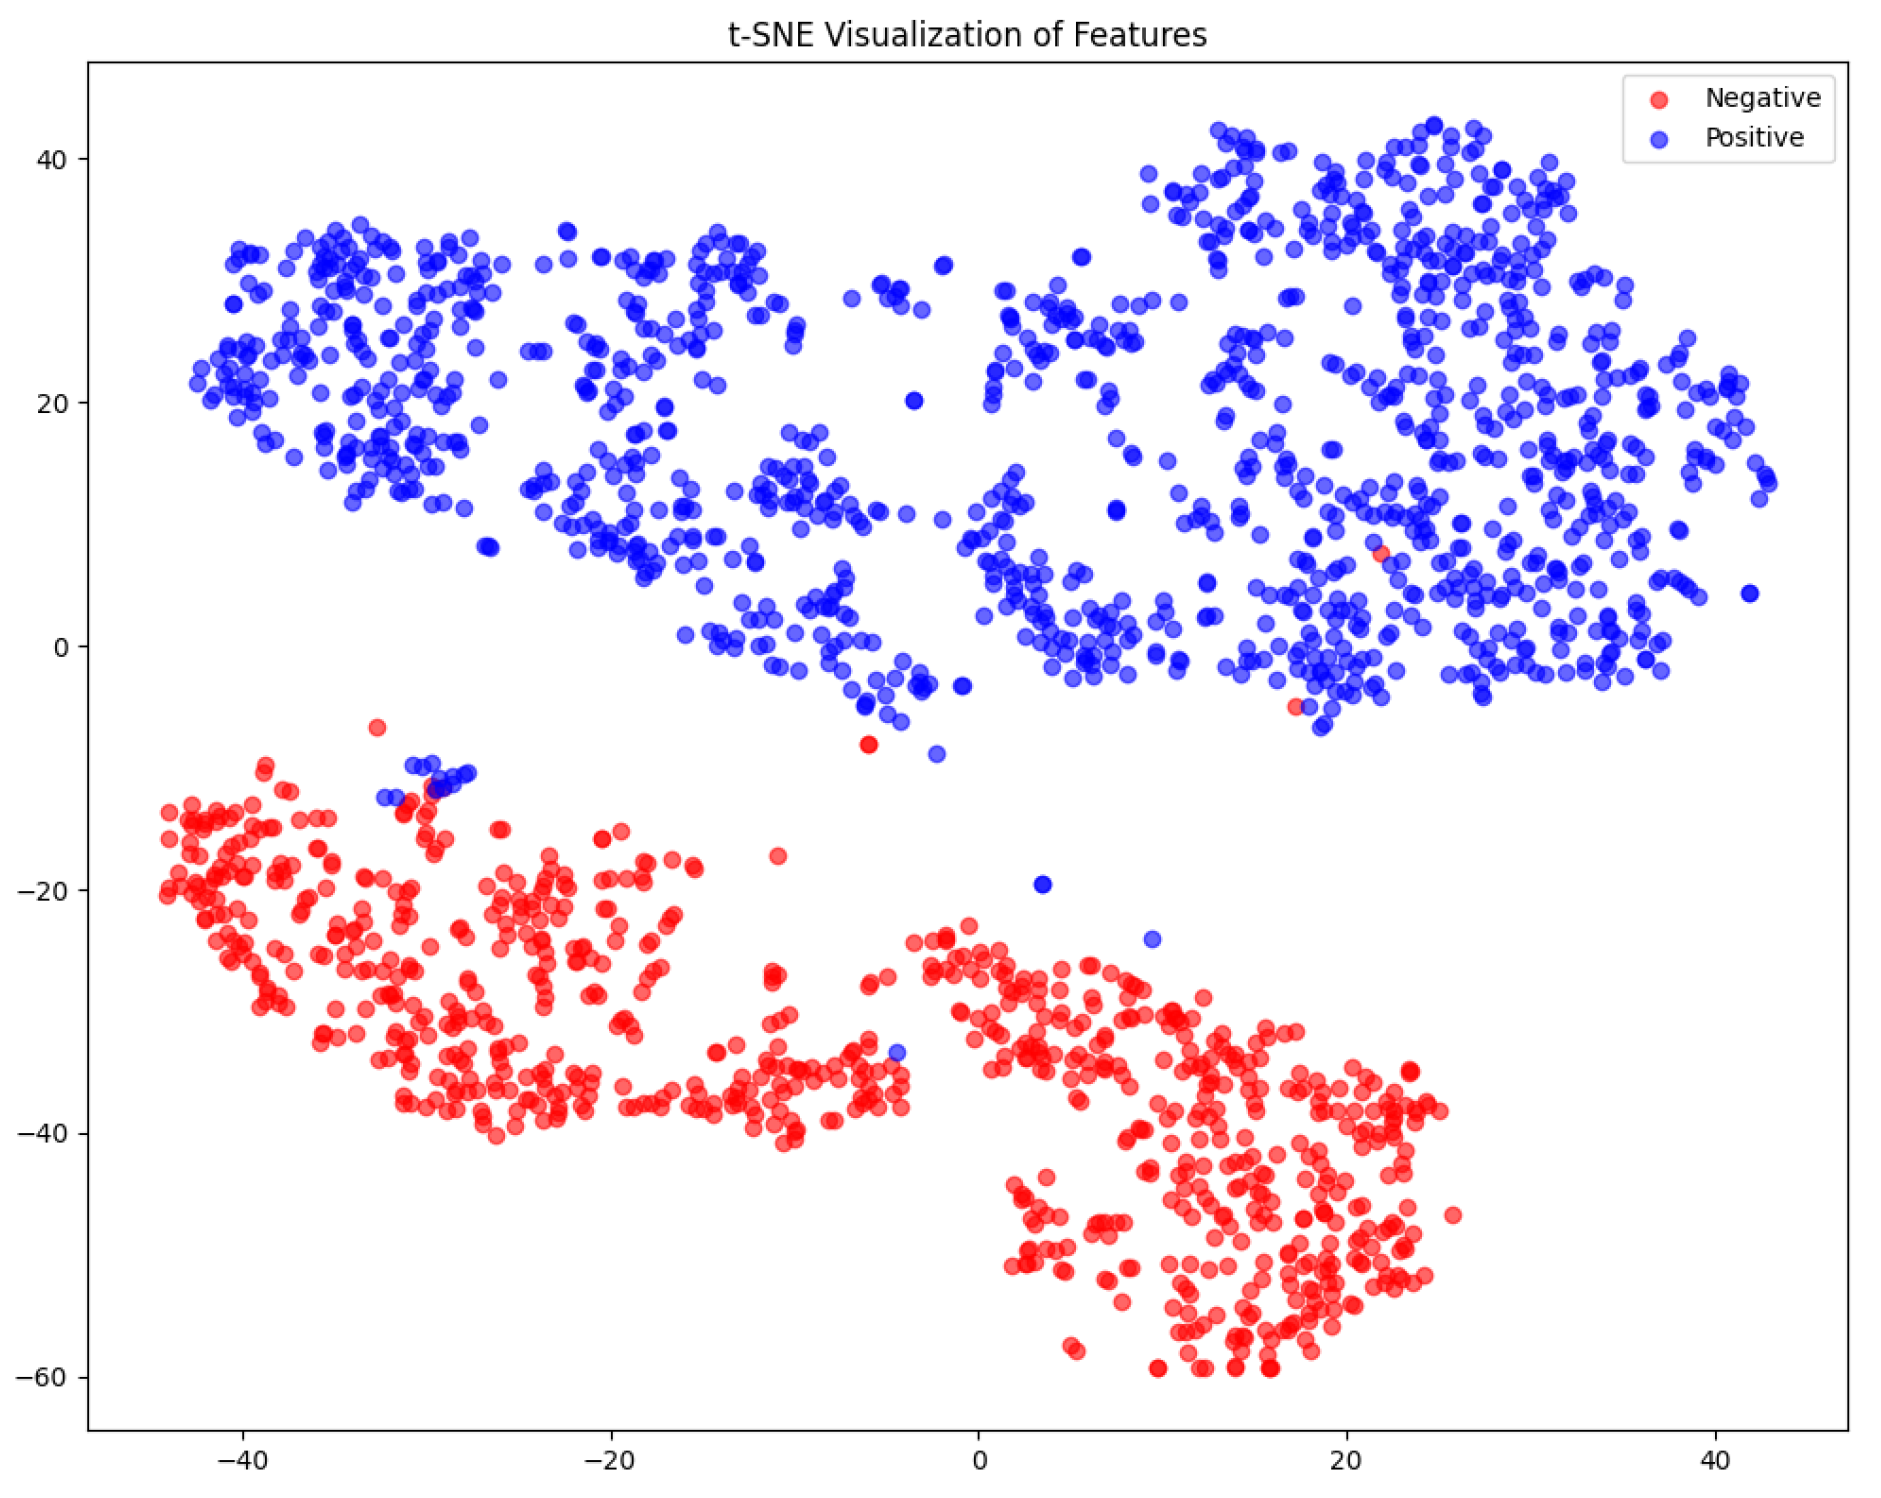
To gain deeper insights into the feature representations learned by our model, we employ t-distributed Stochastic Neighbor Embedding (t-SNE), a popular dimensionality reduction technique that visualizes high-dimensional data in a two-dimensional space. The goal of this experiment is to assess the quality of the learned feature representations for both arousal and valence prediction by examining how well the feature embeddings separate different emotional states.
As presented in
Figure 8, the t-SNE visualization for arousal prediction reveals two well-separated clusters, indicating that the model effectively distinguishes between positive and negative arousal states. The strong separation suggests that the learned feature representations capture variations in arousal accurately, minimizing ambiguity. The low degree of overlap between clusters highlights the model’s discriminative power, reinforcing its ability to classify arousal states with high confidence. However, a few scattered points near the boundary suggest the presence of ambiguous cases, where arousal levels may not be strictly high or low, potentially leading to minor misclassifications.
For the valence prediction depicted in
Figure 9, we can see that the two clusters remain distinct from each other. However, the separation margin appears slightly smaller than it is for arousal. The increase in overlapping points suggests that distinguishing between positive and negative valence is relatively more challenging. Despite this, the tight clustering indicates that the model learns compact and well-structured feature representations for valence classification. The inter-cluster separation remains evident, which is encouraging, though a few scattered points near the boundary may reflect instances of mixed emotional valence, where emotions are not clearly polarized.
These findings validate the effectiveness of our approach and suggest that further fine-tuning could focus on reducing any overlap in valence representations to improve classification accuracy further.
Impact Analysis of Different Expert Combinations
In this section, we review our extensive evaluation of how different modality–expert combinations impact arousal prediction performance. This experiment is crucial because it clarifies how each physiological or contextual signal—from ECG to EEG to GSR to EMO— contributes unique information. It also shows how combining these signals in various ways either enhances or diminishes the model’s ability to accurately classify arousal states.
Focusing first on the single-modality expert performance in
Table 2, we see that EEG stands out with an accuracy of
99.17%, an F1-score of
99.51%, and an almost perfect AUC-ROC of
99.94%. This suggests that brain activity signals alone carry substantial information for arousal detection.
GSR (Galvanic Skin Response) and
EMO (presumably emotion-related contextual cues) achieve moderate yet solid performances, each exceeding 85% in accuracy and surpassing 90% in G-mean, indicating a decent balance across both classes. However,
ECG (electrocardiogram) yields the lowest accuracy at
75.97%, despite having relatively high precision. The lower recall of
76.35% for ECG suggests that while it rarely mislabels non-arousal samples, it is not as adept at capturing all positive (high-arousal) instances, which lowers the overall F1-score to
84.20%.
Table 3 depicts the results of combining
two modalities; the synergy from using two signals emerges clearly.
ECG + EEG achieves a near-flawless accuracy of
99.71% and a perfect
100% AUC-ROC, signifying the strong complementarity nature of using heart-rate and brain wave data together for emotion recognition. Similarly,
EEG + EMO and
GSR + EEG both exceed
98.8% accuracy, reinforcing the value of EEG as a critical modality. In the
three-modality experts results represented in
Table 4,
ECG + GSR + EEG stands out with a remarkable accuracy of
99.95%, an F1-score of
99.97%, and a
100% AUC-ROC—making it arguably the best performing combination overall. Interestingly, adding
all four modalities (
ECG + EEG + GSR + EMO), as presented in
Table 5 maintains an impressive accuracy of
99.71% with a
99.99% AUC-ROC, though it does not surpass the top three-modality expert. This slight dip indicates that introducing additional signals does not always guarantee higher accuracy, highlighting the importance of judicious modality selection and fusion strategies for optimal arousal classification.
Furthermore, we also analyzed the valence-prediction performance across various modality--expert combinations. By systematically comparing single-modality experts against multi-modal configurations, we identified which signals—and how many—most effectively captured the underlying valence patterns.
Looking first at the
single-modality experts in
Table 6,
EEG achieves the highest accuracy (98.78%) and nearly perfect AUC-ROC (99.96%), suggesting that brain wave features alone offer a strong basis for valence discrimination.
EMO also delivers respectable performance (80.12% accuracy, 80.85% F1-score), while
ECG shows a moderate 62.62% accuracy but surprisingly high recall (98.65%), indicating a tendency to over-predict the positive class. In contrast,
GSR registers the lowest accuracy (53.90%) and recall (30.06%), illustrating that skin-conductance data by itself may not be sufficient for accurately capturing valence variations.
Turning to
Two-modality experts (
Table 7), combining
ECG + EEG yields an impressive 99.76% accuracy and a near-perfect 99.99% AUC-ROC, highlighting the complementary nature of heart-rate and brain wave cues. Likewise,
GSR + EEG attains 99.66% accuracy and a 99.99% AUC-ROC, demonstrating that GSR’s limitations are significantly mitigated when coupled with EEG’s robust signal features. Notably,
EEG + EMO also excels, with 99.37% accuracy and 99.98% AUC-ROC, indicating the added benefit of contextual or behavioral signals alongside neural activity.
Examining the
three-modality experts in
Table 8,
ECG + GSR + EEG stands out with a near-perfect 99.85% accuracy and 100% AUC-ROC, showcasing exceptional synergy among these signals. Meanwhile,
ECG + EEG + EMO achieves 99.03% accuracy and 99.97% AUC-ROC, and
GSR + EEG + EMO is only slightly behind at 98.78% accuracy. Finally, fusing
all four modalities (
ECG + EEG + GSR + EMO) in
Table 9 produces a 99.71% accuracy with a flawless 100% AUC-ROC, surpassing most three-expert combinations. This outcome underscores the value of multimodal integration for capturing nuanced valence patterns while also showing that EEG is a critical contributor to high-fidelity valence classification.
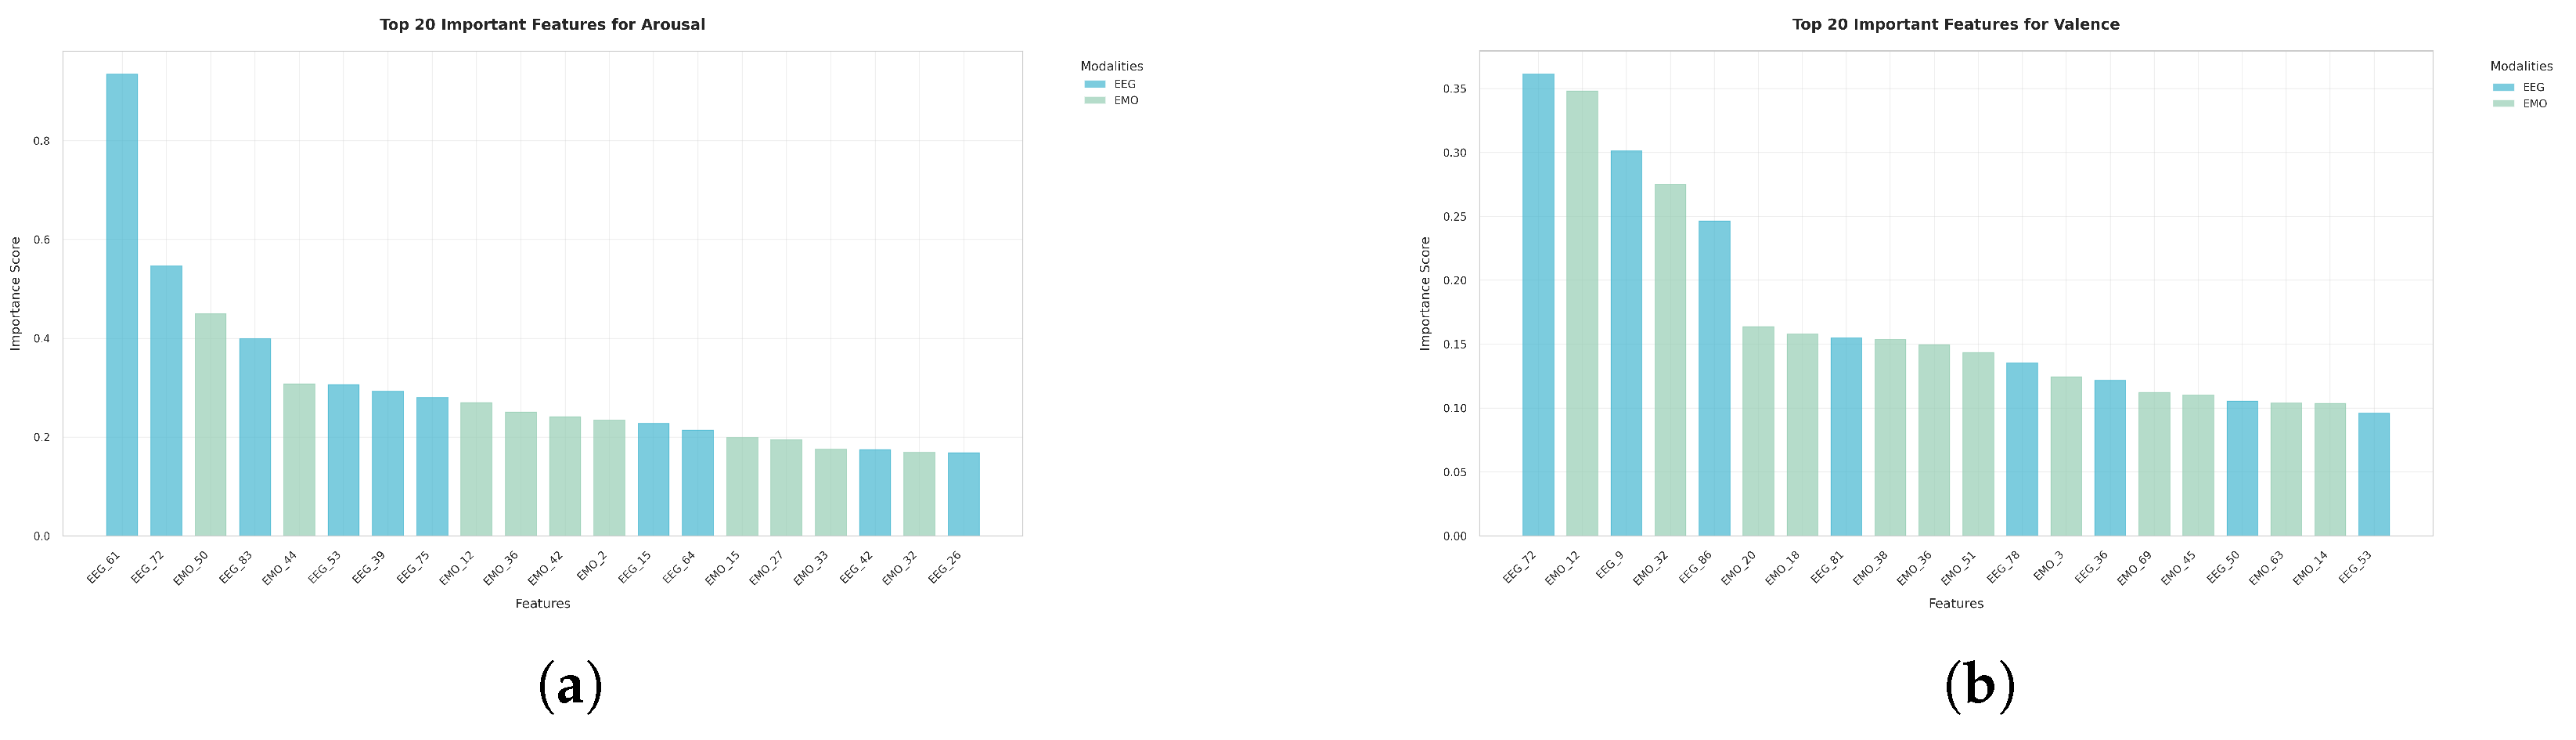
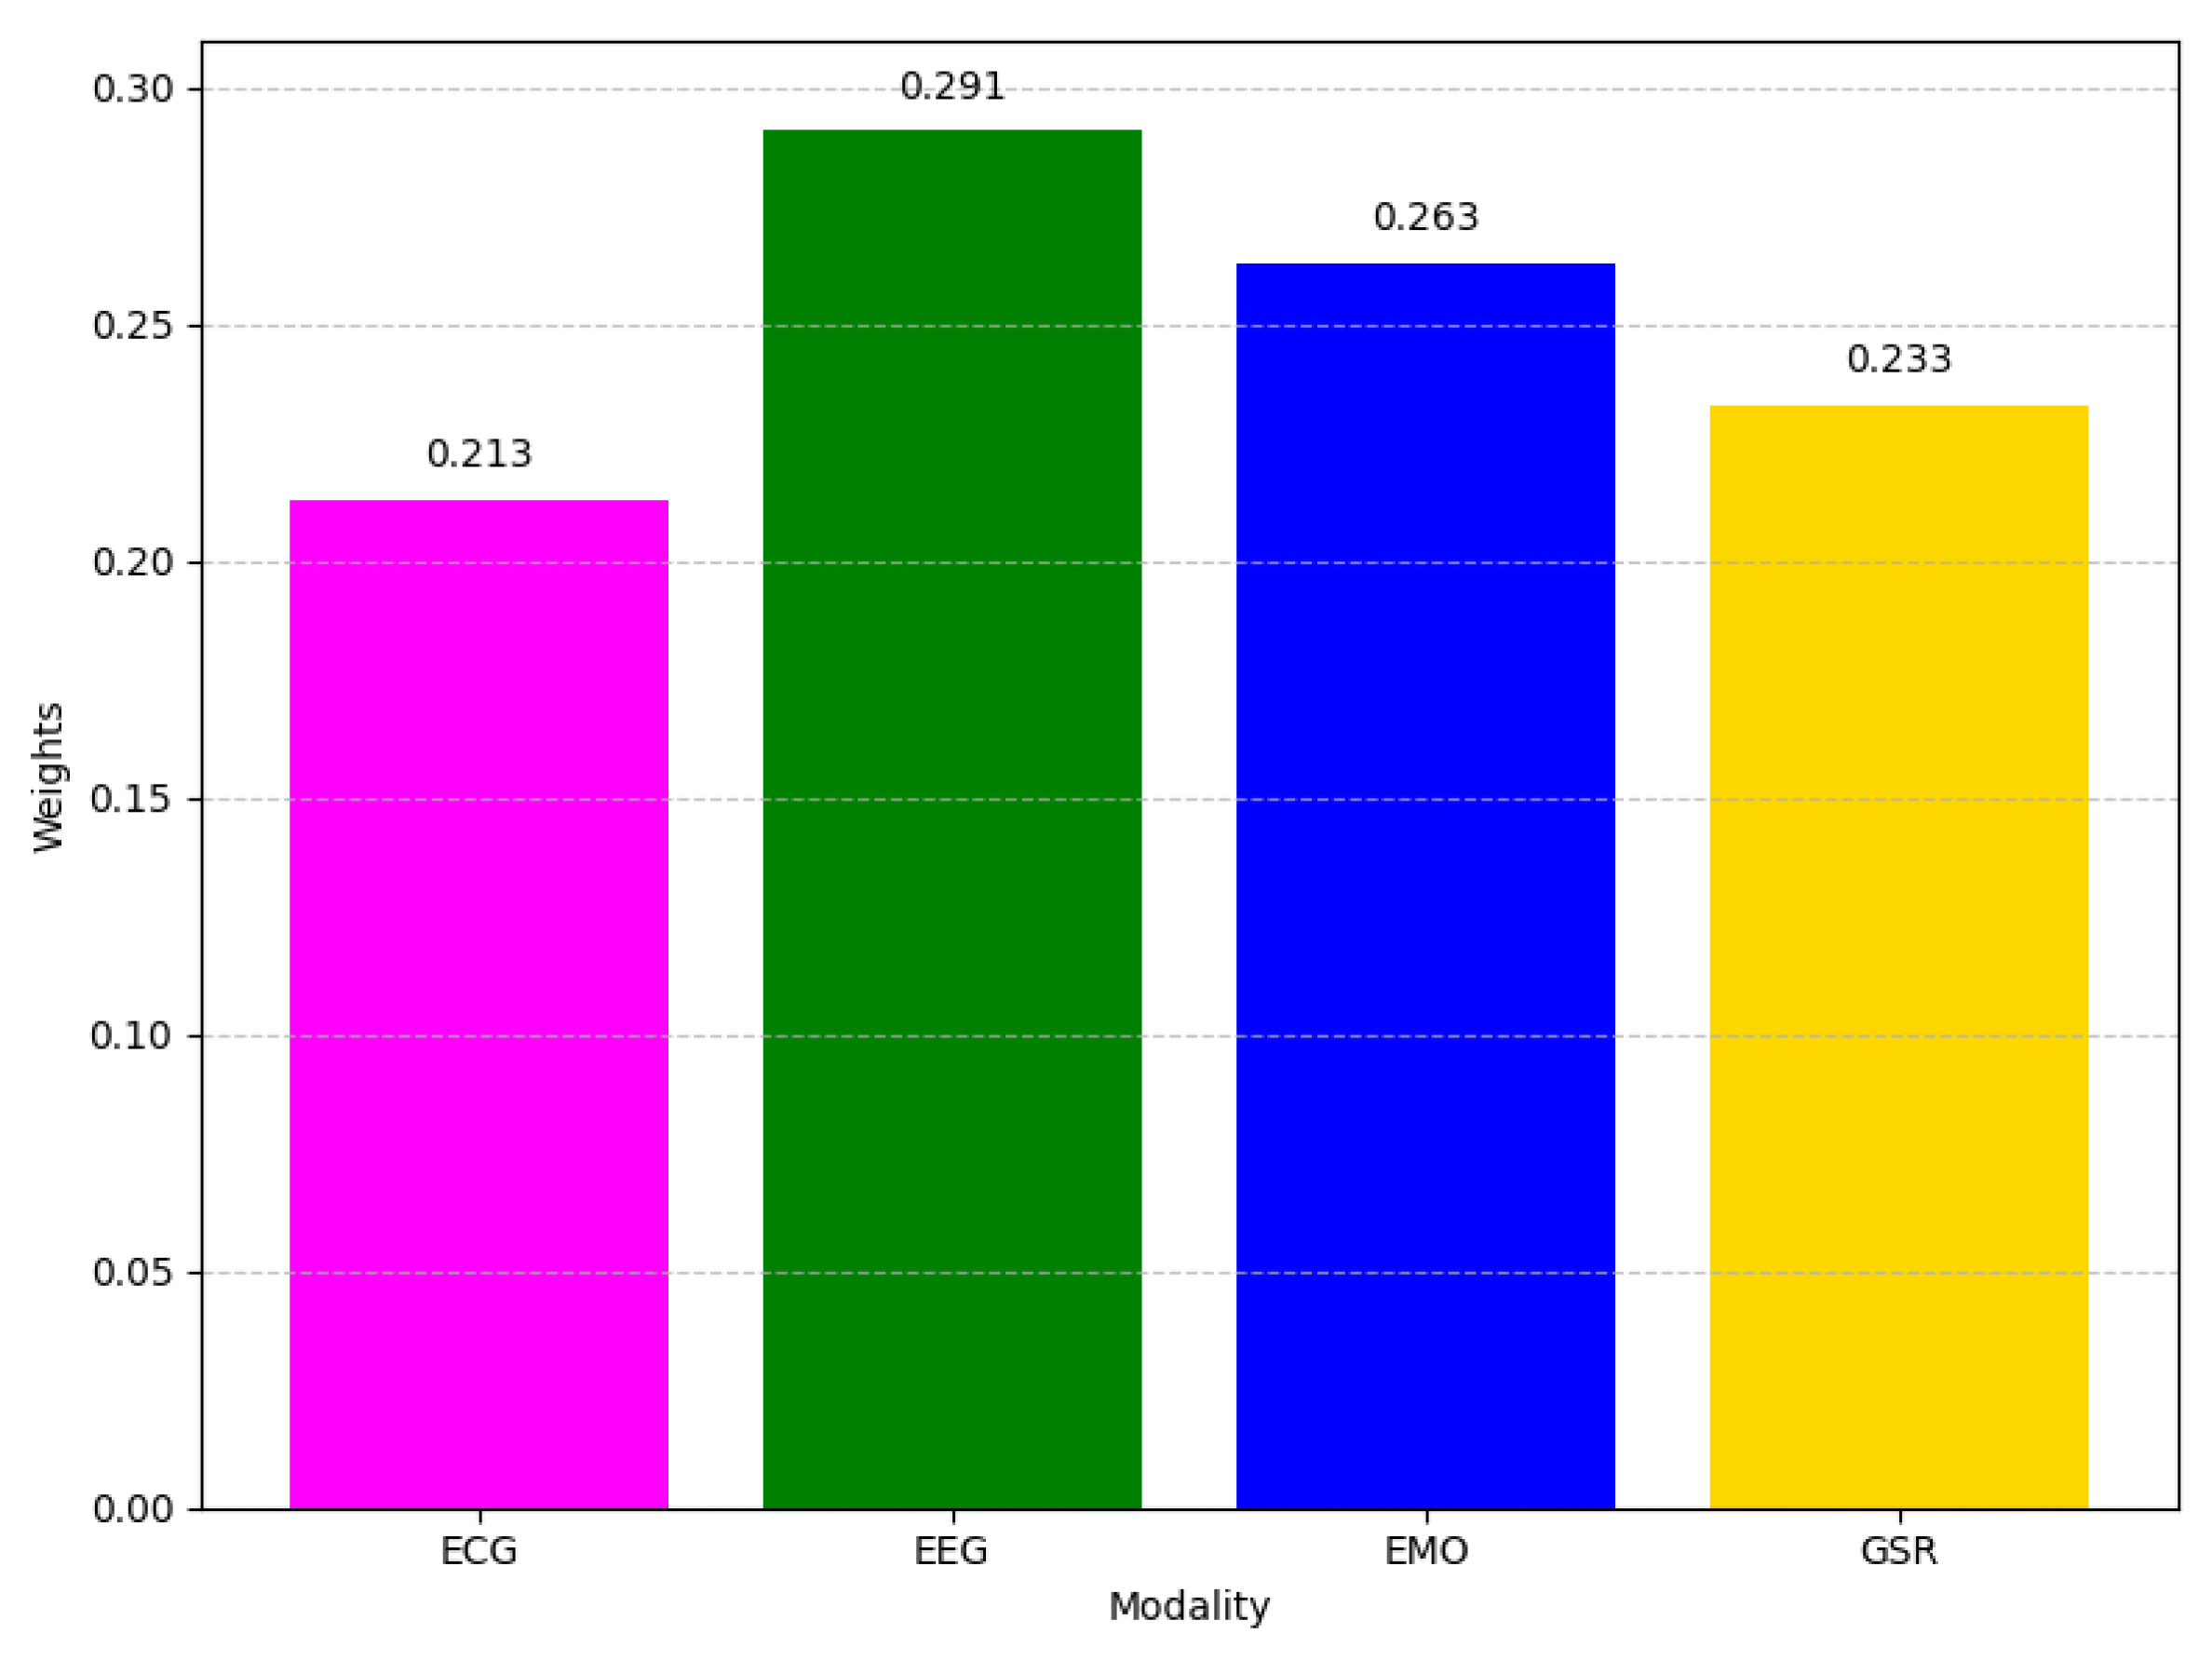
In
Figure 10, which gives the importance weighting of each input modality for arousal prediction,
EEG exhibits the highest normalized fidelity score at
0.291, reinforcing earlier observations that neural activity signals contain rich information for accurately distinguishing different arousal levels.
EMO ranks second (0.263), implying that emotional or behavioral contextual cues also play a substantial role in the arousal inference.
GSR (0.233) is slightly less important but still makes a non-trivial contribution, while
ECG (0.213) shows the smallest weight in the ensemble. This pattern generally aligns with our single-modality and multi-modality experiments, suggesting that EEG remains the leading modality for capturing arousal, though other signals reinforce the final decision.
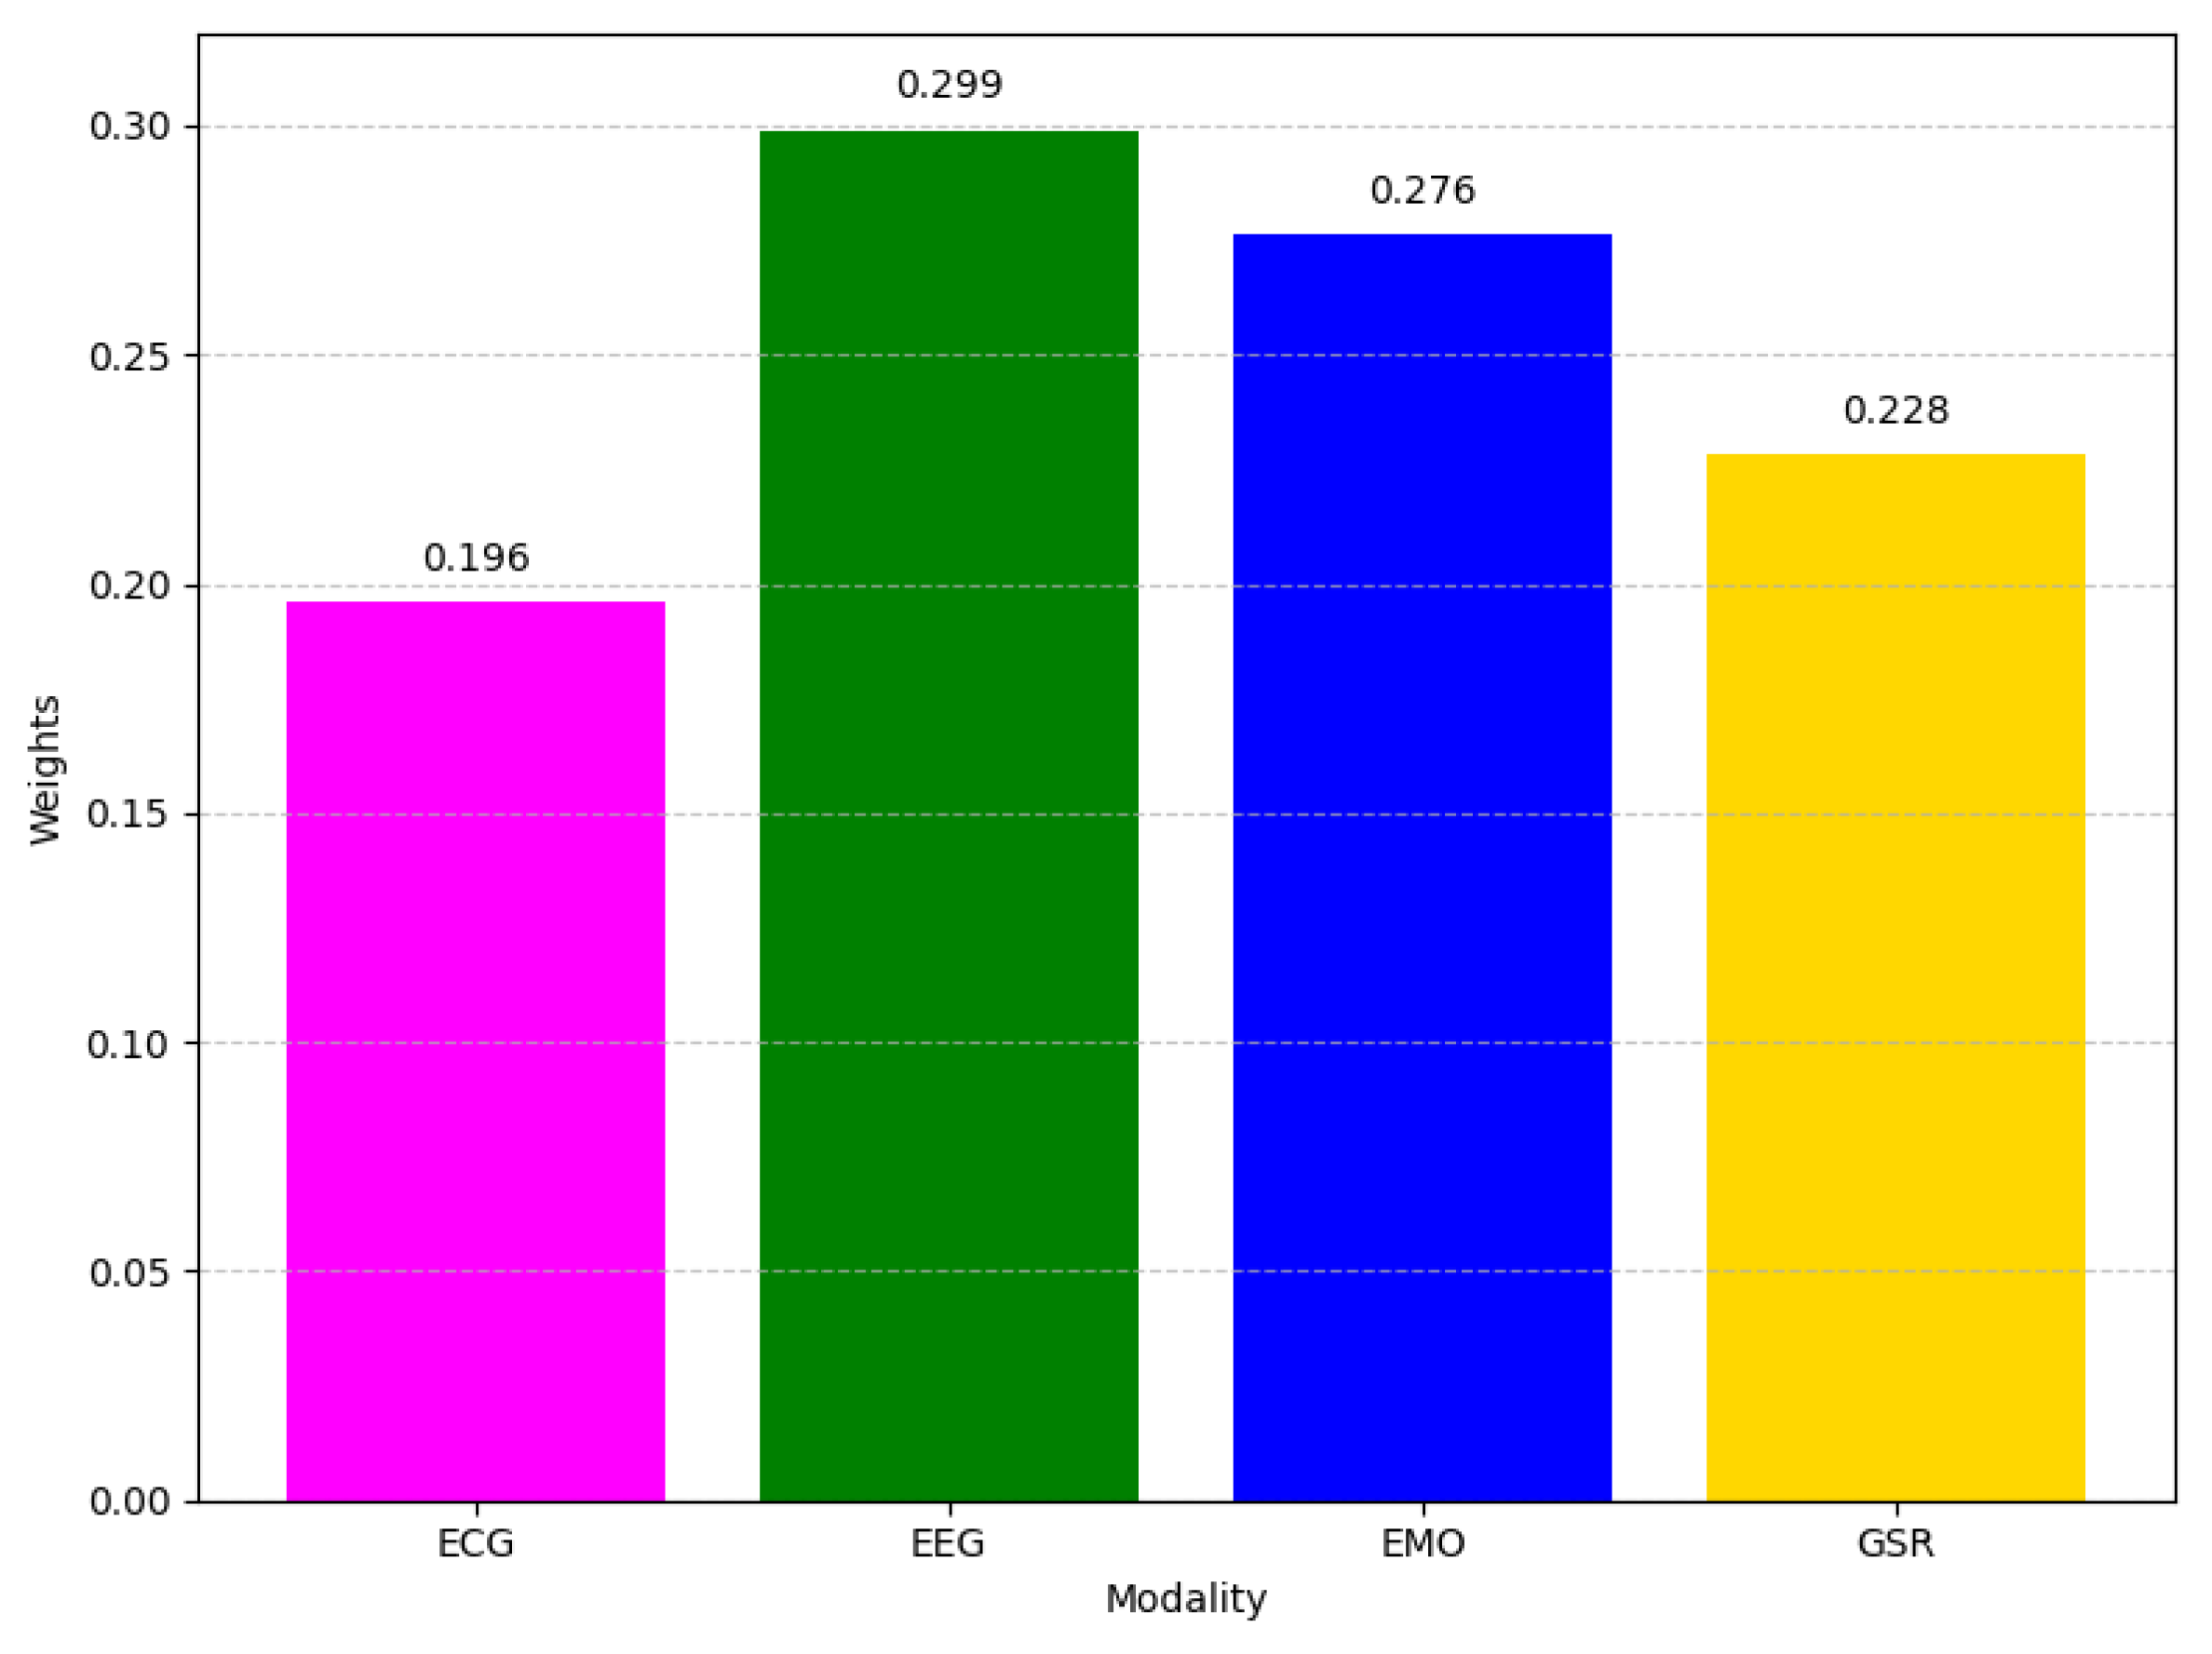
A similar trend is depicted in
Figure 11, which gives the relative importance of each modality in valence prediction, where
EEG (0.299) maintains the largest impact by a comfortable margin.
EMO (0.276) again closely follows, confirming that capturing emotional or contextual signals continues to be highly valuable for distinguishing positive and negative valence. Meanwhile,
GSR (0.228) and
ECG (0.196) show comparatively lower importance, mirroring the relative contributions observed in the arousal task. Hence, across both experiments, EEG consistently emerges as the most valuable source of information, with EMO often reinforcing classification performance. GSR and ECG make smaller yet still meaningful contributions to the model’s predictive power.
Comparative Study with State-of-the-Art Approaches
In this section, as presented in
Table 10, we provide a comprehensive comparison of our method against several highly regarded works in the literature, illustrating how our approach advances the state of the art for both arousal and valence prediction. Examining the table, we see that traditional deep learning architectures like LSTM [
60] achieve 81.60% for arousal and 79.18% for valence, while Deep CNN and Deep CNN-CBAM [
61] both score around 78.7% and 75.6% for valence and arousal predictions, respectively. Although the ensemble approach [
62] improves these metrics to 95% for arousal and 93% for valence, and LSTMP [
60] achieves scores of 89.17% and 86.49%, respectively, our proposed technique exceeds all previous methods with an exceptional 99.71% for both arousal and valence.
These results indicate that our transformer-based architecture, combined with its effective fusion strategy, substantially enhances emotional state classification performance. The improvements are particularly pronounced when compared to methods that rely solely on recurrent or convolutional layers. Overall, this comparison underscores the value of our design choices in capturing nuanced features from multimodal signals, thus advancing the benchmark for emotion recognition in terms of both predictive accuracy and robustness.
4.3.2. Results Analysis on the KEMDy20 Dataset
Training Loss Evaluation
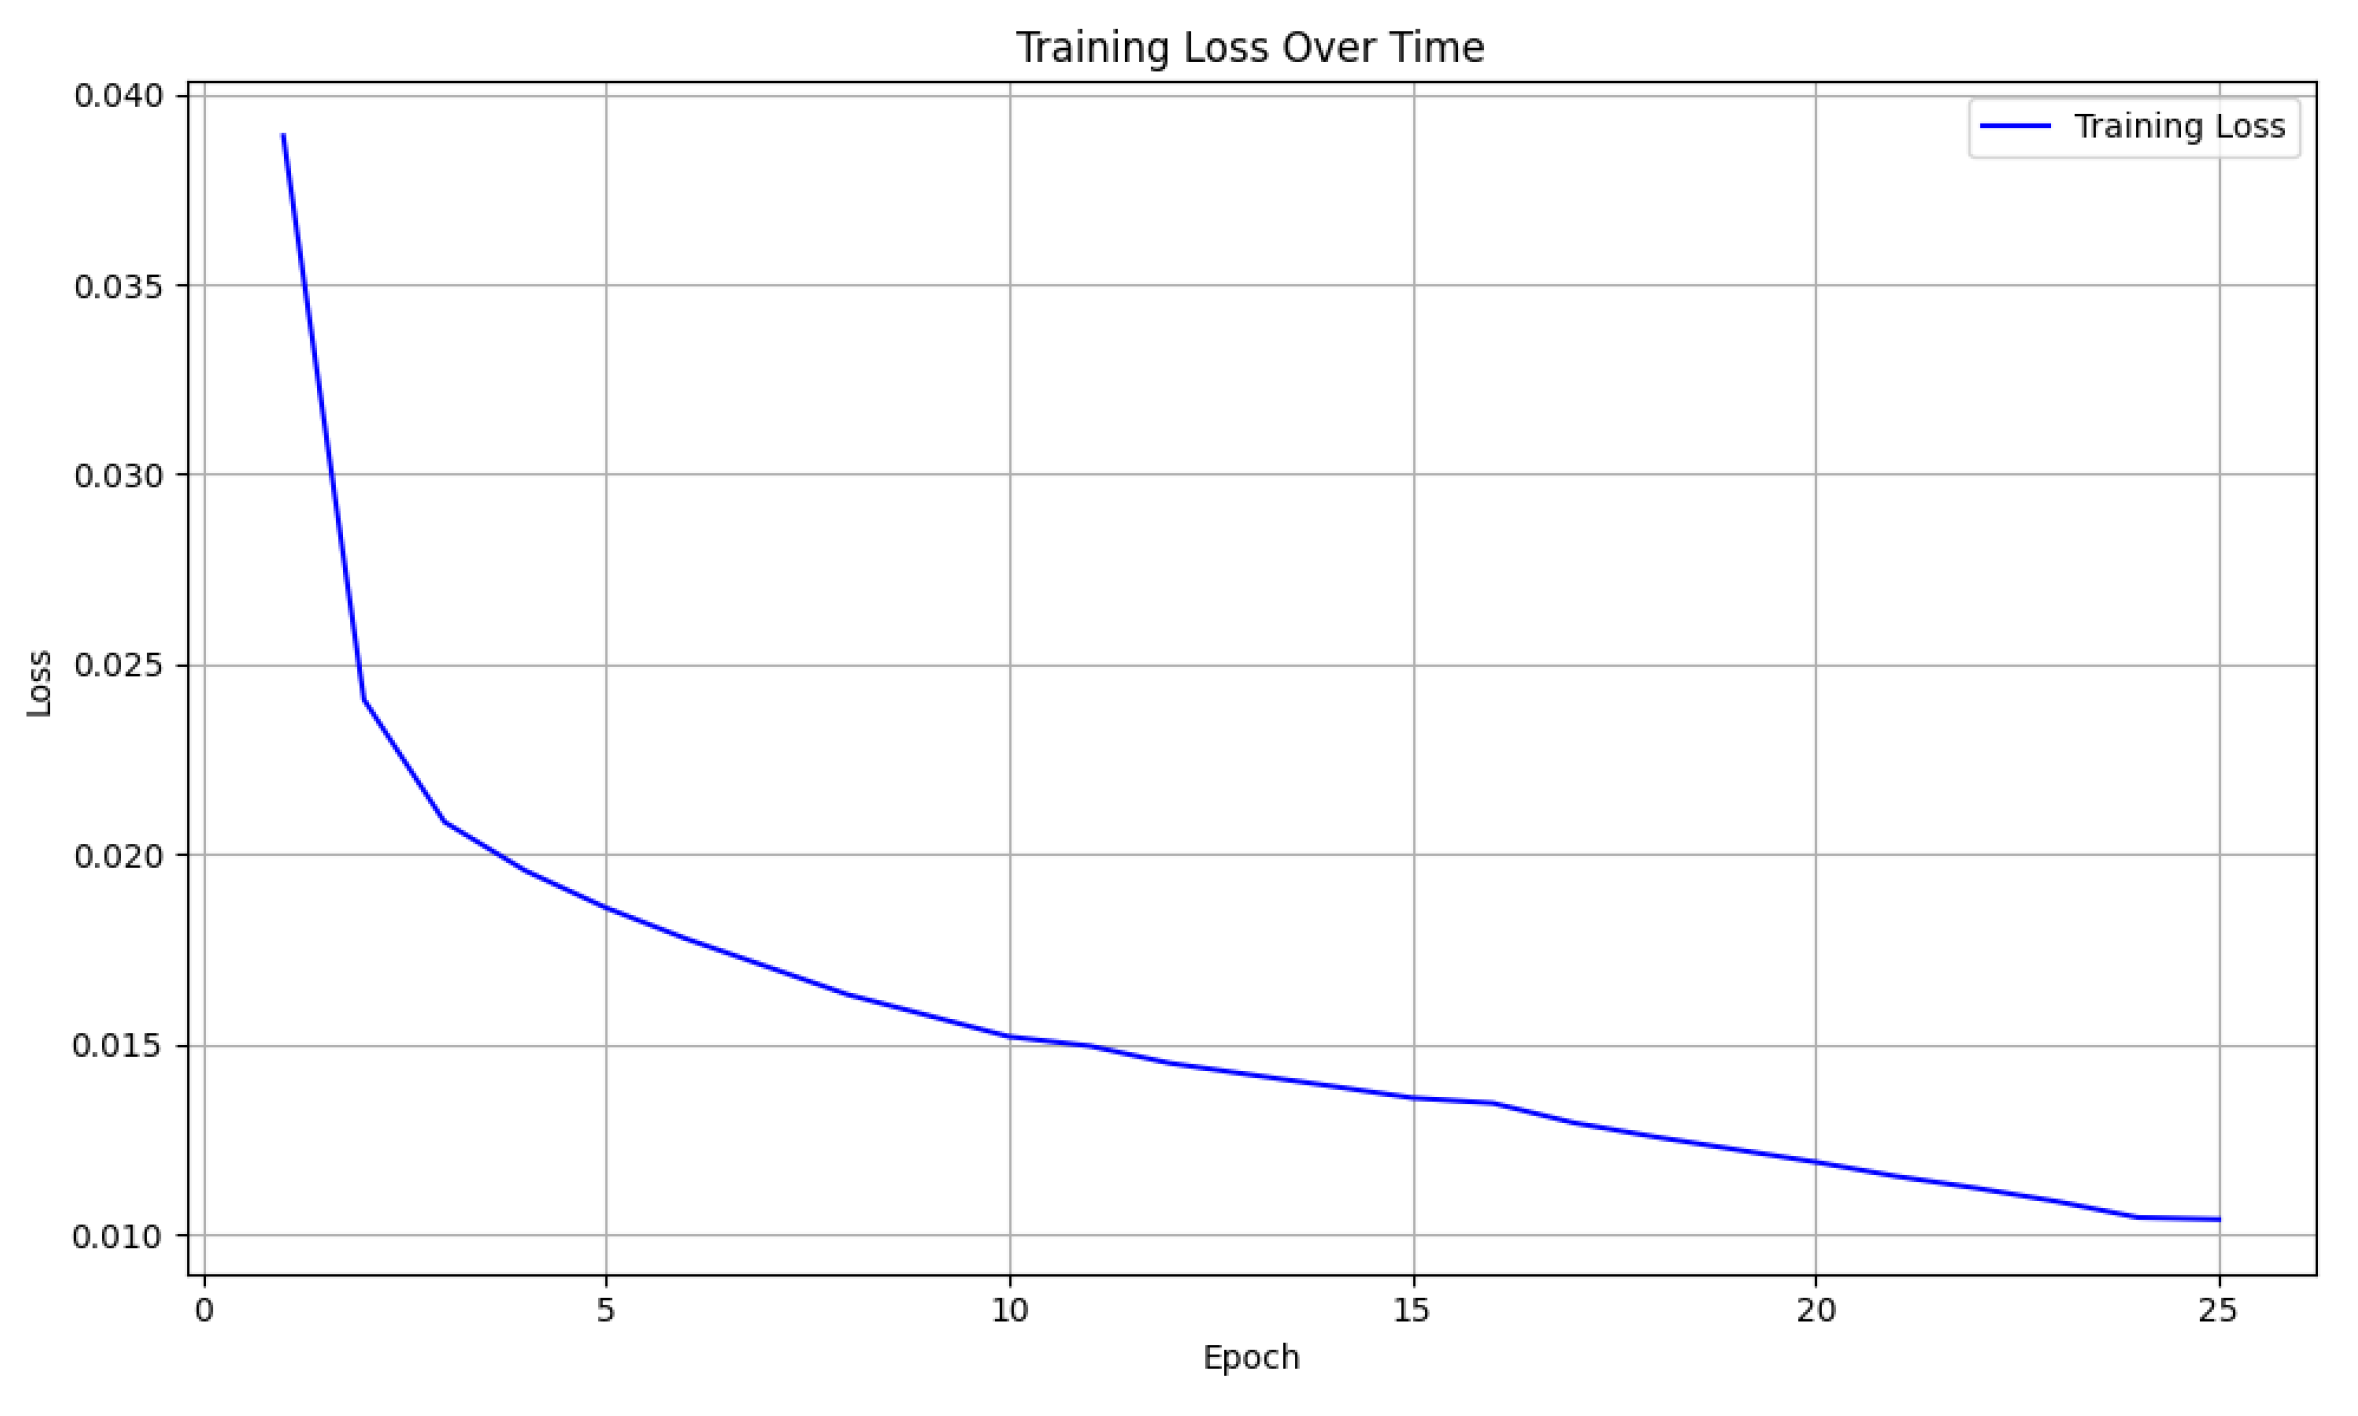
Looking the training–loss curve in
Figure 12, we see a rapid drop during the initial few epochs from just under 0.040 down to approximately 0.020, indicating the model is able to quickly learn fundamental patterns in the data. As training progresses beyond epoch five, the loss continues to decrease but at a more gradual pace, suggesting a smooth fine-tuning phase in which the network refines its internal representations. By epoch 25, the loss settles at around 0.009, a reflection that the model has effectively converged without obvious signs of plateauing too early or overfitting in the training phase. Overall, this trajectory aligns well with standard deep learning behavior, illustrating stable learning progress and reinforcing that the model is successfully capturing relevant signals in the KEMDy20 dataset.
Model Performance
The following results in
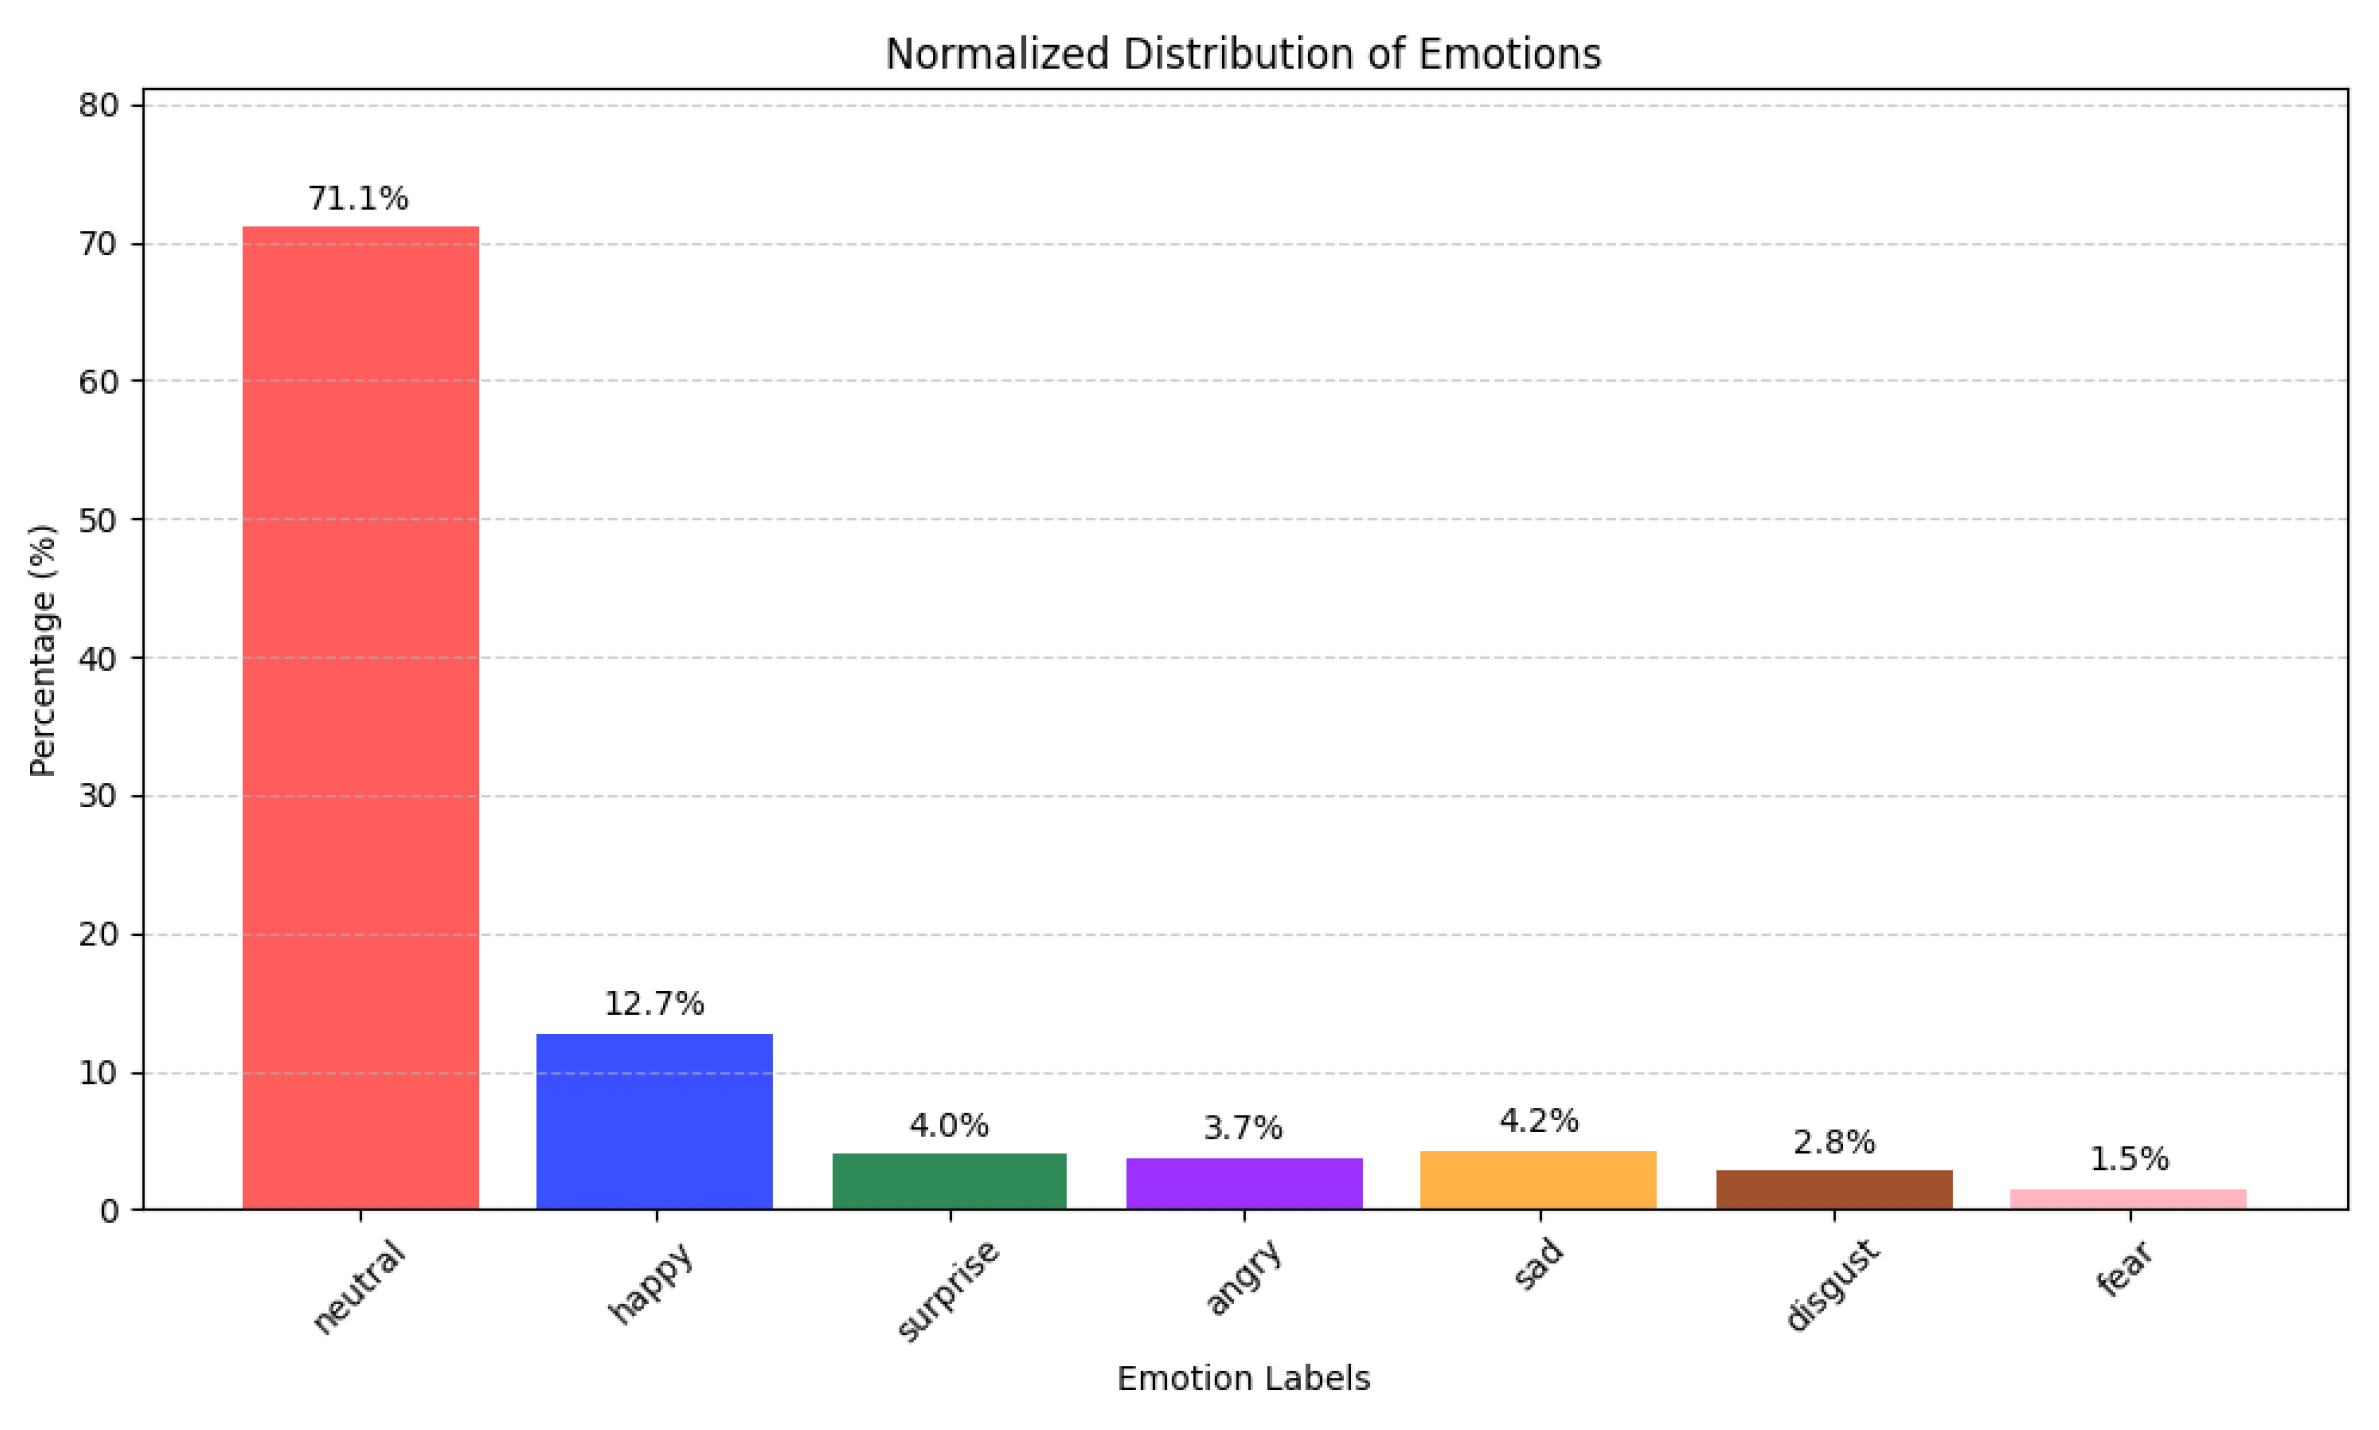
Table 11 highlight our model’s classification performance on the KEMDy20 dataset across seven emotional categories. By examining both the standard metrics and the confusion matrix, we can assess how effectively our approach distinguishes among fine-grained emotional states: neutrality, happiness, surprise, anger, sadness, disgust, and fear. Overall, the accuracy reaches
94.49%, with a recall of
94.49% and a precision of
90.14%, yielding an F1-score of
92.25% and a G-mean of
91.77%. These results suggest the model not only classifies most instances correctly but also balances minority classes reasonably well.
Furthermore, the 94.82% AUC value indicates the model’s strong discriminative power over various decision thresholds. In the confusion matrix presented in the
Figure 13, “Neutral” obtains a correct classification rate of 0.911, “Happy” 0.921, “Surprise” 0.913, “Angry” 0.939, “Sad” 0.922, “Disgust” 0.910, and “Fear” 0.945. These high scores underline the model’s robust performance across all categories.
Moving to misclassifications, “Disgust” is confused with “Neutral” 4.8% of the time, while “Happy” can be misclassified as “Sad” (3.6%) or “Angry” (2.9%). Similarly, “Fear” occasionally overlaps with “Neutral” (4.3%), though the model still correctly labels 94.5% of “Fear” instances. These small but not insignificant overlaps suggest that certain emotional states exhibit subtle common features. Overall, the strong diagonal entries confirm the model’s effectiveness in capturing distinguishing patterns for each emotion, while the relatively small off-diagonal values mark areas where further fine-tuning or context-aware features could help reduce confusion between closely related emotions.
Visualization of Learned Feature Representations
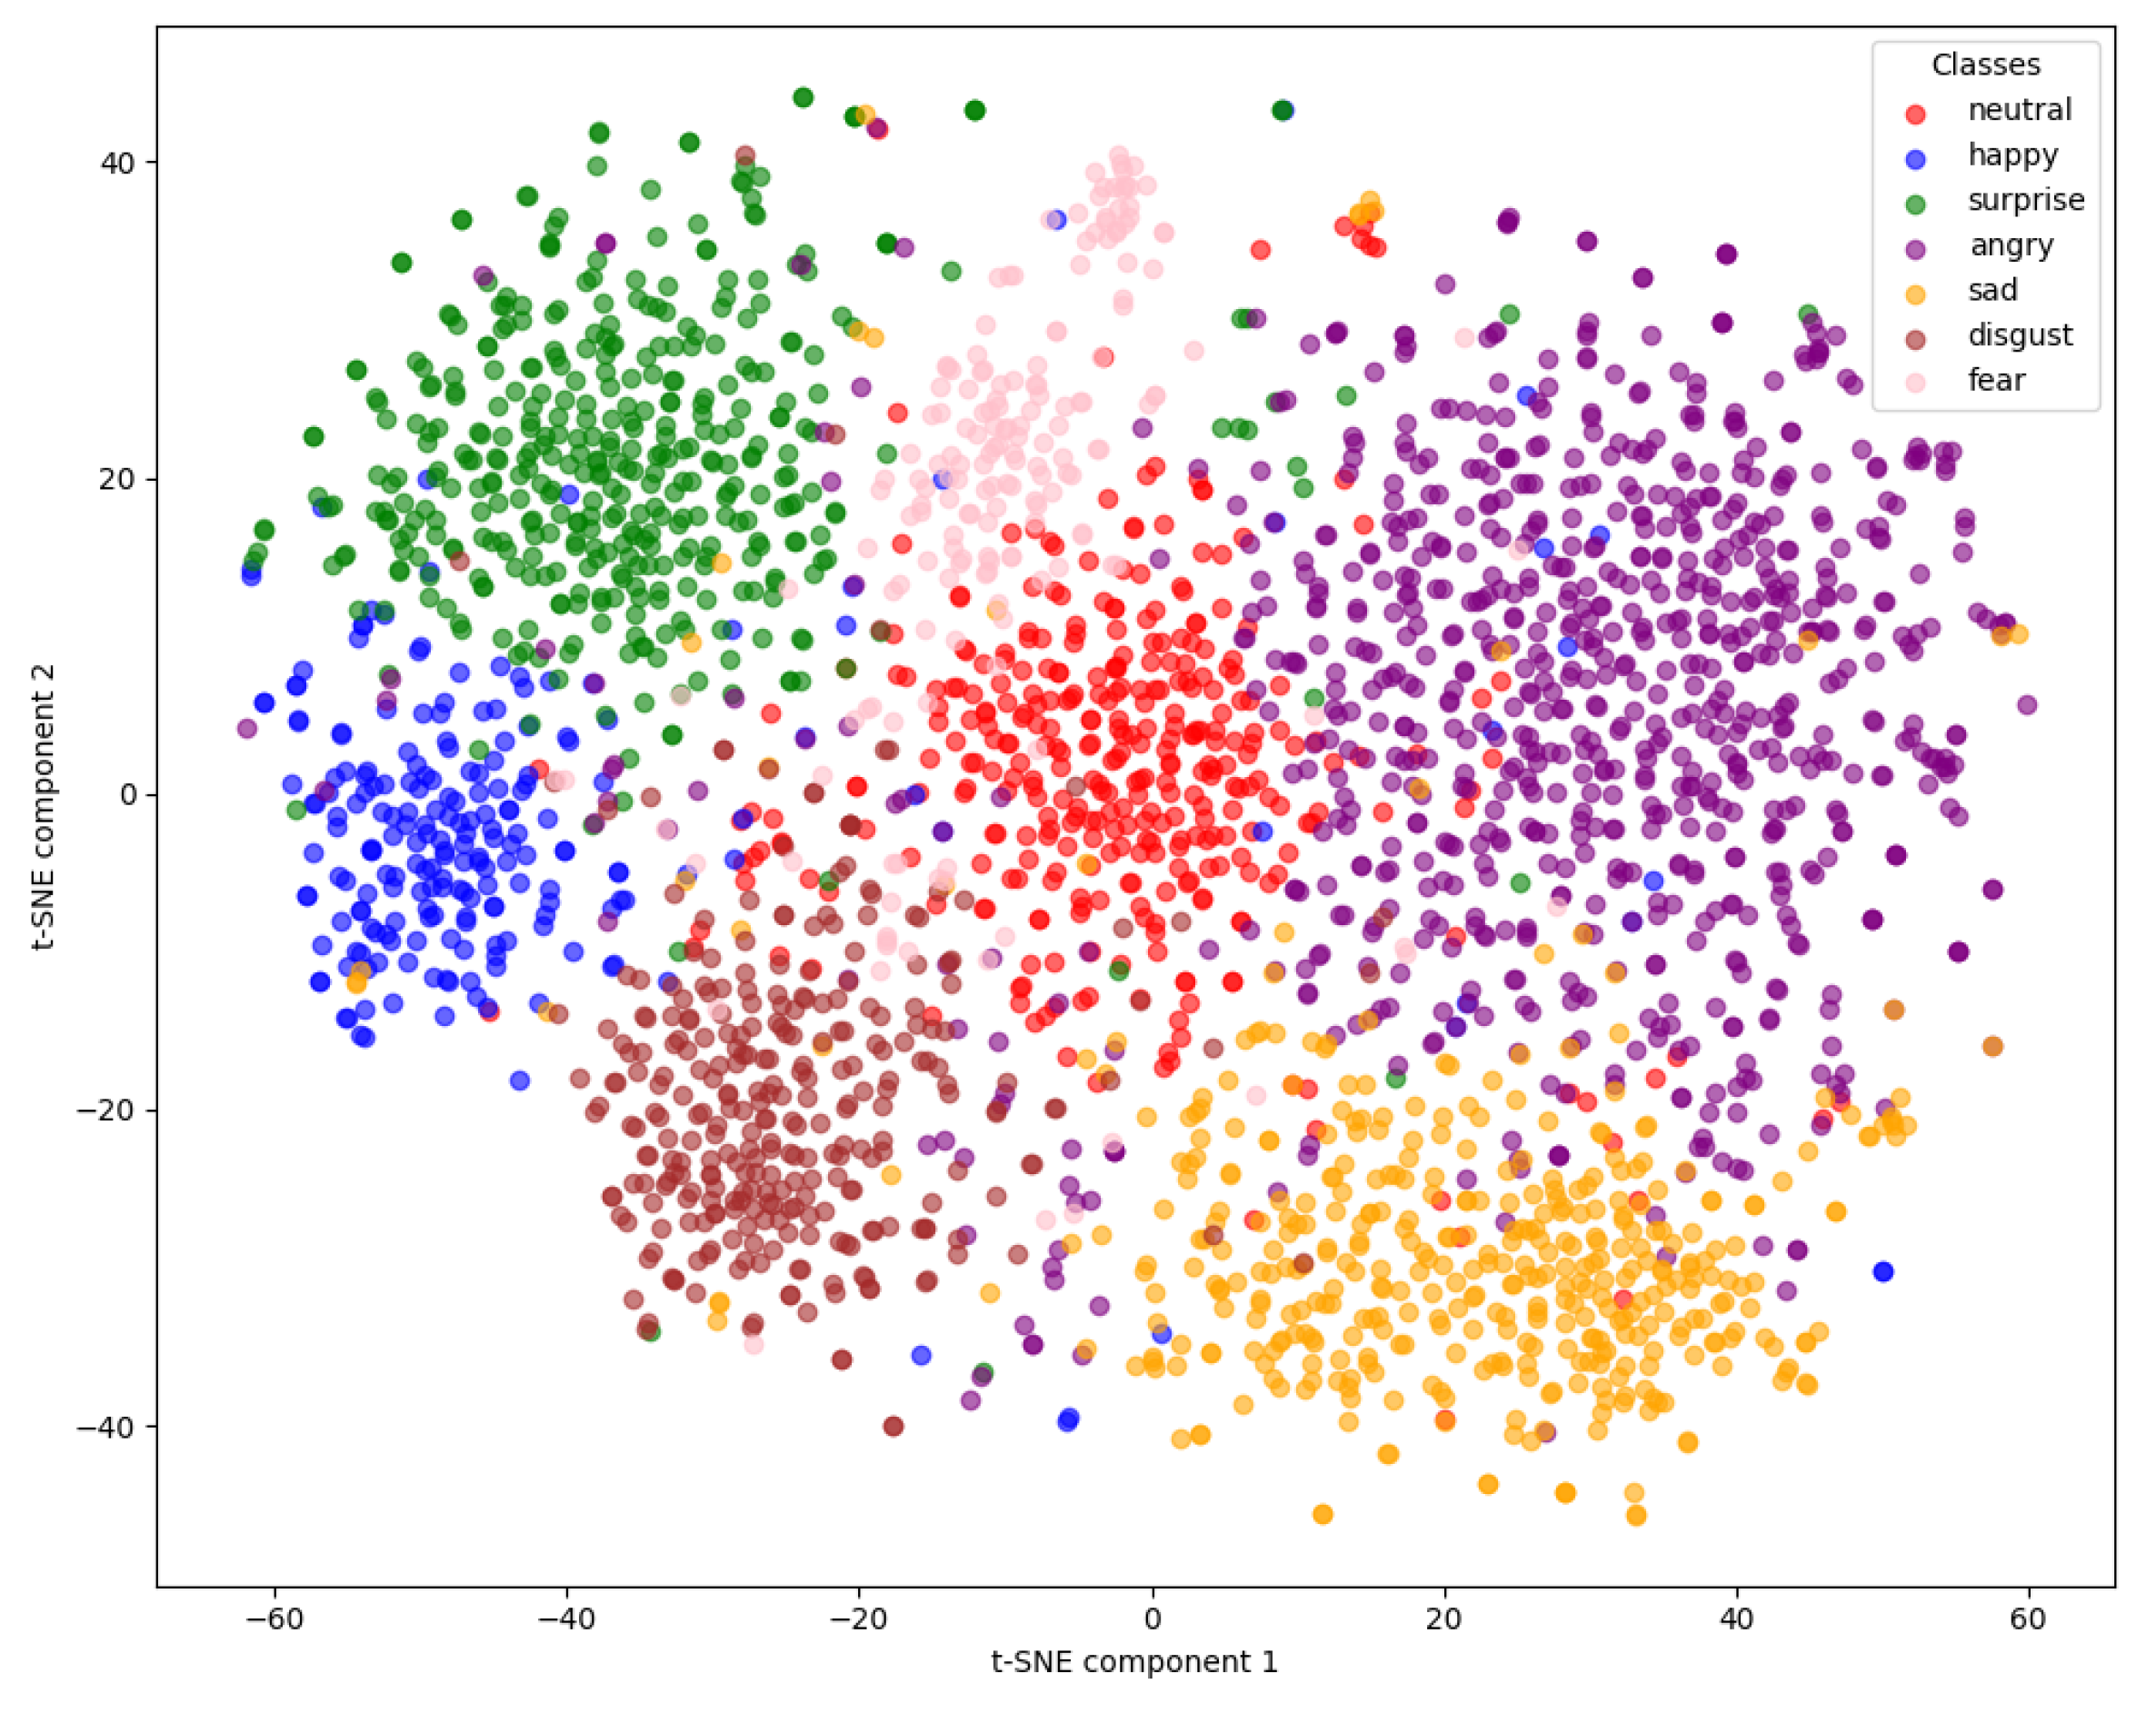
This experiment offers an intuitive way to inspect how well the model’s learned representations separate different emotional classes in a reduced two-dimensional space. By compressing high-dimensional feature vectors into just two components, we can visually ascertain whether similar emotion categories cluster together and whether distinct emotions form clearly separated regions.
In
Figure 14, we can observe coherent clusters for each emotion category. “Neutral” (red) is grouped centrally, surrounded by a relatively uniform boundary as it transitions into other states. “Happy” (blue) appears more isolated on the left, reflecting its distinctiveness from neighboring classes, while “Sad” (orange) and “Angry” (brown) form well-defined groups closer to one another. A subtle overlap between “Surprise” (green), “Disgust” (purple), and certain fringe points of “Fear” (pink) suggests that these expressions share some overlapping features or transition states. Overall, the tight grouping within each emotional class and minimal spread into other regions reveal that our model’s internal feature representations effectively capture the distinguishing characteristics of the seven emotion categories in the KEMDy20 dataset.
Impact Analysis of Different Expert Combinations
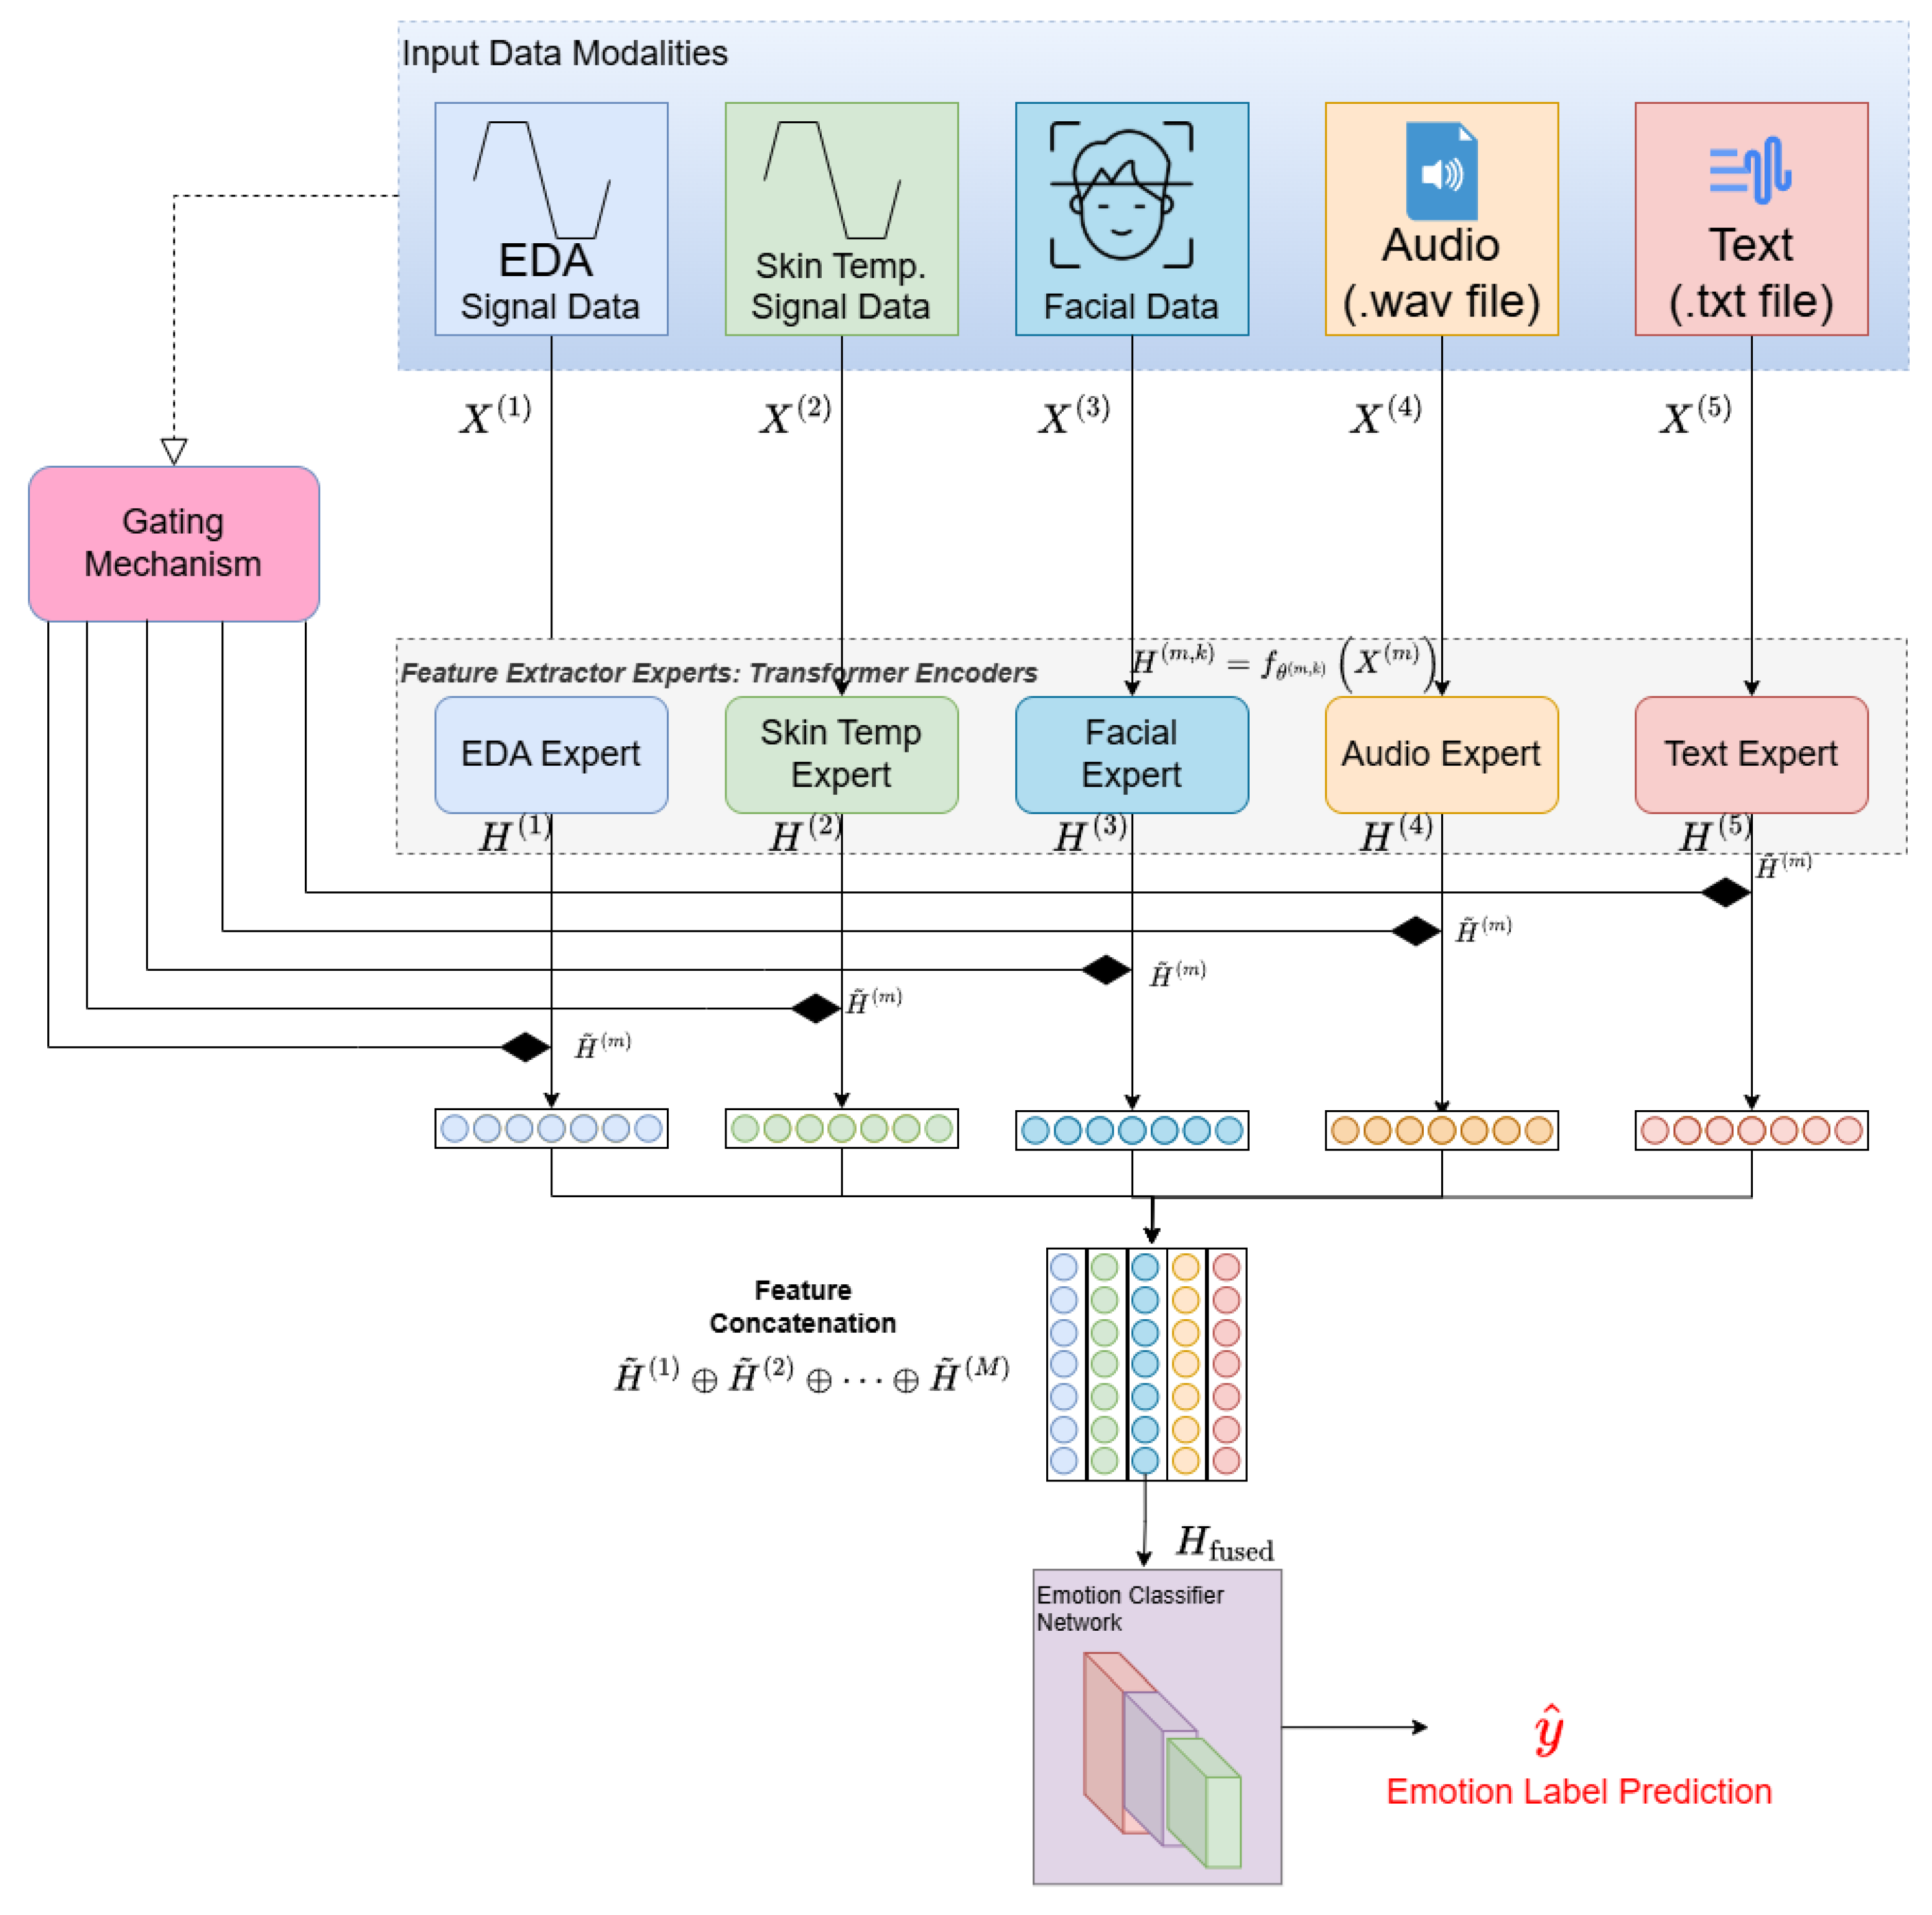
In the following, we analyze the model’s performance results when using different combinations of text, audio, and Physiological Signal (PS) experts to clarify which expert, or combination of experts, contributes most toward robust predictions. By comparing single-modality experts (text, audio, PS) with two-modality fusions (text + audio, text + PS, audio + PS), we gain insight into whether certain modalities complement each other or largely overlap in the features they capture.
As presented in
Table 12, we see that text alone achieves 87.75% accuracy and an F1-score of 85.44%. Audio (87.63% accuracy, 85.25% F1) and PS (87.30% accuracy, 81.38% F1) perform at roughly similar levels, although it should be noted that PS lags slightly in terms of precision (76.21%). When combining two modalities, all configurations exceed 88% accuracy, with audio + PS yielding the highest accuracy (88.45%) and a notably superior AUC (89.99%). Meanwhile, text + audio attains 88.41% accuracy, and text + PS delivers 88.01% accuracy along with balanced scores across other metrics. These findings suggest that while individual modalities capture core emotional cues, combining them often enhances performance, particularly when leveraging audio and physiological signals together.
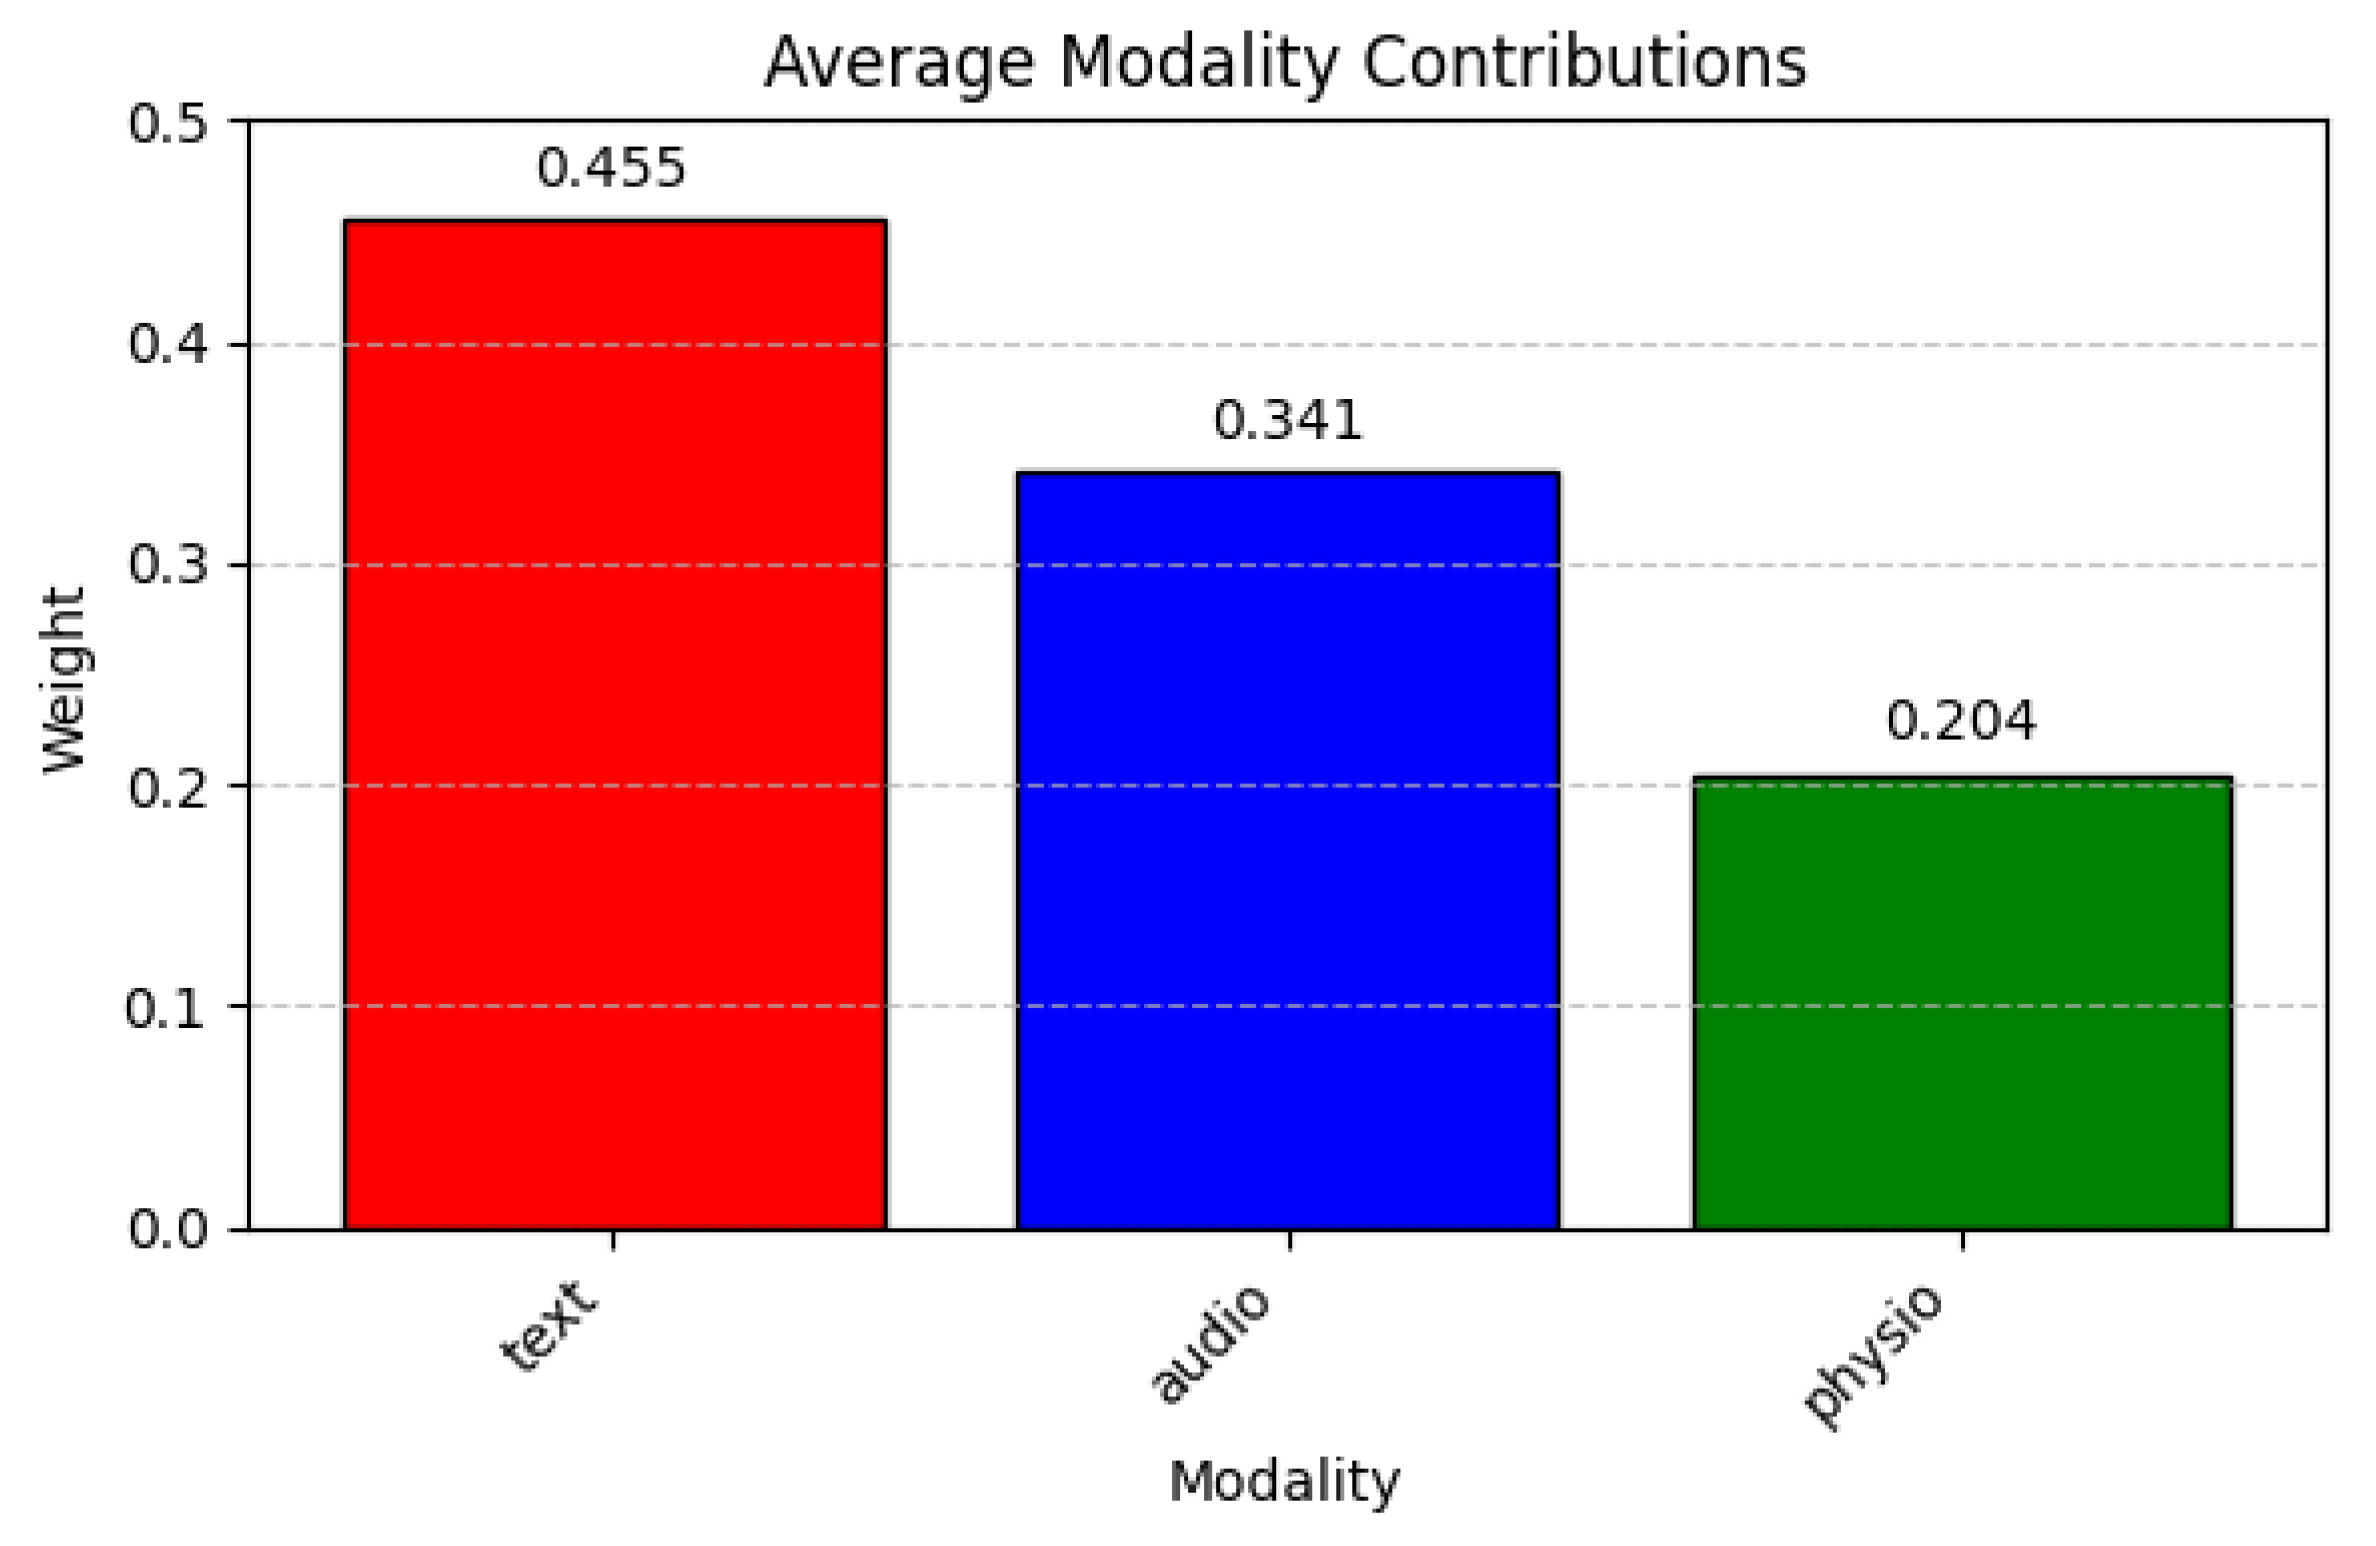
We were also interested in evaluating the importance weighting of each modality because it reveals how the final classification is influenced by each expert contribution to the overall system.
Figure 15 shows that text provides the largest contribution (0.455), followed by audio (0.341), then physiological signals (0.204).
This distribution indicates that textual cues are particularly influential for the model, with vocal features also supplying meaningful information, while physiological data act as a more modest but still valuable source of confirmation.
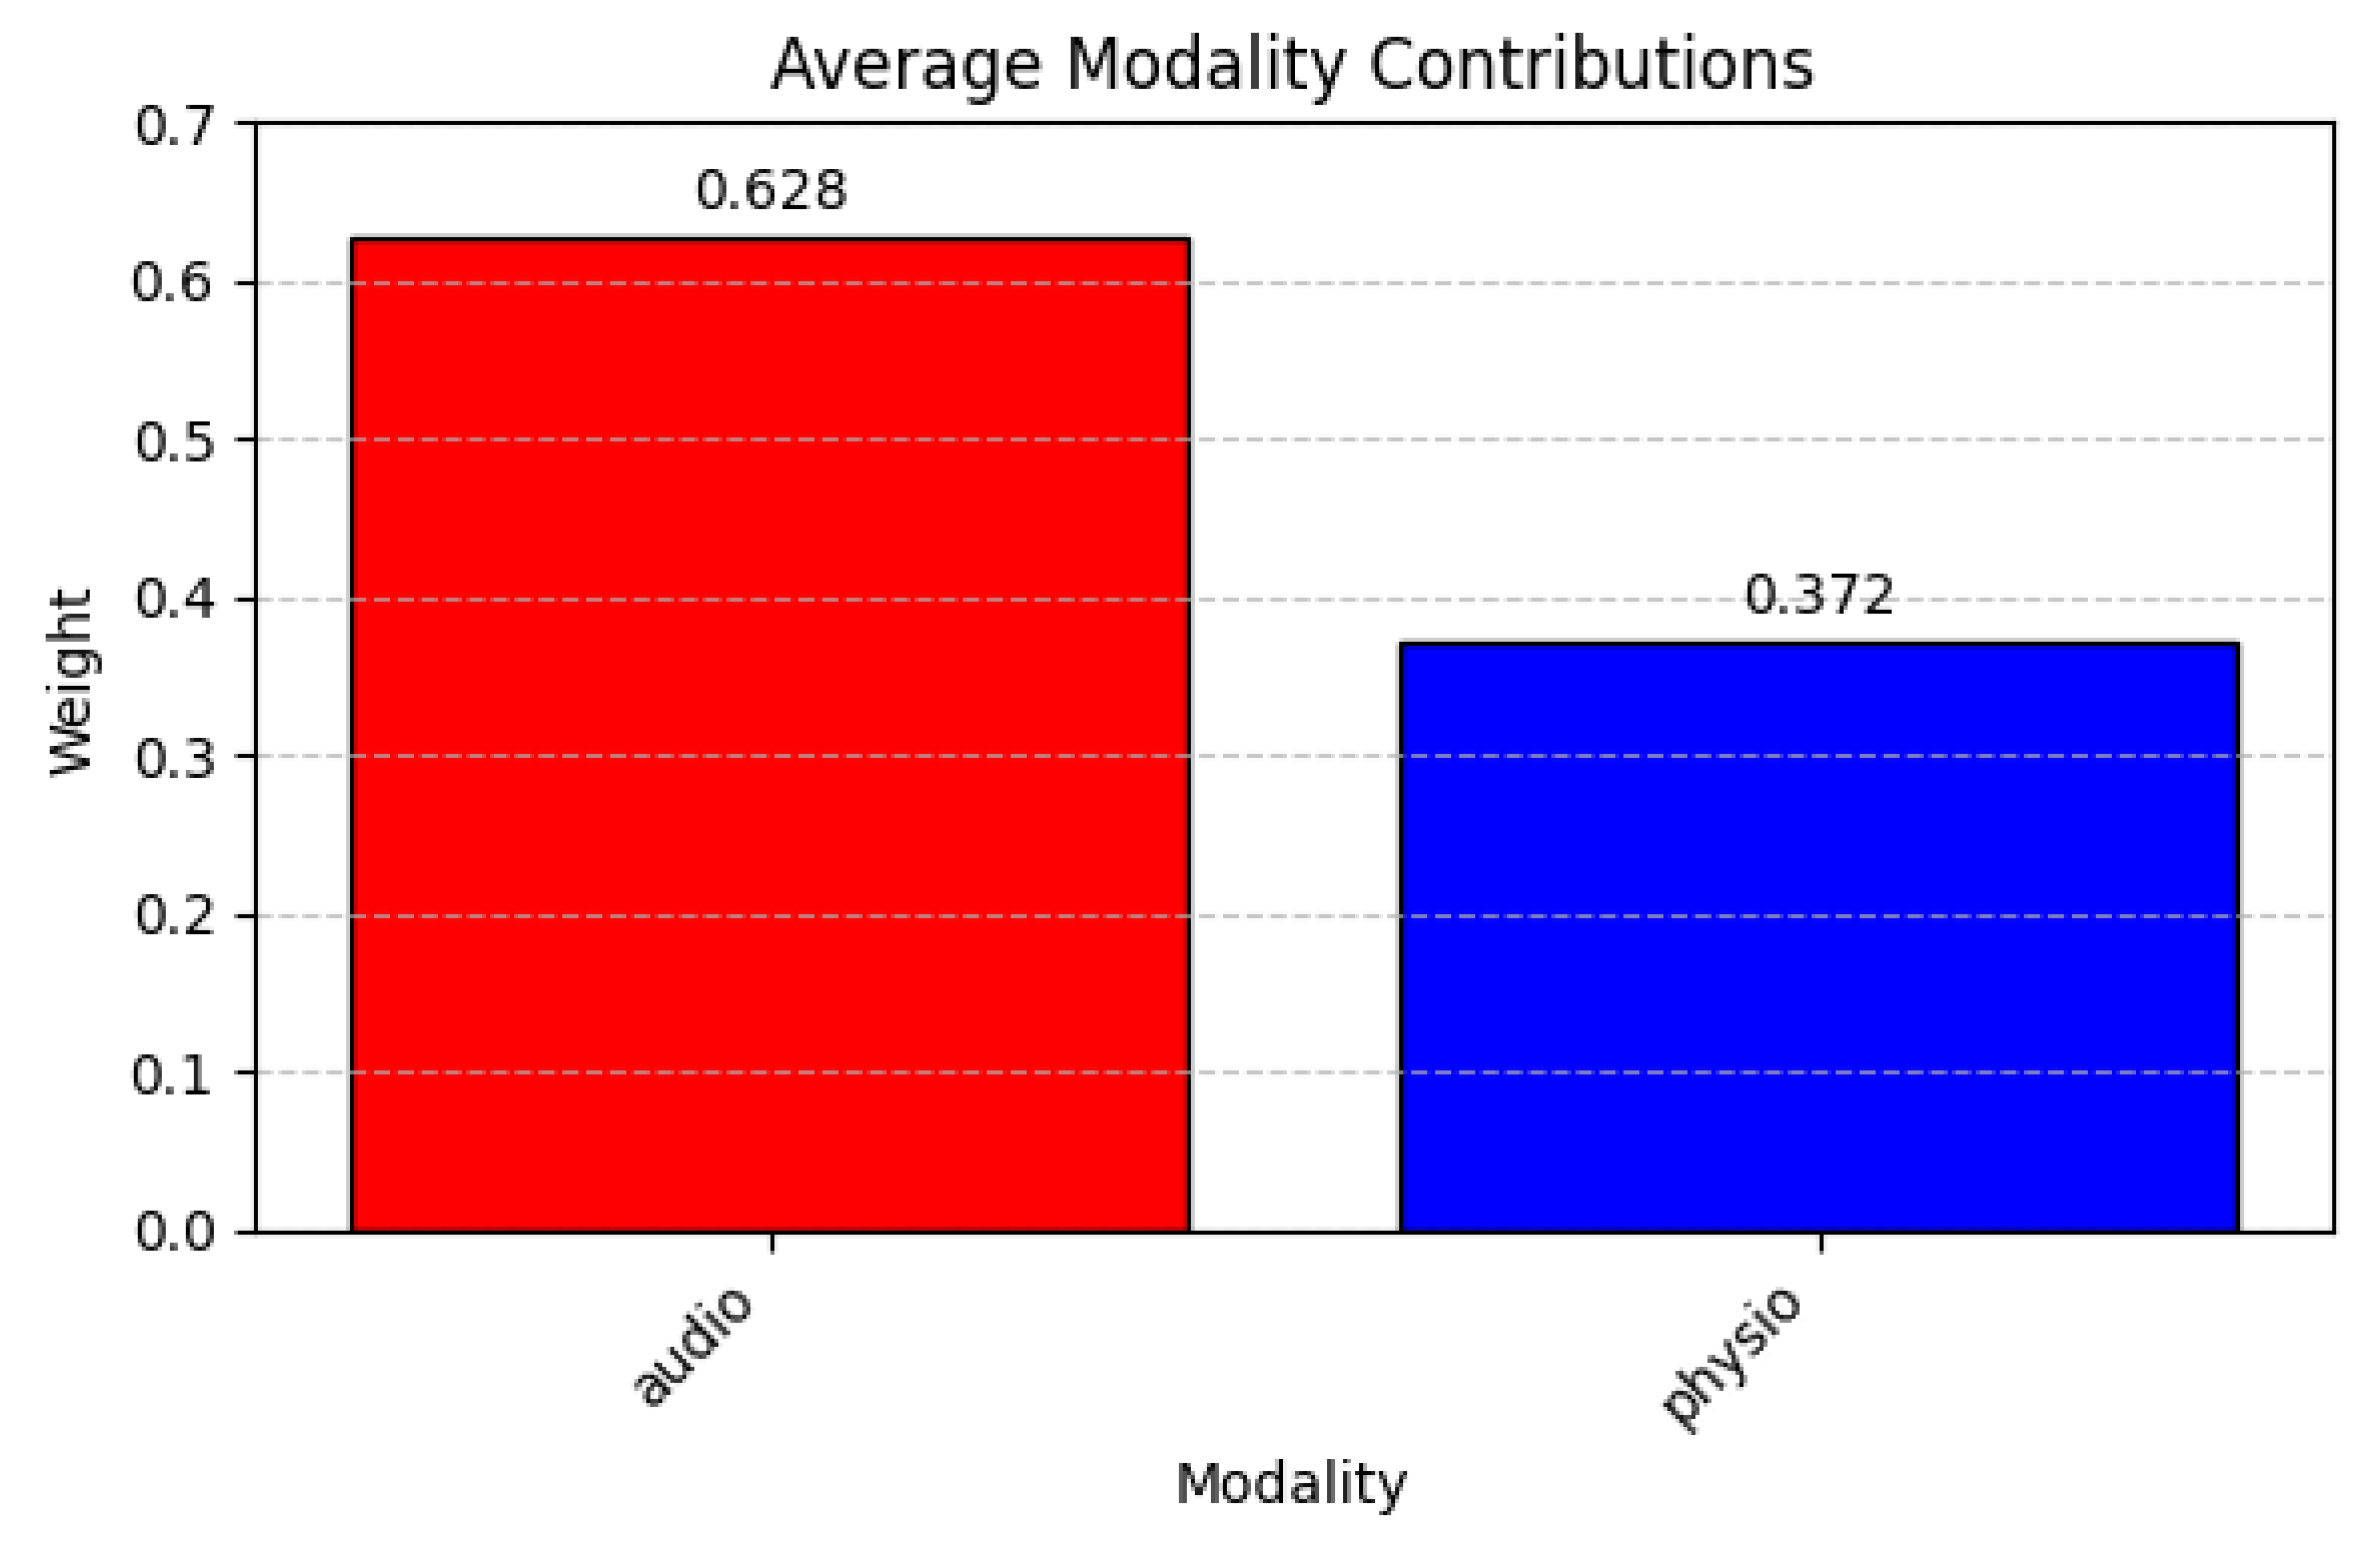
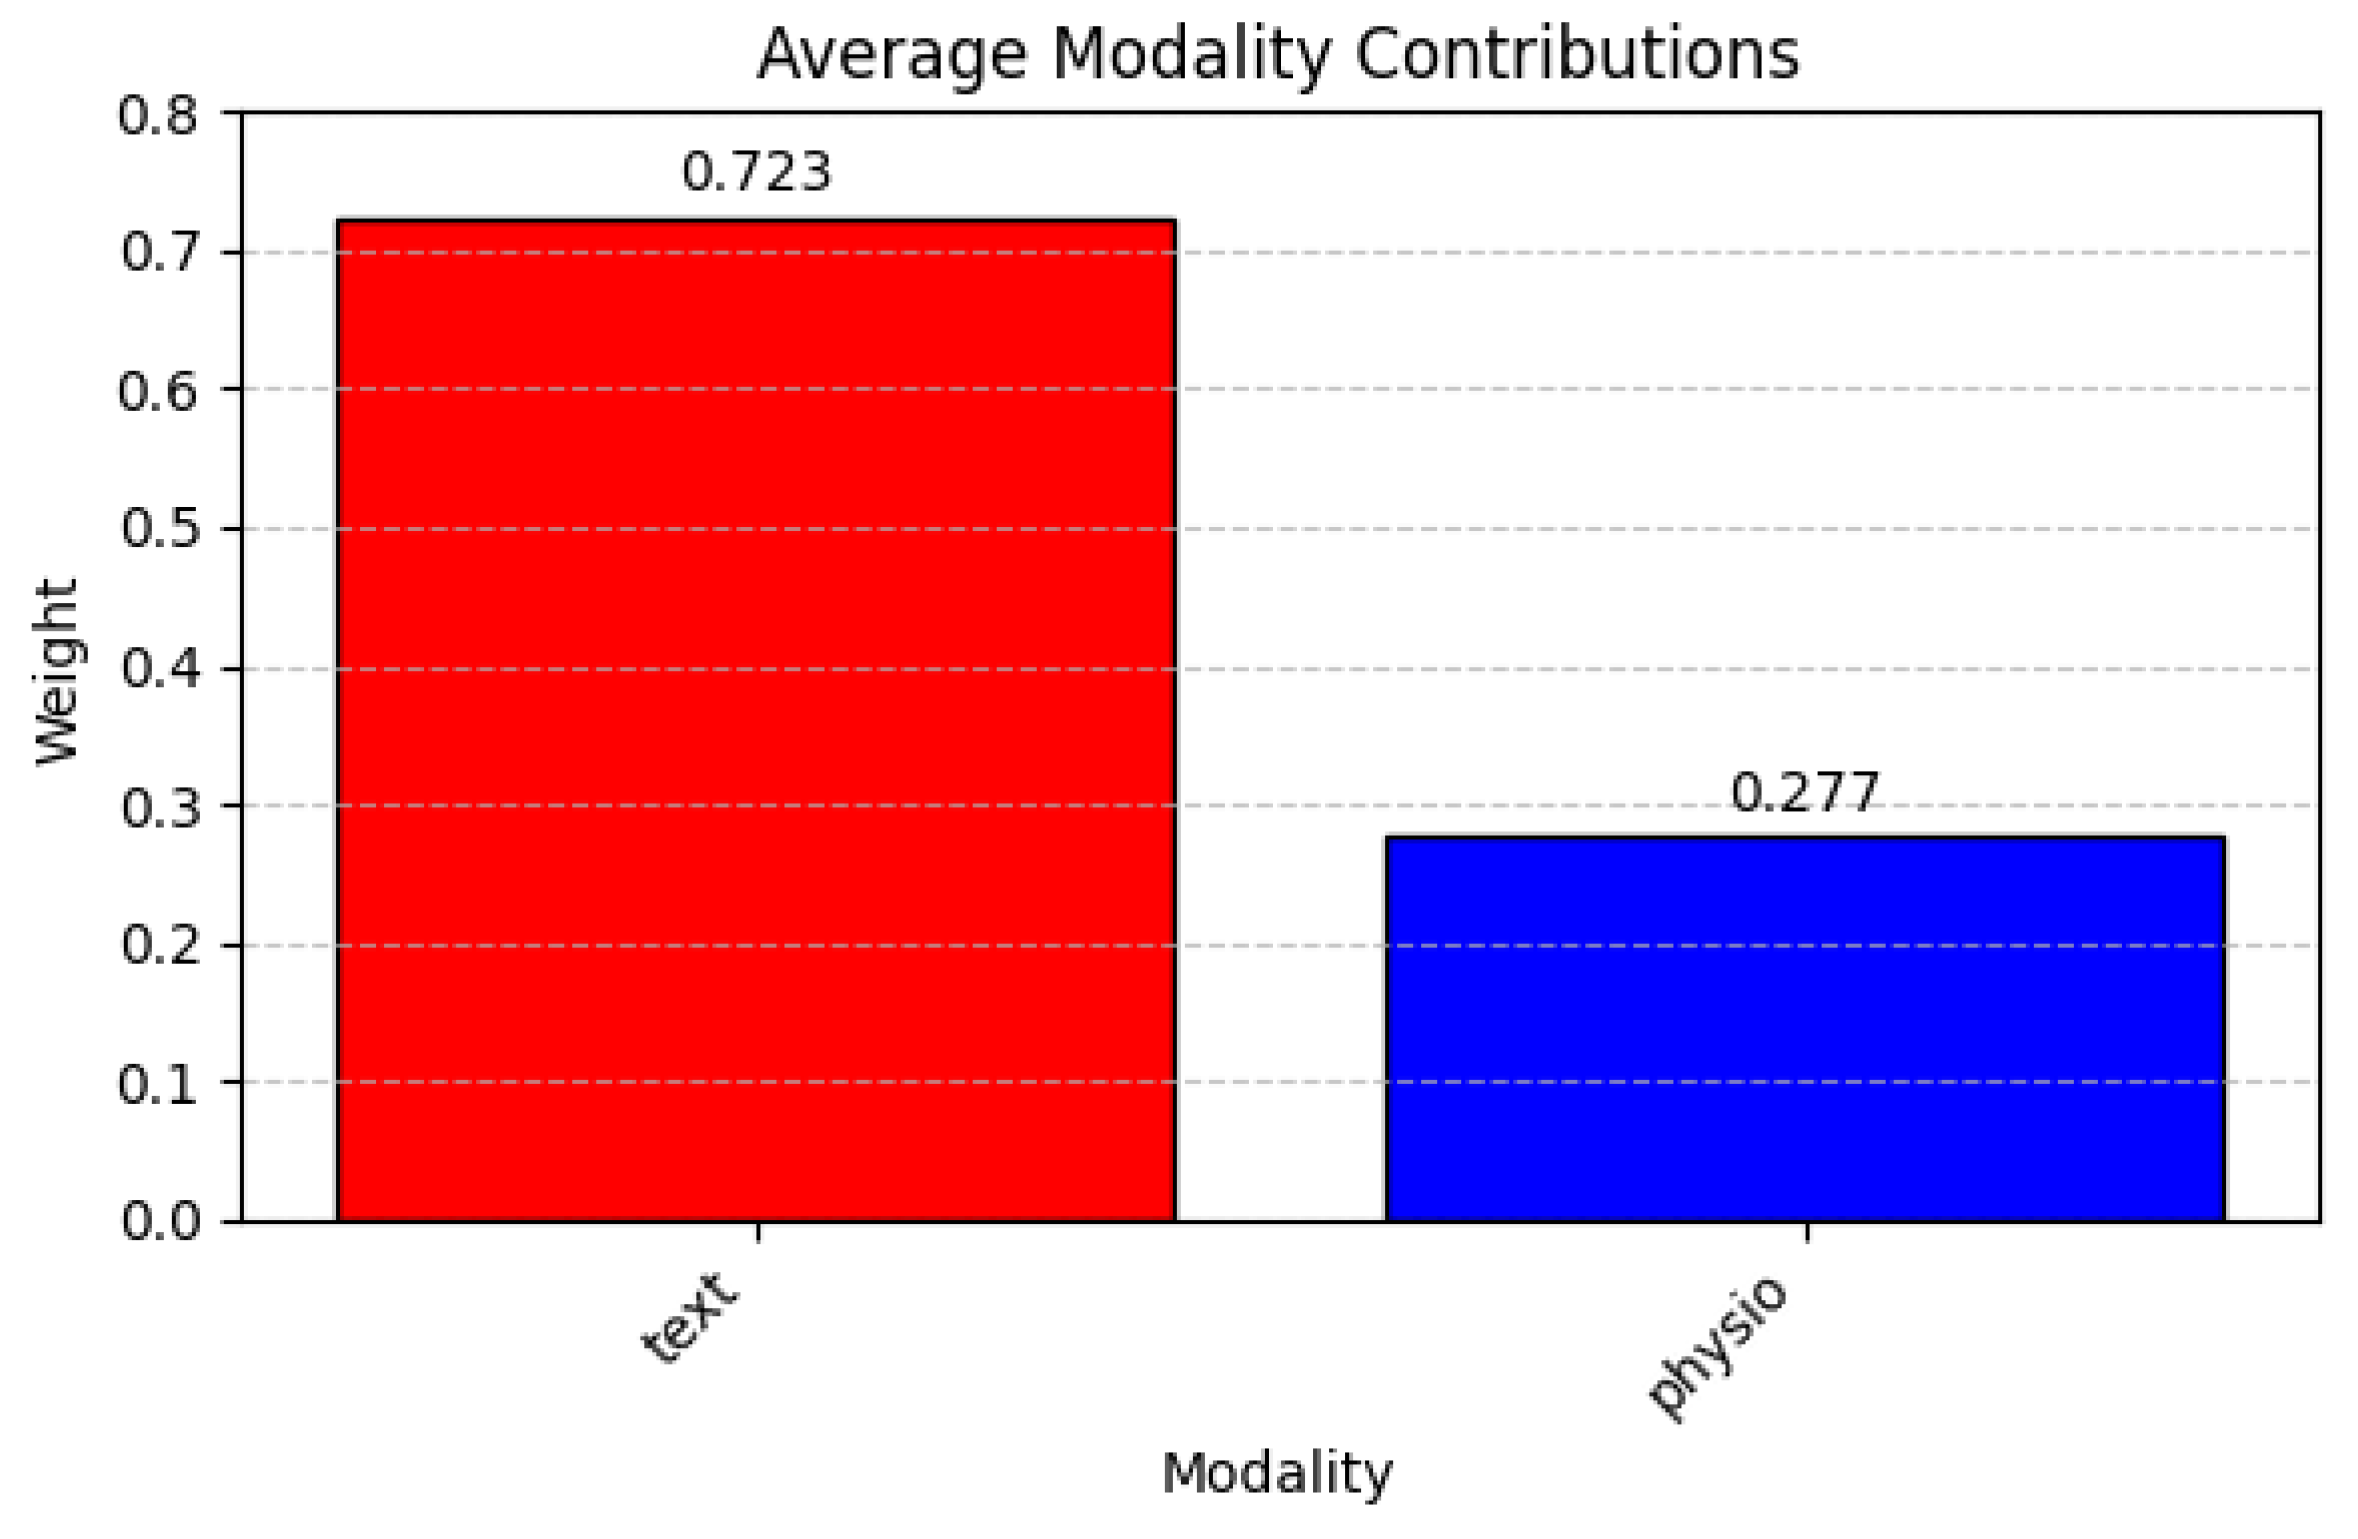
Turning to the pairwise setups,
Figure 16 similarly underscores text’s dominance (0.577) compared with audio (0.423).
Figure 17 shows audio commanding a weight of 0.628, considerably overshadowing physiological signals at 0.372. Finally,
Figure 18 (text + physio) magnifies text’s influence (0.723) even further against physiological signals (0.277). In all these settings, text or audio consistently emerges as the more decisive expert, whereas physiological signals provide secondary support, suggesting that linguistic and acoustic features capture the brunt of emotional or affective cues in this dataset.
Comparative Study with State-of-the-Art Approaches
We present a thorough comparison of the proposed method against several previously reported approaches on the ETRI dataset. As shown in
Table 13, transfer learning [
63] achieves an accuracy of 84.8% (no F1-score is provided), while KoELECTRA [
59] and multi-modal cross attention [
64] both surpass 92% accuracy, accompanied by F1-scores of around 89%. Furthermore, we have expanded our comparison to include additional recent approaches, bidirectional cross-modal attention [
65], KoHMT [
66], and HyFusER [
65], which achieve accuracies of 77.63%, 77.45%, and 79.77% with corresponding F1-scores of 77.70%, 77.44%, and 79.75%, respectively. Despite the strong performances of several baselines, our approach outperforms all existing methods with an accuracy of 94.49% and an F1-score of 92.25%, thereby providing quantitative evidence of its superiority over both conventional static fusion methods and other recent multimodal approaches.
These results underscore the technical novelty of our method. Unlike conventional static fusion methods, our model integrates multiple modules including dynamic gating with sparse activation and cross-modal attention whose synergistic interplay provides substantial quantitative advantages in terms of accuracy, robustness, and overall discriminative power. The quantitative superiority of our approach clearly demonstrates that the proposed architecture not only captures the nuances within individual modalities but also effectively fuses complementary information across modalities.
4.3.3. Robustness Testing with Incomplete/Inaccurate Data
To further evaluate the resilience of our model under real-world conditions where data may be incomplete or inaccurate, we conducted additional experiments on both the ASCERTAIN and KEMDy20 datasets. In these experiments, we simulate two types of perturbations:
Incomplete Data: We randomly remove 20% of the samples from the dataset.
Inaccurate Data: We inject Gaussian noise into the feature values, with a noise level corresponding to 10% of the typical feature magnitude.
These perturbations mimic common issues such as sensor dropout or measurement errors.
Robustness on the ASCERTAIN Dataset
Table 14 reports the performance metrics for arousal and valence prediction under these perturbed conditions. In comparison to the baseline results on clean data (accuracy: 99.71%, precision: 100%/99.92%, recall: 99.65%/99.60%, F1-score: 99.83%/99.76%, G-mean: 99.38%/99.73%, AUC-ROC: 99.99%/100%), we observe a slight degradation. Specifically, the accuracy drops to approximately 97.58% for arousal and 97.41% for valence. Similarly, other metrics (precision, recall, F1-score, G-mean, and AUC-ROC) decrease by about 1.5–2.5% on average. These results suggest that, even in the presence of data incompleteness and noise, our model maintains a high level of performance, demonstrating its robustness.
The model’s performance on the ASCERTAIN dataset experiences a modest reduction in all metrics (approximately 1.5–2.5%), yet remains high (accuracy above 97% and AUC above 98%). This slight decline indicates that our model is highly resilient to both sample removal and noise injection, preserving its ability to accurately differentiate between low and high-arousal/valence states.
Robustness on the KEMDy20 Dataset
Table 15 shows the performance metrics for the KEMDy20 dataset after similar perturbations. The baseline performance on the clean dataset was an accuracy of 94.49%, precision of 90.14%, recall of 94.49%, F1-score of 92.25%, G-mean of 91.77%, and AUC of 94.82%. Under the perturbed conditions, accuracy decreases to 90.37%, and precision, recall, F1-score, and G-mean decline by roughly 3.5–4.5%, with the AUC slightly lower at 90.75%. While the degradation is more pronounced in the KEMDy20 dataset than in the ASCERTAIN dataset, the results still indicate that our model retains strong discriminative power and generalization capability, even with incomplete or noisy data.
In contrast, the performance on the KEMDy20 dataset shows a more noticeable reduction (around 3.5–4.5% drop in key metrics), with the overall accuracy falling to 90.37% and the AUC to 90.75%. Although the performance degrades more in this scenario, the model still exhibits robust classification capabilities across the seven emotional categories. The higher sensitivity of the KEMDy20 dataset to data perturbations may be attributed to its fine-grained emotional labels and inherent class imbalances.
Overall, these experiments validate the robustness and generalizability of our transformer-based approach. Even under conditions of incomplete or inaccurate data, our model maintains strong discriminative power and balanced performance across tasks, which is critical for real-world applications where data imperfections are common.
4.3.4. Ablation Study: Evaluating the Contributions of Key Modules
To thoroughly evaluate how each part of our model contributes to its overall performance, we conducted a detailed ablation study. We systematically removed three important components, one at a time: (1) the Mixture of Experts (MoE) processing block with its dynamic gating mechanism, (2) the cross-modal attention mechanism, and (3) the diversity loss term. For each configuration, we measured performance using accuracy, precision, recall, F1-score, G-mean, and AUC.
Table 16 and
Table 17 summarize the quantitative results.
Results on the ASCERTAIN Dataset
For the ASCERTAIN dataset, we focused on arousal prediction as the representative task since we observed similar patterns for both valence and arousal. The complete model performed exceptionally well, achieving an F1-score of 99.83% and an AUC of 99.99%. These near-perfect scores demonstrate the model’s strong ability to distinguish between different classes and its excellent generalization capability.
When we removed the diversity loss component, we observed a significant drop in performance, with the F1-score decreasing by 6.05% and the AUC dropping by 1.02%. This decline highlights how important it is to encourage different experts in the model to learn distinct patterns. The diversity loss prevents redundancy by pushing each expert to specialize in different aspects of the input features. The removal of the cross-modal attention mechanism caused even greater performance drops across all metrics. This component allows the model to identify important relationships between different modalities (such as visual, audio, and text inputs). Without it, the model struggles to determine which parts of one modality are relevant to parts of another modality. This suggests that capturing relationships between modalities is crucial for understanding emotional states. The most dramatic performance decrease occurred when we removed both the MoE block and its dynamic gating mechanism. This configuration resulted in a 7.73% drop in accuracy and a 9.12% reduction in AUC. These substantial decreases confirm that having specialized experts for different aspects of the input, along with a mechanism to selectively activate the most relevant experts for each input, is fundamental to the model’s effectiveness. The dynamic gating allows the model to focus on the most informative modalities while reducing the influence of noisy or irrelevant inputs.
Results on the KEMDy20 Dataset
Our experiments on the KEMDy20 dataset showed similar patterns to those observed with ASCERTAIN. The complete model consistently outperformed all modified versions, achieving the highest AUC (94.82%) and F1-score (92.25%). Removing the diversity loss caused a moderate decrease in performance (F1-score dropped by 3.67%), once again demonstrating its role in helping experts specialize and improve generalization. This decrease was less dramatic than in the ASCERTAIN dataset, suggesting that expert specialization may be more critical for certain types of emotional recognition tasks or data structures. The absence of cross-modal attention resulted in a more significant performance drop, with the F1-score decreasing by 5.21% and AUC by 7.24%. This component seems particularly important for integrating the different types of information in the KEMDy20 dataset, which includes speech patterns and text semantics. The temporal dynamics in speech and the meaning in text need to be properly aligned and integrated for accurate emotion recognition. As with the ASCERTAIN dataset, removing the MoE block and dynamic gating caused the largest performance drop, with a reduction of 7.11% in F1-score and 9.83% in AUC. This consistent finding across both datasets strongly validates our architectural design choice of using adaptive expert selection to process multimodal inputs.
In summary, across both datasets, each architectural component contributes uniquely and synergistically to the final performance. The Mixture of Experts (MoE) module with dynamic gating serves as the core mechanism for adaptive modality selection, the cross-modal attention aligns complementary signals across modalities, and the diversity loss regularizes expert behavior to maximize specialization. Their combined effect results in substantial improvements in classification robustness, discrimination, and generalization across different emotional states and datasets.


