Abstract
Alzheimer’s disease (AD) is a progressive neurodegenerative disorder that impairs cognitive function, making early detection crucial for timely intervention. This study proposes a novel AD detection framework integrating gaze and head movement analysis via a dual-pathway convolutional neural network (CNN). Unlike conventional methods relying on linguistic, speech, or neuroimaging data, our approach leverages non-invasive video-based tracking, offering a more accessible and cost-effective solution to early AD detection. To enhance feature representation, we introduce GazeMap, a novel transformation converting 1D gaze and head pose time-series data into 2D spatial representations, effectively capturing both short- and long-term temporal interactions while mitigating missing or noisy data. The dual-pathway CNN processes gaze and head movement features separately before fusing them to improve diagnostic accuracy. We validated our framework using a clinical dataset (112 participants) from Konkuk University Hospital and an out-of-distribution dataset from senior centers and nursing homes. Our method achieved 91.09% accuracy on in-distribution data collected under controlled clinical settings, and 83.33% on out-of-distribution data from real-world scenarios, outperforming several time-series baseline models. Model performance was validated through cross-validation on in-distribution data and tested on an independent out-of-distribution dataset. Additionally, our gaze-saliency maps provide interpretable visualizations, revealing distinct AD-related gaze patterns.
Keywords:
Alzheimer’s disease detection; GazeMap; gaze tracking; head movement; representation learning MSC:
93A16; 93B52; 93C10; 93C85
1. Introduction
The human gaze is a critical biomarker that offers insights into an individual’s intentions and emotional states. Recently, gaze tracking has been widely applied in human–computer interaction [,] and healthcare [,,]. Notably, gaze patterns have emerged as promising non-invasive indicators for diagnosing neurodegenerative conditions, including depression [], stress [], and Alzheimer’s disease (AD) [].
Beyond clinical applications, video-oculography has long been integral to neurophysiological research, offering detailed insights into brain function across various neurodegenerative diseases []. Particularly in AD, eye movement abnormalities reflect underlying cortical and subcortical neuropathology. Quantitative oculomotor assessments have revealed impairments such as increased saccade latency and reduced accuracy, both of which are indicative of cognitive decline [,,,,]. Smooth pursuit tasks further differentiate AD patients from healthy controls through diminished tracking precision, reflecting disruptions in visuospatial processing and attention mechanisms []. Recent developments employing advanced gaze tracking technologies have demonstrated high diagnostic accuracy, underscoring the potential of oculomotor metrics as reliable biomarkers for early detection and progression monitoring of AD [].
Recent advances in computer vision have enabled the non-invasive fine-grained quantification of subtle behavioral cues using standard video recordings. These methods leveraging deep learning effectively analyze visual saliency, eye movements, and induced nystagmus from smartphone videos, demonstrating diagnostic capabilities comparable to specialized equipment [,,]. These innovations significantly enhance the accessibility and scalability of cognitive assessments, providing promising tools for early diagnosis and continuous monitoring of neurological disorders.
As cognitive impairment progresses, disruptions in gaze control become more pronounced, often accompanied by subtle changes in head movement []. While healthy individuals exhibit relatively independent eye–head motions, AD patients show tighter coupling and increased vertical co-rotation, reflecting underlying motor control impairments []. Integrating gaze and head dynamics has been shown to improve classification performance in cognitive and motor disorders, yielding high diagnostic accuracy [].
Despite growing interest in gaze-based assessments for AD detection [,,], head movements remain underexplored. However, a combined analysis of gaze and head dynamics offers a more comprehensive view of cognitive status, capturing subtle motor control deficits that gaze alone may miss. Two major challenges must be addressed to translate these insights into practical diagnostic tools.
The first challenge is ensuring accurate gaze and head tracking while minimizing costs. Traditional gaze-tracking systems rely on infrared technology to detect the pupil size and position [,,]. Although these systems offer high precision, they are expensive and are usually restricted to controlled clinical or research environments, limiting their practical applicability. Recent advancements in deep learning have enabled accurate gaze and head tracking using standard camera setups, thereby significantly reducing costs and broadening the possibilities for large-scale or continuous monitoring. This study leverages these advances to develop a more accessible and scalable approach that combines gaze and head movement data for AD detection.
The second challenge involves accurately analyzing diverse behavioral patterns derived from continuous gaze and head movement data. This includes detecting short-term events, such as brief saccades, rapid eye shifts, or minor head adjustments, as well as long-term patterns, such as sustained fixation or head orientation. Although these behaviors can indicate cognitive impairment, real-world data often contain artifacts (e.g., missed frames, blinks, and extreme head angles) that introduce noise or result in missing values. Therefore, it is essential to adopt a representation that effectively captures both short-term nuances and broader long-term trends while remaining robust to data loss and noise.
To overcome these challenges, we propose a novel AD detection framework that integrates gaze and head movement analysis, emphasizing both short- and long-term temporal dynamics. Our key innovation, GazeMap, transforms one-dimensional (1D) time-series data into structured two-dimensional (2D) images, enabling the extraction of rich temporal patterns while mitigating data loss and noise. This transformation allows convolutional neural networks (CNNs) to effectively classify cognitive function as normal or abnormal.
To further enhance diagnostic accuracy, we introduce a dual-pathway CNN architecture that simultaneously analyzes gaze and head motion, capturing their complex interactions. This approach improves precision by leveraging complementary movement patterns associated with cognitive impairment. Evaluated on a clinical dataset of 112 participants, our framework achieved 91.09% accuracy, outperforming gaze-only methods by 6.31%. By integrating gaze and head motion analysis with GazeMap, our method provides a scalable, non-invasive, and accessible tool for early AD detection, offering a promising solution for identifying individuals at risk of cognitive decline.
Our contributions are summarized as follows:
- We propose a novel dual-pathway framework that integrates gaze and head movement for AD detection, offering a more comprehensive and accurate assessment of cognitive health than gaze-only methods.
- We introduce GazeMap, a novel transformation method that converts 1D gaze and head pose sequences into structured 2D spatial representations, facilitating robust feature extraction and improving model interpretability.
- We validate the proposed framework through comprehensive experiments on both clinical and real-world datasets, demonstrating robust generalization and clinically meaningful performance in diverse, non-controlled environments, beyond conventional benchmark comparisons.
2. Related Work
Early and accurate detection of AD is crucial for timely intervention and management. Traditional diagnostic methods, such as magnetic resonance imaging and positron emission tomography, provide high diagnostic accuracy but are limited by their high cost, reliance on specialized equipment, and the need for expert operators. These challenges have driven research toward identifying more accessible biomarkers, including cognitive and behavioral indicators. Among these, gaze analysis has gained prominence as a cost-effective and non-invasive alternative for early AD detection.
Automatic AD Detection on Gaze Tracking
Gaze tracking is an emerging tool for AD detection because subtle changes in gaze behavior can provide critical insights into cognitive decline [,]. Although gaze tracking does not directly measure brain activity, it offers valuable insight into how brain function manifests in behavior, making it an informative biomarker for cognitive assessment []. Studies have explored various gaze-related measures, such as pupil dilation, fixation, and saccades. However, many early studies [,,] focused on the correlations between gaze patterns and cognitive functions, with limited emphasis on directly validating gaze tracking as a diagnostic tool in clinical settings.
Recent research has leveraged deep learning to evaluate gaze patterns for AD detection. These studies primarily focused on analyzing gaze sequences. Recurrent neural networks (RNNs) such as long short-term memory (LSTM) and gated recurrent units (GRUs) have been employed to analyze temporal gaze patterns [,]. Another approach involves generating gaze heatmaps that visually represent the spatial gaze distribution and are analyzed using a CNN [,]. However, although these heatmaps efficiently model the statistical characteristics of a patient’s visual movements based on their spatial distribution, they fail to capture dynamic temporal interactions. Consequently, their ability to fully represent and illuminate user cognitive processes is limited.
To address these limitations, we propose a feature-map representation that simultaneously captures subtle gaze shifts and broader gaze patterns. By integrating temporal and spatial information into a single representation, our approach facilitates the detection of both gaze behaviors and visual trajectories.
3. Methods
Our goal is to enhance diagnostic accuracy by analyzing gaze and head movement patterns extracted from video streams. As illustrated in Figure 1, our framework consists of three key stages: (1) time-series feature extraction—extracting gaze and head pose sequences from video data; (2) temporal-to-spatial transformation—converting 1D time-series features into 2D spatial representations; (3) CNN-based classification—using a dual-pathway CNN to detect AD-related patterns from the transformed visual features.

Figure 1.
Overview of proposed framework, including time-series feature extraction, temporal-to-spatial transformation, and CNN-based classification.
This approach enables precise gaze and head-pose tracking without requiring specialized equipment while enhancing robustness against missing or noisy data.
3.1. Time-Series Feature Extraction
Figure 2 summarizes the feature extraction process. For each frame t in the input video, we first detect the facial region using RetinaFace [], which precisely isolates the face from the background. The detected face is then cropped and resized to , forming a 2D facial image sequence . This sequence is processed using two separate pretrained networks, L2CS-Net [] for gaze estimation and 6DRepNet [] for head pose estimation, to obtain the 1D gaze sequence and 1D head pose sequence . Both L2CS-Net and 6DRepNet are optimized for robust performance under various conditions to ensure accurate feature extraction.

Figure 2.
Overview of the time-series feature extraction process. From an input image, facial regions are detected and used to compute gaze directions and head poses via pretrained networks. These features are then organized as time-series sequences.
As illustrated in Figure 3, gaze angles commonly include pitch (vertical eye movement) and yaw (horizontal eye movement), whereas head pose angles incorporate pitch, yaw, and roll. To facilitate the CNN-based processing of gaze cues, we convert gaze angles into a gaze-saliency map, inspired by optical flow visualization []. Similar to how optical flow visualization transforms motion vectors into color-coded images—capturing both the direction and magnitude of motion in a form suitable for convolutional processing—we encode gaze direction and magnitude into an image-like representation. We represent gaze direction as the hue component in the hue, saturation, and value (HSV) color space and magnitude as the saturation component and set the value component to 1. Subsequently, we transform this HSV map into an RGB image to obtain the final gaze 1D sequence . This transformation provides an intuitive, image-like depiction of the gaze direction and magnitude, thus enhancing its suitability for CNN-based analyses. The HSV components are computed using the following equations:
where and , respectively, indicate the pitch and yaw angles in frame t, is the arctangent function, and M is a normalization constant corresponding to the maximum gaze magnitude.
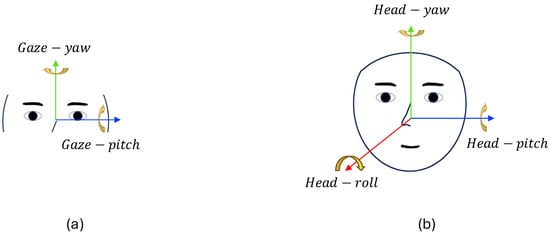
Figure 3.
Coordinate axes: (a) gaze and (b) head pose. The arrows indicate the positive directions of each rotational axis, and the colors represent axis orientation: blue for pitch-axis, green for yaw-axis, and red for roll-axis.
3.2. Temporal-to-Spatial Transformation
Raw gaze and head pose data, though informative, often contain missing or noisy segments owing to blinking or abrupt head movements. A simple 1D analysis may struggle with these inconsistencies. To address this, we convert the 1D time-series data into a 2D spatial image sequence, as shown in Figure 4. We perform row-wise mapping, where time steps are sequentially arranged from top to bottom in an image-like format. This image-based representation allows CNNs to better model complex temporal dependencies while mitigating data loss.
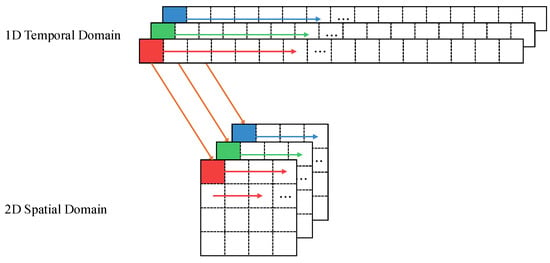
Figure 4.
Transformation of 1D temporal sequence into a 2D spatial representation using a row-wise mapping approach. The arrows indicate the direction of data flow, and the colors represent different channel segments being mapped to spatial rows.
3.3. CNN-Based Classification
We hypothesize that combining gaze and head pose features leads to more accurate AD detection. Inspired by the SlowFast architecture [], we design a dual-pathway CNN where the main pathway extracts deep gaze features and the sub-pathway processes head pose features. The architecture details of the dual-pathway CNN are summarized in Table 1.

Table 1.
The architecture details of the dual-pathway CNN. The orange colors mark fewer channels for the sub-pathway. The backbone is ResNet50.
In our model, the main pathway employed the ResNet architecture [] for gaze-related cues. Meanwhile, the sub-pathway processes head pose cues at a reduced channel capacity, set to of the main pathway. This configuration ensures a lightweight but effective architecture for integrating head pose information. Then, to integrate gaze and head pose representations, we explore three fusion strategies—addition, multiplication, and concatenation. If addition or multiplication is used, the channel dimensions are matched by adding a convolutional layer to the sub-pathway output.
Finally, we apply global average pooling and concatenate participant metadata (age, gender, education level) to form a comprehensive diagnostic representation, which is processed through a fully connected layer for AD classification. This dual-pathway design effectively captures both gaze- and head-pose-driven cues, improving AD detection.
4. Data Collection from Gaze Tracking Task
To validate the effectiveness of GazeMap, we designed a structured gaze-tracking task and collected data from both Alzheimer’s disease (AD) patients and healthy control (HC) participants. Our task involved displaying a series of visual targets on a screen and instructing participants to track them with their gaze. During this process, both gaze movements and head motions were recorded, providing rich temporal data for analysis. To ensure a robust and meaningful task design, we conducted a thorough review of existing gaze-tracking studies, refining our approach to maximize diagnostic relevance. This task standardization and dataset collection represent another contribution, enabling a systematic evaluation of AD-related gaze and head movement abnormalities through GazeMap’s advanced spatiotemporal analysis. The following sections provide a detailed explanation of the gaze-tracking task design and the characteristics of the collected dataset.
4.1. Gaze Tracking Task Design
To assess participants’ visual attention and working memory, we designed a structured gaze-tracking task based on their eye movement patterns. This design was inspired by the King–Devick (KD) test [], which has been shown to differentiate saccadic eye movements in individuals with AD from HC participants []. Participants were instructed to follow a red dot as it moved across a screen for 60 s, with position updates every 0.5 s. The task was divided into three phases: a 3-second preparation phase, where the dot remained centered on the screen; a 40-second regular phase, with predictable motion to assess sustained attention; and a 20-second random phase, where the dot moved unpredictably to evaluate flexibility in gaze control.
Figure 5 outlines this procedure. Figure 6 illustrates a 2.5-second interval (43.5–46.0 s) during the random phase. The red dot’s movement over time is visualized through sequential frames and summarized in a single image. The figure compares gaze behaviors between an HC participant and an AD participant using both the face detection and gaze detection models (see Section 3.1). Green bounding boxes mark the detected faces, and red arrows indicate gaze directions. During the 2.5-second interval (75 samples at 30 fps), the HC participant consistently tracks the moving dot, whereas the AD participant exhibits scattered and unstable gaze trajectories, reflecting impaired visual attention and motor control.

Figure 5.
Overview of the task procedure. The task starts with a preparation phase (3 s), followed by the presentation of regular patterns from 3 to 43 s and random patterns from 43 to 63 s. The red dot is stationary for 0.5 s, then jumps to the next point along the yellow line.
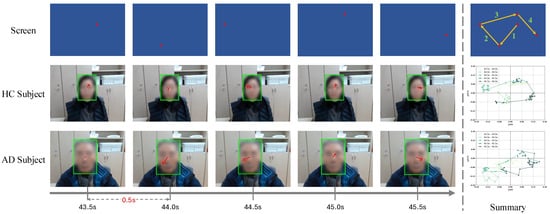
Figure 6.
Task example of a 2.5-second segment (43.5–46.0 s) in the random phase. Sequential frames illustrate the movement of the red dot on the screen and the corresponding gaze responses of HC and AD participants. Green bounding boxes highlight detected faces, and red arrows show gaze directions. The composite image summarizes the trajectory, illustrating the consistent tracking by the HC participant versus the irregular pattern of the AD participant.
4.2. Collected Data Description
AD diagnosis was performed by board-certified psychiatrists through comprehensive clinical assessments, including Mini-Mental State Examination (MMSE) [], neuropsychological testing, activities of daily living evaluations (the Korean Instrumental activities of daily living) [], behavioral assessments (Caregiver-Administered Neuropsychiatric Inventory) [], and dementia severity ratings (CDRs) []. Participants with depressive symptoms, impaired mobility, neurological disorders, or major psychiatric illnesses based on the criteria of the Diagnostic and Statistical Manual of Mental Disorders, Fourth Edition (DSM-IV) [] were excluded. The study protocol was approved by the Institutional Review Board of Konkuk University Medical Center (No. 2021-08-035).
We collected two datasets for gaze-based AD detection: an in-distribution dataset from a clinical setting and an out-of-distribution dataset from a real-world setting. The in-distribution dataset was acquired at the Konkuk University Hospital. This dataset includes 61 HC participants and 51 AD participants, all tested under controlled conditions using a desktop monitor. The out-of-distribution dataset was collected in senior centers and nursing homes. This dataset comprises 21 HC participants and 23 AD participants, recorded under diverse environmental conditions such as varying lighting, backgrounds, and participant states.
The in-distribution dataset was used for model training and validation, ensuring consistency in a controlled hospital environment. In contrast, the out-of-distribution dataset was collected under real-world conditions, introducing domain shifts that pose additional challenges for generalization. Table 2 presents participant demographics, including age, education, gender, and Mini-Mental State Examination (MMSE) scores. The MMSE [] is a widely used neuropsychological tool for dementia screening and is based on a scale of 0–30, where higher values indicate stronger cognitive abilities. Both datasets were carefully designed to ensure a balanced distribution of disease status and maintain consistent gaze data collection through standardized equipment.

Table 2.
Demographic information of the research participants in the gaze tracking task. All variables except gender are expressed as ‘mean ± standard deviation’.
Both datasets were recorded using a Logitech C920s PRO HD webcam at 30 frames per second (fps). The resolution was down-sampled to 640 × 480 pixels for storage efficiency. The in-distribution and out-of-distribution data were collected using a 612.00 mm × 344.25 mm desktop and a 357 mm × 224 mm portable laptop, respectively. Figure 7 illustrates the recording conditions.
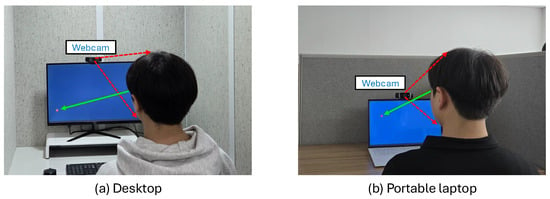
Figure 7.
(a) In-distribution data collection at a hospital. (b) Out-of-distribution data collection in real-world settings. The green arrow indicates the participant’s gaze direction, and the red dashed arrow represents the webcam used to record the face region.
5. Experiments
We evaluate the effectiveness of using the participants’ gaze and head movement patterns for AD detection. We trained our dual-pathway CNN model on an in-distribution dataset and tested its performance on both the in-distribution and out-of-distribution datasets. The experimental setup is described in Section 5.1, and the experimental results are discussed in Section 5.2. Section 5.3 describes the ablation study, and the proposed features are evaluated in Section 5.4.
5.1. Experimental Settings
We applied three-fold cross-validation to the in-distribution dataset to evaluate the performance of our dual-pathway CNN. The primary evaluation metrics were accuracy, sensitivity, specificity, F1 score, and the receiver operating characteristic–area under the curve (ROC-AUC). All the metrics were averaged over three folds. We confirmed the generalizability of the proposed model by testing it on an out-of-distribution dataset.
5.1.1. Implementation Details
All experiments were implemented using PyTorch version 2.0.0. Each video sequence initially contained 1890 frames (63 s × 30 fps) that were zero-padded to 1936 frames for consistency. The 1D gaze sequence and 1D head pose sequence were each transformed into 2D representations, which were then z-normalized and fed into a dual-pathway CNN for classification. For optimization, we used stochastic gradient descent with a learning rate of 2 × 10⁻⁴ and weight decay of 1 × 10⁻⁴ to minimize the cross-entropy loss. A dropout rate of 0.2 was applied to the fully connected layer to prevent overfitting. The model was trained for 300 epochs with a batch size of 8. All the experiments were conducted on a single NVIDIA RTX 3090 GPU.
5.1.2. Baselines
We compared our dual-pathway CNN with several time-series classification baselines, including dynamic time warping support vector machine (DTW-SVM) [], LSTM [], GRU [], temporal convolutional network (TCN) [], and InceptionTime []. Each method is briefly described as follows:
- DTW-SVM: DTW measures similarity by allowing nonlinear alignments of time-series data. Here, DTW-derived distances for both gaze and head pose are used in an SVM classifier to distinguish AD participants and HC participants.
- LSTM and GRU: LSTM captures long-range dependencies through memory cells, whereas GRU provides a more computationally efficient structure. Both models were employed to classify AD using gaze and head pose sequences.
- TCN: TCN uses causal and dilated convolutions to model long-range temporal structures. Unlike RNN-based methods, it processes entire sequences in parallel to improve the training stability and efficiency.
- InceptionTime: InceptionTime is a deep CNN specifically designed for time-series classification. It applies multiple convolutional filters in parallel to capture temporal features at different scales.
5.2. Experimental Results
5.2.1. Main Results
Figure 8 compares the accuracy of all the methods on both the in-distribution and out-of-distribution datasets. Our proposed dual-pathway CNN achieves the highest accuracy in both settings, demonstrating its capability to capture AD-specific gaze and head-movement patterns while demonstrating robustness to real-world variability.
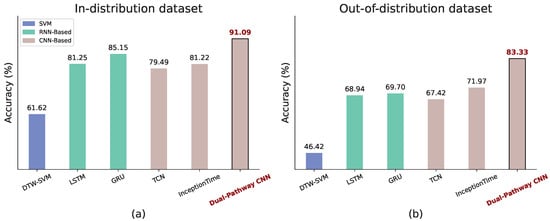
Figure 8.
Comparison of model performance with baseline methods. (a) Average accuracy from 3 to fold cross-validation on the In-distribution dataset. (b) Average accuracy of models trained on the in-distribution dataset and tested on the out-of-distribution dataset.
As shown in Figure 8a, the dual-pathway CNN attains 91.09% accuracy on the in-distribution dataset, significantly outperforming all baseline methods. Traditional approaches, such as DTW-SVM (61.62%), struggle to model complex temporal dependencies, while RNN-based models (LSTM: 81.25%, GRU: 85.15%) provide moderate improvements over 1D CNN-based methods (TCN: 79.49%, InceptionTime: 81.22%), likely due to their ability to capture fine-grained temporal variations.
Figure 8b presents the results on the out-of-distribution dataset. Overall accuracy declines due to domain shifts caused by greater variability. However, our dual-pathway CNN remains the most robust, achieving 83.33% accuracy. Baseline methods degrade more sharply, with DTW-SVM dropping to 46.42%, highlighting the challenges of AD detection in diverse, uncontrolled environments.
These findings emphasize that while standard 1D CNN architectures (e.g., TCN, InceptionTime) are promising, they fail to capture fine-grained temporal variations essential for AD detection. By transforming gaze and head pose data into a 2D structure, our dual-pathway CNN enables more stable feature learning, leading to superior classification performance in both clinical and real-world settings.
To provide a more detailed understanding of the classification behavior, we further present the confusion matrices of the dual-pathway CNN in Figure 9. On the in-distribution dataset, the model shows balanced and high classification performance, correctly identifying HC and AD participants with few misclassifications (HC: 57/61, AD: 45/51). On the out-of-distribution dataset, while a slight decrease in classification performance is observed due to increased variability, the model still maintains a strong ability to differentiate between classes. Specifically, only 1 AD case is misclassified as HC, demonstrating high sensitivity in detecting AD, which is critical in clinical applications. These results validate that the dual-pathway CNN not only achieves high overall accuracy but also exhibits stable class-wise performance under distributional shifts.
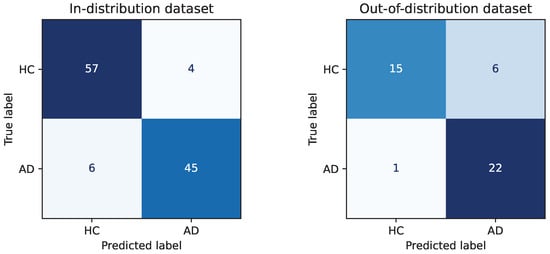
Figure 9.
Confusion matrix of the dual-pathway CNN on the in-distribution and out-of-distribution dataset.
5.2.2. Robustness to Missing Data
To evaluate robustness against missing data, we randomly dropped feature sequences during inference and replaced them with zeros. Figure 10 illustrates that different models respond differently to missing data. The RNN-based approaches (LSTM and GRU) maintain relatively stable accuracy, demonstrating robustness to incomplete sequences. In contrast, 1D CNN-based models (TCN and InceptionTime) show a steeper decline, suggesting a stronger dependence on continuous data for capturing local feature patterns. Meanwhile, DTW-SVM produces inconsistent results, implying difficulty in effectively modeling partially missing signals.
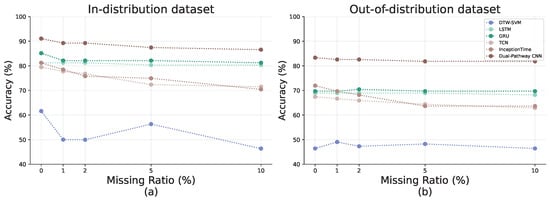
Figure 10.
Analysis of robustness against missing data for (a) in-distribution and (b) out-of-distribution datasets. The x-axis in each plot indicates the data drop ratio. The y-axis is the corresponding classification accuracy.
The proposed dual-pathway CNN mitigates these challenges by transforming the 1D time-series data into a more robust 2D representation, thereby preserving critical information even when parts of the input are missing. As a result, it suffers a smaller performance drop than standard 1D CNN-based methods while maintaining competitive or superior accuracy compared with RNN-based models. These findings highlight the practicality of our method in real-world scenarios, where sensor noise and missing measurements are unavoidable.
5.3. Ablation Study
We conducted an ablation study to analyze the contributions of the different components in our model, including dual-pathway structure, ResNet backbone, and lateral connections.
5.3.1. Single- vs. Dual-Pathway Structure
Table 3 compares the single- and dual-pathway architectures using the gaze and head pose features. In a single-pathway setting, S1 (gaze-only) achieves 84.78% accuracy, while S2 (head pose-only) yields 83.02% accuracy. Combining both features in a single pathway (S3) results in an accuracy of 83.93%, which is slightly higher than S2 but lower than S1, indicating that simple stacking does not effectively leverage both modalities.

Table 3.
Comparison of accuracy for different feature combinations in the AD detection model, including single-pathway and dual-pathway architecture using gaze and head pose features. A check mark (✓) indicates the presence of the corresponding feature in the method.
The dual-pathway architecture demonstrates a substantial performance improvement. When head pose features are used as the main pathway (D1), the accuracy drops to 80.05%, lower than any single-pathway model. In contrast, D2, which designates gaze features as the main pathway, achieves the highest accuracy of 91.09%, representing a 6.31% improvement over S1. These results highlight that gaze features are more informative for AD detection, and that modality prioritization in feature integration is critical to maximizing classification performance.
Figure 11 presents the precision–recall (PR) curves for each method. D2 yields the highest average precision (AP) of 0.914, outperforming all other configurations. Among the single-pathway models, S1 achieves an AP of 0.859, while S2 and S3 record AP values of 0.815 and 0.824, respectively. D1 shows the lowest AP at 0.800, consistent with its inferior accuracy. These findings further underscore the effectiveness of the dual-pathway structure with gaze feature prioritization, and demonstrate its robustness in balancing precision and recall, which is crucial for minimizing false positives and false negatives in clinical settings.
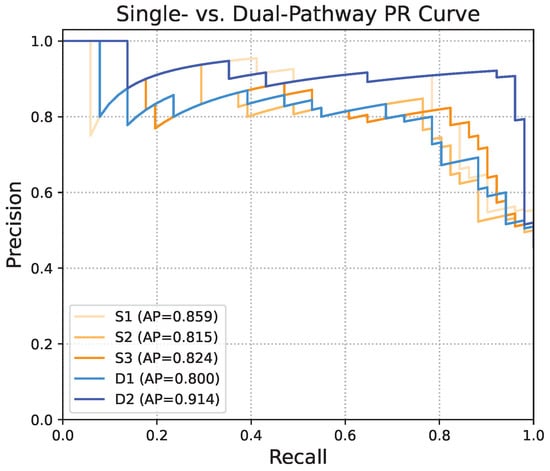
Figure 11.
Comparison of precision–recall (PR) curves between single-pathway and dual-pathway structures. Average precision (AP) summarizes the area under the PR curve.
5.3.2. ResNet Backbone
Table 4 presents a performance comparison of the different ResNet backbones. Increasing the depth from ResNet18 to ResNet50 significantly improves the accuracy and F1 score, highlighting the advantages of deeper networks in capturing complex gaze and head pose patterns. However, increasing the depth of ResNet101 leads to performance degradation, possibly owing to overfitting. Based on these findings, ResNet50 was chosen as the optimal backbone to balance the accuracy.

Table 4.
Performance comparison of ResNet backbones in the dual-pathway CNN model.
5.3.3. Lateral Connection
Connection Type and Depth. Table 5 shows how lateral connections (addition, multiplication, and concatenation) are performed at different convolutional layers. Early fusion (conv1, conv2_x) can disrupt low-level feature extraction and degrade overall performance, whereas connections in the final layer (conv5_x) tend to perform best. The concatenation at conv5_x achieves the highest accuracy of 91.09%.

Table 5.
Classification accuracy for different lateral connection methods and stages in our dual-pathway CNN model.
Channel Capacity of Sub-Pathway. Finally, we vary the channel capacity of the sub-pathway (head pose) by modifying the ratio with respect to the main pathway (Figure 12). The results indicate that a channel ratio of 1/8 achieves the highest accuracy (91.09%), confirming that a lightweight sub-pathway effectively enhances the feature representation of the main pathway. Moreover, reducing below 1/2 consistently improves overall accuracy, whereas setting to 1/2 or 1 produces no further gain, suggesting that head-pose information is more complementary than dominant in AD detection.
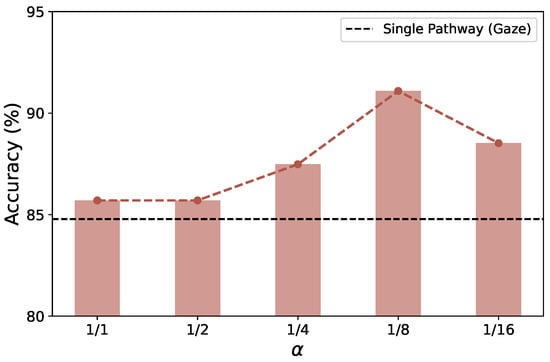
Figure 12.
Evaluation of accuracy according to the channel capacity ratio () of the sub-pathway (head pose) in the proposed dual-pathway CNN.
5.4. Effectiveness of Gaze-Saliency Map Features
We further examined the utility of our gaze-saliency map, which encodes gaze direction using hue and gaze magnitude using saturation, with a fixed intensity (value = 1). This encoding method enables an intuitive, image-like representation of gaze patterns: wide color variations indicate rapid and broad gaze changes, characteristic of healthy cognitive function. In contrast, uniform color patterns suggest slower or restricted movement, often seen in AD patients.
Figure 13 compares the saliency maps of HC and AD participants. HC participants (left) exhibit dynamic color shifts, reflecting diverse gaze transitions and frequent directional changes. However, AD participants (right) show more uniform and repetitive color patterns, indicating constrained gaze behavior. These results reinforce that healthy individuals display more flexible and dynamic gaze behavior, while AD patients exhibit limited and repetitive eye movements, aligning with cognitive decline.
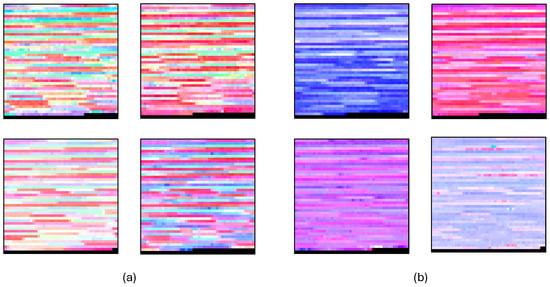
Figure 13.
Visualization of gaze-saliency map features and comparison between two groups. Gaze-saliency map features are from (a) healthy control participants and (b) Alzheimer’s disease participants.
The saliency map can provide an interpretable, diagnostic-rich representation of gaze behavior, further demonstrating its value as a marker for AD detection.
6. Discussion
This study proposed a novel dual-pathway framework that integrates gaze and head movements for AD detection. Our results demonstrate that gaze behavior, particularly when prioritized in the dual-pathway design, serves as a sensitive biomarker for cognitive impairment, achieving substantial improvements over single-modal or traditional 1D time-series models. To enhance feature representation, we introduced GazeMap, a transformation that converts 1D gaze and head pose time-series data into structured 2D spatial representations. This approach effectively captured both short- and long-term temporal interactions while mitigating the impact of missing or noisy data. Furthermore, gaze-saliency maps provided interpretable visualizations that revealed dynamic range differences between HC and AD participants, underscoring the potential for bridging deep learning models with clinical insight.
Traditional gaze heatmap approaches typically aggregate fixation points or gaze durations over spatial coordinates to produce static visual distributions, indicating where participants tend to focus. While effective for summarizing overall attention, these representations discard the temporal structure of gaze behavior, treating fixations as unordered spatial events. In contrast, GazeMap constructs a temporally ordered two-dimensional representation, where one axis corresponds to time and the other encodes spatial deviation. This design explicitly preserves the dynamic progression of gaze and head pose over time, enabling the model to capture fine-grained behavioral patterns associated with cognitive impairment. Rather than simply indicating where attention was concentrated, GazeMap reveals how gaze and head movements track, providing richer information for deep learning models to exploit.
Nevertheless, several limitations need to be acknowledged. Although the dataset employed in this study provided a solid foundation for initial validation, its size remains relatively modest for clinical translation. The participants were limited in number and demographic diversity, which may constrain the generalizability of our findings to broader populations. Moreover, the structured gaze tracking task, centered around a single moving target, while valuable for controlled experimentation, may not fully capture the complexity and variability of gaze behavior in naturalistic environments. Finally, while our gaze-saliency maps offer encouraging steps toward model interpretability, they currently lack grounding in clinically standardized quantitative metrics, which are necessary to translate qualitative insights into practical diagnostic tools.
Building on these insights, future work will focus on expanding and diversifying the dataset, both in terms of participant demographics and cognitive conditions, to better evaluate the specificity and robustness of gaze-based biomarkers. Moving beyond structured tasks, we aim to explore more naturalistic settings, such as free-viewing of complex scenes or real-world navigation, to capture richer gaze and head movement patterns. In parallel, deeper collaboration with clinical experts will be pursued to define interpretable, quantifiable metrics derived from gaze and head dynamics—such as fixation duration distributions, saccadic amplitudes, and head stabilization indices—that can directly inform diagnostic decision-making.
7. Conclusions
This paper introduced a novel gaze-based AD detection framework that integrates gaze and head pose analysis using a dual-pathway CNN. By transforming 1D time-series data into 2D representations, our method efficiently captured both short- and long-term temporal information while mitigating missing or noisy segments through spatial interpolation. Experimental results demonstrated that combining gaze and head pose in this two-pathway architecture substantially boosted the diagnostic accuracy to 91.09%, outperforming baseline approaches and offering a 6.31% gain over gaze-only methods. A key strength of our framework is its ability to visualize gaze features as saliency maps, enhancing clinical interpretability and bridging the gap between deep learning models and practical diagnostic applications. The proposed model provided a non-invasive and cost-effective alternative that can be deployed in real-world settings using standard webcams. For future work, our goal is to develop a scalable, interpretable, and accessible tool for early cognitive health monitoring and intervention.
Author Contributions
Conceptualization, methodology, H.J. and E.Y.K.; software, H.J., S.H., J.E.S., H.K. and E.Y.K.; validation, H.J., S.H. and E.Y.K.; resources, E.Y.K.; data curation, J.E.S.; writing-original draft preparation, H.J.; writing-review and editing, E.Y.K.; visualization, H.J. and S.H.; supervision, E.Y.K.; project administration, H.J., S.H., J.E.S., H.K. and E.Y.K.; funding acquisition, H.K and E.Y.K. All authors have read and agreed to the published version of the manuscript.
Funding
This work was supported by the Institute of Information & communications Technology Planning & Evaluation (IITP) under the metaverse support program to nurture the best talents under Grant IITP-2025-RS-2023-00256615 funded by the Korea government (MSIT).
Informed Consent Statement
Informed consent was obtained from all subjects involved in the study.
Data Availability Statement
The data presented in this study are available on request from the corresponding author. The data are not publicly available due to data privacy.
Conflicts of Interest
Authors Jung Eun Shin and Eun Yi Kim were employed by Voinosis Inc. All authors declare that the research was conducted without any commercial or financial relationships that could be construed as a potential conflict of interest.
References
- Xu, B.; Li, W.; Liu, D.; Zhang, K.; Miao, M.; Xu, G.; Song, A. Continuous hybrid BCI control for robotic arm using noninvasive electroencephalogram, computer vision, and eye tracking. Mathematics 2022, 10, 618. [Google Scholar] [CrossRef]
- Zheng, L.; Zhang, Y.; Ding, T.; Meng, F.; Li, Y.; Cao, S. Classification of driver distraction risk levels: Based on driver’s gaze and secondary driving tasks. Mathematics 2022, 10, 4806. [Google Scholar] [CrossRef]
- Wolf, A.; Tripanpitak, K.; Umeda, S.; Otake-Matsuura, M. Eye-tracking paradigms for the assessment of mild cognitive impairment: A systematic review. Front. Psychol. 2023, 14, 1197567. [Google Scholar] [CrossRef] [PubMed]
- Wolf, A.; Ueda, K.; Hirano, Y. Recent updates of eye movement abnormalities in patients with schizophrenia: A scoping review. Psychiatry Clin. Neurosci. 2021, 75, 82–100. [Google Scholar] [CrossRef]
- Readman, M.R.; Polden, M.; Gibbs, M.C.; Wareing, L.; Crawford, T.J. The potential of naturalistic eye movement tasks in the diagnosis of Alzheimer’s disease: A review. Brain Sci. 2021, 11, 1503. [Google Scholar] [CrossRef]
- Lima, E.S.H.; Andrade, M.J.O.d.; Bonifácio, T.A.d.S.; Rodrigues, S.J.; Almeida, N.L.d.; Oliveira, M.E.C.d.; Gonçalves, L.M.; Santos, N.A.d. Eye tracking technique in the diagnosis of depressive disorder: A systematic review. Context. Clínicos 2021, 14, 660–679. [Google Scholar]
- Vatheuer, C.C.; Vehlen, A.; Von Dawans, B.; Domes, G. Gaze behavior is associated with the cortisol response to acute psychosocial stress in the virtual TSST. J. Neural Transm. 2021, 128, 1269–1278. [Google Scholar] [CrossRef]
- MacAskill, M.R.; Anderson, T.J. Eye movements in neurodegenerative diseases. Curr. Opin. Neurol. 2016, 29, 61–68. [Google Scholar] [CrossRef]
- Armstrong, R.A. Alzheimer’s disease and the eye. J. Optom. 2009, 2, 103–111. [Google Scholar] [CrossRef]
- Garbutt, S.; Matlin, A.; Hellmuth, J.; Schenk, A.K.; Johnson, J.K.; Rosen, H.; Dean, D.; Kramer, J.; Neuhaus, J.; Miller, B.L.; et al. Oculomotor function in frontotemporal lobar degeneration, related disorders and Alzheimer’s disease. Brain 2008, 131, 1268–1281. [Google Scholar] [CrossRef]
- Molitor, R.J.; Ko, P.C.; Ally, B.A. Eye movements in Alzheimer’s disease. J. Alzheimer’s Dis. 2015, 44, 1–12. [Google Scholar] [CrossRef]
- Antoniades, C.; Kennard, C. Ocular motor abnormalities in neurodegenerative disorders. Eye 2015, 29, 200–207. [Google Scholar] [CrossRef] [PubMed]
- Brahm, K.D.; Wilgenburg, H.M.; Kirby, J.; Ingalla, S.; Chang, C.Y.; Goodrich, G.L. Visual impairment and dysfunction in combat-injured servicemembers with traumatic brain injury. Optom. Vis. Sci. 2009, 86, 817–825. [Google Scholar] [CrossRef] [PubMed]
- Pavisic, I.M.; Firth, N.C.; Parsons, S.; Rego, D.M.; Shakespeare, T.J.; Yong, K.X.; Slattery, C.F.; Paterson, R.W.; Foulkes, A.J.; Macpherson, K.; et al. Eyetracking metrics in young onset Alzheimer’s disease: A window into cognitive visual functions. Front. Neurol. 2017, 8, 377. [Google Scholar] [CrossRef]
- Biondi, J.; Fernandez, G.; Castro, S.; Agamennoni, O. Eye movement behavior identification for Alzheimer’s disease diagnosis. J. Integr. Neurosci. 2018, 17, 349–354. [Google Scholar] [CrossRef]
- Friedrich, M.U.; Schneider, E.; Buerklein, M.; Taeger, J.; Hartig, J.; Volkmann, J.; Peach, R.; Zeller, D. Smartphone video nystagmography using convolutional neural networks: ConVNG. J. Neurol. 2023, 270, 2518–2530. [Google Scholar] [CrossRef]
- Liu, Y.; Zhang, W.; Wang, S.; Zuo, F.; Jing, P.; Ji, Y. Depth-induced Saliency Comparison Network for Diagnosis of Alzheimer’s Disease via Jointly Analysis of Visual Stimuli and Eye Movements. arXiv 2024, arXiv:2403.10124. [Google Scholar]
- Bastani, P.B.; Rieiro, H.; Badihian, S.; Otero-Millan, J.; Farrell, N.; Parker, M.; Newman-Toker, D.; Zhu, Y.; Saber Tehrani, A. Quantifying induced nystagmus using a smartphone eye tracking application (EyePhone). J. Am. Heart Assoc. 2024, 13, e030927. [Google Scholar] [CrossRef]
- Kunz, M.; Syed, A.; Fraser, K.C.; Wallace, B.; Goubran, R.; Knoefel, F.; Thomas, N. Reducing Fixation Error Due to Natural Head Movement in a Webcam-Based Eye-Tracking Method. In Proceedings of the 2023 IEEE Sensors Applications Symposium (SAS), Ottawa, ON, Canada, 18–20 July 2023; IEEE: Piscataway, NJ, USA, 2023; pp. 1–6. [Google Scholar]
- Nam, U.; Lee, K.; Ko, H.; Lee, J.Y.; Lee, E.C. Analyzing facial and eye movements to screen for Alzheimer’s disease. Sensors 2020, 20, 5349. [Google Scholar] [CrossRef]
- Sun, J.; Dodge, H.H.; Mahoor, M.H. MC-ViViT: Multi-branch Classifier-ViViT to detect Mild Cognitive Impairment in older adults using facial videos. Expert Syst. Appl. 2024, 238, 121929. [Google Scholar] [CrossRef]
- Oyama, A.; Takeda, S.; Ito, Y.; Nakajima, T.; Takami, Y.; Takeya, Y.; Yamamoto, K.; Sugimoto, K.; Shimizu, H.; Shimamura, M.; et al. Novel method for rapid assessment of cognitive impairment using high-performance eye-tracking technology. Sci. Rep. 2019, 9, 12932. [Google Scholar] [CrossRef] [PubMed]
- Tadokoro, K.; Yamashita, T.; Fukui, Y.; Nomura, E.; Ohta, Y.; Ueno, S.; Nishina, S.; Tsunoda, K.; Wakutani, Y.; Takao, Y.; et al. Early detection of cognitive decline in mild cognitive impairment and Alzheimer’s disease with a novel eye tracking test. J. Neurol. Sci. 2021, 427, 117529. [Google Scholar] [CrossRef]
- Mengoudi, K.; Ravi, D.; Yong, K.X.; Primativo, S.; Pavisic, I.M.; Brotherhood, E.; Lu, K.; Schott, J.M.; Crutch, S.J.; Alexander, D.C. Augmenting dementia cognitive assessment with instruction-less eye-tracking tests. IEEE J. Biomed. Health Inform. 2020, 24, 3066–3075. [Google Scholar] [CrossRef]
- Sheng, Z.; Guo, Z.; Li, X.; Li, Y.; Ling, Z. Dementia detection by fusing speech and eye-tracking representation. In Proceedings of the ICASSP 2022-2022 IEEE International Conference on Acoustics, Speech and Signal Processing (ICASSP), Singapore, 23–27 May 2022; IEEE: Piscataway, NJ, USA, 2022; pp. 6457–6461. [Google Scholar]
- Tokushige, S.i.; Matsumoto, H.; Matsuda, S.i.; Inomata-Terada, S.; Kotsuki, N.; Hamada, M.; Tsuji, S.; Ugawa, Y.; Terao, Y. Early detection of cognitive decline in Alzheimer’s disease using eye tracking. Front. Aging Neurosci. 2023, 15, 1123456. [Google Scholar] [CrossRef] [PubMed]
- Polden, M.; Wilcockson, T.D.; Crawford, T.J. The disengagement of visual attention: An eye-tracking study of cognitive impairment, ethnicity and age. Brain Sci. 2020, 10, 461. [Google Scholar] [CrossRef]
- Wolf, A.; Ueda, K. Contribution of eye-tracking to study cognitive impairments among clinical populations. Front. Psychol. 2021, 12, 590986. [Google Scholar] [CrossRef]
- Ho, T.K.K.; Kim, M.; Jeon, Y.; Kim, B.C.; Kim, J.G.; Lee, K.H.; Song, J.I.; Gwak, J. Deep learning-based multilevel classification of Alzheimer’s disease using non-invasive functional near-infrared spectroscopy. Front. Aging Neurosci. 2022, 14, 810125. [Google Scholar] [CrossRef]
- Mao, Y.; He, Y.; Liu, L.; Chen, X. Disease classification based on synthesis of multiple long short-term memory classifiers corresponding to eye movement features. IEEE Access 2020, 8, 151624–151633. [Google Scholar] [CrossRef]
- Sun, J.; Liu, Y.; Wu, H.; Jing, P.; Ji, Y. A novel deep learning approach for diagnosing Alzheimer’s disease based on eye-tracking data. Front. Hum. Neurosci. 2022, 16, 972773. [Google Scholar] [CrossRef]
- Zuo, F.; Jing, P.; Sun, J.; Duan, J.; Ji, Y.; Liu, Y. Deep Learning-based Eye-Tracking Analysis for Diagnosis of Alzheimer’s Disease Using 3D Comprehensive Visual Stimuli. IEEE J. Biomed. Health Inform. 2024, 28, 2781–2793. [Google Scholar] [CrossRef]
- Deng, J.; Guo, J.; Ververas, E.; Kotsia, I.; Zafeiriou, S. Retinaface: Single-shot multi-level face localisation in the wild. In Proceedings of the IEEE/CVF Conference on Computer Vision and Pattern Recognition, Seattle, WA, USA, 13–19 June 2020; pp. 5203–5212. [Google Scholar]
- Abdelrahman, A.A.; Hempel, T.; Khalifa, A.; Al-Hamadi, A.; Dinges, L. L2cs-net: Fine-grained gaze estimation in unconstrained environments. In Proceedings of the 2023 8th International Conference on Frontiers of Signal Processing (ICFSP), Corfu, Greece, 23–25 October 2023; IEEE: Piscataway, NJ, USA, 2023; pp. 98–102. [Google Scholar]
- Hempel, T.; Abdelrahman, A.A.; Al-Hamadi, A. 6d rotation representation for unconstrained head pose estimation. In Proceedings of the 2022 IEEE International Conference on Image Processing (ICIP), Bordeaux, France, 16–19 October 2022; IEEE: Piscataway, NJ, USA, 2022; pp. 2496–2500. [Google Scholar]
- Baker, S.; Scharstein, D.; Lewis, J.P.; Roth, S.; Black, M.J.; Szeliski, R. A database and evaluation methodology for optical flow. Int. J. Comput. Vis. 2011, 92, 1–31. [Google Scholar] [CrossRef]
- Feichtenhofer, C.; Fan, H.; Malik, J.; He, K. Slowfast networks for video recognition. In Proceedings of the IEEE/CVF International Conference on Computer Vision (ICCV), Seoul, Republic of Korea, 27 October–2 November 2019; pp. 6202–6211. [Google Scholar]
- He, K.; Zhang, X.; Ren, S.; Sun, J. Deep residual learning for image recognition. In Proceedings of the IEEE Conference on Computer Vision and Pattern Recognition, Las Vegas, NV, USA, 27–30 June 2016; pp. 770–778. [Google Scholar]
- Galetta, K.M.; Brandes, L.E.; Maki, K.; Dziemianowicz, M.S.; Laudano, E.; Allen, M.; Lawler, K.; Sennett, B.; Wiebe, D.; Devick, S.; et al. The King–Devick test and sports-related concussion: Study of a rapid visual screening tool in a collegiate cohort. J. Neurol. Sci. 2011, 309, 34–39. [Google Scholar] [CrossRef] [PubMed]
- Hannonen, S.; Andberg, S.; Kärkkäinen, V.; Rusanen, M.; Lehtola, J.M.; Saari, T.; Korhonen, V.; Hokkanen, L.; Hallikainen, M.; Hänninen, T.; et al. Shortening of saccades as a possible easy-to-use biomarker to detect risk of Alzheimer’s disease. J. Alzheimer’s Dis. 2022, 88, 609–618. [Google Scholar] [CrossRef] [PubMed]
- Folstein, M.F.; Folstein, S.E.; McHugh, P.R. “Mini-mental state”: A practical method for grading the cognitive state of patients for the clinician. J. Psychiatr. Res. 1975, 12, 189–198. [Google Scholar] [CrossRef]
- Won, C.W.; Yang, K.Y.; Rho, Y.G.; Kim, S.Y.; Lee, E.J.; Yoon, J.L.; Cho, K.H.; Shin, H.C.; Cho, B.R.; Oh, J.R.; et al. The development of Korean activities of daily living (K-ADL) and Korean instrumental activities of daily living (K-IADL) scale. J. Korean Geriatr. Soc. 2002, 6, 107–120. [Google Scholar]
- Kang, S.J.; Choi, S.H.; Lee, B.H.; Jeong, Y.; Hahm, D.S.; Han, I.W.; Cummings, J.L.; Na, D.L. Caregiver-administered neuropsychiatric inventory (CGA-NPI). J. Geriatr. Psychiatry Neurol. 2004, 17, 32–35. [Google Scholar] [CrossRef]
- Morris, J.C. Clinical dementia rating: A reliable and valid diagnostic and staging measure for dementia of the Alzheimer type. Int. Psychogeriatr. 1997, 9, 173–176. [Google Scholar] [CrossRef]
- American Psychiatric Association. Diagnostic and Statistical Manual of Mental Disorders, DSM IV-4th ed.; American Psychiatric Association: Washington, DC, USA, 1994; Volume 1994. [Google Scholar]
- Kate, R.J. Using dynamic time warping distances as features for improved time series classification. Data Min. Knowl. Discov. 2016, 30, 283–312. [Google Scholar] [CrossRef]
- Hochreiter, S.; Schmidhuber, J. Long short-term memory. Neural Comput. 1997, 9, 1735–1780. [Google Scholar] [CrossRef]
- Chung, J.; Gulcehre, C.; Cho, K.; Bengio, Y. Empirical evaluation of gated recurrent neural networks on sequence modeling. arXiv 2014, arXiv:1412.3555. [Google Scholar]
- Bai, S.; Kolter, J.Z.; Koltun, V. An empirical evaluation of generic convolutional and recurrent networks for sequence modeling. arXiv 2018, arXiv:1803.01271. [Google Scholar]
- Ismail Fawaz, H.; Lucas, B.; Forestier, G.; Pelletier, C.; Schmidt, D.F.; Weber, J.; Webb, G.I.; Idoumghar, L.; Muller, P.A.; Petitjean, F. Inceptiontime: Finding alexnet for time series classification. Data Min. Knowl. Discov. 2020, 34, 1936–1962. [Google Scholar] [CrossRef]
Disclaimer/Publisher’s Note: The statements, opinions and data contained in all publications are solely those of the individual author(s) and contributor(s) and not of MDPI and/or the editor(s). MDPI and/or the editor(s) disclaim responsibility for any injury to people or property resulting from any ideas, methods, instructions or products referred to in the content. |
© 2025 by the authors. Licensee MDPI, Basel, Switzerland. This article is an open access article distributed under the terms and conditions of the Creative Commons Attribution (CC BY) license (https://creativecommons.org/licenses/by/4.0/).