Abstract
Deep learning-based fault diagnosis methods have gained extensive attention in recent years due to their outstanding performance. The model input can take the form of multiple domains, such as the time domain, frequency domain, and time–frequency domain, with commonalities and differences between them. Fusing multimodal features is crucial for enhancing diagnostic effectiveness. In addition, original signals typically exhibit nonstationary characteristics influenced by varying working conditions. In this paper, a dual-attentive multimodal fusion method combining a multiscale dilated CNN (DAMFM-MD) is proposed for rotating machinery fault diagnosis. Firstly, multimodal data are constructed by combining original signals, FFT-based frequency spectra, and STFT-based time–frequency images. Secondly, a three-branch multiscale CNN is developed for discriminative feature learning to consider nonstationary factors. Finally, a two-stage sequential fusion is designed to achieve multimodal complementary fusion considering the features with commonality and differentiation. The performance of the proposed method was experimentally verified through a series of industrial case analyses. The proposed DAMFM-MD method achieves the best F-score of 99.95%, an accuracy of 99.96%, and a recall of 99.95% across four sub-datasets, with an average fault diagnosis response time per sample of 1.095 milliseconds, outperforming state-of-the-art methods.
Keywords:
fault diagnosis; deep learning; convolutional neural network; dilation convolution; attention mechanism; multimodal feature fusion MSC:
68T07
1. Introduction
In modern industry, rotating machinery is extensively used, and its integration, intelligence, and precision are increasingly valued [1,2]. However, the risk of failure is extremely high due to the long operating hours in a harsh environment. Once a failure occurs, it can cause avoidable financial losses and even catastrophic outcomes [3,4]. Fault diagnosis techniques enable the timely detection, diagnosis, and maintenance of mechanical equipment, which are essential for ensuring the reliable and stable operation of rotating machinery [5,6,7]. Meanwhile, more and more sensors are installed to monitor the conditions that can generate millions of data points per minute, reflecting the working status of machinery [8,9]. Therefore, data-driven fault diagnosis has emerged as a critical area of interest in both industry and academia.
In recent years, machine learning methods have stimulated the promotion and application of intelligent fault diagnosis. The extant methods can be bifurcated into two classifications: shallow machine learning-based methods and deep learning-based methods. The former involves the fault feature extraction of the data, followed by applying models for fault-type prediction [10]. In the feature extraction stage, signal analysis techniques such as time-domain analysis, frequency-domain analysis, and time–frequency domain analysis are usually applied to obtain statistical features [11]. In the pattern recognition stage, methods such as the k-nearest neighbor (KNN), random forest (RF), and support vector machine (SVM) are employed to achieve classification tasks on the extracted features [11,12]. However, the signals collected from industrial processes are characterized by complex nonlinear features. The relatively shallow architecture of the model, which relies heavily on experience-dependent signal preprocessing techniques for feature extraction, struggles to mine richer and deeper fault features, especially for massive data [13].
Deep learning has received extensive research interest in previous studies due to its remarkable capabilities to both extract intricate features and recognize complex patterns, which can effectively mine deeper feature representations of industrial data [14]. Within the spectrum of prevalent deep learning architectures, convolutional neural networks (CNNs) have been successfully utilized to obtain representative receptive fields on local data areas by alternating convolution and pooling processes [15,16,17]. Moreover, due to the characteristics of sparse connectivity, global sharing, and parallel computing, the model computation efficiency of CNNs surpasses that of other methods for massive industrial data [18,19,20]. Initially designed for visual recognition, CNNs subsequently migrated to be applied for fault diagnosis. To meet the input requirements, several studies used time–frequency transformation methods on the original signal for two-dimensional (2D)-structured feature extraction [21,22,23]. For example, Zaman et al. proposed a robust hybrid model for precise fault detection and classification. The model uses Wavelet Coherence Analysis (WCA) for time–frequency domain feature extraction and feeds the extracted fault features into deep learning architectures, VGG16 and ResNet50, to improve diagnostic accuracy [24].
With the continuous innovation of research on fault diagnosis methodologies, a 1D-structured CNN was proposed, which is more suitable and efficient for handling one-dimensional (1D) data such as original signals or frequency spectrograms [25,26,27]. For instance, Siddique et al. developed a hybrid deep learning model for bearing fault diagnosis. The model uses Continuous Wavelet Transform (CWT) to extract time–frequency domain fault features, and then employs a 1DCNN-based spatiotemporal network for deep fault representation learning, enabling the model to perform precise and reliable feature learning [28]. It should be pointed out that the 1DCNN and 2DCNN perform and focus differently on feature extraction due to their distinctive dimensional structure. On the one hand, the 2DCNN combined with an effective image transformation method can extract richer fault features, while a lightweight 1DCNN improves the efficiency of fault diagnosis, which achieves more sensitive mining of the original 1D fault information [29,30,31]. Both the 1DCNN and 2DCNN have proven particularly successful in fault diagnosis tasks.
Nevertheless, the above methods consider only one data pattern and exhibit limitations in mining the rich multi-perspective information inherent in signals. Recent research initiatives have increasingly adopted multimodal deep learning approaches to concurrently process diverse data for fault diagnosis, and the input can be multidomain signals like time domain, frequency domain, and time–frequency domain [32]. On the one hand, multimodal data provide complementary information in some respects. For example, time-domain signals are better suited to capture abrupt events directly, while frequency-domain sequences are more revealing of periodic frequency-type fault characteristics [33,34]. On the other hand, multimodal learning can overcome the limitations of a single data source by integrating multiple data sources. With the fusion of information from different modalities, it is capable of learning richer and more complex data representations, thus improving robustness and generalization [35,36,37].
To sum up, while deep learning-based diagnostic methods have made significant strides, challenges remain when dealing with complex industrial data. One challenge is that the original signal is composed of multimodal information hidden within different signal representations. These multimodal data describe the operating state of mechanical equipment, and they reflect fault information from different perspectives with different dimensional structures, commonalities, and differences that characterize them inherently. Therefore, analyzing multimodal information for signals and exploring intrinsic common and differential features comprehensively are essential to simultaneously enhance fault recognition performance and strengthen model generalizability. Another challenge is the adverse influence of varying working conditions, such as fluctuating speeds and unstable loads. The operating processes of rotating machinery are often characterized by nonstationary behavior [38,39]. As a result, the input data contain complex multiscale information, which limits the feature extraction effectiveness of the CNN that uses a convolution filter with a constant receptive field size.
To address the abovementioned issues, the dual-attentive multimodal fusion method combining a multiscale dilated CNN (DAMFM-MD) is introduced for multimodal fault diagnosis, featuring two core modules: a three-branch multiscale dilated CNN (MDCN) and a dual-attentive multimodal fusion module (DAMFM). Firstly, multimodal data are constructed using time signals, the FFT-based frequency spectrum, and STFT-based time–frequency images, delivering complementary data modalities that enable comprehensive feature representation learning. Secondly, the MDCN is designed for multimodal data, and attention mechanisms are used to fuse multiscale information to effectively solve the nonstationary problem. The 1DCNN is employed to filter the multiscale time-domain and frequency-domain features, while a 2DCNN is adopted to capture time–frequency domain information. Finally, a two-stage modality-wise fusion is used to dynamically conduct the complementary sequential fusion of information in the three feature maps. The commonality selection attention mechanism (CSAM) and differentiation enhance attention mechanism (DEAM) emphasize the intrinsic commonality and difference features between modalities, respectively. Sufficient experiments are conducted on both gearbox and bearing fault datasets to comparatively evaluate the DAMFM-MD against state-of-the-art methods. Comparison experiments with popular deep learning methods and single-modal methods on four sub-datasets demonstrate the higher fault classification accuracy of the DAMFM-MD, with the best reaching 99.98%. Additionally, the effect of the key components is investigated, and the results validate that the DAMFM-MD can handle multimodal data efficiently under varying working conditions.
The primary contributions of this study include the following:
- (1)
- A novel sequential fusion framework is proposed for multimodal fault diagnosis in this paper, which comprehensively considers both commonality and differentiation to fuse multimodal features. This framework significantly improves the diagnostic performance.
- (2)
- A deep learning-based modeling approach considering varying working conditions is proposed in this paper. The three-branch MDCN conducts discriminative feature extraction for each single-modal dataset. Additionally, the DAMFM is developed to achieve multimodal feature fusion.
- (3)
- The diagnostic efficacy of the DAMFM-MD was rigorously validated on two datasets that include gearbox and bearing cases, demonstrating consistent superiority over the existing state-of-the-art methods.
2. Related Work
In recent years, machine learning-based fault diagnosis methodologies have emerged as a prominent research focus, which can be broadly categorized into two distinct paradigms: shallow machine learning-based methods and deep learning-based methods.
2.1. Shallow Machine Learning-Based Methods
Shallow machine learning-based methods primarily involve two sequential stages: feature extraction and fault pattern recognition. During the feature extraction phase, time-domain, frequency-domain, and time–frequency domain features are systematically extracted and utilized for diagnostic tasks. Time-domain analysis evaluates signal changes by calculating statistics directly from the perspective of time. These features reveal the basic appearance of the signal and the changing trend, which are applicable to identifying fault characteristics such as sudden or trend changes. Frequency-domain analysis analyzes the spectral characteristics of signals by methods such as the fast Fourier transform (FFT), which is capable of identifying periodic components and harmonics contained in signals and can detect unbalance, misalignment, etc., in rotating machinery. By merging time-domain and frequency-domain approaches, time–frequency analysis reveals how a signal’s spectral content evolves temporally. Methods such as the short-time Fourier transform (STFT) enable the extraction of localized features in complex nonstationary signal components [40,41,42].
The pattern recognition stage typically employs shallow learning architectures, such as the KNN, RF, and SVM, to classify fault patterns based on the extracted features. For example, Pandya et al. applied an optimized KNN to diagnose bearing faults, which classified features into statistical, acoustic, and time–frequency forms [43]. Cerrada et al. explored a diagnostic system for gearboxes using genetic algorithms and RF to focus on multidomain features selected from vibration signals [44]. Li et al. utilized the KNN and RF for multi-fault diagnosis based on dozens of features calculated from raw vibration signals [12]. Liu et al. introduced an early-stage bearing fault detection approach using the SVM, combined with an impact time–frequency dictionary for signal analysis [11]. Yan et al. employed an SVM-based method optimized by PSO for bearing, utilizing features consisting of statistical, FFT, and VMD analysis [45]. However, these methodologies are fundamentally constrained by their heavy reliance on expert-driven feature engineering, while also demonstrating limited adaptability to complex mechanical systems with intricate structural configurations.
2.2. Deep Learning-Based Methods
Deep learning-based methods have emerged as a predominant research focus in fault diagnosis due to their capability to autonomously extract hierarchical abstract fault features from raw signal data. Particularly, the CNN has demonstrated exceptional efficacy in mechanical fault detection, leveraging its intrinsic structural priors for localized defect pattern recognition in vibration signals. For instance, Wen et al. transformed signals into time–frequency matrices and utilized the LeNet-5-based CNN to capture abstract features, whose effectiveness was validated in three industrial cases [15]. Li et al. applied the S-transform to obtain time–frequency matrices and employed the CNN for automated feature extraction and subsequent fault classification, which effectively handled the nonlinear and nonstationary signals of bearings to achieve robust diagnosis performance [46]. Han et al. introduced a CNN-based method to learn the features of multi-level matrixes, whose feasibility was proven on two experimental planetary gearbox datasets [21]. Wen et al. devised a hierarchical CNN that employed the LeNet-5 structure to extract the features of STFT-based images, which showed a higher prediction accuracy than other methods on three datasets [22]. Zhang et al. improved the 2DCNN by incorporating multiscale fusion to deal with time–frequency images obtained by synchro-squeezing transform, and it achieved excellent diagnostic accuracy and robustness on bearings [47].
Notably, 1DCNNs demonstrate superior efficacy in processing raw 1D temporal signals, attributed to their intrinsic capability for local feature preservation along the temporal dimension, which has propelled their widespread adoption in machinery diagnostics. For example, Wu et al. introduced the 1DCNN to explore fault features of signals from rotating machinery directly, and it performed with higher accuracy than other traditional methods for an industrial case of the gearbox [48]. Zhang et al. employed the 1DCNN to dynamically acquire the features emanating from the vibration signals of bearings, which aptly diagnosed the faults and surpassed other techniques [27]. Zou et al. designed an anti-noise 1DCNN model to directly work on time-domain signals and automatically extract features from the background noise, and it showed excellent performance on a bearing dataset under different conditions [49]. Chang et al. improved a 1DCNN-based decoupled network to extract the features of frequency spectra converted by FFT, which can effectively obtain high-level information about gearboxes [50]. Lu et al. designed an explainable 1DCNN based on the demodulated frequency features for diagnosis under time-varying speed conditions [51]. Nevertheless, current deep learning paradigms predominantly focus on single-modal data analysis, despite the inherent coexistence of multimodal data in real industrial settings. Crucially, the cross-modal complementary information embedded in these data remains underutilized yet proves critical for enhancing diagnostic precision through synergistic feature fusion.
Recent advancements have witnessed the integration of multimodal learning frameworks into fault diagnosis, aiming to enhance diagnostic accuracy through the joint representation learning of multiple modalities. For instance, Qin et al. developed a two-branch CNN for fault pattern recognition with unbalanced conditions, extracting frequency features and time–frequency features through frequency-domain signal processing, respectively [34]. Ke et al. proposed a multimodal fusion model using time-series and SST-based images, which significantly enhances fault identification accuracy by leveraging the synergies between different modalities [32]. Ma et al. developed a multimodal CNN framework leveraging multiple forms of signal conversion, showing superior diagnostic accuracy over traditional methods [35]. Cheng et al. pioneered the application of few-shot learning paradigms to multimodal fault diagnosis in bearings, combining time and time–frequency data to improve diagnostic accuracy, which showcased substantial advancements in handling unbalanced and sparse data scenarios [36]. However, existing methods predominantly assume that machinery operates under stationary conditions, failing to address the nonstationarity induced by real-world variable operating conditions, which significantly limits their practical effectiveness. This context necessitates the exploration of a multimodal fault diagnosis approach capable of adapting to varying working conditions.
3. The Proposed Method
3.1. The Overall Framework
The accurate and timely fault identification of mechanical equipment is critical for enhancing operational safety while achieving substantial reductions in maintenance expenditures. Deep learning has established itself as a transformative paradigm for automated fault feature extraction and pattern recognition in complex systems. However, the existing fault diagnosis methods do not explore the complementary relationship, such as commonality and differentiation, between different data representations. In addition, signals are often nonstationary due to variable working conditions. In this paper, a multimodal fault diagnosis method named DAMFM-MD is proposed, whose overall framework is illustrated in Figure 1.
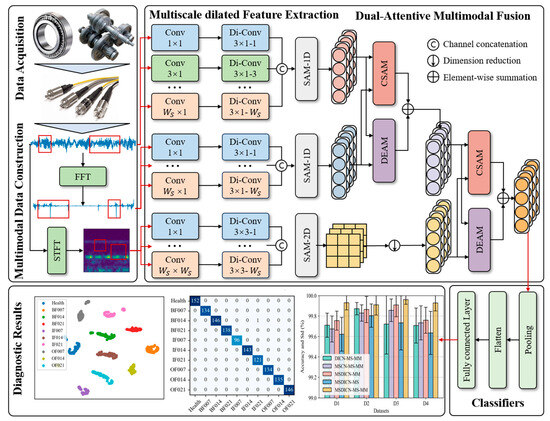
Figure 1.
The framework of the DAMFM-MD.
- (1)
- Data acquisition: Physical sensors are used to collect time-series samples describing the operating status of mechanical components over a continuous period.
- (2)
- Multimodal data construction: FFT and STFT convert time-domain signals to the frequency domain and time–frequency domain, respectively. This helps to construct multimodal data with robustness.
- (3)
- Multiscale dilated feature extraction: A three-branch MDCN is specifically designed to extract hierarchical fault representations from multimodal data at multiple scales. Scale-wise attention is implemented for adaptive selection.
- (4)
- Dual-attentive multimodal fusion: The features of multimodal data are first dimensionally aligned. The processed features are then fed into the DAMFM, which performs weighted multimodal fusion based on dynamic contribution predictions. This adaptive fusion mechanism explicitly models both intrinsic commonality and difference, followed by a classifier for final fault categorization.
3.2. Data Acquisition
With the widespread use of sensor technology, sensors are installed in various locations of the mechanical components, like rolling bearings or gearboxes, to collect operational status information. These sensors record specific values at a certain sampling frequency, and the recorded data are transferred via a transport protocol to be stored in industrial databases. Usually, to be used for model training, the state types of the data samples are manually labeled by the operators.
3.3. Multimodal Data Construction
The diagnostic process that uses the time-domain signals directly is a popular idea. However, industrial processes are usually complex, and a feature fusion approach considering only single-modal data cannot fully represent the industrial processes, leading to low robustness and generalization capability [35,52]. This study utilizes the FFT and STFT to convert the time-domain signals into frequency-domain and time–frequency domain representations, respectively, and the preprocessed data containing information in multiple perspectives are combined in parallel with the original signals to construct homologous multimodal data.
Firstly, the original time sequences are restructured according to the number of sensors. Given N monitoring instances , which contain p data points collected by C sensors, the values of C can be one or more than one according to the datasets, and represents the actual label of the nth instance. Then, frequency-domain signals and time–frequency domain signals are mapped by FFT and STFT for each sensor signal in each instance, where Q, H, and L are the obtained data dimensions. FFT is an efficient Fourier transform method for frequency analysis, while STFT is effective for converting discrete-time signals in the time–frequency domain.
To achieve integrated analysis, it is necessary to combine multimodal data through a parallel arrangement. This strategy of constructing multimodal data from homologous signals simultaneously can strengthen the robustness of input data and provide a basis for subsequent diagnostic modeling; thus, the dataset can be represented as , where the nth instance consists of three different modalities of data.
3.4. Multiscale Dilated Feature Extraction
Feature extraction is crucial for mining information from multimodal data. The CNN, as an intelligent perception algorithm, has shown exceptional performance in dealing with complex and nonlinear industrial data. The convolution kernel slides over the entire dataset in a consistent manner, capturing the representative features dynamically in local areas. The pooling layer provides maximum and average pooling operations to compress the parameter space and reduce model complexity. Both the 1DCNN and 2DCNN have been employed in fault diagnosis. However, industrial processes usually suffer from non-ideal factors like varying loads, fluctuating speeds, and fault types; thus, the fault features of signals are distributed on multiple scales. Moreover, the CNN can only obtain a single-scale receptive field during each convolutional operation, which weakens the comprehensive analysis of industrial data [53]. To address this problem, this paper proposes the MDCN. The module comprises two main stages, with a multiscale CNN being used for the input data, followed by the dilation convolution to obtain different receptive fields. Compared with a traditional CNN, dilated convolutions can achieve a larger receptive field with the same number of parameters and computational cost through a sparse sampling strategy. This reduces the number of layers or kernel sizes required to achieve the same receptive field, thereby significantly lowering the complexity of deep networks and the risk of overfitting. Then, the attention and one-layer convolution are utilized for scale-wise fusion and channel adjustment.
Firstly, the multimodal data are utilized as input. Considering the difference between inputs, a three-branch strategy is proposed, whose calculation process is as follows:
where denotes the feature maps of the ith modality output from the ith branch through the corresponding calculation . It is worth noting that is divided into two categories, and , with the same logical but different dimensional structures, respectively, due to the identities of different inputs. The subsequent descriptions mainly focus on the logical implementation, without distinguishing the dimensional structures of the 1D and 2D processes.
To consider the local and global features of the input , S independent branches utilizing convolutional operations with corresponding kernel widths are constructed, where , taking advantage of the parallelizable computing capability of the CNN. For each branch, the CNN is used with a parallel-arranged kernel to filter multiscale features. Then, dilation convolution is introduced with a fixed parameter number but varying dilation rate, the value of which is the same as that of W, to obtain different feature receptive fields. Combined with multiscale convolution as shown in Figure 2, the intention is to enable large kernels to perceive features in a more macroscopic view, while small ones focus locally. The process for each branch is determined as
where denotes the convolution operation. Is the kernel weight of the sth scale, while represents the dilated kernel with different . And is the bias of each process. is the nonlinear activation function. Then, each scale feature map of the ith modality is stacked to obtain , which comprises K feature channels due to the use of kernels per scale. However, a simple concatenation scheme easily neglects valuable information; thus, a more sophisticated approach is required to consider the importance of scales.
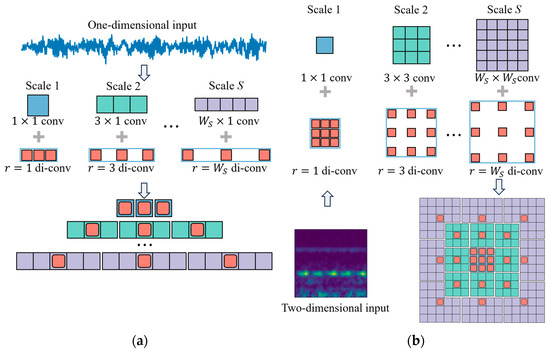
Figure 2.
The structure of a multiscale dilated CNN; (a) 1D structure; (b) 2D structure.
Secondly, since the output contains distinct levels of abstract features with different contributions to fault prediction, the SAM is designed to highlight informative features and suppress redundant ones. The SAM is presented in Figure 3, which encompasses a global average pooling (GAP) layer along with two fully connected layers. Take the SAM-1D as an example, the pooling process compresses the ith modality feature maps into a channel descriptor. The fully connected layers can selectively generate weights for each channel during the model training. Afterward, the weights are accurately assigned to the initial input feature maps through channel-wise multiplication. The procedure is detailed as follows:
where L is the spatial length of feature maps . and denote the two fully connected operations, and the reduction rate in this paper is set to 4, which aims to balance the model complexity and performance. and denote the activation function, referring to the tanh function and sigmoid function, respectively.
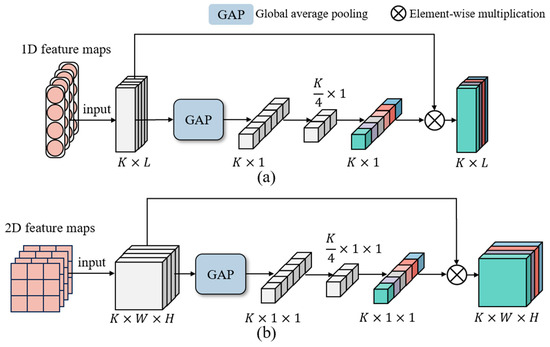
Figure 3.
The structure of the SAM. (a) SAM-1D. (b) SAM-2D.
Subsequently, to extract deeper features and simultaneously obtain compatible feature dimensions for modal fusion, the weighted outputs are implemented once again in a convolutional operation. After the above steps, the output feature maps are extracted from each branch, representing the three different domain features of the original signals.
3.5. Dual-Attentive Multimodal Fusion
Multimodal feature maps obtained from the above modules describe diverse fault patterns, albeit from different perspectives and presentations of feature mapping. Thus, they are intrinsically interrelated, and more comprehensive performance can be achieved when analyzing one modality with reference to the others. However, the feature extraction of the three modalities is conducted independently and non-interactively, and simple fusion strategies at the last layer, such as concatenation and summation, overlook the complementary information [54,55]. To clarify the intrinsic correlation of fault features, a multimodal fusion method, the DAMFM, is proposed in this paper. It considers the commonalities and differences between the feature representations of time, frequency, and time–frequency domains. As shown in Figure 4, the process of the method is to fuse two of the modalities first and then fuse them with the other one using dual attention consisting of the CSAM and DEAM. The proposed CSAM and DEAM modules can adaptively learn the importance of fault information from different modalities during the modal fusion process. Through the attention mechanism, they enhance the fusion efficiency of multimodal fault information and weaken redundant fault information. The detailed process is explained as follows.
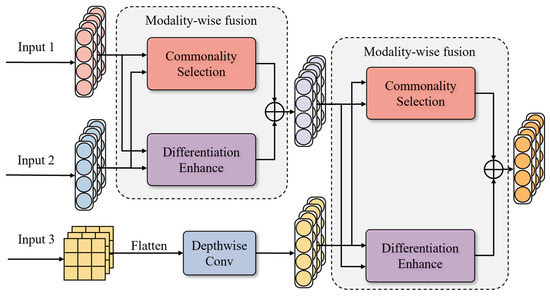
Figure 4.
The details of the DAMFM.
Firstly, the diagnostic accuracy of each single-modal dataset is calculated, and the higher the accuracy, the more it contributes to the prediction. Thus, this work implements sequential modality fusion weighted by ascending fault-prediction importance. Usually, time–frequency features are fused at a later stage due to their diverse information representation and complex dimensional structure, which can provide richer fault information for feature mining.
Then, to eliminate the dimensional difference between the inputs , , and , dimensional alignment is implemented. Extending 1D features to higher dimensions tends to sparsify key features; thus, 2D features require dimensional compression before performing fusion [56]. This method flattens the two-dimensional space for each channel and passes it through a depth-wise convolution, and the dimensionality reduction process is shown below:
where denotes the convolution kernel dimension in the kth channel, calculated by subtracting the higher feature dimension from the lower one.
The CSAM leverages common features between any two modalities, which are represented as and subsequently, and then selectively filters redundant information, as illustrated in Figure 5. The feature maps are obtained by element-wise addition. To comprehensively learn effective identities, on the one hand, GAP is utilized to compress the dimensional space and generate a global channel descriptor, and full connection operations aim to adaptively learn channel-level features. On the other hand, overemphasizing the importance of channels tends to suppress the contribution of some specific positional feature points; thus, point-wise convolution is utilized to aggregate channels and highlight informative positions. Then, the element-wise addition implements the interaction of two branches, and the sigmoid function outputs with and distinguish and select the weights for the corresponding modality. Finally, the feature weights are assigned to the input by element-wise multiplication and added to form complementary features with commonality . The detailed procedure can be formulated as
where L is the space size of each channel. refers to two full connection operations. and denote the point-wise convolution process for channel compression and recovery, respectively. denotes the sigmoid function, which generates two weight vectors considering and . In this study, the one-dimensional channel weights are broadcast to form the two-dimensional weights, which are then added to the positional weights. denotes a unit matrix of the same dimension as .
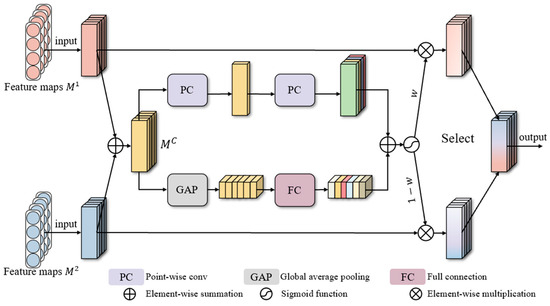
Figure 5.
The details of the CSAM.
The DEAM aims to emphasize the hidden informative features through specialization characteristics between the two modalities, as shown in Figure 6. Firstly, parameter subtraction is employed to remove common features and retain differences, and then dual-branch weight-computing operations are employed to obtain global representations from multiple views. Next, weight vectors generated via sigmoid activation perform the channel-wise scaling of input representations, resulting in the difference-selected feature maps. Finally, residual learning is introduced in the block to effectively combine the processed features with the initial ones, outputting differentially enhanced feature maps . This approach prevents the loss of informative features when utilizing weighted features directly. Therefore, the block is improved significantly with the residual enhancement. The calculation procedure can be concisely expressed as follows:
where is the differential feature map. The weights are calculated in the same way as above, with common attention. And represents the sigmoid function, which outputs the learned weight vector for both inputs.
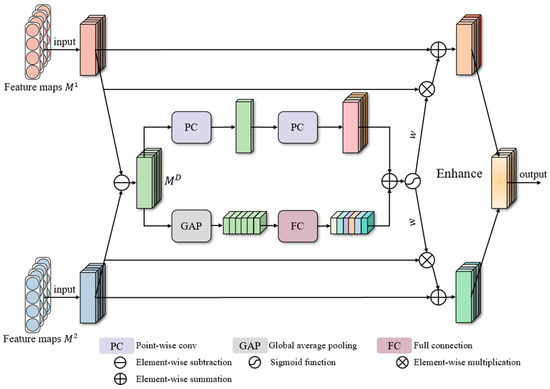
Figure 6.
The structure of the DEAM.
Then, the differential features and the common features are summed to obtain integrated features . To sum up, the DAMFM effectively enhances differential features and simultaneously selects common features, making the whole fusion more comprehensive and reliable. Since the method contains three modalities, two-stage fusions are implemented based on modal importance. Finally, the feature is fed to a classifier consisting of fully connected layers to achieve fault classification.
For model training, the DAMFM-MD framework employs cross-entropy loss as its primary optimization objective:
where and represent the predicted and actual label of the tth training sample in the oth category, respectively.
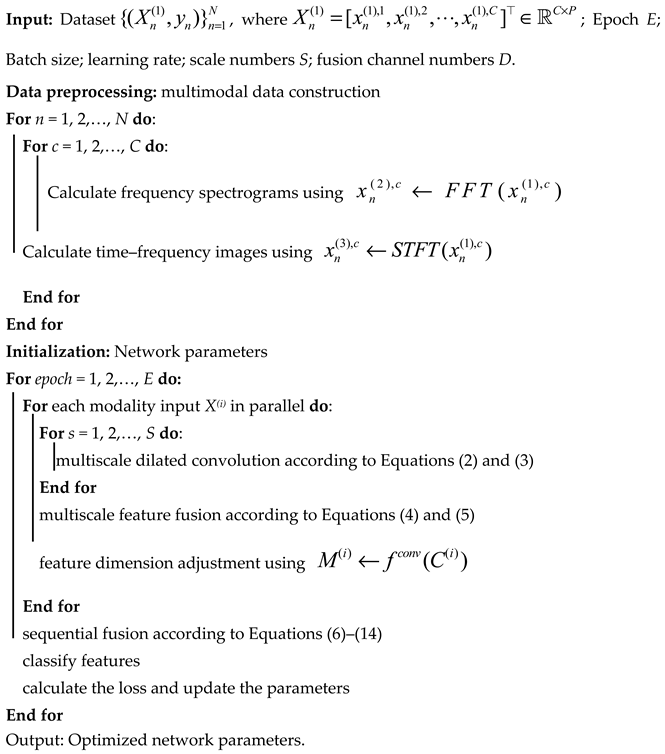
The pseudocode is listed in Algorithm 1.
| Algorithm 1: Pseudocode of the proposed method |
 |
4. Experiment Setup
4.1. Experimental Dataset
In this paper, to verify the performance of the proposed DAMFM-MD, relevant experiments were conducted on two experimental datasets of Case Western Reserve University (CWRU) and Southeast University (SEU), including gearbox and bearing cases. Specifically, data collected from different devices were divided into different sub-datasets for independent experiments. Meanwhile, when splitting the test set for each sub-dataset, the samples were not randomly selected. Instead, the samples in the training and test sets were from different working conditions, thus avoiding the possibility of the model matching similar samples.
4.1.1. Case Western Reserve University Datasets
The CWRU Bearing Data Center test rig simulated the actual operation of a bearing system as shown in Figure 7. Our experiment focused on the signals collected by vibration sensors under different sampling frequencies and motor loads from the drive end and fan end bearings, respectively, and are divided into two sub-datasets, D1 and D2. Specifically, as shown in Table 1, they describe the vibration states of the bearings at 12k and 48k sampling frequencies, respectively, and each dataset contains four working conditions. The health status is categorized into Health, Outer Ring Failure (OF), Inner Ring Failure (IF), and Ball Failure (BF), and for each of these failure statuses, there are three damage levels, 7/14/21 mils. In particular, the CWRU dataset-based fault diagnosis constitutes a ten-category classification problem. At each sampling frequency, it provides a set of signals for a long-term time period under each fault–condition pair. The length 1024 is selected to intercept each signal sample and combine samples of the same fault type, with about 450 single-channel samples in each group.
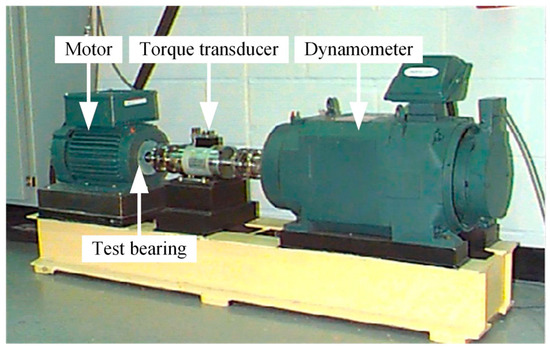
Figure 7.
Test rig of the CWRU dataset.

Table 1.
Specific descriptions of the four datasets.
4.1.2. Southeast University Datasets
The SEU case utilized two sub-datasets, gearbox data and bearing data, collected from the drivetrain dynamic simulator (DDS), as shown in Figure 8. The sampling process involved two operating conditions with different speed–load configurations, specifically 20 HZ-0V and 30 HZ-2V [57]. Gearboxes (D3) and bearings (D4) each had five fault categories, consisting of four fault states and one health state. Table 1 shows the specific categories. Consequently, the SEU dataset enables a five-class fault diagnosis classification task. Each fault category in both sub-datasets comprised 1022 samples, resulting in a total of 5110 samples. Take the gearbox dataset as an example, the sampling process involved eight cooperative sensors, including motor vibration, motor torque, and vibration in three directions of the planetary gearbox and parallel gearbox, respectively. In addition, the 2048 data points collected from the eight sensors were combined in parallel to form a multisensor representation for each sample.
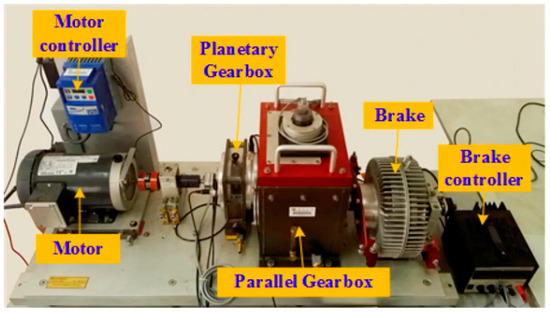
Figure 8.
DDS of SEU dataset.
4.1.3. Multimodal Dataset Construction
To construct the multimodal data, FFT and STFT were used to convert various types of original signals to frequency spectrograms and time–frequency images, respectively. The resulting constructed data correspond with and are reflective of the original samples. For FFT in each of these experiments, the size of the data points obtained is aligned with the original time-domain signal. For STFT, we set the window length to 64; thus, 1D signals were transformed to length–width sizes of 33 × 33 and 33 × 65 for different datasets. The original signals were then combined in parallel with the time–frequency images to create multimodal data. To illustrate this process, Figure 9 and Figure 10 demonstrate the one-to-one correspondence of time-domain, frequency-domain, and time–frequency domain data under four datasets.
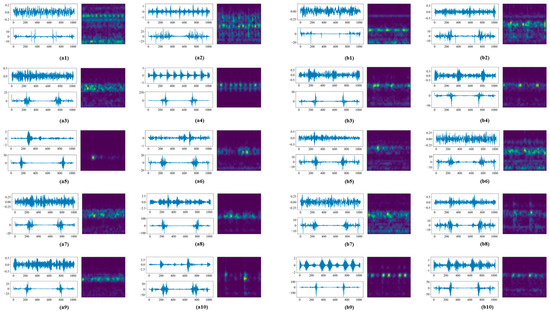
Figure 9.
Multimodal data for different fault types under the D1 and D2 datasets. (a) D1 (b) D2.
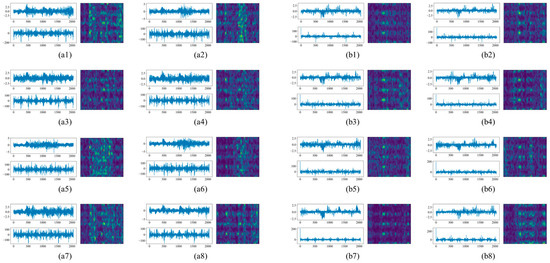
Figure 10.
Multimodal data for different sensors. (a) D3; (b) D4.
4.2. Experimental Procedure
To ensure rigorous evaluation, vibration samples were partitioned into 70% training and 30% testing sets. The batch size and training rounds were set to 64 and 200, respectively. To prevent model overfitting, the early stopping strategy was implemented with a stopping value of 10. Moreover, to minimize the effects of randomness, the random seeds were applied, and ten repetitions of the experiments were conducted. The average value of the repeated experiments was calculated, and the standard deviation was reported to estimate the method’s stability. The Adam optimizer governed gradient backpropagation during parameter updates. All experiments were conducted using Python 3.8 with Pytorch 1.11.0, Xeon-E5-2620 CPU, and NVIDIA-Tesla-K80 GPU. The original manufacturers are Intel and NVIDIA, based in Santa Clara, CA, United States.
To highlight the superiority of the proposed DAMFM-MD, several classical and state-of-the-art approaches were selected for comparison:
- (1)
- WDCNN [58]: The WDCNN employs five convolutional layers, where the first convolution kernel is larger.
- (2)
- ResCNN [59]: The ResCNN consists of an alternating combination of common three-layer convolutional layers and two-layer residual blocks.
- (3)
- Densenet: The Densenet module concatenates the output of each convolutional layer, and the overall network replaces the above residual blocks with dense blocks.
- (4)
- MCNN-LSTM [60]: The MCNN-LSTM utilizes two convolutional channels with distinct feature extraction scales and combines a two-layer LSTM.
- (5)
- MK-ResCNN [61]: The MK-ResCNN combines multiscale feature extraction and residual concatenation to eliminate the adverse effects of fluctuating speed.
- (6)
- DSRN [62]: The DSRN introduces attention mechanisms into convolutional structures for superior fitness to noisy environments.
- (7)
- MMF-CNN [31]: The MMF-CNN realized the feature fusion of multimodal data for time and time–frequency domains to realize multifaceted information mining.
Moreover, take the D1 dataset as an example, Table 2 lists the specific parameter settings of the proposed DAMFM-MD.

Table 2.
Parameter settings of the DAMFM-MD.
5. Results and Discussion
5.1. Results
The summary of the fault classification performance of the proposed DAMFM-MD and the comparison methods is reported in Table 3, listing the mean and standard deviation of the accuracy and F1-score. The best result is denoted in bold, identifying its performance in the subsequent tables.

Table 3.
The evaluation metrics of different methods under four datasets.
As shown in Table 3, the DAMFM-MD outperforms the other comparison methods, achieving an accuracy of over 99.94% on four datasets. Firstly, it was observed that the CNN exhibits mature fault diagnostic performance, and although the WDCNN had the lowest results, it still provided over 98% accuracy and an F1-score with the four datasets. Secondly, multiscale methods perform better compared to the methods that use a single-scale CNN when the input form is the same. Take the D2 dataset as an example, the accuracy of the MK-ResCNN reached 99.62%, higher than that of the ResCNN (98.92%), due to the richer information obtained by conducting a multiscale strategy. Thirdly, as a single-scale method, the performance of the RDSN in fault classification outperforms that of the WDCNN, ResCNN, and Densenet. For instance, the accuracy of the RDSN is 99.72%, which is higher than that of the other three methods. This suggests that attention can adaptively emphasize important information to improve model performance. Fourthly, multimodal data are pivotal to improving diagnostic capabilities. For example, in the D1 dataset, the accuracy and F1-score of the MFF-CNN are 99.84% and 99.83%, respectively; all the single-modal-based methods are below this level. Finally, the proposed DAMFM-MD exhibits the highest accuracy rate and F1-score and minimal standard deviation, indicating excellent fault-prediction performance and stability. This is primarily because the proposed method adopts multimodal data as the input form and fully considers their intrinsic correlation and multiscale feature extraction. On the one hand, multimodal data contain fault information from different perspectives, complementing each other and excavating for complementary information. On the other hand, the multiscale information of the input data is comprehensively considered to ensure that the method better adjusts to the variable working conditions.
In addition, the recall of each method is shown in Figure 11. The proposed method outperforms other approaches in terms of recall on all four sub-datasets, achieving 99.92%, 99.91%, 99.95%, and 99.93%, respectively. This finding, in conjunction with the results of other metrics presented in Table 3, collectively corroborates the effectiveness of the proposed method in fault diagnosis tasks.

Figure 11.
Recall of different methods under four datasets. (a) D1; (b)D2; (c) D3; (d) D4.
Confusion matrices were utilized to visualize the fault classification effectiveness of the DAMFM-MD, providing a detailed analysis of the classification accuracy for each status category. Figure 12 showcases the true and predicted labels of each fault status under four datasets. The numbers on the diagonal line represent the predictive accuracy for each state category. The confusion matrix shown in Figure 12 indicates excellent categorization capabilities of the proposed DAMFM-MD, and the misclassification probability is almost zero. For example, 1345 test samples in the D1 dataset misclassified just one BF014 category as IF021.

Figure 12.
Confusion matrix of the DAMFM-MD under four datasets. (a) D1; (b)D2; (c) D3; (d) D4.
To comprehensively evaluate the performance of the proposed method in fault diagnosis tasks, we report the average response time per sample and average memory usage per sample of each method on different datasets in Table 4. As shown in Table 4, compared with methods using a traditional CNN such as the MCNN-LSTM and MK-ResCNN, the proposed DAMFM-MD demonstrates a faster response time and significantly superior memory efficiency. This is because the dilated convolution operations in the proposed framework enable efficient multiscale fault feature extraction. With the same number of parameters, dilated convolutions can cover a larger input range, reducing the computational burden for processing high-dimensional sensor data.

Table 4.
Response time and memory usage of each method on different datasets.
5.2. Discussion
5.2.1. Evaluation of Noise Scenario
Although the proposed DAMFM-MD has achieved significant fault diagnosis effectiveness on four datasets, a number of comparative methods have also exhibited more than 99% fault diagnosis accuracy, and the superiority is not remarkable. In real industrial systems, influenced by complex environmental factors, the signals collected by sensors are mixed with noise interference.
To verify the superiority and robustness of the proposed DAMFM-MD better, this experiment constructs data under nine different Gaussian white noise environments, and the signal-to-noise ratio (SNR) increases from −10 to 6 in orders of two, respectively, which is defined as follows:
where and denote the signal and noise power, respectively. The influence of noise on the different comparison methods is shown in Figure 13.

Figure 13.
Results for noisy environments under four datasets. (a) D1; (b) D2; (c) D3; (d) D4.
Figure 13 illustrates how the different methods perform in the presence of noise under the four datasets. Firstly, for all methods, the decrease in the SNR value substantially increases the difficulty of diagnosis, which is due to the noise blurring the representation of critical fault features. Secondly, the methods introducing multiscale, attention, or multimodal data performed relatively well in noisy environments; for example, the curves of the MCNN-LSTM, MK-ResCNN, DRSN, and MMF-CNN are higher than those of other simple CNN methods in the D1 dataset, which illustrates the ability of the abovementioned strategies to raise accuracy. Finally, the proposed DAMFM-MD shows good noise adaptation in all four datasets, with −10snr accuracy exceeding 90% in the D1 dataset, and even 95% in −8 to 6. This is mainly due to the fact that the complementary multimodal information has been fused by the dual-attentive fusion strategy. Meanwhile, the feature extraction of several different receptive fields increases the robustness of the method.
5.2.2. Evaluation of Multimodal Fusion Strategy
Comparative experimental validation was performed to demonstrate the advantages of our multimodal fusion approach. We compared the performance of the single-modal method and the multimodal method based on different sequential fusion strategies. For single modality, multiscale feature extraction based on the optimized parameter case of the proposed method is applied using the data of the time domain (T-MSCN), frequency domain (F-MSCN), and time–frequency domain (TF-MSCN), respectively. For the multimodal method, the priorities of fusion are different, which are time-domain (M-MSCN-T) after, frequency-domain (M-MSCN-F) after, and time–frequency domain (M-MSCN-TF) after, respectively. Table 5 shows the results of the experiments under each dataset, with the single-modal and multimodal best cases bolded.

Table 5.
The results based on single-modal and multimodal data.
Firstly, the methods based on multimodal fusion outperform the single-modal methods; taking D1 as an example, the accuracies of the former all exceed 99.60%, while the latter are lower than 99.40%. This is mainly due to the approach that considers multimodal data, which describes the operating conditions of the rotating machinery from different perspectives and is complementary. Secondly, the higher the single diagnostic accuracy of the modalities, the later they are fused for optimal results under the four datasets, which indicates that the most contributive modality retains the diagnostic deterministic features better when positioned last. Moreover, according to the dataset characteristics, the importance of data in different domains is ranked differently. For example, in D1, D3, and D4, the time–frequency domain-based methods are the most effective, while using the frequency-domain data is the best in D2. In addition, the premature fusion of informative modality possibly contributes to overfitting of the model; for example, M-MSCN-F is less accurate than TF-MSCN in D3. It is worth noting that M-MSCN-TF achieves the best performance on three datasets. This may be because the time domain and frequency domain, both as 1D modal data, are first fused at an early stage and then combined with 2D time–frequency domain images, which can maximize the fusion efficiency.
5.2.3. Visualization of Feature Extraction
To better validate the superiority of multimodal fusion, the t-distributed stochastic neighbor embedding (t-NSE) [63] is employed to map high-dimensional features to a 2D space for the visualization of features generated by the DAMFM-MD and structurally invariant single-modal approaches, which is shown in Figure 14. In each sub-fig., from left to right, the effectiveness of feature extraction is shown for the original signals, the time domain-based, frequency domain-based, time–frequency domain-based, and multimodal-based methods.
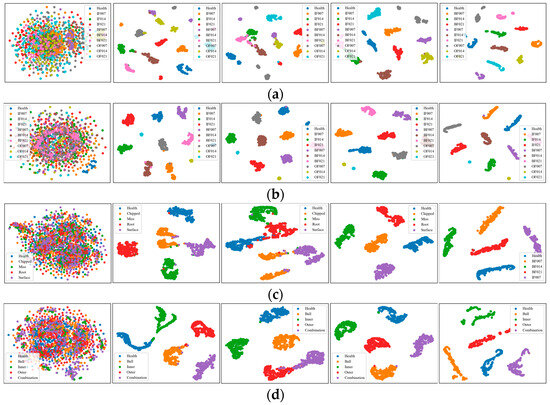
Figure 14.
Feature extraction visualization by t-SNE. (a) D1. (b) D2. (c) D3. (d) D4.
As shown in Figure 14, firstly, the global feature points of the same type transition from mixed to aggregated in each method, demonstrating the diagnostic capability of each method. Secondly, in datasets D1, D3, and D4, time-domain and frequency-domain methods roughly distinguish fault types, while the approach based on the time–frequency domain shows no distinct tendency for aggregation. Unlike in dataset D2, the time–frequency domain is not as dominant, which implies that the importance of different modal data is influenced by the dataset. Third, the proposed method better mines the key features; for instance, in the D1 dataset, the proposed method efficiently distinguishes all ten categories, whereas in the single-modal method, the fault categories, such as BF014, BF021, and IF014, are confounded to varying degrees. The visualization results point out that the DAMFM-MD has remarkable feature extraction capability, primarily due to the complementary features of different modalities. Different modalities provide their own valuable information, which can be complementarily adapted to complex industrial environments
5.2.4. Evaluation of Ablation Study
Ablation experiments were implemented on each dataset to demonstrate the contribution of the key components to fault classification performance. Figure 15 shows the performance of the comparison methods. The methods include the DICN-MS-MM, MSCN-MS-MM, MSDICN-MM, and MSDICN-MS, which remove multiple kernels, dilation convolution, multiscale fusion attention, and multimodal fusion attention, respectively, and the proposed MSDICN-MS-MM.
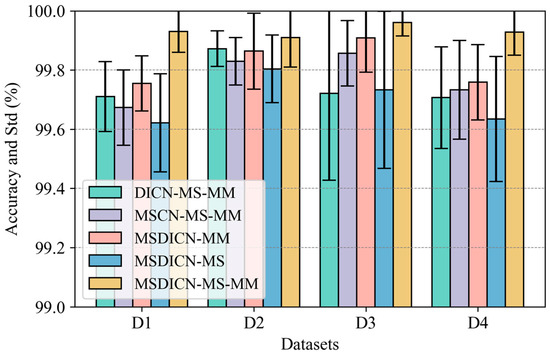
Figure 15.
The accuracy and std (%) of the ablation study.
As shown in Figure 15, firstly, the ablation experiments revealed that removing any of the key components decreases fault classification accuracy, which illustrates that all components can contribute to fault prediction. Secondly, comparing multiscale convolution and dilation convolution, the method lacking dilation convolution under the D1 and D2 datasets suffers more accuracy degradation, while multiscale convolution impacts the D3 and D4 datasets more, which proves that the combination of two convolutions for multiple receptive field feature extraction incorporates the advantages of both better to fit different industrial situations. Thirdly, the method without dual-attentive multimodal fusion exhibits the poorest fault classification performance. For instance, when tested on the D1, D2, and D4 datasets, the average accuracy of the MSDICN-MS was reduced from 99.93%, 99.91%, and 99.93% to 99.62%, 99.80%, and 99.63%, respectively, indicating the effectiveness of the fusion strategy, which better focuses on complementary multimodal fault information. The experimental results indicate that the multimodal feature fusion comprehensively accounts for the commonalities and differences in the feature maps between multimodal data, which significantly influences the fault classification performance of the DAMFM-MD.
Table 6 reports the t-statistic value of different ablation models. Specifically, *** represents a confidence level of 99.5%, while ** indicates a confidence level of 95%. It can be observed that the MSDICN-MS model shows the strongest significance on the three datasets, which also indicates the importance of the multimodal component. The reason why this component has the most significant impact on the proposed method is that multimodal signals contain more comprehensive and multifaceted fault information, which is crucial for the accurate identification of fault patterns. This is also the greatest hypothesis of the proposed framework. As a method designed for multimodal signals, the DAMFM-MD includes multimodal feature extraction and a specially designed modal fusion mechanism. The removal of multimodal components will lead to the failure of these mechanisms.

Table 6.
Significance of t-tests of different ablation models.
5.2.5. Visualization of Attention Mechanism
The SAM in the DAMFM-MD is designed to fuse the extracted multiscale features adaptively based on their respective contribution to fault prediction. To assess the effectiveness of attention in the DAMFM-MD, we randomly selected six samples from the D1 dataset. As shown in Figure 16, these figures illustrate the activating effects of the SAM. The rows in these figures correspond to the sth sample, while the columns refer to the nth channel index. Each pixel denotes the weight of the sample for the corresponding channel, where a light-yellow pixel signifies features that are more critical for fault prediction, and dark-blue ones represent less important features.

Figure 16.
Scale-wise attention weights of ten samples in the DAMFM-MD. (a) Time domain. (b) Frequency domain. (c) Time–frequency domain.
As shown in Figure 16, the multiscale dilated convolution of each scale provides discriminative information. Take Figure 16a as an instance, the activated weight of the eighth channel in the first to fifth samples is around 0.70, which is higher than that of other channels. The weights of useless channels like the 5th, 10th, and 18th channel are less than 0.40. In addition, the attention mechanism incentivizes each channel features to a similar degree.
Moreover, multimodal data contain fault information from operating processes but are represented differently; thus, MCA is developed for multimodal fusion, comprising the CSAM and DEAM. To better evaluate the effectiveness of attentive fusion that comprehensively considers both channel and positional features, Figure 17 illustrates the activation heat map for a sample in the D1 dataset, where the n-p value is the weight of the pth position on the nth channel. Since the selection on the commonality of the two modalities is complementary, namely, the weights add up to 1, only the weights of the first feature maps are shown.
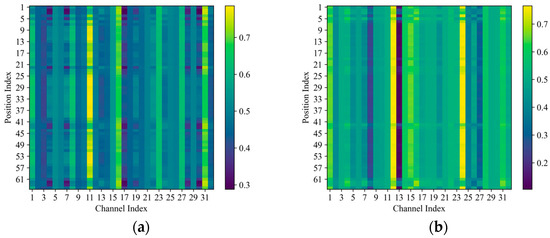
Figure 17.
Modality-wise co-attention weights of ten samples in the DAMFM-MD. (a) CSAM. (b) DEAM.
As depicted in Figure 17, both commonalities and differences between modalities affect the fusion performance of modality-wise attention. The visualization of the selective weights of the image features in Figure 17 demonstrates that a strategy of channel and position combinations can achieve outstanding adaptive fusion. For example, in the CSAM, the 11th channel weight is stimulated to about 0.8, which is weakened at position 22 due to the simultaneous consideration of feature positions. In Figure 16a, there are a few light-yellow pixels as well as dark-blue ones, which illustrate that the selective complementation of commonality features is achieved between modalities. In differentiation enhance attention, it is evident that most of the weights are activated over 0.5, which means that differences are prevalent between modalities, and they are enhanced for more accurate diagnosis.
In conclusion, the visualizations demonstrate that the attention mechanism can be used to achieve informative feature fusion for both scale-wise and modality-wise information. Moreover, owing to the model’s effective training, there are minimal differences in the overall activating effect distribution between samples. This indicates that the attention mechanism can achieve adaptive fusion according to the importance of features.
5.2.6. Evaluation of Parameters
Since the input data contain nonstationary characteristics, the DAMFM-MD adopts multiscale convolutional kernels to achieve optimal feature extraction. Moreover, the feature output of each modality affects the complementary fusion. To evaluate the impact of the model structure, specifically, the number of scales and output feature channels, on fault classification performance, the experiments compare different parameter configurations across four datasets, as visualized in Figure 18a–d. The proposed method is evaluated with scale numbers ranging from two to six, while the numbers of the output channels are set to 8, 16, 32, and 64, respectively.
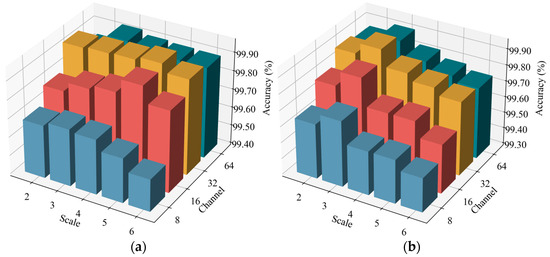
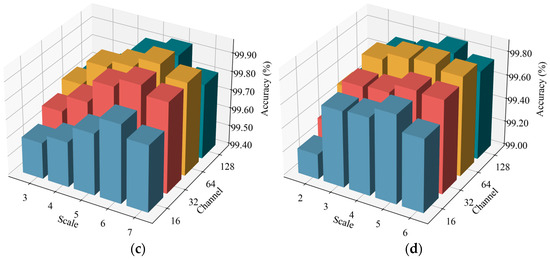
Figure 18.
Results of the DAMFM-MD with different parameters. (a) D1. (b) D2. (c) D3. (d) D4.
Figure 18 demonstrates that the optimal scale–channel settings of the proposed DAMFM-MD under four datasets are 5-32, 3-32, 6-64, and 5-64, respectively. Firstly, when more scales are introduced, the metrics of the method progressively grow. For example, Figure 17a demonstrates that the model’s mean accuracy progressively improves when increasing the number of scales from two to five, especially in channel 32, reaching a peak of 99.96%. This indicates that the application of convolutional kernels with different sizes facilitates multiscale representation learning and reduces nonstationarity-induced artifacts, and a higher scale count leads to significant improvement in the feature extraction ability and stability of the DAMFM-MD. Secondly, the results in all four datasets turned out to be superior as the number of channels increased, which means that a more optimal number of channels stimulates a fuller multimodal information fusion. However, as the variables for both scales and channels increase to a certain level, a downward trend in accuracy is observed. The accuracy of the method is 99.72% at a 6-scale with a 64-channel in dataset D1, which is below that of the 5-scale with a 64-channel, and the 6-scale with a 32-channel, possibly due to the overfitting phenomenon caused by increased model complexity.
Moreover, we conducted a sensitivity analysis on the number of fully connected layers in the core fusion components, the CSAM and DEAM attention modules. The accuracy under different parameter settings is presented in Figure 19.
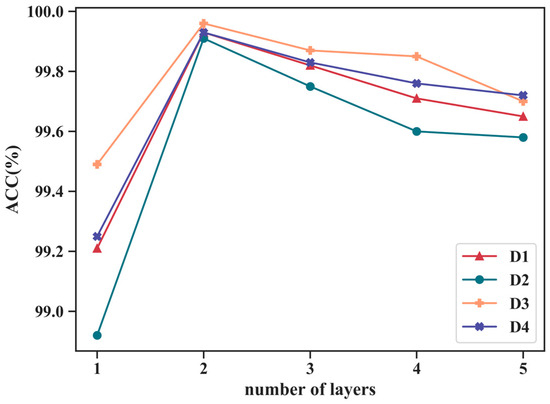
Figure 19.
Parameter sensitivity analysis for different numbers of layers.
As shown in Figure 19, first, the two-layer bottleneck structure of fully connected layers achieves the best results. This benefits from the structure’s ability to efficiently model interdependencies between channels and its strong nonlinear representation capability. Second, the diagnostic accuracy of the proposed method declines when the number of fully connected layers is set to one or is excessively large. This could be because a single fully connected layer, performing only simple linear transformations, struggles to capture complex interdependencies between channels. Conversely, an excessive number of layers increases the risk of overfitting, particularly as the number of modalities grows.
5.2.7. Evaluation of Dilation
To further validate the effectiveness of dilated convolution operations in fault diagnosis tasks, we have additionally organized a comparative experiment using dilated convolution and a CNN without dilation. The accuracy, F-score, and response time of different methods under datasets D1 and D3 are shown in Figure 20.
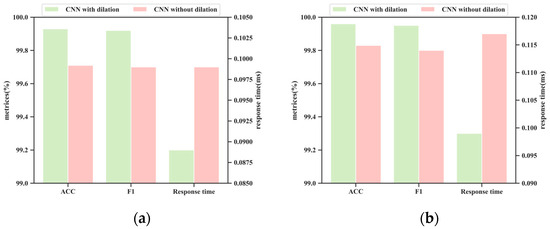
Figure 20.
Performance of the CNN with and without dilation under different datasets. (a) D1; (b) D3.
As shown in Figure 20, the method using dilated convolution achieves better performance and has an advantage in response time compared to the traditional CNN method without dilated operations in fault diagnosis tasks. The reason is that dilated operations can directly expand the receptive field by adjusting the dilation rate without down-sampling, thereby capturing long-range dependencies while maintaining high resolution, which is particularly important for nonstationary signals. At the same time, compared with traditional methods, dilated convolution can significantly reduce computational complexity, thus requiring a shorter response time.
6. Conclusions and Future Directions
This paper presents a novel CNN-based multimodal fusion architecture for diagnosing faults in rotating machinery. The proposed approach aims to realize the multimodal information fusion of the extracted fault features from nonstationary signals. It combines time-domain signals, frequency-domain sequences, and time–frequency domain images to construct multimodal data, which provides a comprehensive and complementary understanding of fault phenomena. Fully leveraging the characteristic of the CNN for parallel computing, the method employs the 1DCNN and 2DCNN for feature extraction, considering different input structures, and multiple receptive fields are utilized to mitigate the negative impact of nonstationary conditions. The feature extraction module also adopts attention-based fusion strategies to emphasize informative features for accurate fault prediction. The DAMFM is designed to comprehensively explore the common and differential features between modalities. Experimental results validate that the proposed DAMFM-MD outperforms the single-modal methods in diagnosing rotating machinery faults. Furthermore, considering that the variable operating conditions further improve the accuracy of the method, the proposed approach can provide reliable and accurate insights into complex fault problems in industrial processes.
Nevertheless, several limitations persist in the proposed method. Firstly, while the current framework demonstrates competent performance under controlled noise conditions, its robustness against complex real-world noise interference prevalent in industrial processes requires further enhancement. Future research will focus on integrating noise-robust strategies, particularly, improved soft-thresholding techniques, through systematic validation using industrial noise-contaminated datasets collected in industrial practice. Secondly, although the method effectively handles predefined variable operational conditions, practical applications necessitate recognizing unseen or unanticipated operational regimes. To address this gap, subsequent investigations will prioritize developing domain generalization frameworks combined with zero-shot learning paradigms, enabling adaptive diagnosis under completely novel operating scenarios through cross-domain knowledge transfer. Lastly, parallel computation techniques offer significant potential to improve the efficiency of deep learning models, and the proposed method needs to explore such techniques to accomplish diverse tasks.
Author Contributions
Conceptualization, Y.C.; Methodology, L.Z. and M.L.; Writing—original draft, L.Z.; Writing—review & editing, M.L.; Supervision, Y.C. All authors have read and agreed to the published version of the manuscript.
Funding
This research received no external funding.
Data Availability Statement
The original contributions presented in this study are included in the article. Further inquiries can be directed to the corresponding author.
Conflicts of Interest
The authors declare no conflict of interest.
References
- Sun, J.; Yan, C.; Wen, J. Intelligent Bearing Fault Diagnosis Method Combining Compressed Data Acquisition and Deep Learning. IEEE Trans. Instrum. Meas. 2018, 67, 185–195. [Google Scholar] [CrossRef]
- Li, X.; Zhang, F.; Wang, G.; Fang, F. Joint optimization of statistical and deep representation features for bearing fault diagnosis based on random subspace with coupled LASSO. Meas. Sci. Technol. 2021, 32, 025115. [Google Scholar] [CrossRef]
- Rai, A.; Upadhyay, S.H. A review on signal processing techniques utilized in the fault diagnosis of rolling element bearings. Tribol. Int. 2016, 96, 289–306. [Google Scholar] [CrossRef]
- Liang, H.; Cao, J.; Zhao, X. Multi-Scale dynamic adaptive residual network for fault diagnosis. Measurement 2022, 188, 110397. [Google Scholar] [CrossRef]
- Lei, Y.; Yang, B.; Jiang, X.; Jia, F.; Li, N.; Nandi, A.K. Applications of machine learning to machine fault diagnosis: A review and roadmap. Mech. Syst. Signal Process. 2020, 138, 106587. [Google Scholar] [CrossRef]
- Guo, S.; Zhang, B.; Yang, T.; Lyu, D.; Gao, W. Multitask Convolutional Neural Network With Information Fusion for Bearing Fault Diagnosis and Localization. IEEE Trans. Ind. Electron. 2020, 67, 8005–8015. [Google Scholar] [CrossRef]
- Sun, H.; Cao, X.; Wang, C.; Gao, S. An interpretable Anti-Noise network for rolling bearing fault diagnosis based on FSWT. Measurement 2022, 190, 110698. [Google Scholar] [CrossRef]
- Zhao, X.; Zhang, Y. An intelligent diagnosis method of rolling bearing based on Multi-Scale residual shrinkage convolutional neural network. Meas. Sci. Technol. 2022, 33, 085103. [Google Scholar] [CrossRef]
- Zhao, R.; Yan, R.; Chen, Z.; Mao, K.; Wang, P.; Gao, R.X. Deep learning and its applications to machine health monitoring. Mech. Syst. Signal Process. 2019, 115, 213–237. [Google Scholar] [CrossRef]
- Wang, G.; Zhang, M.; Lei, X.; Hu, Z.; Li, W.; Cao, J. A Multi-Branch convolutional transfer learning diagnostic method for bearings under diverse working conditions and devices. Measurement 2021, 182, 109627. [Google Scholar] [CrossRef]
- Liu, R.; Yang, B.; Zhang, X.; Wang, S.; Chen, X. Time-Frequency Atoms-Driven support vector machine method for bearings incipient fault diagnosis. Mech. Syst. Signal Process. 2016, 75, 345–370. [Google Scholar] [CrossRef]
- Sánchez, R.V.; Lucero, P.; Vásquez, R.E.; Cerrada, M.; Macancela, J.C.; Cabrera, D. Feature ranking for multi-fault diagnosis of rotating machinery by using random forest and KNN. J. Intell. Fuzzy Syst. 2018, 34, 3463–3473. [Google Scholar] [CrossRef]
- Wang, H.; Liu, Z.; Peng, D.; Qin, Y. Understanding and Learning Discriminant Features based on Multiattention 1DCNN for Wheelset Bearing Fault Diagnosis. IEEE Trans. Ind. Inf. 2020, 16, 5735–5745. [Google Scholar] [CrossRef]
- Wang, G.; Li, H.; Zhang, F.; Wu, Z. Feature Fusion based Ensemble Method for remaining useful life prediction of machinery. Appl. Soft Comput. 2022, 129, 109604. [Google Scholar] [CrossRef]
- Wen, L.; Li, X.; Gao, L.; Zhang, Y. A New Convolutional Neural Network-Based Data-Driven Fault Diagnosis Method. IEEE Trans. Ind. Electron. 2018, 65, 5990–5998. [Google Scholar] [CrossRef]
- Chen, Z.; Mauricio, A.; Li, W.; Gryllias, K. A deep learning method for bearing fault diagnosis based on Cyclic Spectral Coherence and Convolutional Neural Networks. Mech. Syst. Signal Process. 2020, 140, 106683. [Google Scholar] [CrossRef]
- Yu, J.; Zhou, X.; Lu, L.; Zhao, Z. Multiscale Dynamic Fusion Global Sparse Network for Gearbox Fault Diagnosis. IEEE Trans. Instrum. Meas. 2021, 70, 3516111. [Google Scholar] [CrossRef]
- Wang, H.; Xu, J.; Yan, R.; Gao, R.X. A New Intelligent Bearing Fault Diagnosis Method Using SDP Representation and SE-CNN. IEEE Trans. Instrum. Meas. 2020, 69, 2377–2389. [Google Scholar] [CrossRef]
- Gao, R.; Zhu, H.; Wang, G.; Wu, Z. A denoising and multiscale residual deep network for soft sensor modeling of industrial processes. Meas. Sci. Technol. 2022, 33, 105117. [Google Scholar] [CrossRef]
- Yao, X.; Zhu, H.; Wang, G.; Wu, Z.; Chu, W. Triple Attention-Based deep convolutional recurrent network for soft sensors. Measurement 2022, 202, 111897. [Google Scholar] [CrossRef]
- Han, Y.; Tang, B.; Deng, L. Multi-Level wavelet packet fusion in dynamic ensemble convolutional neural network for fault diagnosis. Measurement 2018, 127, 246–255. [Google Scholar] [CrossRef]
- Wen, L.; Li, X.; Gao, L. A New Two-Level Hierarchical Diagnosis Network Based on Convolutional Neural Network. IEEE Trans. Instrum. Meas. 2020, 69, 330–338. [Google Scholar] [CrossRef]
- Wang, G.; Zhang, F. A Sequence-to-Sequence Model With Attention and Monotonicity Loss for Tool Wear Monitoring and Prediction. IEEE Trans. Instrum. Meas. 2021, 70, 1–11. [Google Scholar] [CrossRef]
- Zaman, W.; Siddique, M.F.; Ullah, S.; Saleem, F.; Kim, J.-M. Hybrid Deep Learning Model for Fault Diagnosis in Centrifugal Pumps: A Comparative Study of VGG16, ResNet50, and Wavelet Coherence Analysis. Machines 2024, 12, 905. [Google Scholar] [CrossRef]
- Li, Y.; Zou, L.; Jiang, L.; Zhou, X. Fault Diagnosis of Rotating Machinery Based on Combination of Deep Belief Network and One-Dimensional Convolutional Neural Network. IEEE Access 2019, 7, 165710–165723. [Google Scholar] [CrossRef]
- Zhang, X.; Han, P.; Xu, L.; Zhang, F.; Wang, Y.; Gao, L. Research on Bearing Fault Diagnosis of Wind Turbine Gearbox Based on 1DCNN-PSO-SVM. IEEE Access 2020, 8, 192248–192258. [Google Scholar] [CrossRef]
- Ye, Z.; Yu, J. AKRNet: A novel convolutional neural network with attentive kernel residual learning for feature learning of gearbox vibration signals. Neurocomputing 2021, 447, 23–37. [Google Scholar] [CrossRef]
- Siddique, M.F.; Saleem, F.; Umar, M.; Kim, C.H.; Kim, J.-M. A Hybrid Deep Learning Approach for Bearing Fault Diagnosis Using Continuous Wavelet Transform and Attention-Enhanced Spatiotemporal Feature Extraction. Sensors 2025, 25, 2712. [Google Scholar] [CrossRef]
- Zhang, Y.; Xing, K.; Bai, R.; Sun, D.; Meng, Z. An enhanced convolutional neural network for bearing fault diagnosis based on Time–Frequency image. Measurement 2020, 157, 107667. [Google Scholar] [CrossRef]
- Wang, D.; Li, Y.; Jia, L.; Song, Y.; Liu, Y. Novel Three-Stage Feature Fusion Method of Multimodal Data for Bearing Fault Diagnosis. IEEE Trans. Instrum. Meas. 2021, 70, 3514710. [Google Scholar] [CrossRef]
- Weng, C.; Lu, B.; Gu, Q. A Multi-Scale Kernel-Based network with improved attention mechanism for rotating machinery fault diagnosis under noisy environments. Meas. Sci. Technol. 2022, 33, 055108. [Google Scholar] [CrossRef]
- Ke, L.; Hu, G.; Yang, Y.; Liu, Y. Fault Diagnosis for Modular Multilevel Converter Switching Devices via Multimodal Attention Fusion. IEEE Access 2023, 11, 135035–135048. [Google Scholar] [CrossRef]
- Zhou, F.; Hu, P.; Yang, S.; Wen, C. A Multimodal Feature Fusion-Based Deep Learning Method for Online Fault Diagnosis of Rotating Machinery. Sensors 2018, 18, 3521. [Google Scholar] [CrossRef] [PubMed]
- Qin, Y.; Shi, X. Fault Diagnosis Method for Rolling Bearings Based on Two-Channel CNN under Unbalanced Datasets. Appl. Sci. 2022, 12, 8474. [Google Scholar] [CrossRef]
- Ma, Y.; Wen, G.; Cheng, S.; He, X.; Mei, S. Multimodal convolutional neural network model with information fusion for intelligent fault diagnosis in rotating machinery. Meas. Sci. Technol. 2022, 33, 125109. [Google Scholar] [CrossRef]
- Cheng, L.; An, Z.; Guo, Y.; Ren, M.; Yang, Z.; McLoone, S. MMFSL: A Novel Multimodal Few-Shot Learning Framework for Fault Diagnosis of Industrial Bearings. IEEE Trans. Instrum. Meas. 2023, 72, 3525313. [Google Scholar] [CrossRef]
- Xie, T.; Xu, Q.; Jiang, C.; Lu, S.; Wang, X. The fault frequency priors fusion deep learning framework with application to fault diagnosis of offshore wind turbines. Renew. Energy 2023, 202, 143–153. [Google Scholar] [CrossRef]
- Jia, L.; Chow, T.W.S.; Wang, Y.; Yuan, Y. Multiscale Residual Attention Convolutional Neural Network for Bearing Fault Diagnosis. IEEE Trans. Instrum. Meas. 2022, 71, 3519413. [Google Scholar] [CrossRef]
- Chang, Y.; Chen, J.; Chen, Q.; Liu, S.; Zhou, Z. CFs-Focused intelligent diagnosis scheme via alternative kernels networks with soft Squeeze-and-Excitation attention for Fast-Precise fault detection under slow & sharp speed variations. Knowl. -Based Syst. 2022, 239, 108026. [Google Scholar] [CrossRef]
- Li, C.; Sanchez, R.-V.; Zurita, G.; Cerrada, M.; Cabrera, D.; Vásquez, R.E. Multimodal deep support vector classification with homologous features and its application to gearbox fault diagnosis. Neurocomputing 2015, 168, 119–127. [Google Scholar] [CrossRef]
- Wang, G.; Zhang, F.; Cheng, B.; Fang, F. DAMER: A novel diagnosis aggregation method with evidential reasoning rule for bearing fault diagnosis. J. Intell. Manuf. 2021, 32, 1–20. [Google Scholar] [CrossRef]
- Wang, G.; Huang, J.; Zhang, F. Ensemble Clustering-Based fault diagnosis method incorporating traditional and deep representation features. Meas. Sci. Technol. 2021, 32, 095110. [Google Scholar] [CrossRef]
- Pandya, D.H.; Upadhyay, S.H.; Harsha, S.P. Fault diagnosis of rolling element bearing with intrinsic mode function of acoustic emission data using APF-KNN. Expert. Syst. Appl. 2013, 40, 4137–4145. [Google Scholar] [CrossRef]
- Cerrada, M.; Zurita, G.; Cabrera, D.; Sánchez, R.-V.; Artés, M.; Li, C. Fault diagnosis in spur gears based on genetic algorithm and random forest. Mech. Syst. Signal Process. 2016, 70–71, 87–103. [Google Scholar] [CrossRef]
- Yan, X.; Jia, M. A novel optimized SVM classification algorithm with multi-domain feature and its application to fault diagnosis of rolling bearing. Neurocomputing 2018, 313, 47–64. [Google Scholar] [CrossRef]
- Li, G.; Deng, C.; Wu, J.; Xu, X.; Shao, X.; Wang, Y. Sensor Data-Driven Bearing Fault Diagnosis Based on Deep Convolutional Neural Networks and S-Transform. Sensors 2019, 19, 2750. [Google Scholar] [CrossRef]
- Zhang, L.; Lv, Y.; Huang, W.; Yi, C. Bearing fault diagnosis under various operation conditions using synchrosqueezing transform and improved Two-Dimensional convolutional neural network. Meas. Sci. Technol. 2022, 33, 085002. [Google Scholar] [CrossRef]
- Wu, C.; Jiang, P.; Ding, C.; Feng, F.; Chen, T. Intelligent fault diagnosis of rotating machinery based on One-Dimensional convolutional neural network. Comput. Ind. 2019, 108, 53–61. [Google Scholar] [CrossRef]
- Zou, F.; Zhang, H.; Sang, S.; Li, X.; He, W.; Liu, X.; Chen, Y. An Anti-Noise One-Dimension convolutional neural network learning model applying on bearing fault diagnosis. Measurement 2021, 186, 110236. [Google Scholar] [CrossRef]
- Chang, X.; Tang, B.; Tan, Q.; Deng, L.; Zhang, F. One-Dimensional fully decoupled networks for fault diagnosis of planetary gearboxes. Mech. Syst. Signal Process. 2020, 141, 106482. [Google Scholar] [CrossRef]
- Lu, F.; Tong, Q.; Feng, Z.; Wan, Q.; An, G.; Li, Y.; Wang, M.; Cao, J.; Guo, T. Explainable 1DCNN with demodulated frequency features method for fault diagnosis of rolling bearing under Time-Varying speed conditions. Meas. Sci. Technol. 2022, 33, 095022. [Google Scholar] [CrossRef]
- Xian, D.; Ding, J.; He, Z.; Liu, Y.; Li, T.; Bai, Y.; Jiang, Z. State recognition of motor pump based on multimodal homologous features and XGBoost. In Proceedings of the 2021 IEEE International Conference on Manipulation, Manufacturing and Measurement on the Nanoscale (3M-NANO), Xi’an, China, 2–6 August 2021; pp. 231–236. [Google Scholar] [CrossRef]
- Chu, C.; Ge, Y.; Qian, Q.; Hua, B.; Guo, J. A novel Multi-Scale convolution model based on Multi-Dilation rates and Multi-Attention mechanism for mechanical fault diagnosis. Digit. Signal Process. 2022, 122, 103355. [Google Scholar] [CrossRef]
- He, X.; Wang, Y.; Zhao, S.; Chen, X. Co-Attention Fusion Network for Multimodal Skin Cancer Diagnosis. Pattern Recognit. 2023, 133, 108990. [Google Scholar] [CrossRef]
- Qingyun, F.; Zhaokui, W. Cross-Modality attentive feature fusion for object detection in multispectral remote sensing imagery. Pattern Recognit. 2022, 130, 108786. [Google Scholar] [CrossRef]
- Li, J.; Shao, J.; Wang, W.; Xie, W. An evolutional deep learning method based on multi-feature fusion for fault diagnosis in sucker rod pumping system. Alex. Eng. J. 2023, 66, 343–355. [Google Scholar] [CrossRef]
- Shao, S.; McAleer, S.; Yan, R.; Baldi, P. Highly Accurate Machine Fault Diagnosis Using Deep Transfer Learning. IEEE Trans. Ind. Inf. 2019, 15, 2446–2455. [Google Scholar] [CrossRef]
- Zhang, W.; Peng, G.; Li, C.; Chen, Y.; Zhang, Z. A New Deep Learning Model for Fault Diagnosis with Good Anti-Noise and Domain Adaptation Ability on Raw Vibration Signals. Sensors 2017, 17, 425. [Google Scholar] [CrossRef]
- Zhang, W.; Li, X.; Ding, Q. Deep residual Learning-Based fault diagnosis method for rotating machinery. ISA Trans. 2019, 95, 295–305. [Google Scholar] [CrossRef]
- Chen, X.; Zhang, B.; Gao, D. Bearing fault diagnosis base on Multi-Scale CNN and LSTM model. J. Intell. Manuf. 2021, 32, 971–987. [Google Scholar] [CrossRef]
- Liu, R.; Wang, F.; Yang, B.; Qin, S.J. Multiscale Kernel Based Residual Convolutional Neural Network for Motor Fault Diagnosis Under Nonstationary Conditions. IEEE Trans. Ind. Inf. 2020, 16, 3797–3806. [Google Scholar] [CrossRef]
- Zhao, M.; Zhong, S.; Fu, X.; Tang, B.; Pecht, M. Deep Residual Shrinkage Networks for Fault Diagnosis. IEEE Trans. Ind. Inf. 2020, 16, 4681–4690. [Google Scholar] [CrossRef]
- van der Maaten, L.; Hinton, G. Visualizing Data using t-SNE. J. Mach. Learn. Res. 2008, 9, 2579–2605. [Google Scholar]
Disclaimer/Publisher’s Note: The statements, opinions and data contained in all publications are solely those of the individual author(s) and contributor(s) and not of MDPI and/or the editor(s). MDPI and/or the editor(s) disclaim responsibility for any injury to people or property resulting from any ideas, methods, instructions or products referred to in the content. |
© 2025 by the authors. Licensee MDPI, Basel, Switzerland. This article is an open access article distributed under the terms and conditions of the Creative Commons Attribution (CC BY) license (https://creativecommons.org/licenses/by/4.0/).