Article

SOE: A Multi-Objective Traffic Scheduling Engine for DDoS Mitigation with Isolation-Aware Optimization

1
School of Computer Science and Engineering, Faculty of Innovation Engineering, Macau University of Science and Technology, Macao 999078, China
2
College of Computer Information and Engineering, Nanchang Institute of Technology, Nanchang 330044, China
*
Author to whom correspondence should be addressed.
Mathematics 2025, 13(11), 1853; https://doi.org/10.3390/math13111853
Submission received: 28 April 2025 / Revised: 28 May 2025 / Accepted: 31 May 2025 / Published: 2 June 2025
(This article belongs to the Section E1: Mathematics and Computer Science)

Abstract

Distributed Denial-of-Service (DDoS) attacks generate deceptive, high-volume traffic that bypasses conventional detection mechanisms. When interception fails, effectively allocating mixed benign and malicious traffic under resource constraints becomes a critical challenge. To address this, we propose SchedOpt Engine (SOE), a scheduling framework formulated as a discrete multi-objective optimization problem. The goal is to optimize four conflicting objectives: a benign traffic acceptance rate (BTAR), malicious traffic interception rate (MTIR), server load balancing, and malicious traffic isolation. These objectives are combined into a composite scalarized loss function with soft constraints, prioritizing a BTAR while maintaining flexibility. To solve this problem, we introduce MOFATA, a multi-objective extension of the Fata Morgana Algorithm (FATA) within a Pareto-based evolutionary framework. An ϵ -dominance mechanism is incorporated to improve solution granularity and diversity. Simulations under varying attack intensities and resource constraints validate the effectiveness of SOE. Results show that SOE consistently achieves a high BTAR and MTIR while balancing server loads. Under extreme attacks, SOE isolates malicious traffic to a subset of servers, preserving capacity for benign services. SOE also demonstrates strong adaptability in fluctuating attack environments, providing a practical solution for DDoS mitigation.

1. Introduction

A Distributed Denial-of-Service (DDoS) attack [1] is a malicious act in which attackers leverage a large number of compromised devices to generate massive traffic floods toward a target network, rendering its services unavailable. According to report by Cloudflare [2], in 2024, more than 21.3 million DDoS attacks were mitigated, representing a 53% year-over-year increase. Some of these attacks reached traffic volumes of several terabits per second—enough to overwhelm even the most resilient network infrastructures. The consequences of DDoS attacks often entail financial losses, service disruptions, and damage to brand reputation [3]. It is estimated that the average loss per incident ranges from USD400,000 to USD 500,000, including costs related to downtime, emergency response, and mitigation efforts. Furthermore, such attacks may erode service continuity, thereby undermining an organization’s market position and customer trust in the long term.
In recent years, in response to the escalating threat of DDoS attacks, both academic and industrial communities have proposed various defense mechanisms to mitigate their destructive impact on critical infrastructure. Commonly adopted techniques include traffic scrubbing [4], rate limiting [5], blackhole routing [6], Content Delivery Networks (CDNs) [7], and Web Application Firewalls (WAFs) [8]. Specifically, traffic scrubbing relies on high-performance equipment to identify and filter malicious traffic, rate limiting constrains abnormal access behaviors by setting thresholds for connection frequency or bandwidth, blackhole routing diverts suspicious traffic to null addresses to prevent resource exhaustion, CDNs alleviate pressure on origin servers by caching content at edge nodes, and WAFs are designed to detect and intercept application-layer attacks. These methods have proven effective to some extent in mitigating conventional attacks and collectively form the foundational framework of today’s DDoS defense systems.
However, the continuous evolution of DDoS attack techniques poses significant challenges to existing defense systems. First, attackers now adopt advanced evasion techniques that mimic legitimate user behavior, making it difficult for traditional signature-based detection mechanisms to accurately identify malicious requests. Second, it has become increasingly difficult to distinguish benign traffic from malicious traffic in real time, especially under the prevalence of application-layer attacks, where their behavioral patterns tend to converge, further diminishing detection accuracy. Moreover, the widespread deployment of Internet of Things (IoT) devices—many of which suffer from inherent security vulnerabilities—has enabled attackers to form massive botnets [9]. These botnets can launch high-intensity distributed attacks within seconds, generating instantaneous traffic surges that can swiftly cripple targeted services. More critically, once an attack penetrates the defense perimeter, existing mechanisms often lack the adaptability and dynamic response capacity required for timely mitigation and recovery, leading to prolonged service outages. These challenges highlight the insufficiency of traditional defenses in meeting the high availability and adaptability demands of modern network environments, thereby underscoring the urgent need for intelligent, multi-objective, and systematically adaptive DDoS mitigation solutions.
To address the aforementioned challenges, we propose a multi-objective optimization-based scheduling strategy named SchedOpt Engine (SOE), which aims to achieve efficient trade-offs among several conflicting DDoS defense objectives. Unlike conventional optimization strategies that focus on a single objective—such as maximizing benign traffic throughput or entirely discarding malicious traffic—SOE performs holistic modeling to identify the optimal balance between security and availability, thereby ensuring robust and efficient system performance under attack conditions. Multi-objective optimization is particularly crucial in DDoS scenarios. For example, traditional threshold-based filtering mechanisms may block part of the attack traffic but risk discarding legitimate user bursts. In contrast, SOE is network state-aware and dynamically adjusts its scheduling policies to preserve genuine user requests to the greatest extent possible. Specifically, SOE formulates traffic scheduling under DDoS conditions as a multi-objective optimization problem constrained by limited resources, accurately capturing the coexistence dynamics of benign and malicious traffic and converting them into a solvable scheduling task. Unlike approaches that rely on a single node, SOE makes localized and intelligent scheduling decisions across multiple servers, laying a strong foundation for enhancing attack resilience in distributed environments. Additionally, we enhanced the original FATA algorithm as a multi-objective variant named MOFATA, which drives the refined decision-making capabilities of SOE. The designed composite fitness function simultaneously optimizes three core metrics—the benign traffic acceptance rate (BTAR), malicious traffic interception rate (MTIR), and server load-balancing degree—while also reinforcing the system’s capability to isolate malicious traffic. This method demonstrates empirical superiority over traditional single-objective or static strategies. For instance, threshold-based filtering may block attack traffic but often suffers from high false-positive rates, mistakenly discarding legitimate requests. In contrast, SOE powered by MOFATA adaptively responds to changing network conditions and dynamically tunes its scheduling strategies to strike an optimal balance between security and performance. It significantly improves attack resilience while ensuring efficient resource utilization, outperforming traditional scheduling and filtering techniques.
We conducted extensive simulations across various realistic attack scenarios to validate the effectiveness and scalability of SOE. The results show that SOE significantly improves BTAR, successfully intercepts a large volume of malicious traffic, and maintains balanced loads across servers in networks of varying scales. When facing high volumes of malicious traffic, SOE is capable of isolating the attack load to a small subset of nodes, thereby preserving the service capacity of the majority of servers. Furthermore, SOE exhibits rapid responsiveness, promptly adjusting strategies in response to highly volatile malicious traffic to maintain overall system stability. This scenario-driven and systematic evaluation provides theoretical insights for real-world system design, suggesting that adopting the proposed adaptive scheduling strategy can significantly enhance the DDoS resilience of critical infrastructure.
Key Contributions of This Work:
  • We propose the SchedOpt Engine (SOE), a scheduling framework that focuses on maintaining system operability through intelligent traffic allocation, even when malicious traffic cannot be fully intercepted. The underlying MOFATA algorithm provides powerful multi-objective optimization capabilities, significantly enhancing scheduling performance.
  • We design a composite loss function that jointly considers benign traffic protection and malicious traffic isolation. Even in the absence of complete interception, the isolation mechanism safeguards a majority of system resources, thereby improving both the benign traffic acceptance rate (BTAR) and the malicious traffic interception rate (MTIR).
  • SOE exhibits excellent adaptability, maintaining stable scheduling and promptly responding to malicious traffic surges, which ensures continuous and stable system operation under volatile attack conditions.
Organization of the Paper:
The remainder of this paper is organized as follows. Section 2 reviews related work on network traffic scheduling and multi-objective optimization algorithms. Section 3 models the DDoS-aware traffic scheduling problem, introduces the proposed fitness function, and elaborates on the construction of the MOFATA algorithm. Section 4 conducts various algorithmic analyses on MOFATA, including time complexity analysis, scalability analysis, and parameter sensitivity analysis. Section 5 presents comprehensive experiments to evaluate the BTAR, MTIR, and server load balancing under varying attack intensities and resource constraints and assesses the responsiveness and stability of SOE in dynamic environments. Section 6 concludes the paper by summarizing key findings and discussing potential future research directions.

2. Related Work

In recent years, network scheduling technologies have been extensively studied to address issues such as traffic allocation [10], load balancing [11], and quality of service (QoS) [12] assurance under constrained network resources. Early-stage scheduling algorithms primarily focused on single-objective optimization, such as maximizing throughput or minimizing latency. Algorithms such as the round-robin [13], weighted round-robin [14], and shortest queue-first [15] algorithms have been widely adopted in distributed server and data-center environments. With the advent of cloud computing and large-scale networks, researchers have shifted their focus to dynamic load distribution across multiple nodes, leading to the development of distributed load balancing [16] and adaptive scheduling strategies [17]. In DDoS defense systems, network scheduling—particularly under Software-Defined Networking (SDN) [18,19] architectures—has emerged as a key enabler for dynamic defense and optimized resource allocation. The centralized control and global visibility provided by SDN offer a solid foundation for the flexible deployment and rapid response of traffic scheduling algorithms. Current research focuses on the integration of multidimensional scheduling strategies with dynamic path planning to identify and redirect malicious traffic, thereby mitigating its impact on critical resources. For instance, Ref. [20] proposed a DDoS mitigation scheme that utilizes multidimensional metrics—including residual bandwidth, flow table entries, and path length—for path planning, which outperforms traditional methods such as the Equal-Cost Multi-Path (ECMP) [21] and K-Shortest Paths (KSP) [22] algorithms. Additionally, Ref. [23] employed adaptive scheduling of data collection and detection tasks, which not only reduces resource consumption but also significantly improves detection timeliness and accuracy. These studies demonstrate the significant potential of SDN in fine-grained traffic control, improved network resilience, and dynamic DDoS mitigation, thereby laying the technical foundation for the development of next-generation network security systems with intelligent scheduling capabilities.
While the aforementioned scheduling techniques perform well under typical conditions, they face multiple challenges in the context of DDoS attacks. First, malicious traffic often masquerades as legitimate requests, and traditional upstream identification and scrubbing mechanisms are insufficient for complete detection, resulting in a mixed stream of benign and malicious traffic entering the scheduling module. This uncertainty substantially increases the complexity of devising effective scheduling strategies. Second, due to constraints such as limited server processing capacity and network bandwidth, the system must perform efficient scheduling under traffic overload conditions. This introduces a two-fold challenge: ensuring quality of service for benign traffic while minimizing resource consumption by malicious traffic—two inherently conflicting goals. In addition, the system must also maintain load balancing across servers to avoid local resource bottlenecks. Under extreme attack intensities, it must further apply traffic isolation mechanisms to direct malicious traffic toward a small subset of nodes, thereby preserving service availability on the remaining servers. Consequently, the scheduling problem evolves into a complex multi-objective optimization task involving dynamic trade-offs among four conflicting objectives: maximizing benign traffic transmission, minimizing malicious traffic occupancy, improving server load balancing, and isolating malicious traffic. This problem is further aggravated by the highly dynamic nature of DDoS attacks, where the proportion, pattern, and distribution of malicious traffic frequently fluctuate. Traditional static or rule-based scheduling methods often struggle to adapt in a timely manner. As a result, scheduling under DDoS conditions is no longer a single-objective optimization problem but a typical multi-objective, constrained, and dynamic optimization challenge. To address this, the introduction of multi-objective optimization algorithms offers a promising direction for achieving flexible strategy trade-offs and adapting dynamically to system state changes, thereby improving both scheduling efficiency and system resilience while preserving benign traffic. This also explains the growing interest in multi-objective evolutionary optimization algorithms within the domains of network scheduling and DDoS defense in recent years.
Multi-objective optimization (MOO) serves as a foundational methodology for addressing problems involving multiple conflicting objectives. Such problems generally do not have a single optimal solution but, instead, yield a set of Pareto-optimal solutions that reflect trade-offs among competing objectives. Traditional scalarization-based methods, such as weighted sum and ϵ -constraint techniques, are relatively easy to implement but suffer from limitations when dealing with non-convex Pareto fronts. In contrast, population-based evolutionary algorithms such as NSGA-II [24] and SPEA2 [25] utilize non-dominated sorting and diversity preservation mechanisms, exhibiting strong adaptability and search capability, particularly for high-complexity, nonlinear optimization problems. In the field of network security, Roopak et al. [26] proposed a multi-objective feature selection approach for IoT-based DDoS detection, employing an enhanced NSGA-II algorithm combined with a jumping gene operator. The method optimizes six criteria: feature relevance, redundancy, the number of features, classification accuracy, recall, and precision. Experimental results showed that nearly 90% of the features could be eliminated while achieving a detection accuracy of 99.9%. Sun et al. [27] explored the application of Pareto optimization in multi-objective reinforcement learning and proposed the Pareto Defense Strategy Selection Simulator (PDSSS), which integrates multi-objective zero-sum games with reinforcement learning to assist security agents in selecting optimal strategies across multiple defense objectives. The results indicated that scalarization strategies based on the satisficing trade-off method (STOM) outperformed traditional linearly weighted approaches and significantly improved policy decision-making. In summary, network scheduling in the DDoS defense domain is shifting from traditional single-objective approaches to multi-objective, adaptive, and intelligent paradigms. Multi-objective optimization algorithms, with their remarkable ability to handle high-dimensional, complex scenarios, are increasingly becoming core tools for countering large-scale network attacks and constructing resilient scheduling frameworks. This trend also provides a solid theoretical and methodological foundation for the design of future intelligent network defense systems.

3. Problem Formulation and Methodology

3.1. Problem Modeling

When facing DDoS attacks, the complexity of the traffic scheduling problem primarily lies in maximizing the service delivery of benign traffic under limited network resources while suppressing the performance degradation caused by malicious attacks. To address this, the DDoS traffic scheduling problem is formulated as a variant of the multidimensional bin-packing or multiple-knapsack problem, which is recognized as a classic NP-hard problem. In this model, each server is abstracted as a bin with a fixed capacity (C), and each traffic source is treated as an item to be packed. Each item comprises both benign traffic, which is assigned a positive value, and malicious traffic, which is penalized as a negative value; however, both consume limited server resources. The core objective of the model is to pack as many high-value (benign) items as possible under constrained server capacities while minimizing the impact of malicious traffic and simultaneously achieving high load balancing and strong traffic isolation capability.
In our model, consider a network with N traffic sources, where each source (i) carries a benign traffic volume ( L i ) and a malicious traffic volume ( A i ). In a multi-server scheduling scenario, suppose there are M servers, each with identical service capacity denoted by C. When traffic source i is assigned to server j (denoted as x i = j ), server j receives total incoming traffic of L i + A i from source i. Due to capacity limitations, each server can serve, at most, C units of benign traffic; any excess beyond this capacity will be discarded. The topological diagram is shown in Figure 1.
The formalized objective function is defined as Equation (1). This objective reflects the design principle of prioritizing benign traffic under constrained resources while suppressing the servicing of malicious traffic under the constraint that each traffic source is assigned to exactly one server.
max j = 1 M min C , i : x i = j L i ,
where the min ( ) function ensures that the amount of benign traffic served by each server does not exceed its physical capacity (C).
As NP-hard problems have no known polynomial-time exact solutions and exhibit exponential growth in computational complexity with increasing problem size—especially in the presence of multiple objectives and complex constraints—exact algorithms are theoretically infeasible and practically limited by computational time and resource constraints. As a result, heuristic, metaheuristic, and approximation algorithms have emerged as effective alternatives for tackling such problems. These algorithms are capable of providing high-quality approximate solutions within reasonable computational time, striking a balance between efficiency and accuracy and, thus, meeting the demands of complex system optimization in practical engineering contexts. To this end, this study introduces a heuristic search method aimed at fast convergence, with the goal of identifying near-optimal traffic allocation strategies that quickly determine scheduling decisions while satisfying key DDoS defense objectives—namely, maximizing benign traffic throughput, balancing server loads, and minimizing the service of malicious traffic.

3.2. Fitness Function

To accurately evaluate the effectiveness of each traffic allocation scheme (X), a composite fitness function is constructed, integrating primary performance objectives with several auxiliary constraints. The core component of the function measures the actual volume of benign traffic successfully served by each server and is defined as Equation (2). This objective function captures the fundamental goal of maximizing benign traffic throughput under limited-resource conditions.
F normal ( X ) = j = 1 M min C , i : x i = j L i ,
where C denotes the maximum processing capacity of each server, L i represents the benign traffic volume of request i, and x i denotes the index of the server assigned to request i.
To enhance the overall efficiency of resource allocation, a load imbalance penalty term is introduced to prevent the overloading of certain servers while others remain underutilized. The load imbalance degree (LID) is defined as Equation (3). In the fitness function, this term is penalized by subtracting α · LID, thereby encouraging balanced traffic distribution and promoting trade-offs between system performance and fairness.
LID = max j Load j min j Load j 1 M j = 1 M Load j ,
Load j = i : x i = j ( L i + A i ) ,
where Equation (4) denotes the total incoming traffic assigned to server j and A i represents the malicious traffic volume of request i.
Although malicious traffic contributes no positive value, its consumption of resources can significantly impair the service quality of benign traffic. To address this, two additional penalty terms are introduced: The first is a penalty for insufficient benign traffic delivery, defined as Equation (5). The second is a penalty for malicious traffic serviced by the system, which measures the degree to which malicious requests are processed, defined as Equation (8). This term quantifies the portion of malicious traffic served by server j and is incorporated into the overall fitness function via the β coefficient to discourage allocation strategies that respond excessively to malicious requests.
P legit ( X ) = w legit · max 0 , T exp T legit ( X ) 2 ,
T legit ( X ) = j = 1 M min C , i : x i = j L i ,
T exp = min i = 1 N L i , M · C ,
where, T benign ( X ) denotes the actual amount of benign traffic served under allocation scheme X, and T exp represents the expected upper bound of service. The coefficient w legit is a tunable weight used to enhance the optimization drive toward preserving benign traffic.
P malicious ( X ) = max 0 , min ( C , L j + A j ) min ( C , L j ) .
To further strengthen the system’s resilience against attacks, an isolation reward term is introduced. Under resource-constrained conditions, an ideal scheduling strategy should concentrate attack traffic on a small subset of nodes to preserve the service capacity of critical servers for benign requests.
The ratio of benign traffic served by server j is defined as Equation (9). To quantify the isolation effect, the a reward term is designed as Equation (10). This metric captures the disparity in service purity among servers—a greater difference indicates that malicious traffic is effectively concentrated on specific nodes, which benefits the overall scheduling outcome. The significance of this term is controlled by the weight coefficient ( δ ).
R j = min C , i : x i = j L i min C , i : x i = j ( L i + A i ) + ε ,
where ϵ is a small constant to prevent division by zero.
F iso = max j R j avg j R j .
Accordingly, the final fitness function is expressed as Equation (11). This fitness function not only evaluates the service capability for benign traffic but also systematically integrates key factors such as load balancing, attack suppression, and traffic isolation. It thereby constructs a unified and flexible evaluation framework that serves as a theoretical and algorithmic foundation for intelligent scheduling in DDoS environments.
F ( X ) = F normal ( X ) α · D I β · P attack ( X ) γ · P legit ( X ) δ · F iso ,
where weighting parameters α , β , γ , and δ can be tuned experimentally to achieve optimal performance.

3.3. Methodology

3.3.1. Fata Morgana Algorithm (FATA)

The Fata Morgana Algorithm (FATA) [28] is adopted as the core optimization engine in the SOE framework. The FATA algorithm is a heuristic optimization algorithm inspired by the physical phenomenon of Fata Morgana mirages. It employs a two-tiered search strategy based on the behavior of light propagation, combining population-level and individual-level searches to enhance global exploration and local convergence efficiency. The algorithm operates in two phases. In the first phase, inspired by definite integral principles, it simulates the propagation of multiple light beams through a non-uniform medium to perform global guidance over the entire population. A dynamic light-filtering mechanism is introduced at this stage to evaluate the fitness of beam paths within the objective space, thereby strengthening the algorithm’s population-wide exploratory capability. In the second phase, trigonometric principles are employed to simulate light refraction and reflection at boundary interfaces, guiding individuals to adjust their positions along new directions and thereby improving the precision and convergence speed of local search. Through this physical analogy mechanism, the FATA algorithm achieves an effective synergy between global exploration and local exploitation during the search process, offering efficient solution-space navigation for complex multi-objective scheduling problems.
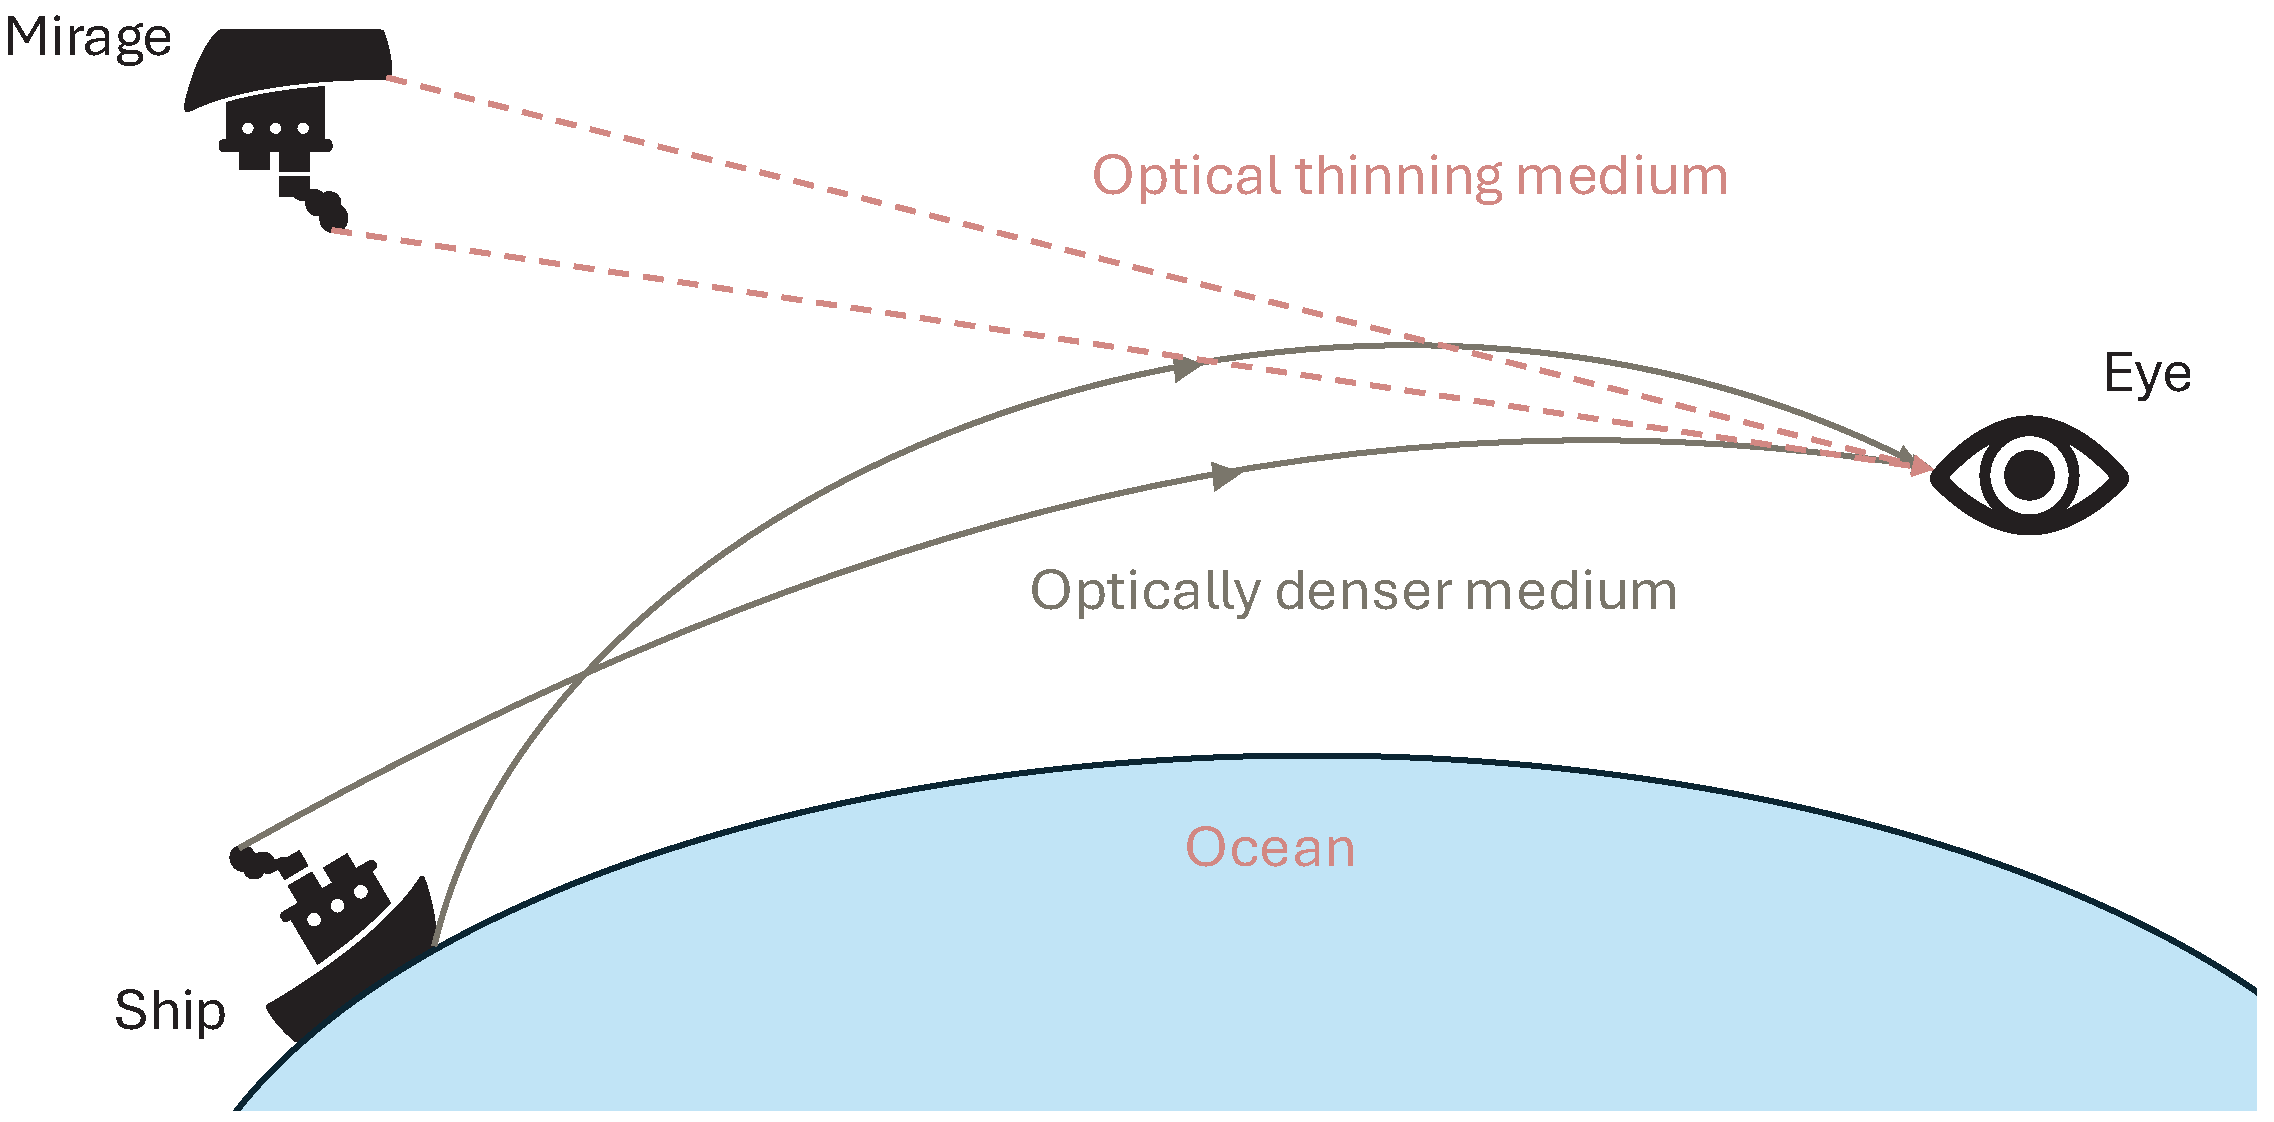
The FATA algorithm simulates the formation process of Fata Morgana mirages to construct its population-based search mechanism, as shown in 
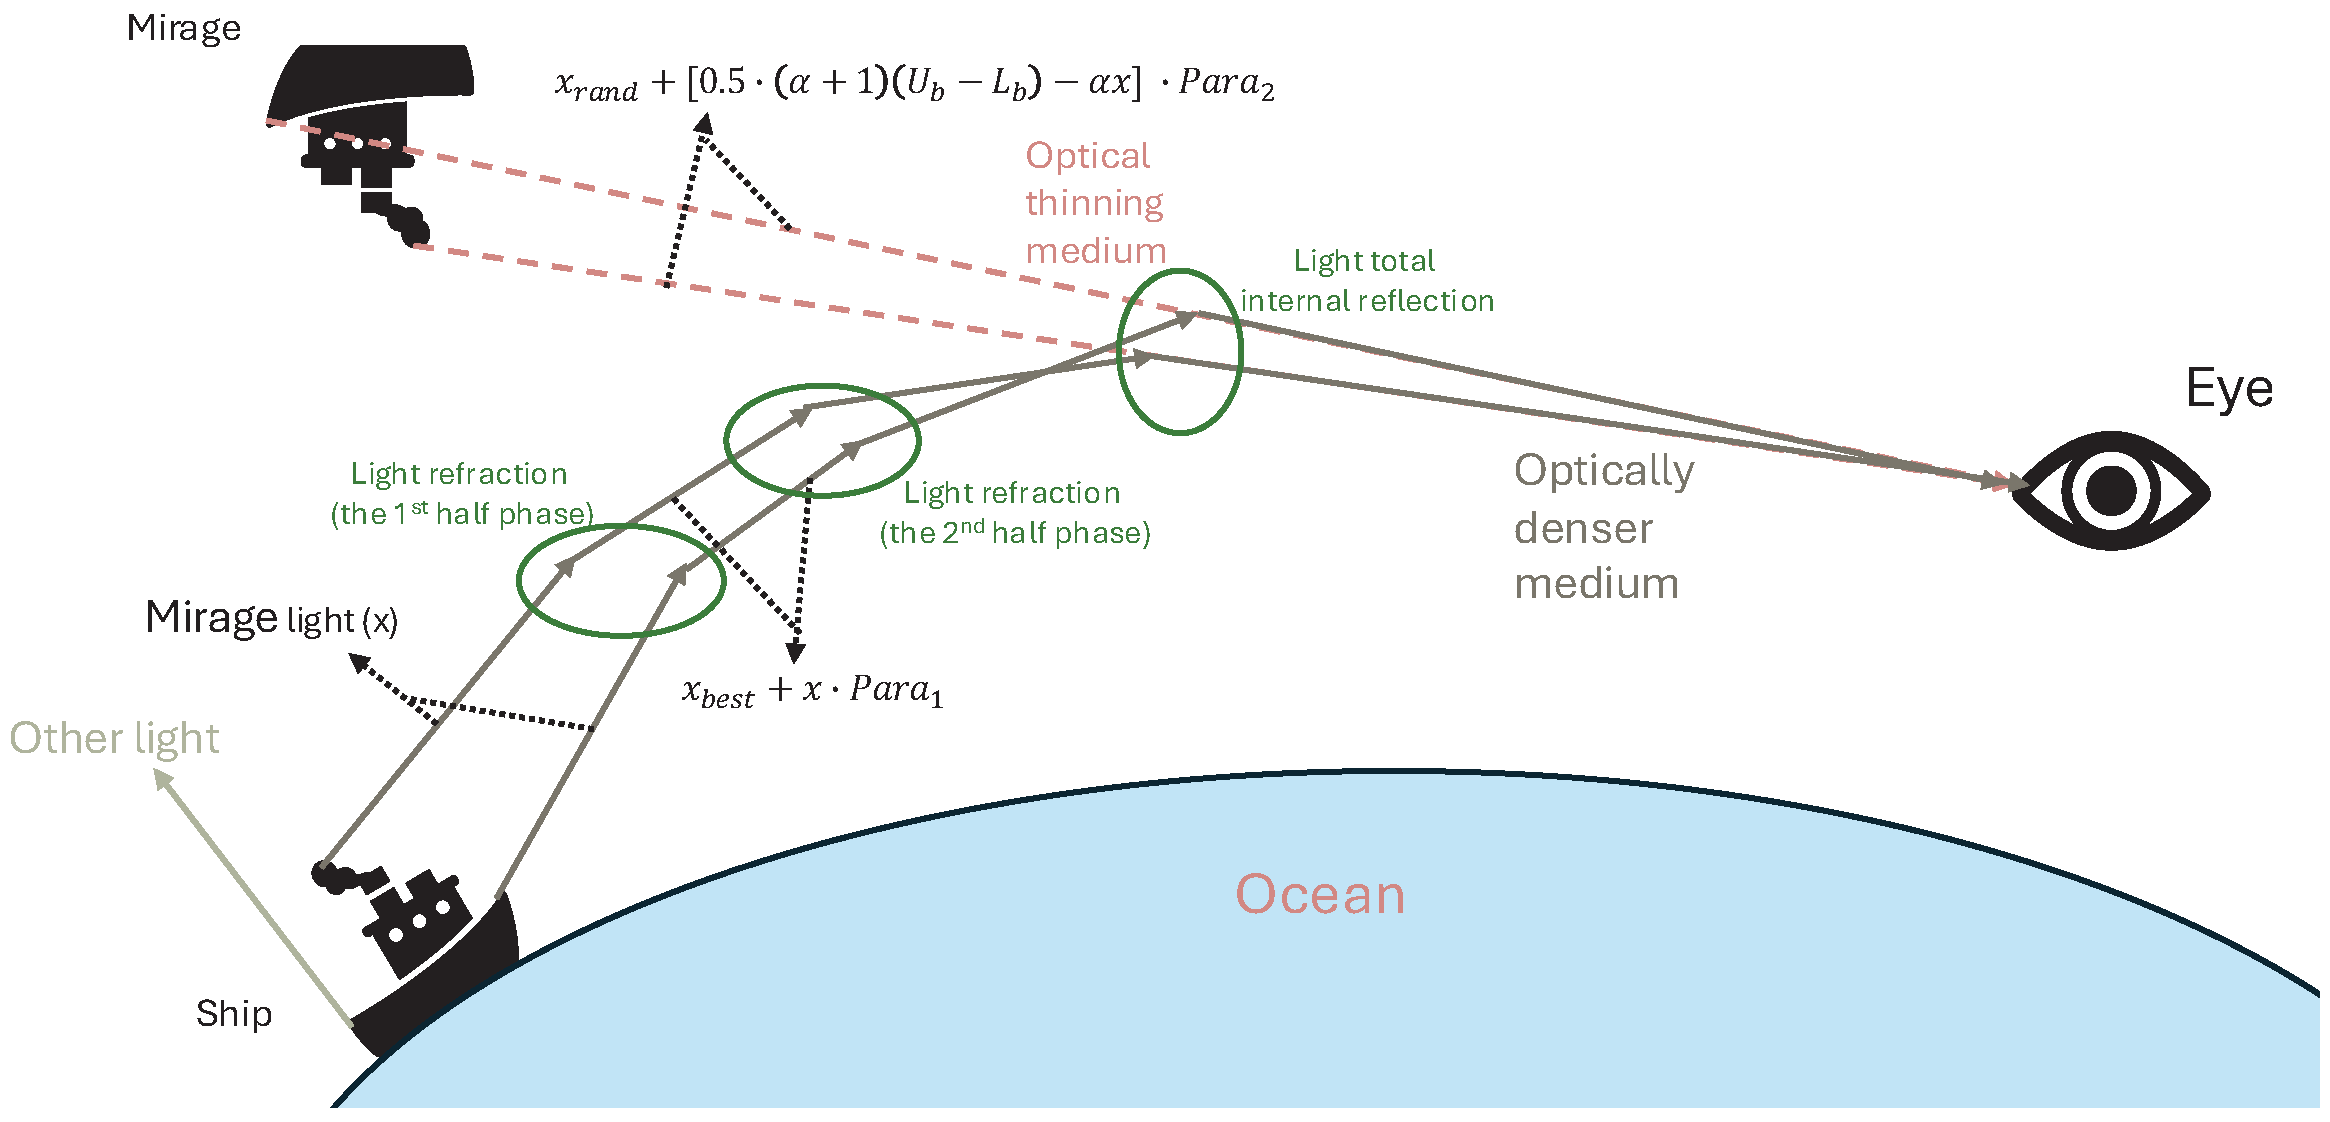
Figure 2. As illustrated in Figure 2, a ship emits two types of light in such a phenomenon. Most light (“other light” in Figure 2) does not undergo significant refraction during propagation and, thus, fails to produce visible mirages. In contrast, a distinct class of light becomes strongly refracted when passing through air layers with density gradients, ultimately forming observable mirage images. This light is referred to as mirage light in this study. Effective discrimination between these two light types is essential for identifying the global optimum ( x best 
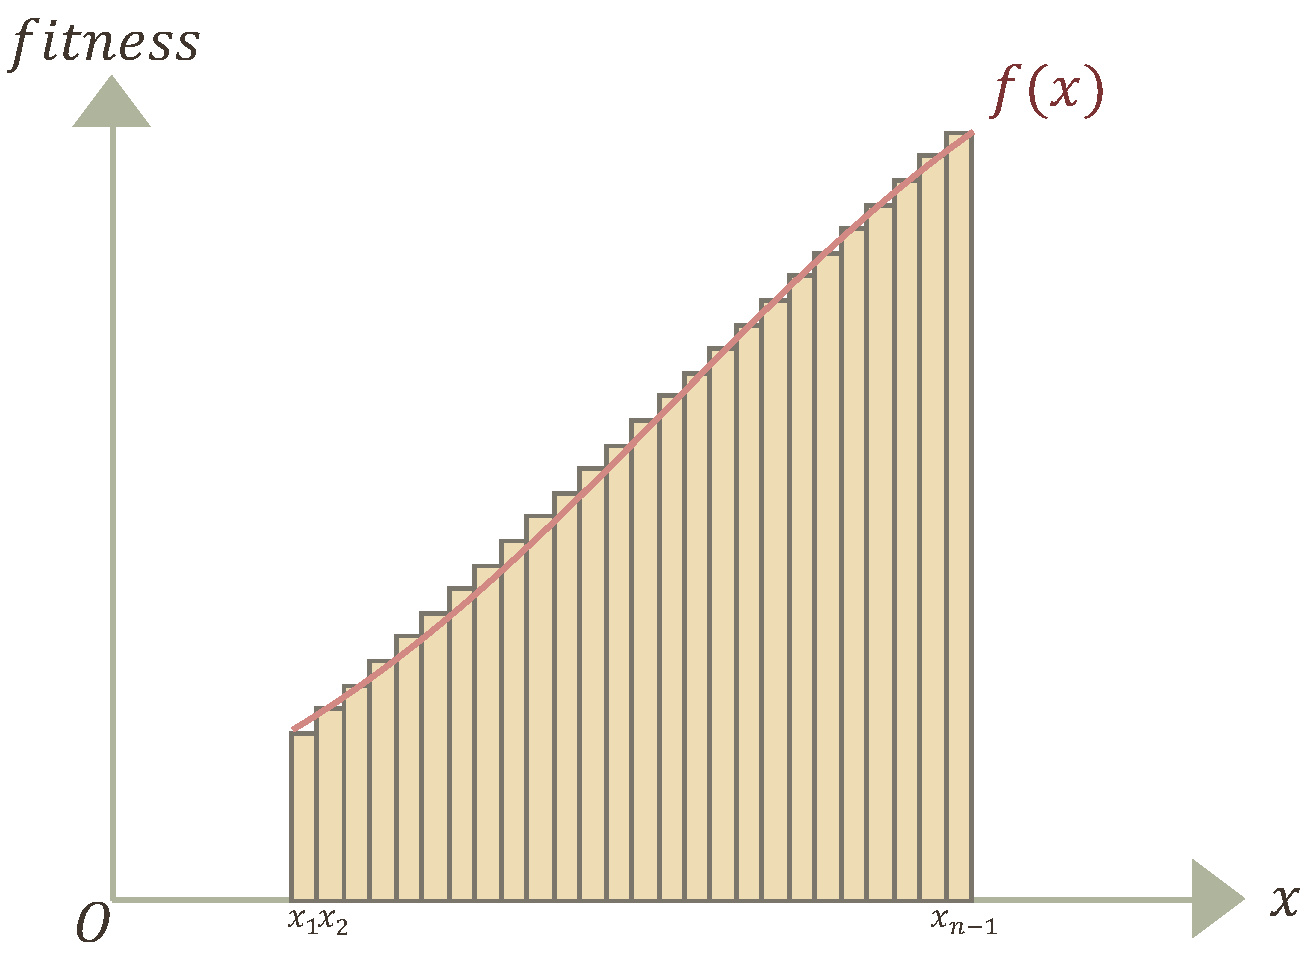
) during the optimization process. To this end, the FATA algorithm introduces a light-beam quality evaluation mechanism based on definite integral theory to assess the overall adaptability of the population. First, the FATA algorithm calculates the fitness of each individual according to the defined fitness function and ranks the population accordingly, as shown in Figure 3. Then, following the principles of definite integration (see Equations (12) and (13)), the FATA algorithm performs integration over the individual fitness curve ( f ( x ) ) to compute the population’s adaptive area (S) and uses Equation (14) to select high-quality individuals for the subsequent evolutionary process. As shown in Figure 2 and Figure 4, the FATA algorithm applies differentiated strategies to distinct light populations: For a random number ( rand > P ), the light group is considered to have traversed a non-uniform medium and, thus, possesses guiding capability. In this case, the population is re-initialized using Equation (15) to enhance search diversity. Otherwise, the light is assumed to have followed non-refracted paths, and the algorithm invokes the individual search strategy derived from light propagation principles to update positions and guide the population toward locally optimal regions.
y = f ( x ) = j = 0 n c j φ j x ,
where c j and φ j are parameters.
s = a b f ( x ) d x b a n · y 0 + y 1 2 + y 1 + y 2 2 + + y n 1 + y n 2 .
This is the population quality fitting function ( f ( x ) ), with points on the curve expressed as ( x i , y i ) and i [ 1 , n ] .
P = S S w o r s t S b e s t S w o r s t ,
where P is the quality factor of the light population, S w o r s t represents the quality of the worst population, and S b e s t represents the quality of the best population.
x i next = L b + ( U b L b ) · r a n d , r a n d > P ,
where x is the light individual, x n e x t is the new individual, U b represents the upper limit of the individual position, and L b represents the lower limit of the individual position.
In the FATA algorithm, the light propagation principle is executed after the mirage light-filtering phase and serves as the core strategy for individual-level search. It is designed to facilitate local exploitation within the search space and uncover potential local optima. As illustrated in Figure 4, light selected from the filtering stage is emitted from the source point and undergoes a sequence of refraction and reflection behaviors. This process defines three core local search mechanisms in the FATA algorithm: Refraction Phase I, Refraction Phase II, and Total Internal Reflection. These behaviors collectively enable the algorithm to coordinate exploration and convergence within local neighborhoods.
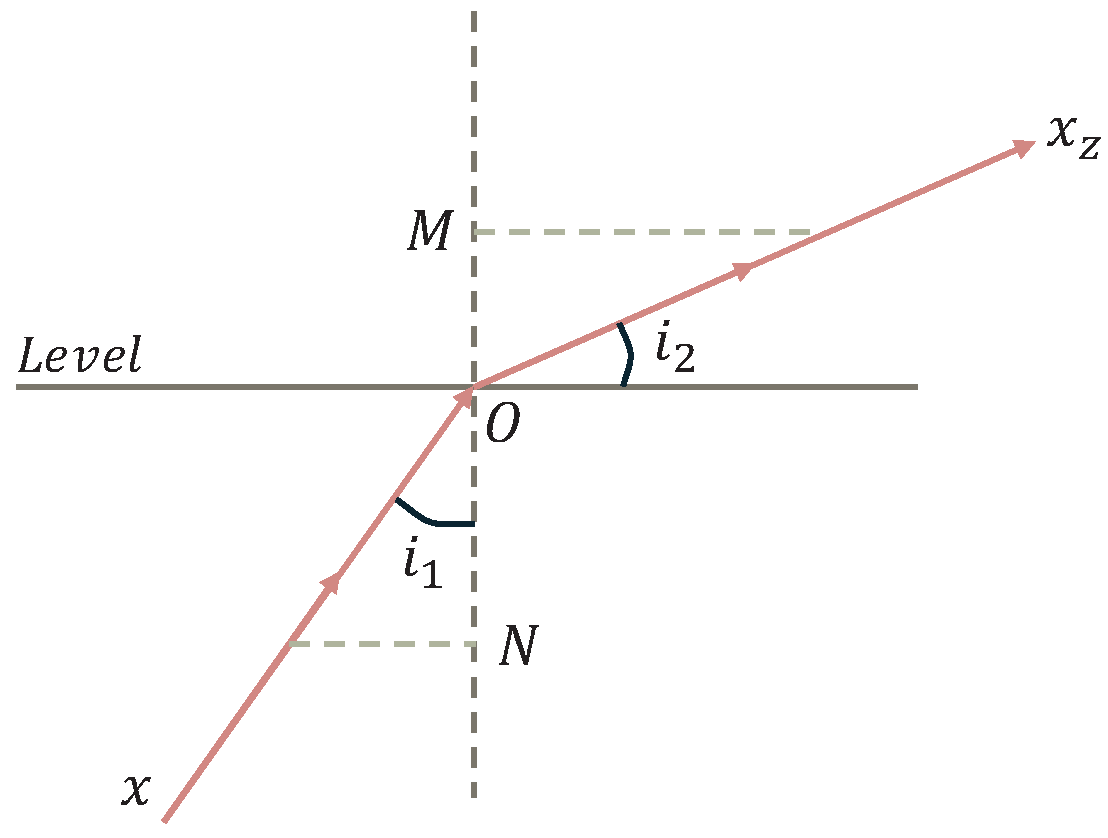
Refraction Phase I. In the initial phase, the individual light (x) propagates from an optically dense medium into a less dense medium, undergoing its first refraction due to the non-uniform refractive index of the environment. This process alters the light’s direction vector and propagation intensity, which corresponds to the generation of a new candidate solution within the search space. As illustrated in Figure 5, the incidence angle ( i 1 ) is smaller than the refraction angle ( i 2 ), indicating an outward expansion in the search direction. In this phase, the FATA algorithm updates the individual’s position based on Equations (16), (17) and (20) and applies a partial reflection strategy to modulate the search range.
x i next = x best + x i · P a r a 1 , r a n d P and r a n d < q ,
where x b e s t is the current best individual.
P a r a 1 = sin ( i 1 ) C · cos ( i 2 ) = tan ( θ ) ,
where i 1 is the incidence angle and i 2 is the refraction angle.
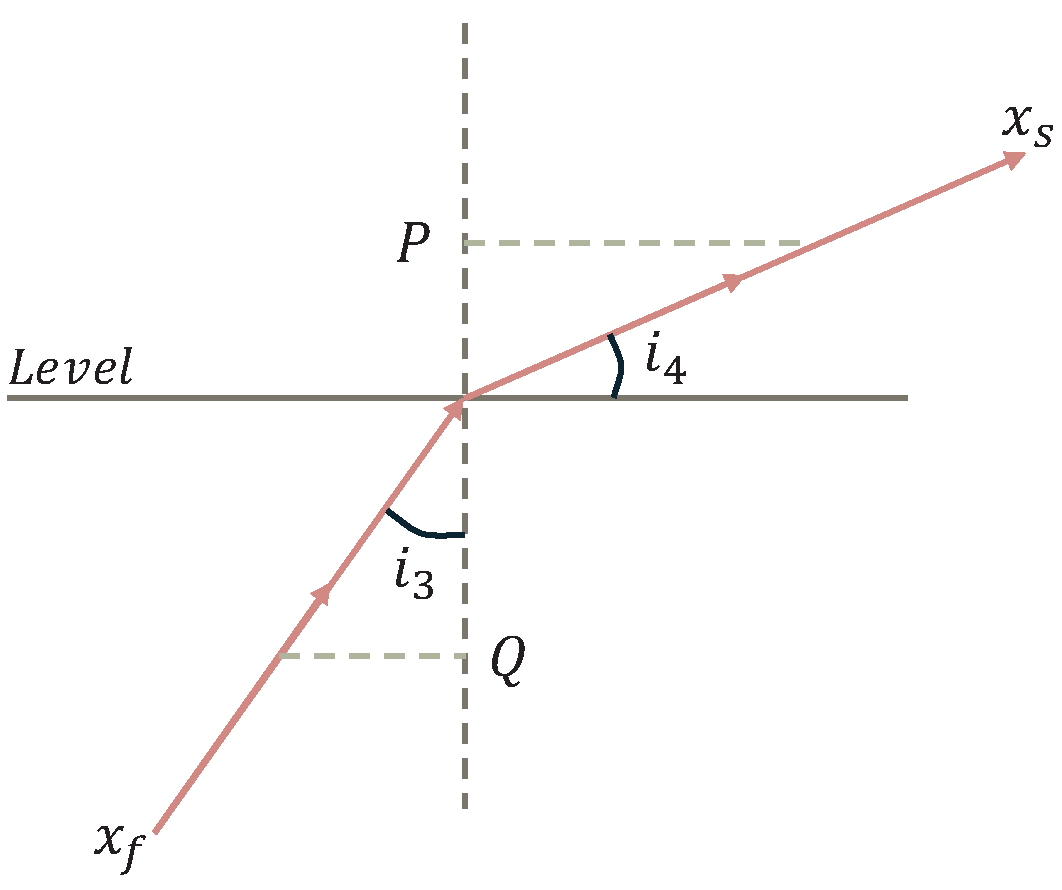
Refraction Phase II. After the initial refraction phase, the light undergoes a second refraction at a randomly selected position to further adjust its propagation direction. As illustrated in Figure 6, the incidence angle ( i 3 ) remains smaller than the refraction angle ( i 4 ), and the refraction index parameter (Para2) is dynamically adjusted in response to the continuous change in medium density. In this strategy, the FATA algorithm generates a new individual ( x next ) based on the current light ( x f ) and a randomly selected individual ( x rand ) from the search space, with the aim of enhancing local perturbation and search diversity. This process is described by Equations (18)–(20).
x i next = x rand + 0.5 · ( α + 1 ) ( U b L b ) α x i · P a r a 2 , r a n d P and r a n d q ,
where x r   and denotesrandom individuals and α is the reflectance of the reflection strategy, which controls the pattern of change in the light individual.
P a r a 2 = cos ( i 5 ) C · sin ( i 6 ) = 1 tan ( θ ) ,
where i 5 is the incidence angle and i 6 is the reflection angle.
q = f i t i f i t worst f i t best f i t worst ,
where q is the individual quality factor, f i t i represents the fitness of the current individual (x), f i t w o r s t represents the fitness of the worst individual, and f i t b e s t represents the fitness of the best individual.
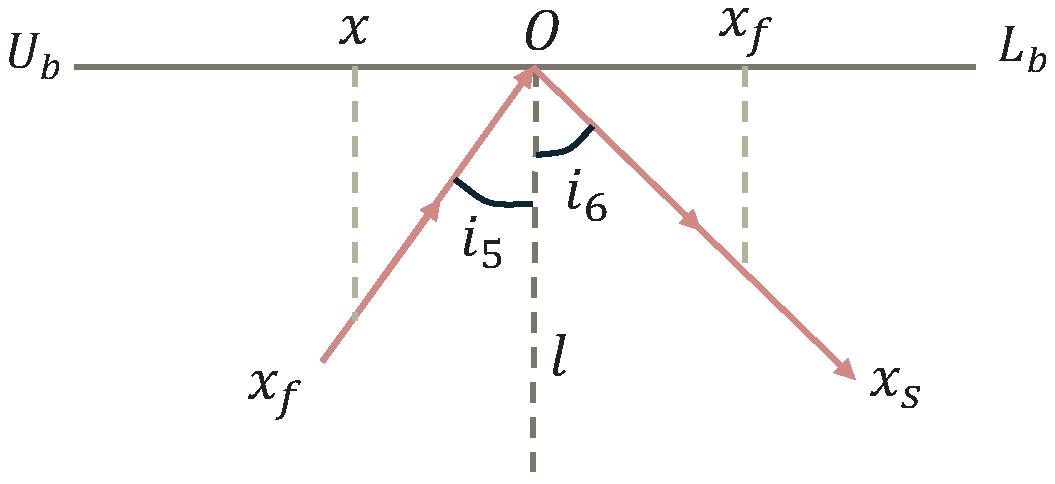
Total Internal Reflection. When the refraction angle gradually increases beyond the critical angle, the light undergoes total internal reflection within the non-uniform medium and is redirected in the opposite direction. This mechanism constitutes the third-phase search strategy in the FATA algorithm, encouraging the population to migrate toward unexplored regions, thereby enhancing the algorithm’s global search capability. As shown in Figure 7, the incidence angle ( i 5 ) equals the reflection angle ( i 6 ), demonstrating the directional symmetry of the reversal. In the figure, point O ( x 0 , 0 ) denotes the center of the search interval [ L b , U b ] , and points E and F represent the horizontal projections of the incidence and reflection points, respectively. Under this strategy, individual x is transformed into x next and redirected in the opposite direction to ensure escape from local optima. This process is defined by Equations (21)–(24).
x i next = x f = 0.5 · ( α + 1 ) ( U b + L b ) α x ,
where x f is the individual reflected by the total internal reflection strategy.
α = F E ,
where E and F are the distances of the incident and refracted light to the horizontal plane, respectively.
x 0 x f = F · ( x x 0 ) E ,
x 0 = U b L b 2 + L b = U b + L b 2 .

3.3.2. MOFATA

As the FATA algorithm was originally designed as a single-objective optimization algorithm, it lacks the capacity to simultaneously address multiple critical goals in complex network defense tasks—such as preserving benign traffic, intercepting malicious flows, and balancing resource loads. To overcome this limitation, we extend its original loss formulation to a four-dimensional objective vector, which shown in Equation (25), representing distinct dimensions of system performance. Specifically, f 1 ( x ) 
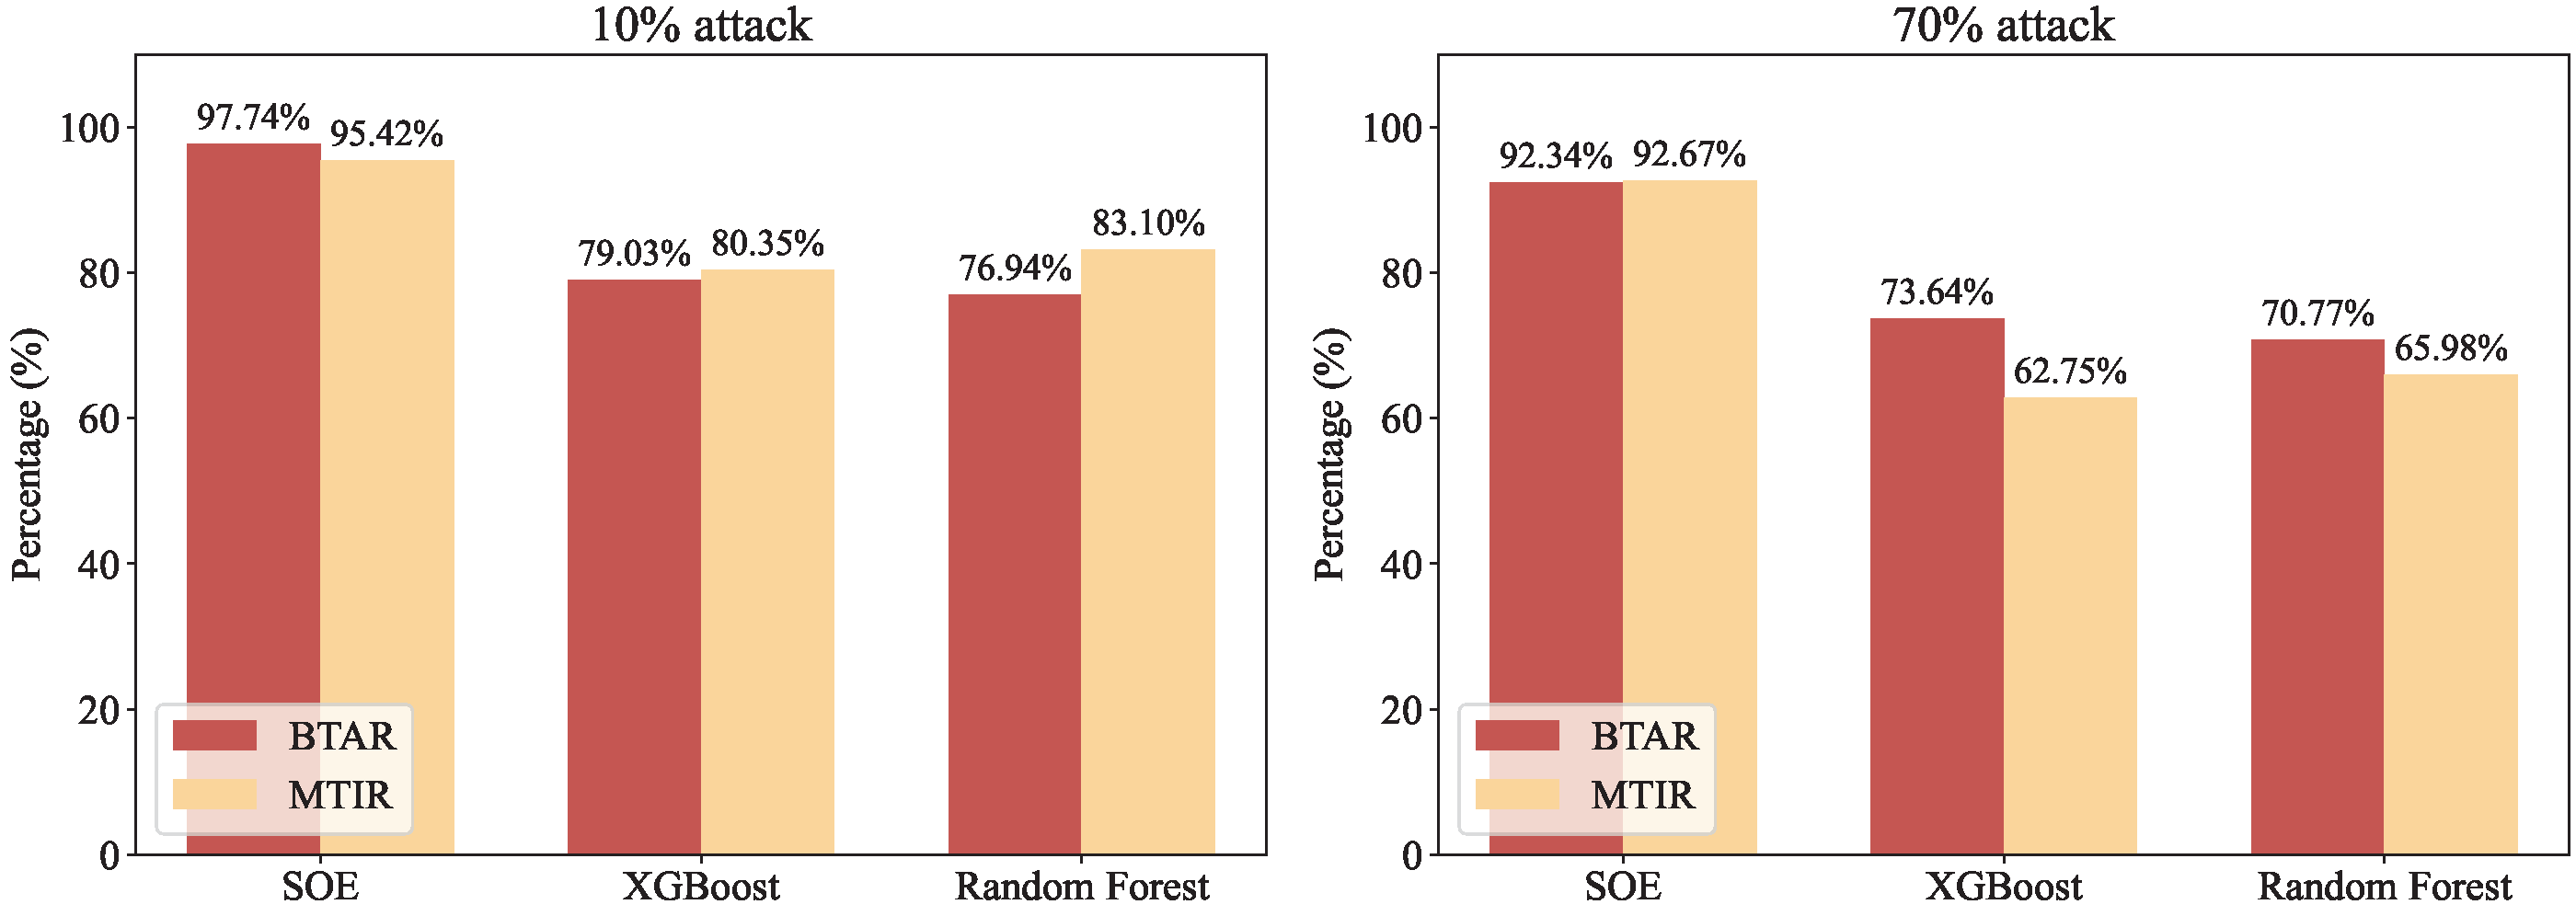
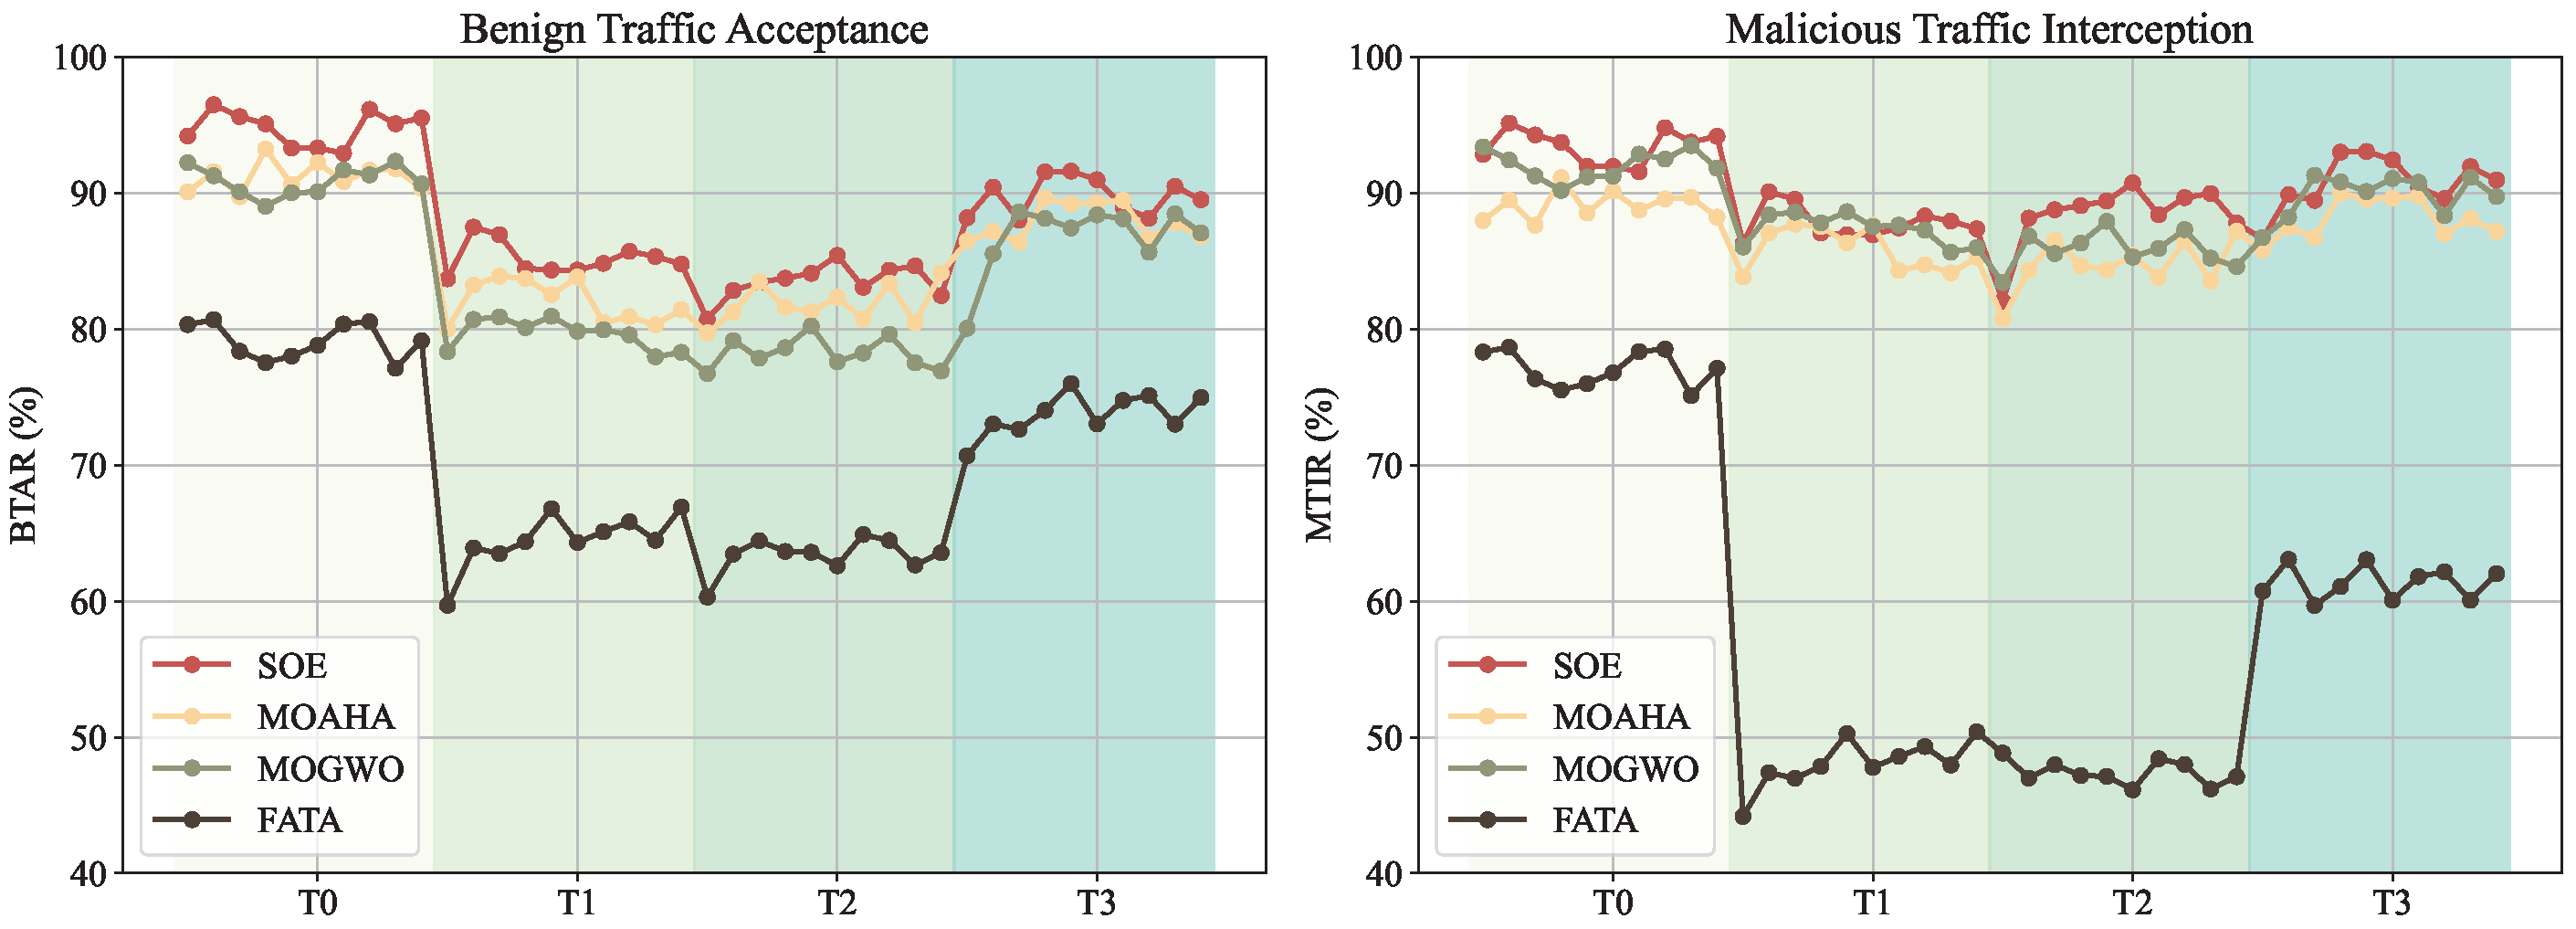
measures the effectiveness of benign traffic servicing, f 2 ( x ) 
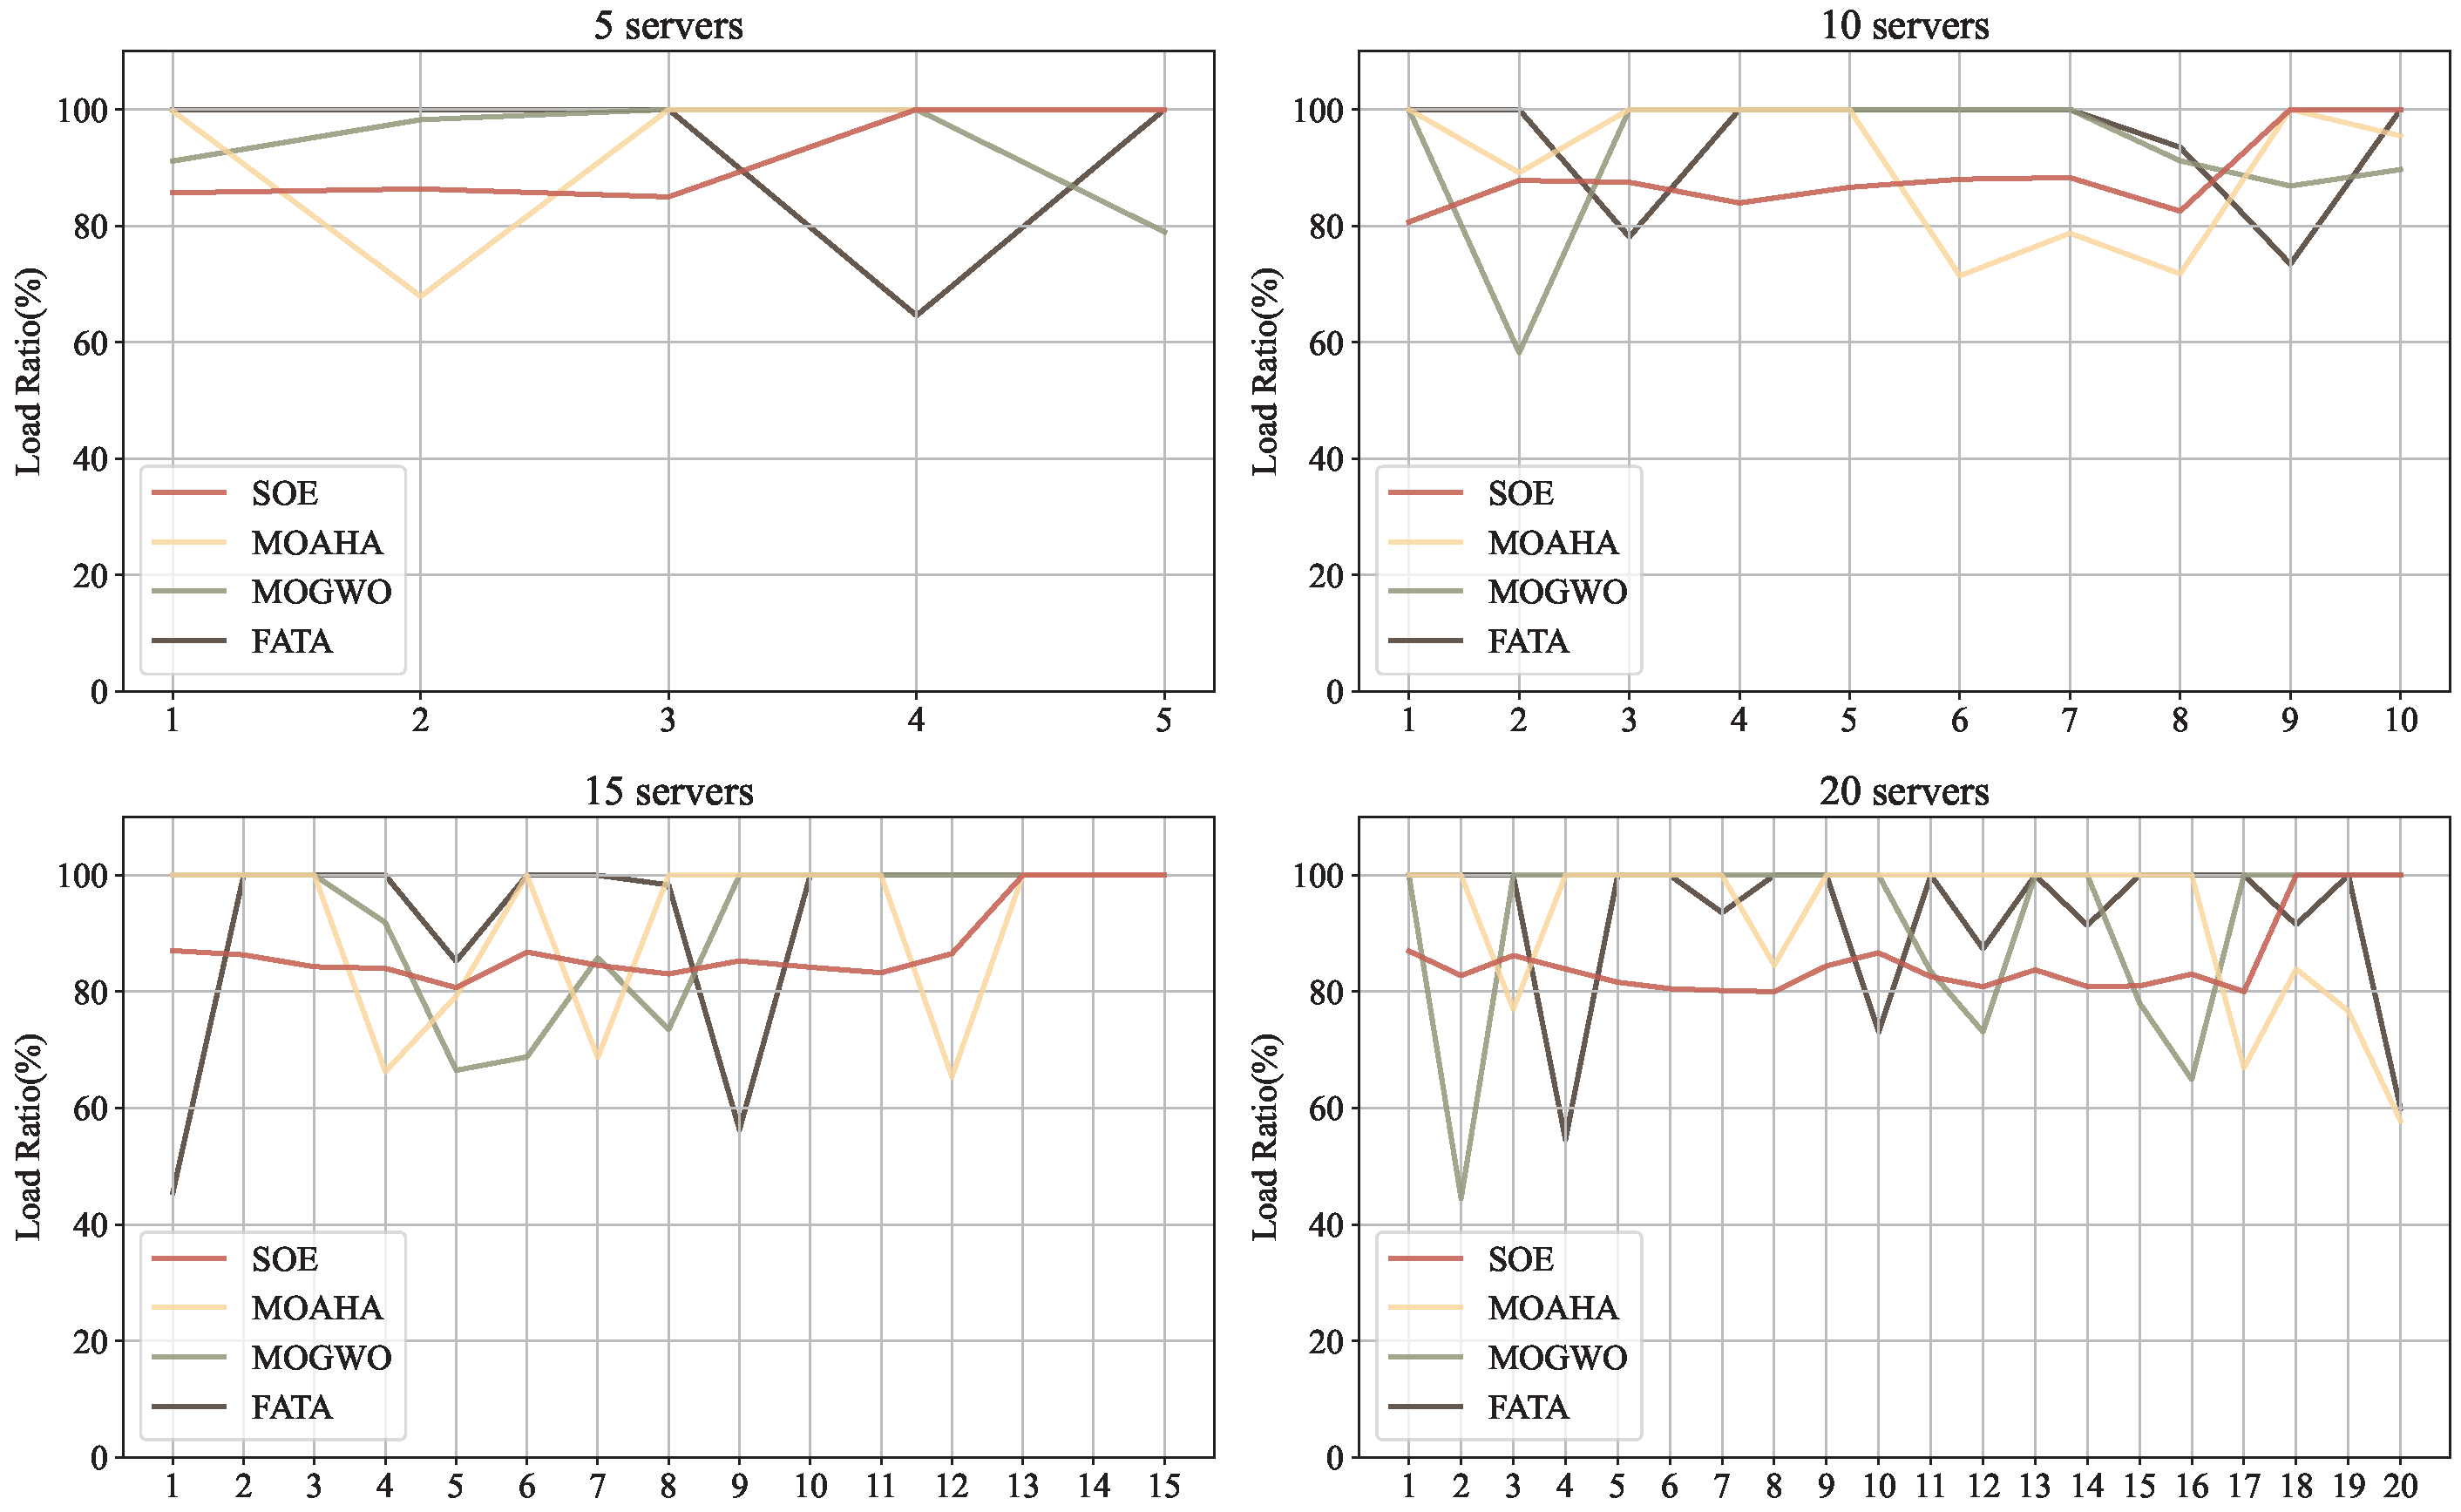
quantifies the degree of load imbalance across servers, f 3 ( x ) and f 4 ( x ) capture the proportion of benign traffic and malicious traffic that is allowed to pass through, and f 5 ( x ) assesses the system’s ability to isolate malicious traffic. This vectorized formulation unifies multiple performance metrics into a dimensionless mathematical representation, allowing the problem to be rigorously addressed under a multi-objective optimization framework.
f ( x ) = [ f 1 ( x ) , f 2 ( x ) , f 3 ( x ) , f 4 ( x ) , f 5 ( x ) ] .
In SOE, each candidate solution is initially represented as a discrete N-dimensional vector ( x Ω ), as shown in Equation (26), indicating the assignment of traffic source i to one of M servers. This discrete representation faithfully reflects the inherently discrete nature of real-world resource allocation decisions. However, to leverage the efficient global search capabilities of the FATA algorithm in continuous domains, we relax the discrete decision variables by mapping each x i to a continuous variable defined over the interval of [ 1 , M ] . The search and update processes are performed in this relaxed continuous domain, after which the solution is discretized via rounding to generate executable scheduling schemes.
x = [ x 1 , x 2 , , x N ] , x i 1 , 2 , , M .
To achieve effective trade-offs among multiple conflicting objectives, the concept of Pareto optimality is introduced. A multi-objective solution set is constructed through a non-dominated sorting mechanism. Specifically, in the continuous search domain, each candidate solution (x) corresponds to an objective vector as defined in Equation (27).
F ( x ) = f 1 ( x ) , f 2 ( x ) , , f m ( x ) ,
where each objective function ( f i ( x ) ) represents performance dimensions such as benign traffic assurance, malicious traffic interception, load balancing, and attack isolation.
According to the classical Pareto dominance rule, for any two solutions (x and y), x is said to dominate y (denoted by x y ) if Equations (28) and (29) hold.
f i ( x ) f i ( y ) for all i ,
f j ( x ) < f j ( y ) for at least one j .
To enhance the algorithm’s ability to discriminate fine-grained performance differences and avoid premature convergence or policy degeneration, we incorporate the concept of ϵ -dominance. Under this strategy, a solution x ϵ -dominates solution y only if Equation (30) holds:
f i ( x ) f i ( y ) + ϵ for all i , and j : f j ( x ) < f j ( y ) ϵ .
Based on these principles, non-dominated sorting is applied to partition the population into multiple Pareto fronts. Tournament selection and crowding distance mechanisms are subsequently used to maintain solution diversity and promote a well-distributed set of high-quality solutions across all objectives. This hybrid approach effectively combines the discrete characteristics of the scheduling decision with the powerful search capability of continuous optimization. The integration of ϵ -dominance further enhances the global exploration capacity and fine-resolution performance discrimination of the proposed MOFATA algorithm. The pseudocode of MOFATA is presented as Algorithm 1:
Algorithm 1 MOFATA: Multi-objective Extension Based on FATA
Require: 
P o p S i z e : population size;
M a x G e n : maximum generations;
F i t n e s s ( x ) = [ f 1 ( x ) , f 2 ( x ) , , f 5 ( x ) ] : multi-objective fitness function;
ε : ε -dominance threshold;
M: number of servers;
FATA() function (baseline optimizer)
Ensure: 
Final Pareto front of discrete scheduling vectors
  1:
Initialize population { x i R N i = 1 , , P o p S i z e } via FATA()
  2:
for all  x i in population do
  3:
    Evaluate fitness vector f ( x i )
  4:
end for
  5:
Perform non-dominated sorting → obtain initial Pareto front P 0
  6:
for  t = 1 to M a x G e n  do
  7:
    Execute one FATA generation to update population { x i }
  8:
    for all  x i in population do
  9:
        Discretize x i by rounding to nearest integer in [ 1 , M ] N
10:
        Evaluate multi-objective fitness f ( x i )
11:
    end for
12:
    Apply ε -dominance filtering and non-dominated sorting
13:
    Use crowding distance to maintain diversity
14:
    Update Pareto front with current non-dominated individuals
15:
end for
16:
return Final Pareto front

4. Algorithmic Analysis

4.1. Time Complexity Analysis

Unlike classical deterministic optimization algorithms, metaheuristic and multi-objective heuristic methods such as MOFATA do not provide theoretical guarantees of convergence to the global optimum within a fixed number of iterations. This inherent uncertainty arises from the reliance on stochastic search operators—such as mutation, crossover, and random selection—as well as the highly complex and rugged nature of the solution landscape. As a result, the number of generations required to reach an optimal or near-optimal solution can vary dramatically across problem instances and is generally unpredictable. Without a provable convergence bound, it becomes infeasible to derive a closed-form expression for the overall algorithmic time complexity from initialization to the global optimum. Therefore, the standard practice in the analysis of such algorithms is to focus on the computational complexity per generation. By decomposing the main computational components executed in each generation, we can provide a detailed estimation of MOFATA’s per-generation time complexity. This approach enables a practical evaluation of the algorithm’s scalability and helps to identify potential computational bottlenecks in large-scale or high-concurrency deployment scenarios.
Let P, N, and M denote the population size, the number of traffic sources (decision variables), and the number of servers, respectively. The key computational components per generation are summarized as follows:
  • Fitness Evaluation: Each individual represents a scheduling decision vector of length N, mapping traffic sources to servers. Evaluating a single individual involves computing four objectives: BTAR, MTIR, Load Imbalance Degree (LID), and traffic isolation ability. Each of these objectives requires the aggregation of server-level statistics over all N sources. Thus, the per-individual cost is O ( N ) , and the total cost for the population is O ( P · N ) .
  • Non-Dominated Sorting: MOFATA adopts the fast non-dominated sorting algorithm introduced in NSGA-II, which has an average-case complexity of O ( M · P 2 ) , where M is the number of objectives. This operation identifies Pareto fronts used for survival selection.
  • Crowding Distance Assignment: For each objective, solutions are sorted to compute crowding distances, contributing O ( M · P log P ) to the per-generation cost.
  • Selection and Variation: Tournament selection and crossover/mutation operations scale linearly with P, yielding O ( P ) complexity, which is relatively negligible compared to the above.
Therefore, the total time complexity per generation is approximated as Equation (31). This theoretical estimation forms the basis for the empirical scalability evaluation presented in Section 4.2.
O ( P · N + M · P 2 ) .

4.2. Scalability Analysis

To validate the theoretical complexity estimates presented in Section 4.1, we conducted a series of scalability experiments under varying problem sizes. Specifically, we examined how increasing the number of traffic sources (N) and the number of servers (M) affects the computational cost and optimization performance of MOFATA. We tested MOFATA with a fixed population size of P = 30 and varied N { 5000 , 10 , 000 , 20 , 000 , 30 , 000 } and M { 10 , 100 , 500 , 1000 } . Each configuration was run for 50 generations, and we recorded the average per-generation runtime, as well as the final values of the BTAR and MTIR, as well as solution-set quality metrics such as the Generational Distance (GD) [29], Inverted Generational Distance (IGD) [29], ϵ indicator ( ϵ ) [30], and spacing [29], which measure convergence to the true front, coverage of the true front, worst-case domination gap, and the distribution uniformity of the obtained solutions, respectively. The quality metrics are explained as follows:
  • The generational distance (GD) measures the average Euclidean distance from each solution in the obtained solution set (S) to the nearest point on the true Pareto front ( P * ). It is defined as follows:
    GD = 1 | S | i = 1 | S | d i 2 ,
    where | S | denotes the number of solutions in S and d i = min p * P * s i p * represents the minimum Euclidean distance from solution s i S to any point ( p * P * ). A lower GD value indicates better convergence to the true Pareto front.
  • The inverted generational distance (IGD) computes the average distance from each point in the reference front ( P * ) to its nearest member in the obtained solution set (S):
    IGD = 1 | P * | j = 1 | P * | min x S x p j * ,
    where | P * | is the number of points in P * and p j * denotes the j-th point of P * . Lower IGD values indicate both better convergence and diversity.
  • The epsilon indicator ( ϵ ) reflects the minimum additive value ( ϵ ) required such that every point in the reference front ( P * ) is weakly dominated by at least one point in the obtained set (S). Formally,
    ϵ = inf ϵ R p * P * , s S : f i ( s ) f i ( p * ) + ϵ , i ,
    where f i ( · ) denotes the i-th objective function. A smaller ϵ value implies stronger dominance of S over P * .
  • Spacing quantifies the distribution uniformity of solutions in S:
    Spacing = 1 | S | 1 i = 1 | S | d i d ¯ ,
    where d i = min s j S , j i s i s j is the minimum distance from s i to its nearest neighbor in S and d ¯ is the mean of all d i . Smaller Spacing values indicate more uniform distribution.
As shown in Figure 8, the average per-generation runtime remained nearly constant in the smaller-scale settings ( N = 5000 , M = 10 and N = 10 , 000 , M = 100 ), despite the increase in problem size. This plateau effect can be attributed to the fact that the algorithm’s computational workload in these configurations does not fully utilize the available hardware resources—such as CPU cache, memory bandwidth, or thread-level parallelism. As a result, the measured runtime is primarily dominated by fixed system-level overheads rather than by the algorithm’s intrinsic complexity. In contrast, as the problem scale increases further (N = 20,000, M = 500 and N = 30,000, and M = 1000), the runtime begins to grow more significantly. In these larger settings, the computational demand likely exceeds the system’s resource saturation threshold, causing the runtime to better reflect the theoretical time complexity (Equation (31)). This observation confirms that MOFATA’s scalability becomes evident under high-concurrency conditions, where hardware utilization more accurately amplifies the cost of increasing decision and objective dimensions.
Despite the increase in runtime at larger problem scales, the key optimization metrics—BTAR and MTIR—remain stable, as illustrated in Figure 9. However, the solution-set quality, as assessed by GD, IGD, the ϵ indicator, and spacing, shows noticeable degradation as N and M grow. This is mainly because a larger and higher-dimensional search space makes it more difficult for a fixed-size population to cover the true Pareto front, resulting in reduced diversity and convergence. Nevertheless, this decline in solution-set quality does not significantly impact BTAR or MTIR. In practical scheduling, it is sufficient for the algorithm to consistently identify high-quality solutions in relevant regions of the objective space, even if global front approximation weakens. Thus, MOFATA remains robust and effective for real-world DDoS traffic scheduling, even as the problem scale increases.
These findings validate the complexity-driven scalability concerns raised in Section 4.1 but also highlight MOFATA’s resilience: even in large-scale settings, it continues to produce reliable scheduling outcomes. This robustness makes it suitable for real-time traffic control in dynamic DDoS environments.

4.3. Parameter Sensitivity Analysis

The proposed multi-objective framework introduces four control parameters— α , β , γ , and δ —each of which governs a distinct optimization objective:
  • α regulates the penalty for DI, encouraging uniform traffic distribution across servers.
  • β penalizes the acceptance of malicious traffic, promoting a more aggressive filtering strategy and increasing the MTIR.
  • γ penalizes the rejection of legitimate traffic, thereby favoring higher BTAR values.
  • δ incentivizes the isolation of malicious flows, encouraging the scheduler to concentrate attack traffic on a small set of designated isolation nodes, as reflected by the isolation effectiveness ( F i s o ).
A series of controlled experiments are conducted to examine the system’s sensitivity to each parameter. By varying one parameter at a time while holding the others fixed, we characterize the influence of each on key performance metrics, as shown in Table 1:
This analysis reveals two inherent conflicts among the optimization objectives. First, there exists a trade-off between security and availability governed by β and γ . Elevating β improves MTIR but lowers BTAR, while increasing γ has the opposite effect. Second, a similar tension exists between global load balancing and attack flow isolation, controlled by α and δ . While δ promotes the aggregation of malicious traffic into specific servers, enhancing attack containment, α enforces fairness and resists concentrated load allocation, thereby undermining the isolation effect.
Given these trade-offs, optimal parameter values depend on the specific deployment context. For instance, security-critical environments such as enterprise firewalls may prefer high β and δ values to aggressively suppress attacks and maximize isolation while setting γ lower to tolerate occasional service disruption. In contrast, availability-sensitive systems, such as e-government portals, benefit from high γ values and moderate α values, ensuring minimal service disruption while still preserving acceptable fairness. Balanced configurations, suitable for public cloud gateways, may set all parameters around mid-level values to maintain a compromise between conflicting objectives. Additionally, honeypot-based defensive setups may prioritize δ to maximize attack traffic aggregation, whereas service clusters under high load pressure may benefit from high α values to enforce a balanced load distribution.
To further elucidate the interactions between security and availability objectives, we constructed a dual-indicator heatmap based on the ( β , γ ) parameter pair, which directly governs the trade-off between MTIR and BTAR, as shown as Figure 10. In this visualization, each grid cell corresponds to a unique configuration of β and γ and encodes two performance metrics simultaneously: the upper portion of each cell represents the BTAR, while the lower portion indicates the MTIR. This layered encoding facilitates direct comparison of the competing objectives under varying parameter values. The heatmap reveals a distinct antagonism between the two metrics: higher β values generally enhance MTIR by encouraging more aggressive filtering, while higher γ values improve BTAR by making the scheduler more tolerant to ambiguous flows. However, it is evident that no single configuration simultaneously maximizes both. For instance, configurations with β = 0.9 and γ = 0.1 yield high MTIR but low BTAR, whereas β = 0.1 and γ = 0.9 exhibit the reverse. The intermediate region—where both parameters are set to moderate values—produces balanced trade-offs. This visual confirmation supports the necessity of Pareto-aware parameter tuning and emphasizes that prioritizing one objective inevitably involves compromise on the other.
As shown in Figure 11, the heatmap was constructed to investigate the interplay between global load balancing and malicious traffic isolation under varying settings of α and δ . Each cell in the heatmap encodes two key metrics: the upper portion represents the average load of isolation nodes, reflecting the degree to which malicious traffic is successfully concentrated; the lower portion represents the negated LID among non-isolation nodes, which serves as a proxy for benign load distribution fairness. The use of the negated LID ensures that, for both indicators, higher values consistently indicate more desirable outcomes, facilitating intuitive visual interpretation. This heatmap reveals a clear trade-off structure. As δ increases under low α values, the system tends to concentrate attack flows on a limited number of servers, which results in higher average isolation-node loads. However, as α increases, the scheduler begins to enforce stricter global balancing constraints, which undermines the isolation mechanism. In such cases, malicious traffic becomes partially redistributed, reducing the average load on isolation nodes.
In conclusion, the analysis visually confirms the presence of competing objectives within the proposed scheduling framework and reinforces the necessity of adaptive, scenario-aware parameter selection strategies for balancing system availability, security, and resource fairness under adversarial conditions.

5. Experiment

5.1. Experiment Setup

We constructed a simulated experimental environment in which a total of M servers were configured, each with a processing capacity of C. The experiments utilized authoritative DDoS attack datasets from the Kaggle platform [31], including several widely recognized subsets: CSE-CIC-IDS2018-AWS, CICIDS2017, and the CIC DoS Dataset (2016), comprising approximately 13 million traffic records in total. The parameter settings of the optimization algorithms are shown in Table 2. Two categories of comparison methods were included: (1) classical multi-objective optimization algorithms such as MOGWO [32] and MOAHA [33] and (2) the original single-objective FATA algorithm prior to our proposed enhancements. The experiments were designed to evaluate performance across three dimensions: (1) benign traffic acceptance rate and malicious traffic interception capability, (2) server load balancing and malicious traffic isolation, and (3) system responsiveness and stability under dynamic attack scenarios. For each experiment, both a single-objective fitness function and a composite fitness function were tested in order to assess the effectiveness of the composite formulation in optimizing overall system performance. All experiments were repeated five times, and the best result from each trial set was recorded as the basis for final evaluation.

5.2. Evaluation of Benign Traffic Acceptance Rate (BTAR) and Malicious Traffic Interception Rate (MTIR)

This experiment aims to evaluate whether SOE can significantly improve the benign traffic acceptance rate (BTAR) while effectively identifying and intercepting malicious traffic under DDoS attack scenarios, thereby ensuring both service quality and system security. A simulated DDoS attack environment was constructed, with attack traffic ratios set to 10%, 30%, 50%, and 70%. The system was deployed with 20 homogeneous server nodes, each having the same processing capacity, to approximate realistic server performance constraints. Benign and malicious traffic was generated according to predefined distributions. The total server processing capacity was set to be 1.2 times the total volume of benign traffic, while the addition of malicious traffic caused the total incoming requests to exceed system capacity, creating resource contention. To evaluate the model’s performance under steady-state attack conditions, both the total traffic volume and attack intensity were kept constant to ensure consistency and comparability across test scenarios.
Two key performance metrics were considered:
  • BTAR (Benign Traffic Acceptance Rate): This metric denotes the proportion of benign requests that are successfully scheduled and served, defined as Equation (36).
    BTAR = N legit , passed N legit , total ,
    where N legit , passed is the number of benign requests that received service and N legit , total is the total number of benign requests received by the system. A higher BTAR indicates fewer false negatives and stronger service continuity.
  • MTIR (Malicious Traffic Interception Rate): This metric evaluates the system’s ability to detect and block malicious traffic, defined as Equation (37).
    MTIR = N attack , blocked N attack , total ,
    where N attack , blocked denotes the number of malicious requests that were successfully intercepted and N attack , total is the total number of malicious requests that entered the system. A higher MTIR reflects stronger defense capability and more effective mitigation of service degradation caused by attacks.
As shown in Figure 12, under a low attack ratio of 10%, SOE successfully scheduled the majority of benign traffic to the appropriate target servers, achieving a BTAR of 97.74% and an MTIR of 95.42%. The remaining malicious traffic was minimal and could be absorbed by the residual system capacity. As the attack ratio increased to moderate intensity levels (30–50%), SOE still maintained high performance, with BTAR values of 95.42% and 93.85% and corresponding MTIR values of 93.12% and 95.24%, respectively. When the attack ratio reached 70%, part of the system’s resources were consumed by malicious traffic, resulting in some benign requests being dropped. Consequently, BTAR slightly decreased to 92.34% and MTIR to 92.67%, yet the overall performance still outperformed all comparison methods.
Furthermore, with the use of the composite fitness function, as shown in Figure 13, MOGWO, MOAHA, and FATA all exhibited significant performance improvements—BTAR increased by 4.99% to 19.10%, and MTIR improved by 3.65% to 30.63%. This demonstrates the effectiveness of the composite fitness function in enhancing an algorithm’s ability to optimize both BTAR and MTIR. Despite these improvements, SOE based on MOFATA consistently achieved superior results across all attack intensities. Compared to other multi-objective algorithms, it improved BTAR by 0.57% to 5.38% and MTIR by 0.09% to 4.08%. Relative to single-objective algorithms, the gains were even more pronounced—BTAR increased by 14.51% to 22.29% and MTIR by 14.93% to 41.73%.
In summary, SOE demonstrates strong robustness and adaptability across varying levels of attack intensity, effectively preserving benign traffic continuity while simultaneously identifying and suppressing malicious flows. Notably, even under high-intensity adversarial conditions, SOE maintained high scheduling efficiency and interception accuracy, validating its practical utility and superiority in DDoS mitigation scenarios. Additionally, the results show that regardless of the underlying optimization algorithm, the introduction of a composite fitness function consistently improves both BTAR and MTIR, further confirming the suitability of this formulation for traffic scheduling under DDoS attack conditions.

5.3. Evaluation of Load-Balancing Degree and Malicious Traffic Isolation Effect

This experiment aims to evaluate whether SOE can achieve effective traffic load balancing in multi-server environments, ensuring that, under low attack intensity, the defense strategy does not cause local bottlenecks or single-point overloads due to imbalanced resource allocation. Under high attack intensity, SOE should be able to concentrate malicious traffic onto a limited number of nodes, thereby preserving the service availability of critical servers for legitimate requests. In addition, the experiment investigates whether variations in the number of servers affect SOE’s scheduling performance, thereby assessing its scalability and stability under different resource scales. The experimental setup included configurations of 5, 10, 15, and 20 servers, with the malicious traffic ratio fixed at 10% and 70%. The primary metric of interest is the load-balancing degree, defined as the standard deviation of the loads across all servers, which reflects the overall equilibrium of the system. A smaller value indicates a more uniform load distribution across servers and a more effective scheduling strategy.
As shown in Figure 14, Figure 15, Figure 16 and Figure 17 and Table 3 and Table 4, under a 10% malicious traffic ratio, SOE consistently maintained good load balancing across different server network scales, with the standard load deviation ranging from 2.41 to 3.23. In contrast, when the composite fitness function was not applied, alternative methods exhibited significantly higher load variance, with standard deviations ranging from 8.74 to 24.01. After incorporating the composite fitness function, the load-balancing performance of MOAHA, MOGWO, and FATA improved, with their standard deviations reduced to the range of 2.91 to 11.41. Under high-intensity attack conditions (70% malicious traffic), SOE was able to strategically redirect residual, non-intercepted malicious traffic to a limited number of server nodes, which operated at full capacity to isolate the attacks. This approach preserved the remaining servers for normal service delivery. In contrast, other methods without load-balancing optimization failed to perform effective traffic redirection, leading to simultaneous overloads or even crashes across multiple servers. Experimental results showed that SOE achieved a standard load deviation of 6.23 to 7.03 under these conditions, outperforming most comparison algorithms. Even when enhanced with the composite fitness function, the standard deviation of other methods generally remained in the range of 5.22 to 8.59. After excluding the fully-loaded isolation nodes, SOE’s standard load deviation further decreased to 0.56 to 2.28, demonstrating its exceptional fine-grained load-balancing capability. In summary, SOE not only demonstrates effective load balancing under light attack conditions but also strategically sacrifices a small number of nodes under severe attacks to maintain overall system stability and service continuity. Its consistently superior performance across all standard load deviation evaluations highlights SOE’s intelligent scheduling capability and system resilience under extreme stress conditions.

5.4. Comparison with Supervised Learning-Based Models

To provide a comprehensive evaluation of SOE’s advantages in traffic scheduling, we incorporated two representative supervised learning algorithms—XGBoost and Random Forest—as machine learning baselines. Unlike conventional flow classification models, these baselines were trained to directly predict the target server assignment for each flow, learning a mapping from flow-level features to server indices. The experiments utilized the same real-world DDoS dataset as previous sections, with the data randomly partitioned into training (70%), validation (15%), and test (15%) subsets. Hyperparameter tuning was conducted on the validation set, and final performance was reported on the test set to ensure fairness and reproducibility. All models were evaluated in a five-server environment under two typical DDoS scenarios: a low-intensity attack (10% malicious traffic) and a high-intensity attack (70% malicious traffic). As shown in Figure 18, under the 10% attack scenario, XGBoost and Random Forest achieved BTAR values of 79.03% and 76.94%, respectively—substantially lower than SOE’s 97.74%—with corresponding MTIR values of 80.35% and 83.10%, compared to SOE’s 95.42%. In the 70% attack setting, their BTAR values dropped further to 73.64% and 70.77%, with MTIR values at 62.75% and 65.98%, both well below SOE’s 92.34% and 92.67%. Additionally, as shown in Table 5, analysis of the server load distribution revealed that both machine learning-based approaches often produced severe load imbalance, leaving certain nodes overloaded while others were underutilized, ultimately decreasing overall throughput. These results indicate that, while supervised learning models can partially approximate traffic scheduling, their effectiveness and robustness are significantly outperformed by the optimization-driven SOE framework, especially in complex and dynamic DDoS environments.
Although both models exhibited satisfactory predictive accuracy during training, their underlying structural design restricts their practical utility in real-world scheduling. Specifically, these methods lack explicit modeling of global coordination and system-level constraints, which are essential for effective multi-objective optimization in DDoS mitigation. As a result, their inference outputs, while often feasible at the individual flow level, fail to achieve robust trade-offs across competing objectives such as BTAR and MTIR. This limitation leads to suboptimal scheduling decisions, especially in complex or dynamic network environments. In contrast, the SOE framework employs a composite optimization approach that dynamically balances multiple objectives and adapts to changing attack patterns, resulting in consistently superior system-level performance.

5.5. Evaluation of Dynamic Scenarios

This experiment aims to evaluate the stability of SOE under dynamically changing DDoS attack environments. Specifically, it examines whether SOE can rapidly respond and promptly adjust its scheduling strategy in the presence of significant fluctuations in attack intensity or traffic patterns. Additionally, the experiment assesses whether the overall performance remains stable and whether the scheduling strategy avoids frequent or drastic oscillations—thereby validating SOE’s practicality and deployability in real-world scenarios. To this end, a time-evolving simulation scenario was designed, in which the attack process was divided into four representative stages to emulate typical conditions such as normal operation, peak attack periods, traffic pattern transitions, and attack mitigation phases. Within each stage, the proportion of malicious traffic fluctuates within a narrow range to better reflect the dynamic nature of real-world attack scenarios. At time T 0 , the system is in a normal or mildly attacked state, with the malicious traffic ratio fluctuating between 8% and 13%; at time T 1 , the attack intensity surges, initiating a peak attack phase (68–73%); at time T 2 , the attack sources change, leading to a sudden shift in the traffic distribution; and at time T 3 , the attack intensity drops significantly, returning to a relatively low level (28–33%). Throughout all stages, we continuously monitored SOE’s benign traffic assurance (BTAR) and malicious traffic interception capability (MTIR), with particular attention to performance fluctuations under dynamic conditions. To quantify this, the standard deviations of BTAR and MTIR within each stage were introduced as evaluation metrics, capturing the system’s scheduling stability under abrupt variations.
In the dynamic scheduling experiments, we pre-trained nine models, each corresponding to a specific malicious traffic ratio ( r k 10 % , 20 % , , 90 % ). At runtime, SOE continuously estimates the current attack intensity ( r t ) and selects the model whose pre-trained ratio ( r k ) is closest to r t . This similarity matching is achieved by rounding r t to the nearest available r k , ensuring the scheduling strategy remains closely aligned with the current attack level. While this nearest-neighbor matching was adopted for experimental consistency, the framework can be easily extended to finer granularity to further enhance adaptability in real-world deployments.
k * = arg min k r t r k , r k { 0.1 , 0.2 , , 0.9 }
As shown in Figure 19 and Table 6, across the four stages ( T 0 to T 3 ), SOE maintained a BTAR ranging from 80.72% to 96.49% and an MTIR between 82.05% and 94.17%. Within each stage, the standard deviation of BTAR ranged from 1.15 to 1.34, and that of MTIR ranged from 1.15 to 2.28. This indicates that while SOE exhibited a slight performance drop immediately following the initial malicious traffic shift in each stage, it was able to rapidly recover and improve performance in subsequent scheduling cycles. MOAHA and MOGWO, which also employed the composite fitness function, achieved relatively stable scheduling under the same scenario, but their BTAR and MTIR values were consistently lower than those of SOE. Furthermore, as shown in Figure 20, SOE responded to each change in attack conditions within one second, demonstrating its capability for real-time analysis and scheduling. In summary, SOE exhibited strong stability and adaptability under dynamically changing attack conditions. It consistently ensured both service quality and system security across all stages, highlighting its practical value and scheduling robustness in dynamic DDoS mitigation scenarios.

6. Conclusions and Discussion

This study proposes a novel scheduling engine—SchedOpt Engine (SOE)—designed for DDoS attack environments, with the goal of ensuring the continuous availability of benign traffic, even when traditional filtering mechanisms fail. The traffic scheduling problem is formulated as a multi-objective optimization task, targeting an optimal trade-off among four conflicting goals: maximizing the benign traffic acceptance rate (BTAR), maximizing the malicious traffic interception rate (MTIR), improving server load balancing, and enhancing malicious traffic isolation. To achieve this, a composite loss function was constructed that integrates the aforementioned objectives into a unified optimization framework using soft constraints. This avoids the rigidity associated with hard rules while ensuring strong penalization when benign traffic guarantees are insufficient. In terms of algorithm design, we developed a multi-objective optimization procedure based on an improved version of the FATA algorithm, referred to as MOFATA, which produces a set of Pareto-optimal scheduling strategies. These strategies offer network administrators a diverse set of scheduling options, allowing them to flexibly select the most appropriate performance trade-off according to system-specific priorities. Extensive simulations in near-realistic network environments demonstrate that SOE maintains high levels of BTAR and MTIR, even under high attack ratios, reflecting its strong adaptability in scheduling. Notably, SOE can redirect the majority of malicious traffic to a small subset of server nodes, sacrificing limited resources to preserve the operational integrity and efficiency of the remaining system. Furthermore, under dynamic attack scenarios, SOE is capable of promptly adjusting its scheduling strategies in response to rapid fluctuations in attack intensity, exhibiting excellent stability and adaptability. Overall, SOE advances both the theoretical modeling and practical algorithmic design of multi-objective traffic scheduling under DDoS conditions and provides a viable path toward building practical and scalable network defense solutions.
Although SOE demonstrates notable performance advantages in multi-objective scheduling optimization, it still exhibits certain limitations, particularly in terms of real-time responsiveness. As the algorithm requires multi-objective evaluations, non-dominated sorting, and fitness computations for a large number of candidate solutions in each iteration, its computational overhead increases substantially with the growth of network scale and attack intensity. In high-concurrency environments, where low-latency scheduling is essential, the current convergence efficiency may not suffice to guarantee real-time service continuity. Therefore, future work should focus on accelerating the optimization process by incorporating parallel computing frameworks, incremental fitness evaluation techniques, or model compression strategies to improve execution efficiency.
Moreover, current experiments are primarily based on simulation data. Although they span various malicious traffic ratios and network configurations, they still fall short of fully capturing the intricate and dynamic characteristics of real-world networks. To address this, a small-scale yet representative physical testbed is planned, featuring multiple server nodes, routing infrastructure, and traffic generation modules. By deploying both the attack simulation components and the scheduling engine within this platform, we aim to comprehensively evaluate SOE’s adaptability and defensive efficacy under realistic traffic flows, adversarial behaviors, and system-level disturbances. Furthermore, this platform will support a detailed analysis of the algorithm’s performance in terms of resource consumption, deployment complexity, and fault tolerance—providing a robust basis for engineering deployment and scalable adoption in real-world network environments.

Author Contributions

Conceptualization, M.Z.; methodology, M.Z.; software, X.M.; validation, X.M.; formal analysis, M.Z.; investigation, M.Z.; resources, Y.L.; data curation, M.Z. and X.M.; writing—original draft preparation, M.Z.; writing—review and editing, M.Z., X.M. and Y.L.; visualization, M.Z. and X.M.; supervision, Y.L.; project administration, Y.L.; funding acquisition, Y.L. All authors have read and agreed to the published version of the manuscript.

Funding

This research received Science and Technology Development Fund of Macau project 0096/2023/RIA2, 0123/2022/A3 and Science and Technology Research Project of Jiangxi Provincial Department of Education (GJJ2402602).

Data Availability Statement

The Ddos dataset is publicly available and can be accessed at [https://www.kaggle.com/datasets/devendra416/ddos-datasets] (accessed on 1 June 2025).

Conflicts of Interest

The authors declare no conflicts of interest.

References

  1. Neira, A.B.D.; Kantarci, B.; Nogueira, M. Distributed denial of service attack prediction: Challenges, open issues and opportunities. Comput. Netw. 2023, 222, 109553. [Google Scholar] [CrossRef]
  2. Yoachimik, O.; Pacheco, J. Record-Breaking 5.6 Tbps DDoS Attack and Global DDoS Trends for 2024 Q4, Cloudflare, 2024. Available online: https://blog.cloudflare.com/ddos-threat-report-for-2024-q4/ (accessed on 1 April 2025).
  3. Newman, S. The True Cost of a DDoS Attack, Corero, 2024. Available online: https://www.corero.com/true-cost-of-a-ddos-attack/ (accessed on 1 April 2025).
  4. Li, Q.; Huang, H.; Li, R.; Lv, J.; Yuan, Z.; Ma, L.; Han, Y.; Jiang, Y. A comprehensive survey on DDoS defense systems: New trends and challenges. Comput. Netw. 2023, 233, 109895. [Google Scholar] [CrossRef]
  5. Kamel, A.E.; Eltaief, H.; Youssef, H. On-the-fly (D)DoS attack mitigation in SDN using deep neural network-based rate limiting. Comput. Commun. 2022, 182, 153–169. [Google Scholar] [CrossRef]
  6. Dutta, M.; Krishna, C.R.; Kumar, R.; Kalra, M. (Eds.) Proceedings of International Conference on IoT Inclusive Life (ICIIL 2019), NITTTR Chandigarh, India; Lecture Notes in Networks and Systems; Springer: Singapore, 2020; Volume 116. [Google Scholar]
  7. Ali, W.; Fang, C.; Khan, A. A survey on the state-of-the-art CDN architectures and future directions. J. Netw. Comput. Appl. 2025, 236, 104106. [Google Scholar] [CrossRef]
  8. Applebaum, S.; Gaber, T.; Ahmed, A. Signature-based and machine-learning-based web application firewalls: A short survey. Procedia Comput. Sci. 2021, 189, 359–367. [Google Scholar] [CrossRef]
  9. Gelgi, M.; Guan, Y.; Arunachala, S.; Rao, M.S.S.; Dragoni, N. Systematic literature review of IoT botnet DDOS attacks and evaluation of detection techniques. Sensors 2024, 24, 3571. [Google Scholar] [CrossRef]
  10. Bonald, T.; Roberts, J. Scheduling network traffic. ACM Sigmetrics Perform. Eval. Rev. 2007, 34, 29–35. [Google Scholar] [CrossRef]
  11. Hamdan, M.; Hassan, E.; Abdelaziz, A.; Elhigazi, A.; Mohammed, B.; Khan, S.; Vasilakos, A.V.; Marsono, M.N. A comprehensive survey of load balancing techniques in software-defined network. J. Netw. Comput. Appl. 2021, 174, 102856. [Google Scholar] [CrossRef]
  12. Kaur, A. An overview of quality of service computer network. Indian J. Comput. Sci. Eng. (IJCSE) 2011, 2, 470–475. [Google Scholar]
  13. Islam, S. Network load balancing methods: Experimental comparisons and improvement. arXiv 2017, arXiv:1710.06957. [Google Scholar]
  14. Katevenis, M.; Sidiropoulos, S.; Courcoubetis, C. Weighted round-robin cell multiplexing in a general-purpose ATM switch chip. IEEE J. Sel. Areas Commun. 1991, 9, 1265–1279. [Google Scholar] [CrossRef]
  15. Mondal, R.K.; Nandi, E.; Sarddar, D. Load balancing scheduling with shortest load first. Int. J. Grid Distrib. Comput. 2015, 8, 171–178. [Google Scholar] [CrossRef]
  16. Ivanisenko, I.N.; Radivilova, T.A. Survey of major load balancing algorithms in distributed system. In Proceedings of the 2015 Information Technologies in Innovation Business Conference (ITIB), Kharkiv, Ukraine, 7–9 October 2015; IEEE: Piscataway, NJ, USA, 2015; pp. 89–92. [Google Scholar]
  17. Lee, H.-S.; Lee, J.-W. Adaptive transmission scheduling in wireless networks for asynchronous federated learning. IEEE J. Sel. Areas Commun. 2021, 39, 3673–3687. [Google Scholar] [CrossRef]
  18. Benzekki, K.; Fergougui, A.E.; Elalaoui, A.E. Software-defined networking (SDN): A survey. Secur. Commun. Netw. 2016, 9, 5803–5833. [Google Scholar] [CrossRef]
  19. Singh, S.; Jha, R.K. A survey on software defined networking: Architecture for next generation network. J. Netw. Syst. Manag. 2017, 25, 321–374. [Google Scholar] [CrossRef]
  20. Yu, Y.; Cheng, G.; Chen, Z.; Ding, H. A DDoS protection method based on traffic scheduling and scrubbing in SDN. In Proceedings of the 2021 17th International Conference on Mobility, Sensing and Networking (MSN), Exeter, UK, 13–15 December 2021; IEEE: Piscataway, NJ, USA, 2021; pp. 758–765. [Google Scholar]
  21. Thaler, D.; Hopps, C. Multipath Issues in Unicast and Multicast Next-Hop Selection; Technical Report; The Internet Society: Washington, DC, USA, 2000. [Google Scholar]
  22. Yen, J.Y. Finding the K shortest loopless paths in a network. Manag. Sci. 1971, 17, 712–716. [Google Scholar] [CrossRef]
  23. Ngo, M.V.; Chaouchi, H.; Luo, T.; Quek, T.Q.S. Adaptive anomaly detection for IoT data in hierarchical edge computing. arXiv 2020, arXiv:2001.03314. [Google Scholar]
  24. Deb, K.; Pratap, A.; Agarwal, S.; Meyarivan, T. A fast and elitist multiobjective genetic algorithm: NSGA-II. IEEE Trans. Evol. Comput. 2002, 6, 182–197. [Google Scholar] [CrossRef]
  25. Zitzler, E.; Laumanns, M.; Thiele, L. SPEA2: Improving the Strength Pareto Evolutionary Algorithm; Technical Report; ETH: Zurich, Switzerland, 2001. [Google Scholar]
  26. Roopak, M.; Tian, G.Y.; Chambers, J. Multi-objective-based feature selection for DDoS attack detection in IoT networks. IET Netw. 2020, 9, 120–127. [Google Scholar] [CrossRef]
  27. Sun, Y.; Li, Y.; Xiong, W.; Yao, Z.; Moniz, K.; Zahir, A. Pareto optimal solutions for network defense strategy selection simulator in multi-objective reinforcement learning. Appl. Sci. 2018, 8, 136. [Google Scholar] [CrossRef]
  28. Qi, A.; Zhao, D.; Heidari, A.A.; Liu, L.; Chen, Y.; Chen, H. FATA: An efficient optimization method based on geophysics. Neurocomputing 2024, 607, 128289. [Google Scholar] [CrossRef]
  29. Van Veldhuizen, D.A.; Lamont, G.B. Multiobjective evolutionary algorithm research: A history and analysis. Evol. Comput. 1998, 8, 125–147. [Google Scholar] [CrossRef] [PubMed]
  30. Zitzler, E.; Thiele, L.; Laumanns, M.; Fonseca, C.M.; Da Fonseca, V.G. Performance assessment of multiobjective optimizers: An analysis and review. IEEE Trans. Evol. Comput. 2003, 7, 117–132. [Google Scholar] [CrossRef]
  31. DDoS Dataset. Available online: https://www.kaggle.com/datasets/devendra416/ddos-datasets (accessed on 1 April 2025).
  32. Mirjalili, S.; Saremi, S.; Mirjalili, S.M.; Coelho, L.D.S. Multi-objective grey wolf optimizer: A novel algorithm for multi-criterion optimization. Expert Syst. Appl. 2016, 47, 106–119. [Google Scholar] [CrossRef]
  33. Zhao, W.; Zhang, Z.; Mirjalili, S.; Wang, L.; Khodadadi, N.; Mirjalili, S.M. An effective multi-objective artificial hummingbird algorithm with dynamic elimination-based crowding distance for solving engineering design problems. Comput. Methods Appl. Mech. Eng. 2022, 398, 115223. [Google Scholar] [CrossRef]
Figure 1. Illustration of the network topology. The network consists of N traffic sources and M identical-capacity servers. Each source (i) produces benign traffic ( L i ) and malicious traffic ( A i ).
Mathematics 13 01853 g001
Figure 2. Illustration of the mirage formation process.
Mathematics 13 01853 g002
Figure 3. The population fitness curve of the FATA algorithm.
Mathematics 13 01853 g003
Figure 4. Visualization of the FATA algorithm’s optimization process.
Mathematics 13 01853 g004
Figure 5. Illustration of refraction phase I, where i 1 is the incidence angle and i 2 is the refraction angle.
Mathematics 13 01853 g005
Figure 6. Illustration of refraction phase II, where i 3 is the incidence angle and i 4 is the reflection angle.
Mathematics 13 01853 g006
Figure 7. Illustration of total internal reflection, where i 5 is the incidence angle and the i 6 is reflection angle.
Mathematics 13 01853 g007
Figure 8. Average per-generation runtime under different problem scales. As the number of traffic sources (N) and servers (M) increases, the optimization time rises accordingly.
Mathematics 13 01853 g008
Figure 9. Illustration of BTAR and MTIR under different scales of number of traffic sources (N) and servers (M). Although the quality of the solution set begins to decline, excellent BTAR and MTIR values can still be maintained.
Mathematics 13 01853 g009
Figure 10. Parameter sensitivity analysis of β and γ . Darker colors represent superior performance. Parameter settings near the central region consistently achieve high BTAR and MTIR.
Mathematics 13 01853 g010
Figure 11. Parameter sensitivity analysis of α and δ . Darker colors indicate better performance. Parameter configurations near the central region yield consistently high levels of LID and attack traffic isolation effectiveness.
Mathematics 13 01853 g011
Figure 12. Illustration of BTAR and MTIR at varying attack ratios. Among them, MOAHA, MOGWO, and FATA employ a single-objective fitness function.
Mathematics 13 01853 g012
Figure 13. Illustration of BTAR and MTIR at varying attack ratios. All algorithms employ a composite fitness function.
Mathematics 13 01853 g013
Figure 14. Illustration of server load under a 10% malicious traffic proportion. Among them, MOAHA, MOGWO, and FATA employ a single-objective fitness function.
Mathematics 13 01853 g014
Figure 15. Illustration of server load under a 10% malicious traffic proportion. All algorithms employ a composite fitness function.
Mathematics 13 01853 g015
Figure 16. Illustration of server load under a 70% malicious traffic proportion. Among them, MOAHA, MOGWO, and FATA employ a single-objective fitness function.
Mathematics 13 01853 g016
Figure 17. Illustration of server load under a 70% malicious traffic proportion. All algorithms employ a composite fitness function. Note: for ease of comparison, fully utilized servers are arranged to the right in the tables.
Mathematics 13 01853 g017
Figure 18. Illustration of BTAR and MTIR at various attack ratios: comparison with XGBoost and Random Forest.
Mathematics 13 01853 g018
Figure 19. Illustration of BTAR and MTIR in a dynamic network environment.
Mathematics 13 01853 g019
Figure 20. Illustration of the response time of each algorithm.
Mathematics 13 01853 g020
Table 1. Influence of each parameter on key performance metrics.
ParameterWhen IncreasedWhen Decreased
α Leads to improved load balancing but may weaken attack isolationAllows more clustering, which may enhance isolation at the cost of balance
β Improves MTIR by aggressively filtering malicious flows but may reduce BTARRaises BTAR but potentially allows more malicious traffic through
γ Boosts BTAR by reducing false negatives but can reduce MTIRImproves MTIR while possibly denying legitimate traffic
δ Increases attack clustering effectiveness but may lead to greater load imbalanceResults in more dispersed attack flow handling and lower isolation clarity
Table 2. MOFATA Hyperparameter Settings.
CategoryParameterValue
Evolutionary SettingsPopulation size ( P o p S i z e )30
Maximum generations ( M a x G e n )50
Problem dimensionality (N)35,000
Search SpaceVariable bounds ( L b , U b ) [ 1 , M ] N
Server capacity (C)1.2 × total benign traffic
Multi-objective Strategy ε -dominance threshold0.01
Fitness weights α = 0.53 , β = 0.5 , γ = 0.5 , δ = 0.57
Table 3. Standard deviation of server load. Among them, MOAHA, MOGWO, and FATA employ a single-objective fitness function. (The lower, the better).
Malicious Traffic RatioNumber of ServersSOEMOAHAMOGWOFATA
10%52.578.7421.2628.16
102.4815.7117.7417.30
153.2323.6521.3115.17
202.4122.6821.6824.01
70%57.0312.828.0514.16
106.2311.5312.479.62
156.3413.6212.1316.79
206.5412.7915.1313.48
Table 4. Standard deviation of server load. All algorithms employ a composite fitness function. Bolded text represents the standard deviation of the load across the remaining servers after excluding fully loaded servers. (The lower, the better).
Malicious Traffic RatioNumber of NodesSOEMOAHAMOGWOFATA
10%52.424.162.7211.41
102.482.913.597.28
153.233.925.397.51
202.414.683.366.84
70%57.036.578.278.59
0.562.611.386.05
106.236.998.158.12
2.723.595.046.71
156.326.506.405.22
2.735.204.994.01
205.976.237.406.51
3.514.836.556.03
Table 5. Standard deviation of server load. Comparison with XGBoost and Random Forest. (The lower, the better).
Malicious Traffic RatioSOEXGBoostRandom Forest
10%2.5713.9213.21
70%7.0318.4920.10
Table 6. Illustration of the standard deviation of BTAR and MTIR across different time periods. (The lower, the better).
TimeSOEMOAHAMOGWOFATA
Benign Traffic T 0 1.201.031.021.26
T 1 1.151.491.051.94
T 2 1.241.371.091.24
T 3 1.341.292.471.47
T 0 T 3 4.564.195.396.71
Malicious Traffic T 0 1.201.031.021.26
T 1 1.151.491.051.70
T 2 2.281.761.260.85
T 3 1.881.431.481.17
T 0 T 3 2.792.272.6612.17
Disclaimer/Publisher’s Note: The statements, opinions and data contained in all publications are solely those of the individual author(s) and contributor(s) and not of MDPI and/or the editor(s). MDPI and/or the editor(s) disclaim responsibility for any injury to people or property resulting from any ideas, methods, instructions or products referred to in the content.

