Article

Enhanced Estimation of the Unit Lindley Distribution Parameter via Ranked Set Sampling with Real-Data Application

by
Sid Ahmed Benchiha
1,
Amer Ibrahim Al-Omari
2,* and
Ghadah Alomani
3
1
Laboratory of Statistics and Stochastic Processes, University of Djillali Liabes, BP 89, Sidi Bel Abbes 22000, Algeria
2
Department of Mathematics, Faculty of Science, Al Al-Bayt University, Mafraq 25113, Jordan
3
Department of Mathematical Sciences, College of Science, Princess Nourah bint Abdulrahman University, P.O. Box 84428, Riyadh 11671, Saudi Arabia
*
Author to whom correspondence should be addressed.
Mathematics 2025, 13(10), 1645; https://doi.org/10.3390/math13101645 (registering DOI)
Submission received: 4 March 2025 / Revised: 29 April 2025 / Accepted: 14 May 2025 / Published: 17 May 2025

Abstract

:
This paper investigates various estimation methods for the parameters of the unit Lindley distribution (U-LD) under both ranked set sampling (RSS) and simple random sampling (SRS) designs. The distribution parameters are estimated using the maximum likelihood estimation, ordinary least squares, weighted least squares, maximum product of spacings, minimum spacing absolute distance, minimum spacing absolute log-distance, minimum spacing square distance, minimum spacing square log-distance, linear-exponential, Anderson–Darling (AD), right-tail AD, left-tail AD, left-tail second-order, Cramér–von Mises, and Kolmogorov–Smirnov. A comprehensive simulation study is conducted to assess the performance of these estimators, ensuring an equal number of measuring units across both designs. Additionally, two real datasets of items failure time and COVID-19 are analyzed to illustrate the practical applicability of the proposed estimation methods. The findings reveal that RSS-based estimators consistently outperform their SRS counterparts in terms of mean squared error, bias, and efficiency across all estimation techniques considered. These results highlight the advantages of using RSS in parameter estimation for the U-LD distribution, making it a preferable choice for improved statistical inference.

1. Introduction

The study of probability distributions continues to be a vibrant area within statistical modeling. Recent years have seen growing interest in developing specialized distributions that effectively model data confined to the interval [0, 1]. These “unit distributions” are particularly valuable for analyzing probabilities, proportions, and percentages—quantities that frequently arise in medical research, actuarial science, and financial analysis. The literature has witnessed a proliferation of novel unit distributions. Notable examples include the unit-inverse Gaussian distribution in [1], the unit-Gompertz distribution in [2], the unit log-log distribution in [3], the unit-Weibull distribution propsed in [4], the unit Burr-XII distribution offered in [5], the unit-Chen distribution in [6], the unit generalized half normal distribution suggested in [7], the unit-Muth distribution offered in [8], and the unit Birnbaum–Saunders distribution in [9]. Ref. [10] suggests the unit two-parameter Mirra distribution, and Ref. [11] proposes the unit power BurrX distribution.
Thus, Ref. [12] introduces the U-LD through a transformation of the classic Lindley distribution. The U-LD has proven to be a powerful statistical tool for analyzing data within the [ 0 , 1 ] interval, distinguished by its mathematical properties and practical utility. As a member of the exponential family of distributions, it offers closed-form expressions for its moments, significantly simplifying statistical inference and analysis. The distribution’s theoretical framework has been enriched through various contributions, including the development of complete and incomplete moment expressions in [13], an exponential variant that provides enhanced modeling flexibility [14], and applications in reliability theory through stress-strength modeling where P ( Y < X ) is of interest [15]. These mathematical properties, combined with successful implementations in fields such as public health research, demonstrate the distribution’s versatility in addressing real-world analytical challenges while maintaining computational tractability. Ref. [16] advances the field by investigating parameter estimation in unit Lindley mixed effect models, specifically addressing the challenges posed by clustered and longitudinal proportional data. Bayesian inference of the three-component unit Lindley right censored mixture is presented in [17]. The probability density function (PDF) of the U-LD [12] is defined by
g ( w ) = ψ 2 ψ + 1 w 1 3 e ψ w 1 w ; , 0 < w < 1 , ψ > 0 .
The cumulative distribution function (CDF) and hazard rate function (HRF) of the U-LD are given, respectively, by
G ( w ) = 1 1 ψ w ψ + 1 w 1 e ψ w 1 w 0 < w < 1 , ψ > 0 ,
and
h ( w ) = ψ 2 ( ψ w + 1 ) ( w 1 ) 2 , 0 < w < 1 .
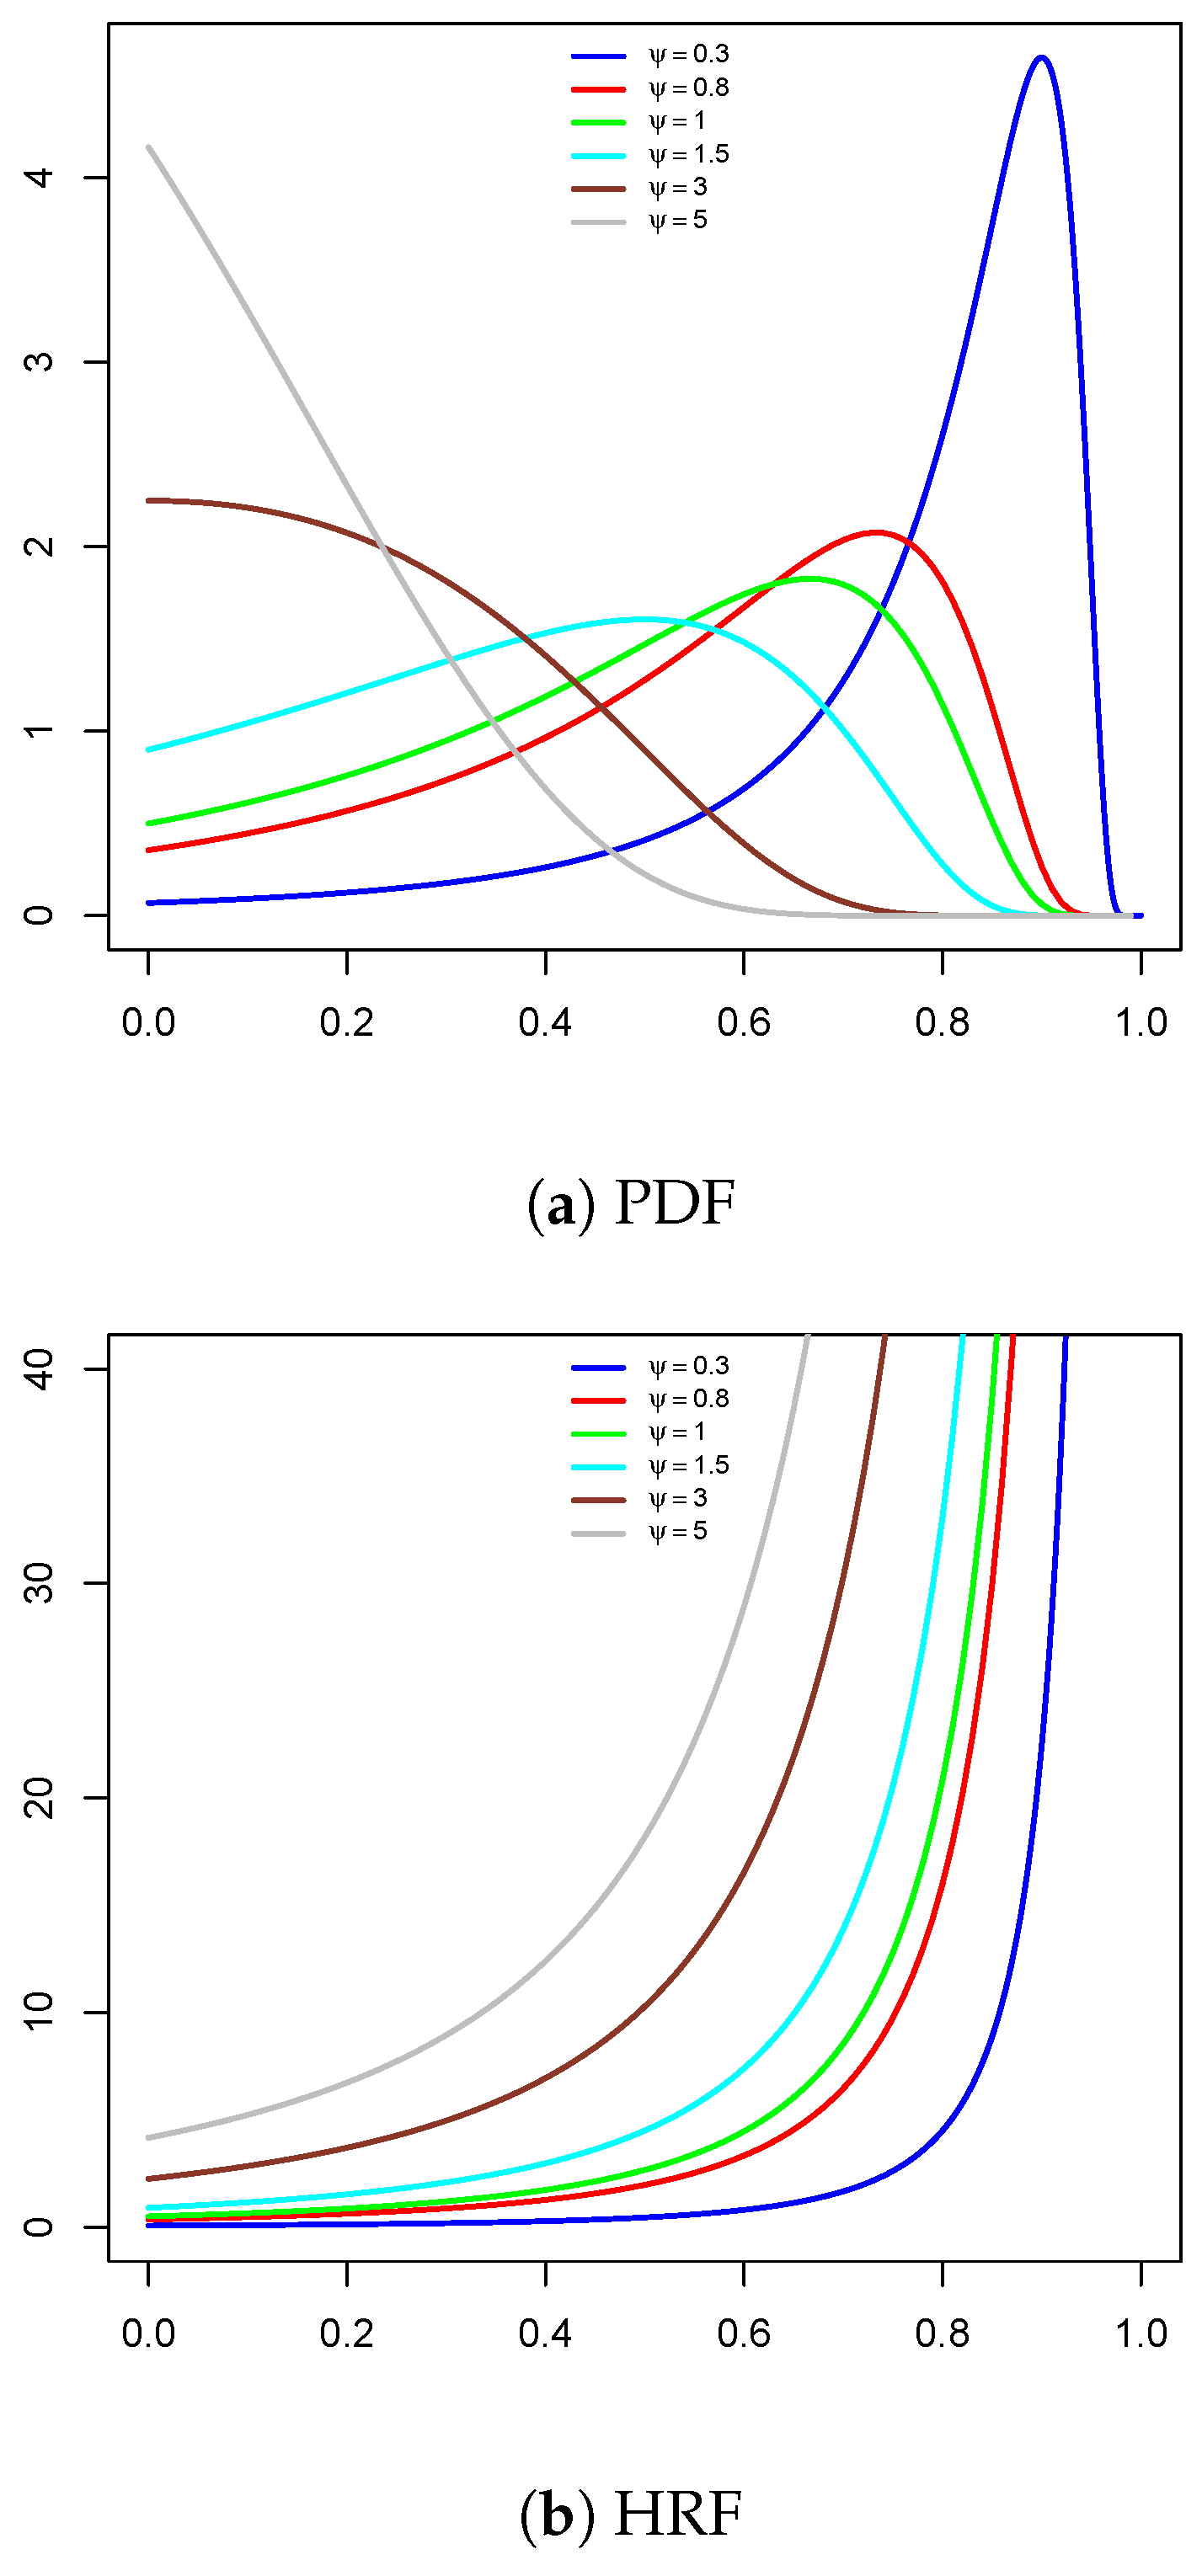
Figure 1 shows both the PDF and HRF for the U-LD distribution. The density function exhibits a unimodal shape, increasing–decreasing, and decreasing. Additionally, the hazard rate function demonstrates a monotonically increasing pattern.
The RSS emerged as an innovative approach to population mean estimation, improving upon traditional SRS methods. First introduced in [18], RSS shines in its ability to capture more representative samples of target populations, delivering superior accuracy while saving both resources and time. The technique’s theoretical underpinnings were developed later in [19], where mathematical proof was provided that RSS mean estimators maintain unbiasedness while achieving better precision compared to SRS estimates under perfect ranking conditions. Ref. [20] further strengthens these findings by showing that RSS maintains its advantages even when ranking procedures are not perfect. The work demonstrates the method’s robustness and practical utility across various real-world scenarios where perfect ranking might not be feasible. Readers may consult references [21,22].
Over the past forty years, RSS has attracted considerable interest in statistical research, particularly in parameter estimation for various parametric families. Numerous studies have applied RSS to estimate unknown parameters. For example, Ref. [23] estimates logistic model parameters using both SRS and RSS, demonstrating the efficiency gains of RSS in parameter estimation.
Ref. [24] applies RSS to estimate the parameters of the Gumbel distribution, highlighting its advantages over traditional methods. Ref. [25] investigates the estimation of P ( X < Y ) for the Weibull distribution using RSS, providing insights into improved estimation accuracy. Ref. [26] employs both Bayesian and maximum likelihood estimation approaches to determine the parameters of the Kumaraswamy distribution under RSS. Ref. [27] suggests best linear unbiased and invariant estimation in location-scale families based on double RSS, while Ref. [28] further explores Bayesian inference for the same distribution. Ref. [29] proposed generalizes robust-regression-type estimators under different RSS. Ref. [30] focuses on efficient parameter estimation for the generalized quasi-Lindley distribution under RSS, demonstrating its practical applications. Ref. [31] examines RSS-based estimation for the two-parameter Birnbaum–Saunders distribution, contributing to the broader literature on RSS efficiency. Additionally, Ref. [32] provides an efficient stress–strength reliability estimate for the unit Gompertz distribution using RSS. Ref. [33] considers the problem of estimating the parameter of Farlie–Gumbel–Morgenstern bivariate Bilal distribution by RSS. Ref. [34] investigates the moving extreme RSS and MiniMax RSS for estimating the distribution function, and Ref. [35] investigates parameter estimation for the exponential Pareto distribution under ranked and double-ranked set sampling designs, showcasing the effectiveness of these sampling strategies in reliability analysis.
Interested in the widespread applications of the RSS method across various fields, this study focuses on estimating the parameters of the U-LD. To achieve this, we employ several classical estimation approaches based on both RSS and SRS. The estimation techniques considered include maximum likelihood estimation (MLE), ordinary least squares (OLS), weighted least squares (WLS), maximum product of spacings (MPS), minimum spacing absolute distance (MSAD), minimum spacing absolute log-distance (MSALD), minimum spacing square distance (MSSD), minimum spacing square log-distance (MSSLD), linear-exponential (Linex), Anderson–Darling, right-tail AD (RAD), left-tail AD (LAD), left-tail second-order (LTS), Cramér–von Mises (CV), and Kolmogorov–Smirnov (KS).
To the best of our knowledge, this is the first study that considers the parameter estimation of the unit Lindley distribution using RSS. The proposed estimators under RSS are systematically compared with their SRS counterparts through simulation studies that assess their precision based on bias, mean squared error (MSE), and mean absolute relative error. Additionally, a real dataset is analyzed to demonstrate the practical effectiveness of the RSS-based estimators.
The structure of this paper is as follows: The RSS is defined in Section 2, Section 3 presents the estimation methods for the U-LD, while Section 4 conducts a simulation study to evaluate and compare the performance of the proposed estimators. Section 5 provides an analysis of a real dataset, and finally Section 6 concludes with key remarks and insights.

2. Description of the RSS Scheme

We assume that the random variable of interest W has a PDF h ( w ) and CDF H(w). To illustrate the RSS procedure, we follow these steps:
Step 1: Select m SRS each of size m as
W 11 , W 12 ,..., W 1 m
W 21 , W 22 ,..., W 2 m
W m 1 , W m 2 ,..., W m m
Step 2: Rank the unit within each set based on the variable of interest using visual inspection, expert judgment, or any inexpensive ranking method (without actual measurement) as
W 1 ( 1 : m ) , W 1 ( 2 : m ) ,..., W 1 ( m : m )
W 2 ( 1 : m ) , W 2 ( 2 : m ) ,..., W 2 ( m : m )
W m ( 1 : m ) , W m ( 2 : m ) ,..., W m ( m : m )
Step 3: Choose the sth ranked unit from the sth set as
W 1 ( 1 : m ) , W 1 ( 2 : m ) ,..., W 1 ( m : m )
W 2 ( 1 : m ) , W 2 ( 2 : m ) ,..., W 2 ( m : m )
W m ( 1 : m ) , W m ( 2 : m ) ,..., W m ( m : m )
Hence, the RSS units are W 1 ( 1 : m ) , W 2 ( 2 : m ) ,..., W m ( m : m ) . Note that we identify m 2 units but only measure m of them. To increase the sample size, we extend Steps (1) through (3) to multiple cycles to construct a RSS sample of size n = m r . In this case, the RSS sample observations are denoted as w s ( s : m ) u , s = 1 , 2 , , m , u = 1 , 2 , , r . The process of designing a RSS scheme involves selecting an optimal set size, typically limited to a maximum of five to reduce ranking errors.
For a fixed u, the elements W s ( s : m ) u are independent and follow the same distribution as the sth order statistic from a sample of size m. The PDF of W s ( s : m ) u , assuming perfect ranking as described by Arnold et al. [36], is given by
h ( w s ( s : m ) u ) = 1 B ( s , m s + 1 ) H ( w s ( s : m ) u ) s 1 1 H ( w s ( s : m ) u ) m s h ( w s ( s : m ) u ) , w s ( s : m ) u R ,
where h ( w s ( s : m ) u ) and H ( w s ( s : m ) u ) denote the PDF and CDF of W, respectively.

3. Methods of Estimation

This section aims to provide a detailed description of the RSS and derive the estimator of UL-D using different methods of estimation under RSS.

3.1. Maximum Likelihood Estimation

We let w s ( s : m ) u , s = 1 , 2 , , m , u = 1 , 2 , , r be the RSS of size n = m r where m is the set size and r is number of cycles, gathered form the U-LD. The likelihood function of the U-LD is obtained by inserting Equations (1) and (2) in Equation (3) as below:
L ( α ) s = 1 m u = 1 r Ω ( w s ( s : m ) u , ψ ) s 1 1 Ω ( w s ( s : m ) u , ψ ) m s ψ 2 e ψ w s ( s : m ) u w s ( s : m ) u 1 ψ + 1 1 w s ( s : m ) u 3 ,
where Ω ( w s ( s : m ) u , ψ ) = 1 ψ w s ( s : m ) u ψ + 1 w s ( s : m ) u 1 e ψ w s ( s : m ) u 1 w s ( s : m ) u .
The logarithmic of Equation (4), indicated by l ( ψ ) , is expressed by
l ( ψ ) 2 n log ψ n log ( ψ + 1 ) ψ s = 1 m u = 1 r w s ( s : m ) u 1 w s ( s : m ) u + s = 1 m u = 1 r ( s 1 ) log Ω ( w s ( s : m ) u , ψ ) + ( m s ) log 1 Ω ( w s ( s : m ) u , ψ ) 3 log 1 w s ( s : m ) u .
We differentiate Equation (5) with respect to ψ and equate it to zero, which results in
l ( ψ ) ψ = 2 n ψ n ψ + 1 s = 1 m u = 1 r w s ( s : m ) u 1 w s ( s : m ) u + s = 1 m u = 1 r ( s 1 ) Ω ψ ( w s ( s : m ) u , ψ ) Ω ( w s ( s : m ) u , ψ ) ( q s ) Ω ψ ( w s ( s : m ) u , ψ ) 1 Ω ( w s ( s : m ) u , ψ ) = 0 ,
where Ω ψ ( w s ( s : m ) u , ψ ) = Ω ψ ( w s ( s : m ) u , ψ ) ψ = ψ 2 e ψ w s ( s : m ) u 1 w s ( s : m ) u ψ + 1 w s ( s : m ) u 1 3 . The MLE π of ψ is the solution of non-linear Equation (6). It seems that Equation (6) has no analytical solution; therefore, one can use a numerical method for obtaining ψ .

3.2. Least Square Estimators

In this part, the OLS and WLS are derived using the RSS framework. Ref. [37] introduced the OLS and WLS for estimating the parameters of the beta distribution. We consider an ordered sample W ( 1 : n ) , W ( 2 : n ) , , W ( n : n ) which forms an RSS of size n = m r collected from the U-LD. By minimizing the respective objective functions with respect to ψ , the OLSE ψ ^ O L S and WLSE ψ ^ W L S are obtained. The objective functions to be minimized are given by
Λ ( ψ ) = s = 1 n G w ( s : n ) ψ s n + 1 2 , Φ ( ψ ) = s = 1 n ( n + 1 ) 2 ( n + 2 ) s ( n s + 1 ) G w ( s : n ) ψ s n + 1 2 .
The non-linear equations below may be solved to obtain ψ ^ O L S and ψ ^ W L S :
Λ ( ψ ) ψ = s = 1 n G w ( s : n ) ψ s n + 1 Δ w ( s : n ) ψ = 0 , Φ ( ψ ) ψ = s = 1 n ( n + 1 ) 2 ( n + 2 ) s ( n s + 1 ) G w ( s : n ) ψ s n + 1 Δ w ( s : n ) ψ = 0 ,
where
Δ w ( s : n ) ψ = ψ G w ( s : n ) ψ = w ( s : n ) ψ ψ w ( s : n ) + 2 e w ( s : n ) ψ 1 w ( s : n ) w ( s : n ) 1 2 ψ + 1 2 .

3.3. Maximum Product of Spacing Estimator

The MPS method emerged as a powerful alternative to traditional maximum likelihood (ML) estimation through the groundbreaking work in [38,39]. The research revealed that MPS offers distinct advantages in parameter estimation for continuous univariate distributions. Notably, MPS demonstrates broader consistency than ML methods while maintaining equivalent efficiency to MLE.
We consider an ordered sample W ( 1 : n ) , W ( 2 : n ) , , W ( n : n ) that forms an RSS of size n = m r , collected from the U-LD. The corresponding uniform spacings are defined as
Π s ( ψ ) = G w ( s : n ) ψ G w ( s 1 : n ) ψ , i = 1 , 2 , . . . , n + 1 .
where the boundary conditions hold: G w ( 0 : n ) ψ = 0 , G w ( n + 1 : n ) ψ = 1 , ensuring that the sum of spacings satisfies s = 1 n + 1 Π s ( ψ ) = 1 .
The MPSE ψ ^ M P S of ψ is produced by maximizing the following function with respect to ψ :
Υ = 1 n + 1 s = 1 n + 1 log Π s ( ψ ) .
The MPSE ψ ^ M P S is determined by solving the following equation numerically:
Υ ψ = 1 n + 1 s = 1 n + 1 1 Π s ( ψ ) Δ w ( s : n ) ψ Δ w ( s 1 : n ) ψ = 0 ,
where Δ . ψ is given in Equation (7).

3.4. Minimum Spacing Distance Estimators

This section explores diverse parameter estimators for the U-LD distribution using RSS. We let W ( 1 : n ) , W ( 2 : n ) , . . . , W ( n : n ) be an ordered sample forming RSS of size n = m r collected from the U-LD. Below are five distinct estimation methods, each characterized by its unique objective function and mathematical formulation.
  • The MSAD Estimator: This method utilizes the absolute distance between spacings to estimate parameters. Its objective function is defined as
    ζ 1 ( ψ ) = s = 1 n + 1 Υ s ( ψ ) 1 n + 1 .
    The parameter estimation ψ ^ M S A D is achieved by solving the corresponding nonlinear equation:
    ζ 1 ( ψ ) ψ = s = 1 n + 1 Υ s ( ψ ) 1 n + 1 Υ s ( ψ ) 1 n + 1 Δ w ( s : n ) ψ Δ w ( s 1 : n ) ψ = 0 ,
  • The MSALD Estimator: The MSALD approach incorporates logarithmic transformation to enhance estimation accuracy, particularly for skewed distributions. Its objective function is
    ζ 2 ( ψ ) = s = 1 n + 1 log Υ s ( ψ ) log 1 n + 1 .
    Equivalently, ψ ^ M S A L D can be obtained by empirically solving the following nonlinear equation:
    ζ 2 ( ψ ) ψ = s = 1 n + 1 log Υ s ( ψ ) log 1 n + 1 log Υ s ( ψ ) log 1 n + 1 Δ w ( s : n ) ψ Δ w ( s 1 : n ) ψ = 0 .
  • The MSSD Estimator: The MSSD employs squared differences between spacings, making it more sensitive to larger deviations. Its objective function is
    ζ 3 ( ψ ) = s = 1 n + 1 Υ s ( ψ ) 1 n + 1 2 ,
    or ψ ^ M S S D , which can be found by solving the following nonlinear equation:
    ζ 3 ( ψ ) ψ = s = 1 n + 1 Υ s ( ψ ) 1 n + 1 Δ w ( s : n ) ψ Δ w ( s 1 : n ) ψ = 0 ,
  • The MSSLD Estimator: The MSSLD combines the benefits of logarithmic transformation with squared differences. Its objective function is
    ζ 4 ( ψ ) = s = 1 n + 1 log Υ s ( ψ ) log 1 n + 1 2
    Similarly, ψ ^ M S S L D can be derived by solving the following nonlinear equation:
    ζ 4 ( ψ ) ψ = s = 1 n + 1 log Υ s ( ψ ) log 1 n + 1 1 Υ s ( ψ ) Δ w ( s : n ) ψ Δ w ( s 1 : n ) ψ = 0 ,
  • Linear-Exponential (Linex) Estimator: The Linex estimator incorporates both linear and exponential terms in its objective function
    ζ 5 ( ψ ) = s = 1 n + 1 e Υ s ( ψ ) ) 1 n + 1 Υ s ( ψ ) 1 n + 1 1 .
    Also, ψ ^ M S A L D can be obtained by empirically solving the following nonlinear equation:
    ζ 5 ( ψ ) ψ = s = 1 n + 1 e Υ s ( ψ ) ) 1 n + 1 1 Δ w ( s : n ) ψ Δ w ( s 1 : n ) ψ = 0 ,
where Δ τ ψ , τ = w ( s : n ) , w ( s 1 : n ) is given in Equation (7).

3.5. Goodness-of-Fit Estimators

We now examine methods for estimating parameter ψ through optimization of goodness-of-fit measures. These methods work by minimizing the difference between the empirical CDF and the fitted CDF.

3.5.1. Anderson Darling Methods

The AD test, an alternative to other normality tests, was introduced in [40]. One of its key advantages is its rapid convergence to the asymptotic distribution, making it highly effective for statistical inference [41,42]. We consider an ordered sample, denoted as W ( 1 : n ) , W ( 2 : n ) , . . . , W ( n : n ) , forming a RSS of size n = m r drawn from the U-LD distribution. The AD estimator ψ ^ A D , the right AD estimator ψ ^ R A D , the left AD estimator ψ ^ L A D , and the LTS estimator ψ ^ L T S of ψ are obtained by minimizing the respective functions:
AD ( ψ ) = n 1 n s = 1 n ( 2 s 1 ) log G w ( s : n ) ψ + log G ¯ w ( n s + 1 : n ) ψ , RAD ( ψ ) = n 2 2 s = 1 n G w ( s : n ) ψ 1 n s = 1 n ( 2 s 1 ) log G ¯ w ( n + 1 s : n ) ψ , LAD ( ψ ) = 3 n 2 + 2 s = 1 n G w ( s : n ) ψ 1 n s = 1 n ( 2 s 1 ) log H w ( s : n ) ψ , LTS ( ψ ) = 2 s = 1 n log G w ( s : n ) ψ + 1 n s = 1 n ( 2 s 1 ) G w ( s : n ) ψ ,
where G ¯ τ ψ , τ = w ( s : n ) , w ( n s + 1 : n ) is the survival function.

3.5.2. Cramér-von Mises Estimators

Ref. [43] demonstrated that the Cramér–von Mises statistic exhibits lower bias compared to other minimum distance estimators, making it a valuable alternative for parameter estimation. We consider an ordered sample W ( 1 : n ) , W ( 2 : n ) , . . . , W ( n : n ) forming a RSS of size n = m r , collected from the U-LD distribution. The CV estimator ψ ^ C V of ψ is obtained by minimizing the following function:
η ( ψ ) = 1 12 n + s = 1 n G w ( s : n ) ψ 2 s 1 2 n 2 .
Alternatively, instead of directly minimizing Equation (9), the ME ψ ^ C V can be obtained by solving the following non-linear equation:
η ( ψ ) ψ = s = 1 n G w ( s : n ) ψ 2 s 1 2 n Δ w ( s : n ) ψ = 0 ,
where Δ . ψ is defined in Equation (7).

3.5.3. Kolmogorov–Smirnov

Given an ordered sample W ( 1 : n ) , W ( 2 : n ) , . . . , W ( n : n ) forming a RSS of size n = m r from the U-LD distribution, the KS estimator ψ ^ K S of ψ is determined by minimizing the following function:
χ ( ψ ) = M a x 1 s n s n G w ( s : n ) ψ , G w ( s : n ) ψ s 1 n .

4. Numerical Simulation

This section explores various estimation techniques for the U-LD parameter through simulation studies based on the RSS and SRS using set sizes of m = 3 , 5 , 7 , 10 with cycles r = 1 , 3 , 6 . For each combination of combination of m and r, we keep the sample sizes equivalent to m × r ensuring comparability between methods. For each generated sample, the parameter estimator ψ ^ is computed based on the methods outlined in Section 2. To assess estimation accuracy for each method and sampling design, four statistical metrics are computed, including the Average Estimator (AE), Absolute Bias (bias), Mean Squared Error (MSE), and Mean Absolute Relative Error (MRE) which assesses estimation accuracy relative to the true parameter value. These measures are given by, respectively,
A E = 1 M i = 1 M ψ ^ , B i a s = 1 N i = 1 N | ψ ^ ψ | , M S E = 1 N i = 1 N ( ψ ^ ψ ) 2 ,
and
M R E = 1 N i = 1 N | ψ ^ ψ | ψ .
Here, N represents the number of simulations, and two values of parameter ψ are considered: ψ = 2 and ψ = 5 . For ψ = 2 , the results for SRS and RSS are presented in Table 1 and Table 2, respectively. For ψ = 5 , the results for SRS and RSS are presented in Table 3 and Table 4, respectively.
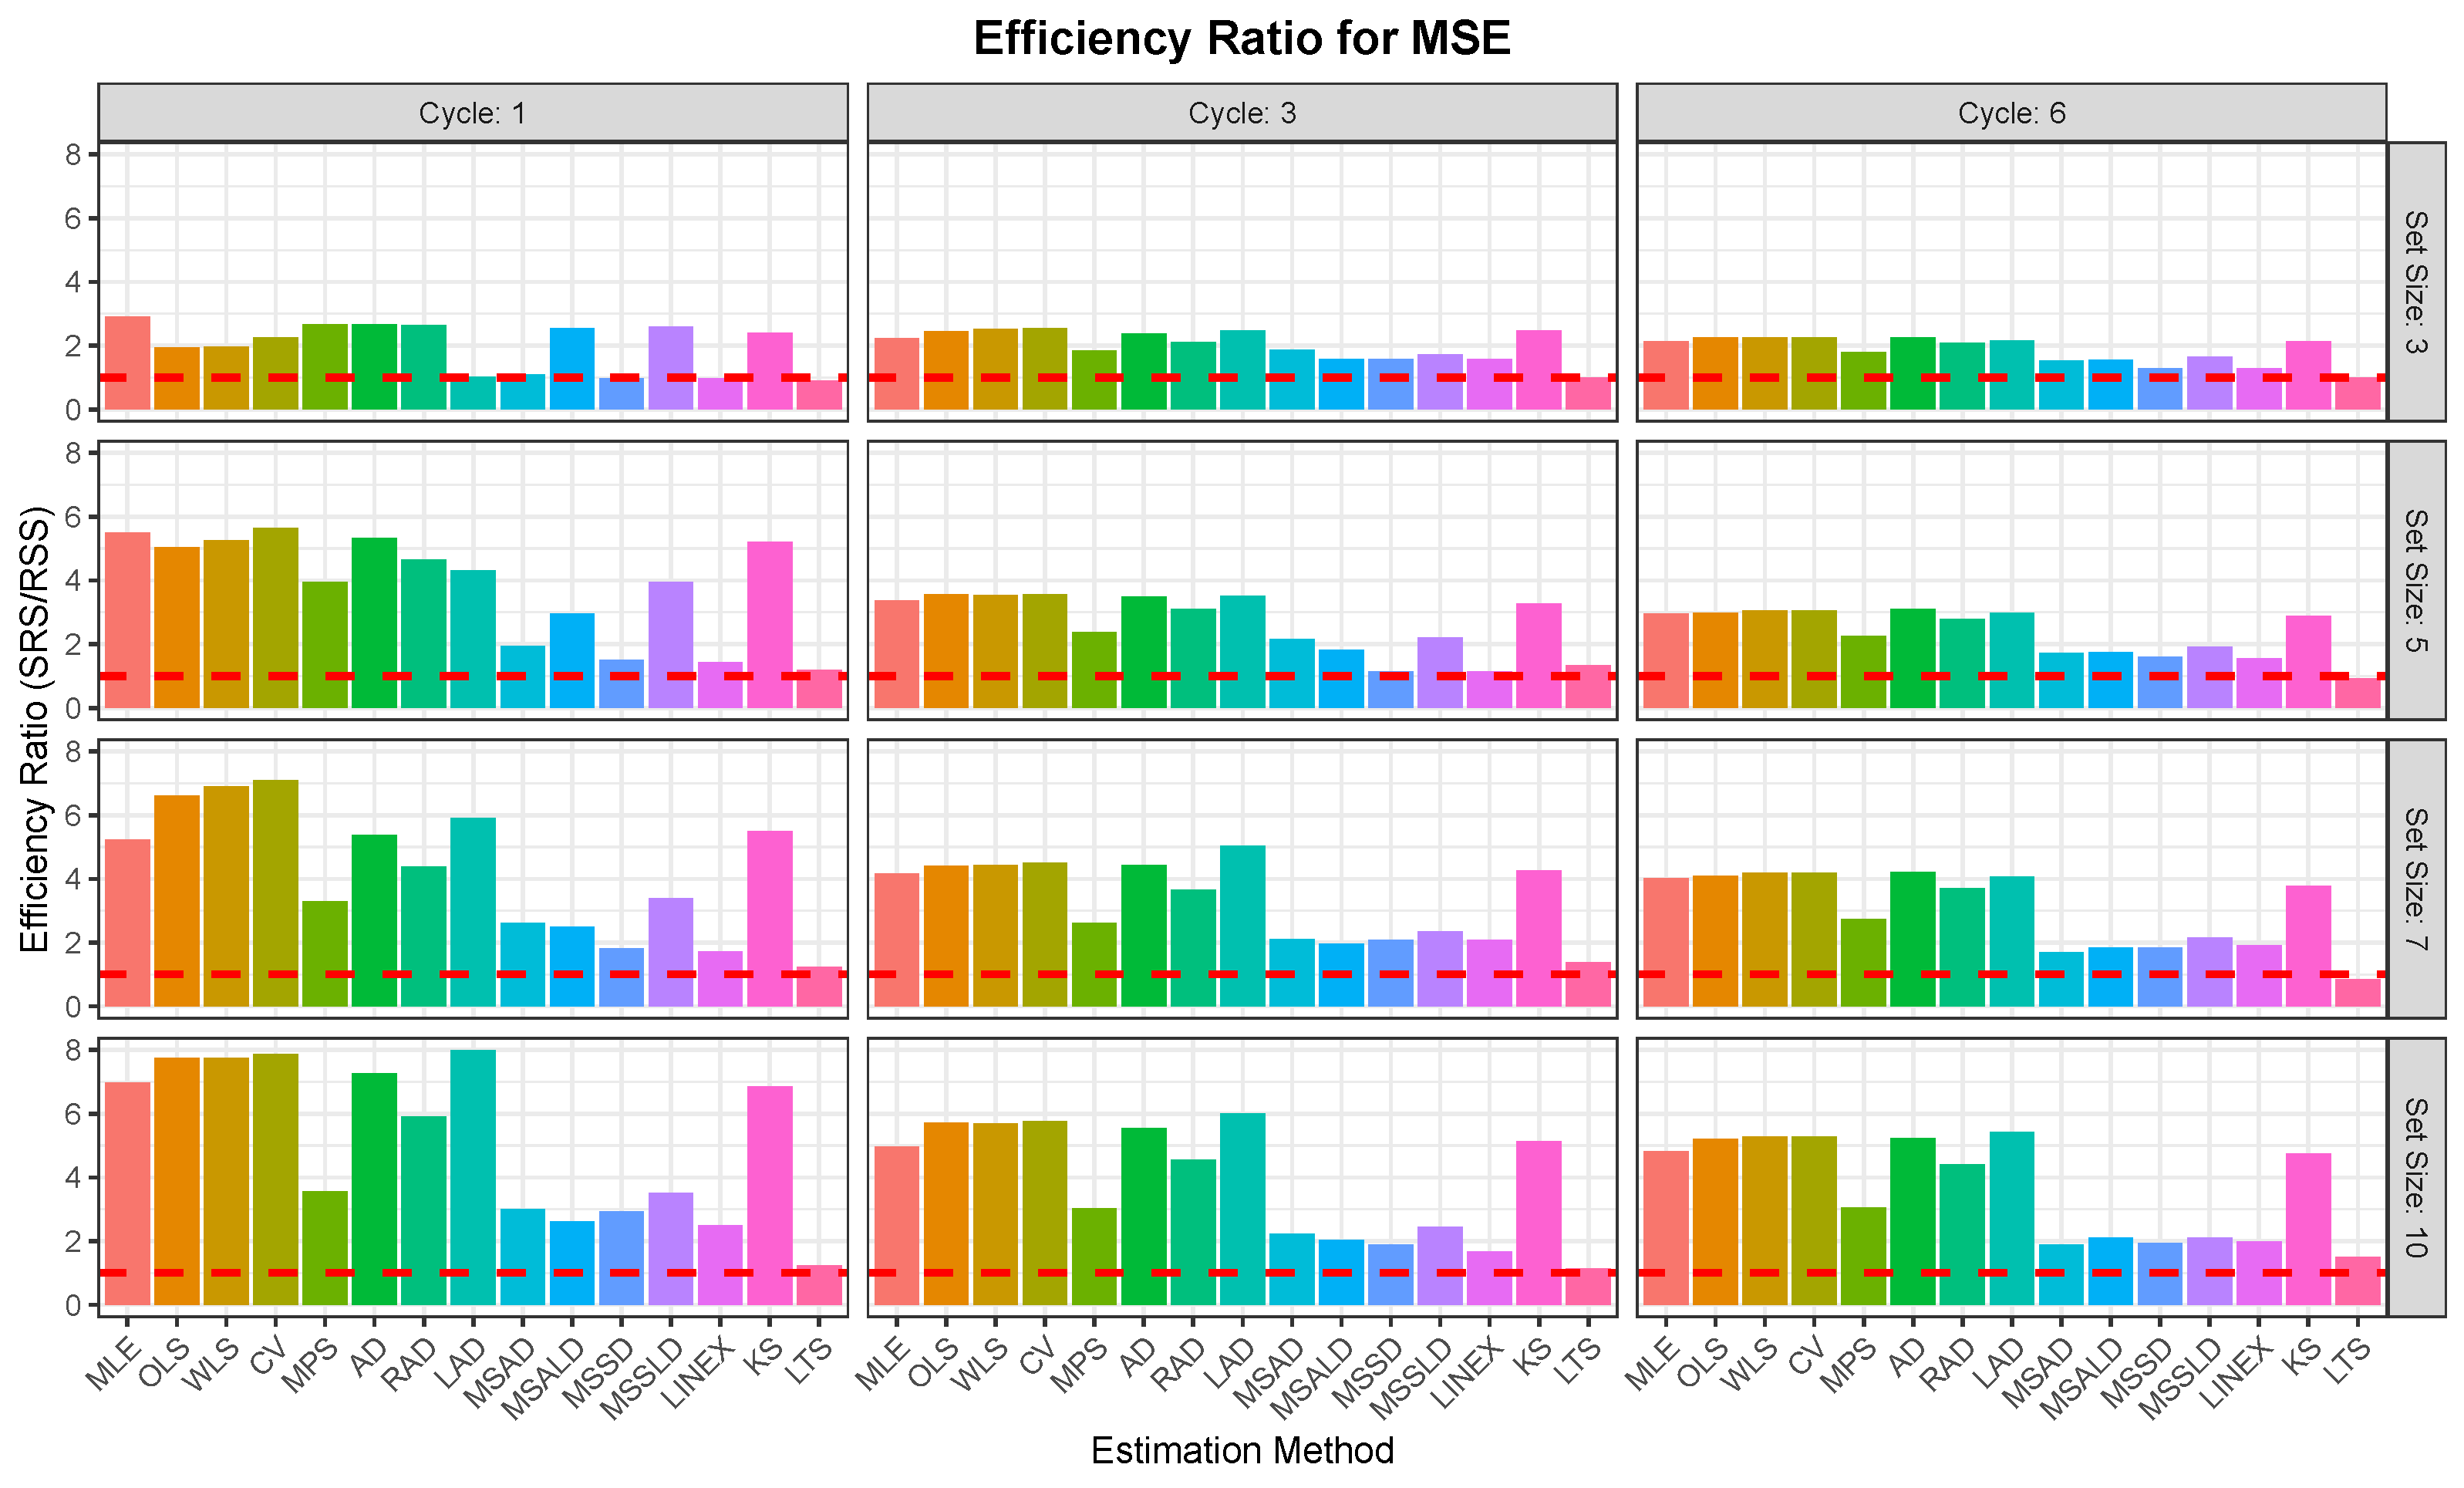
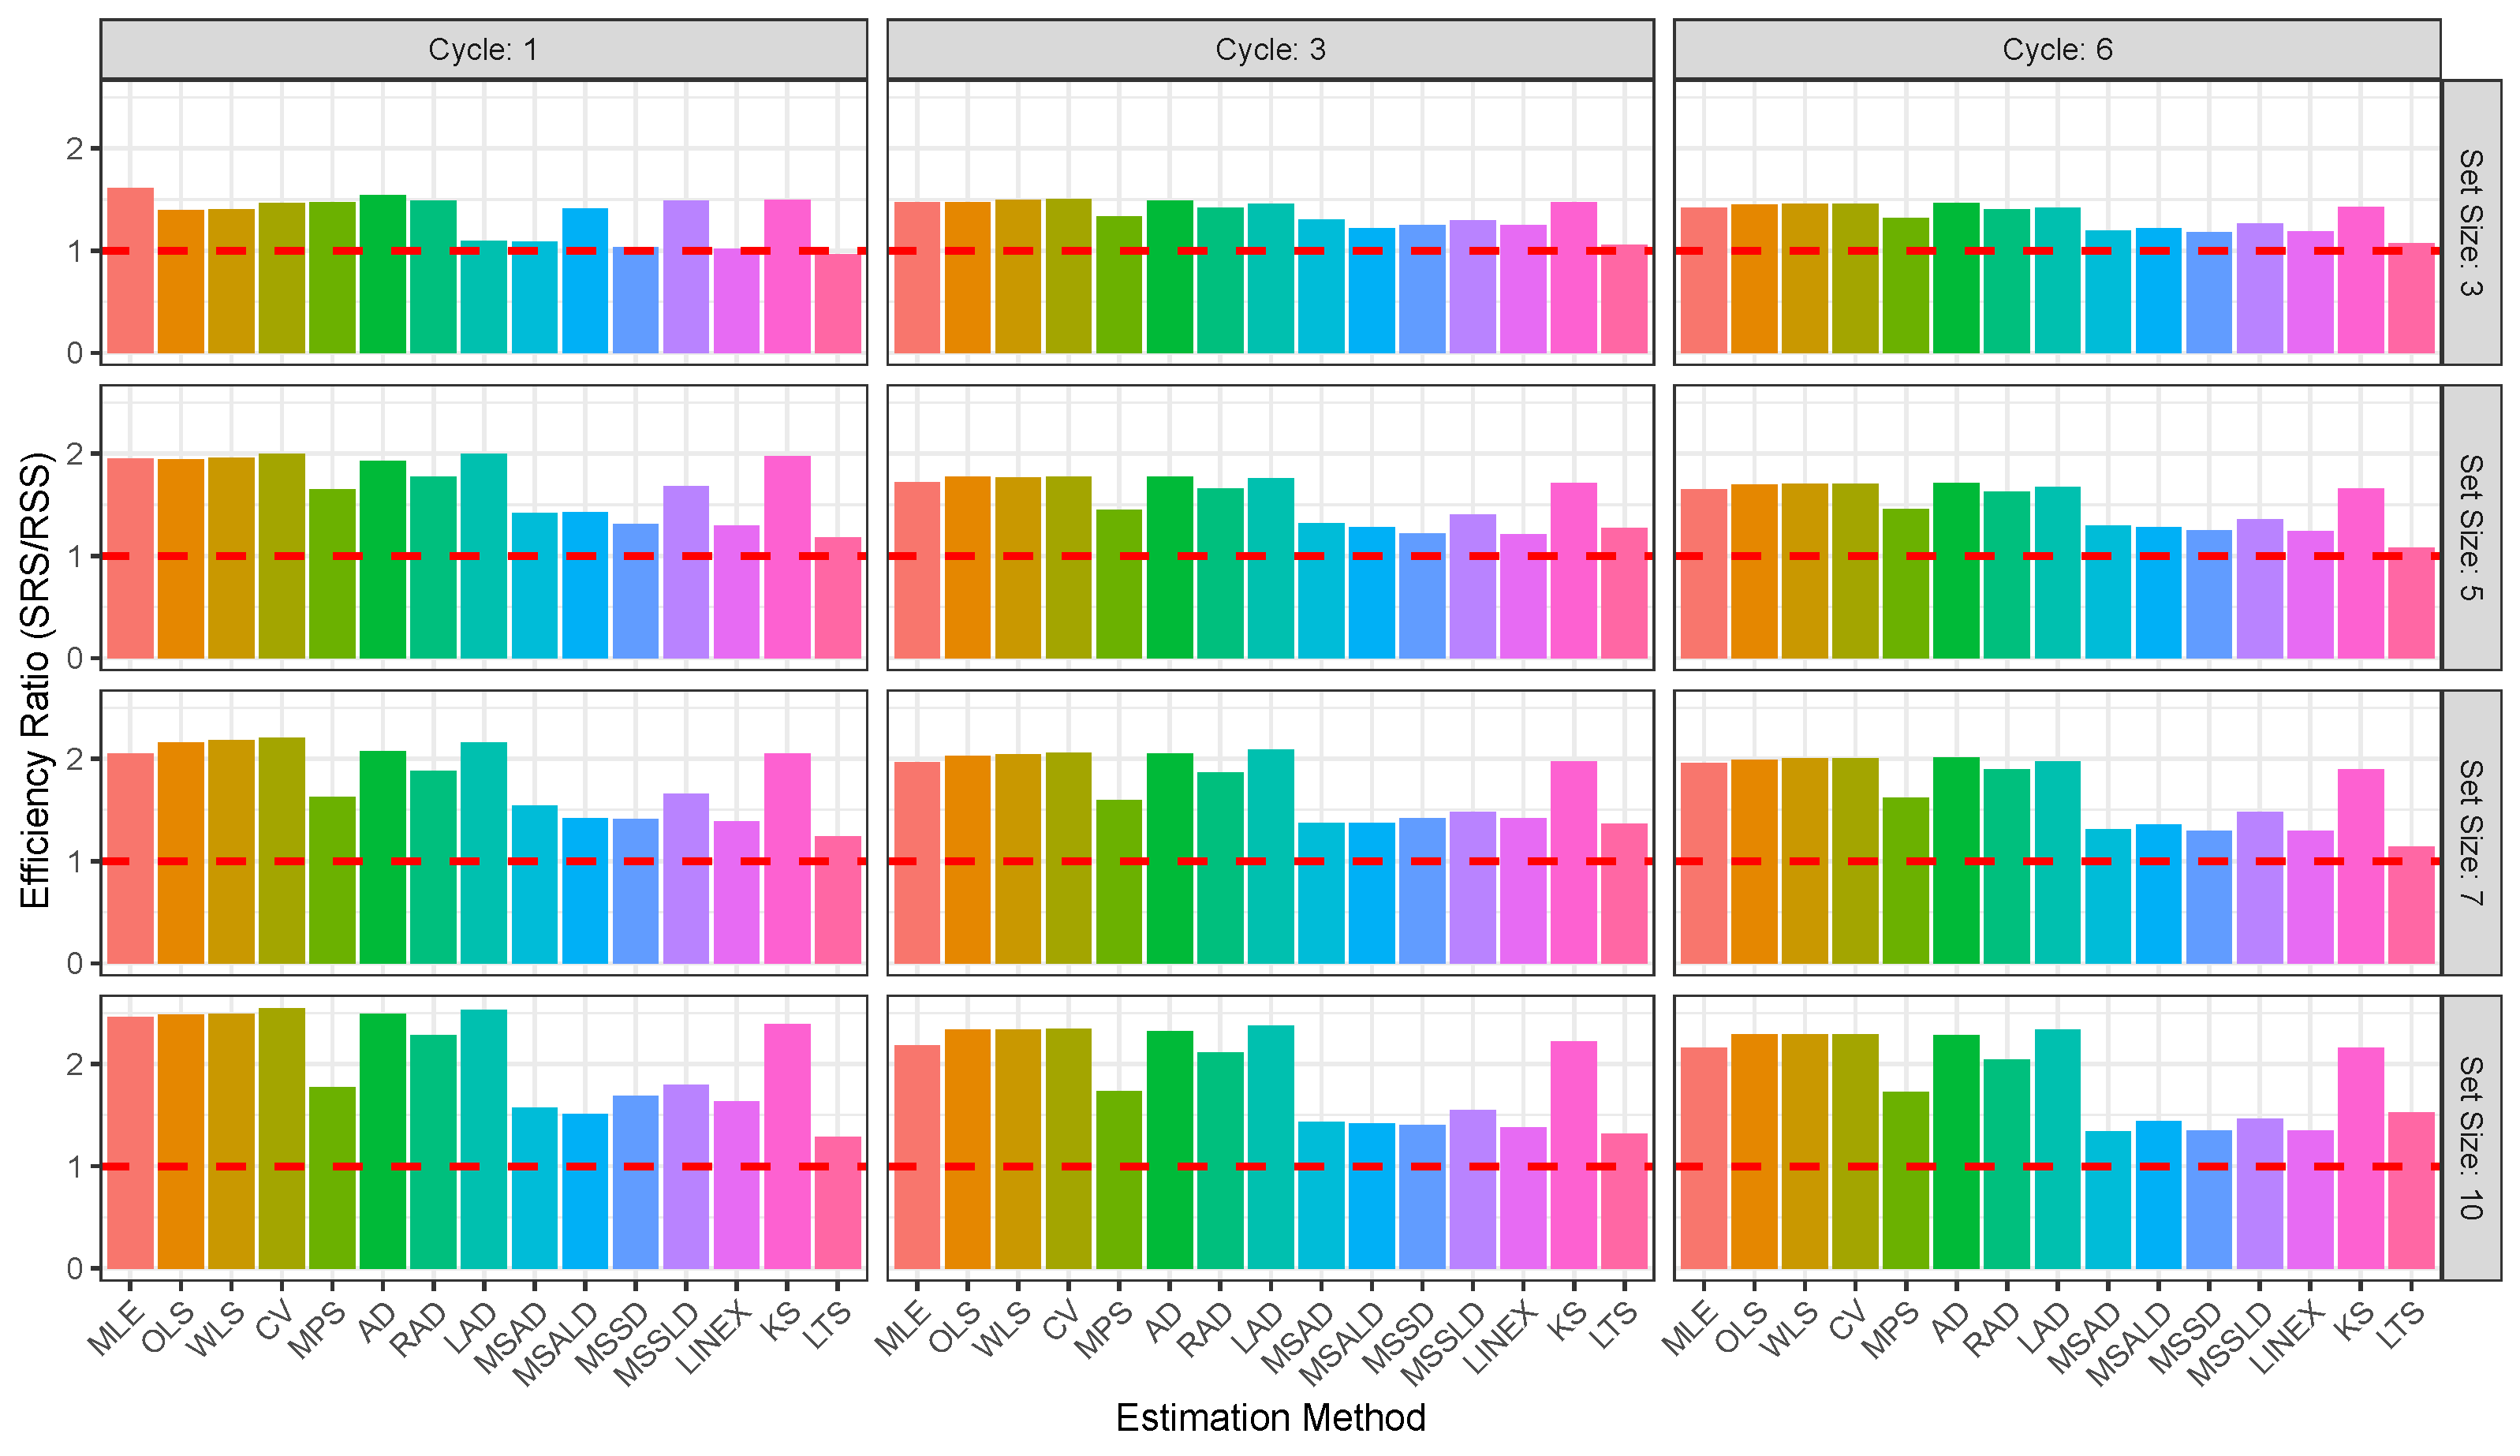
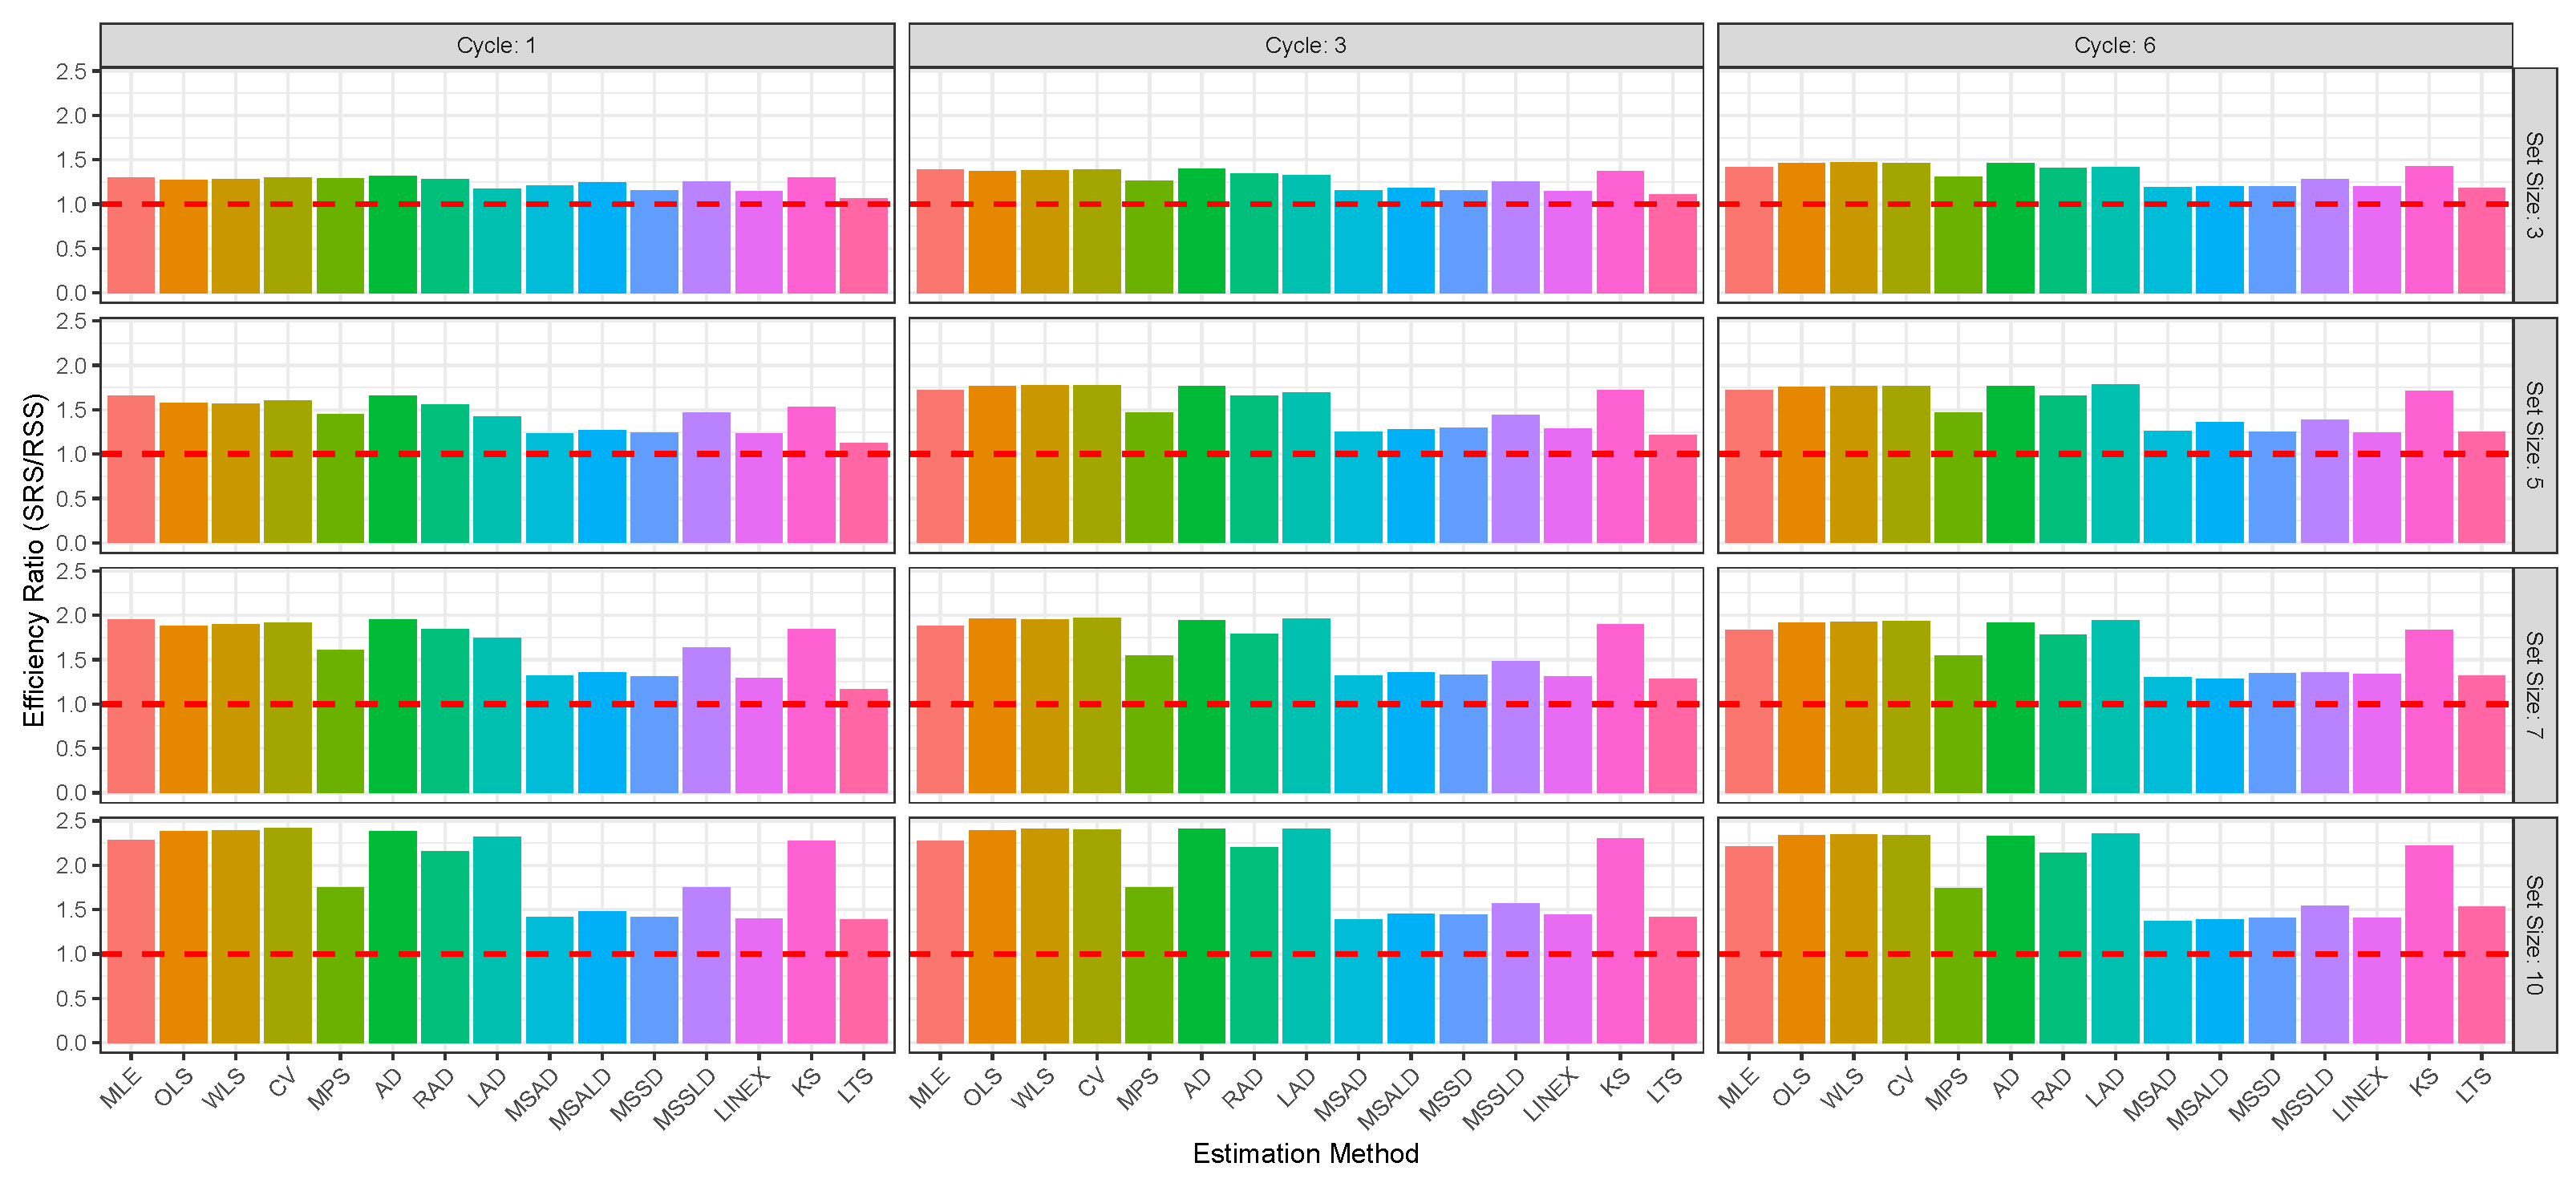
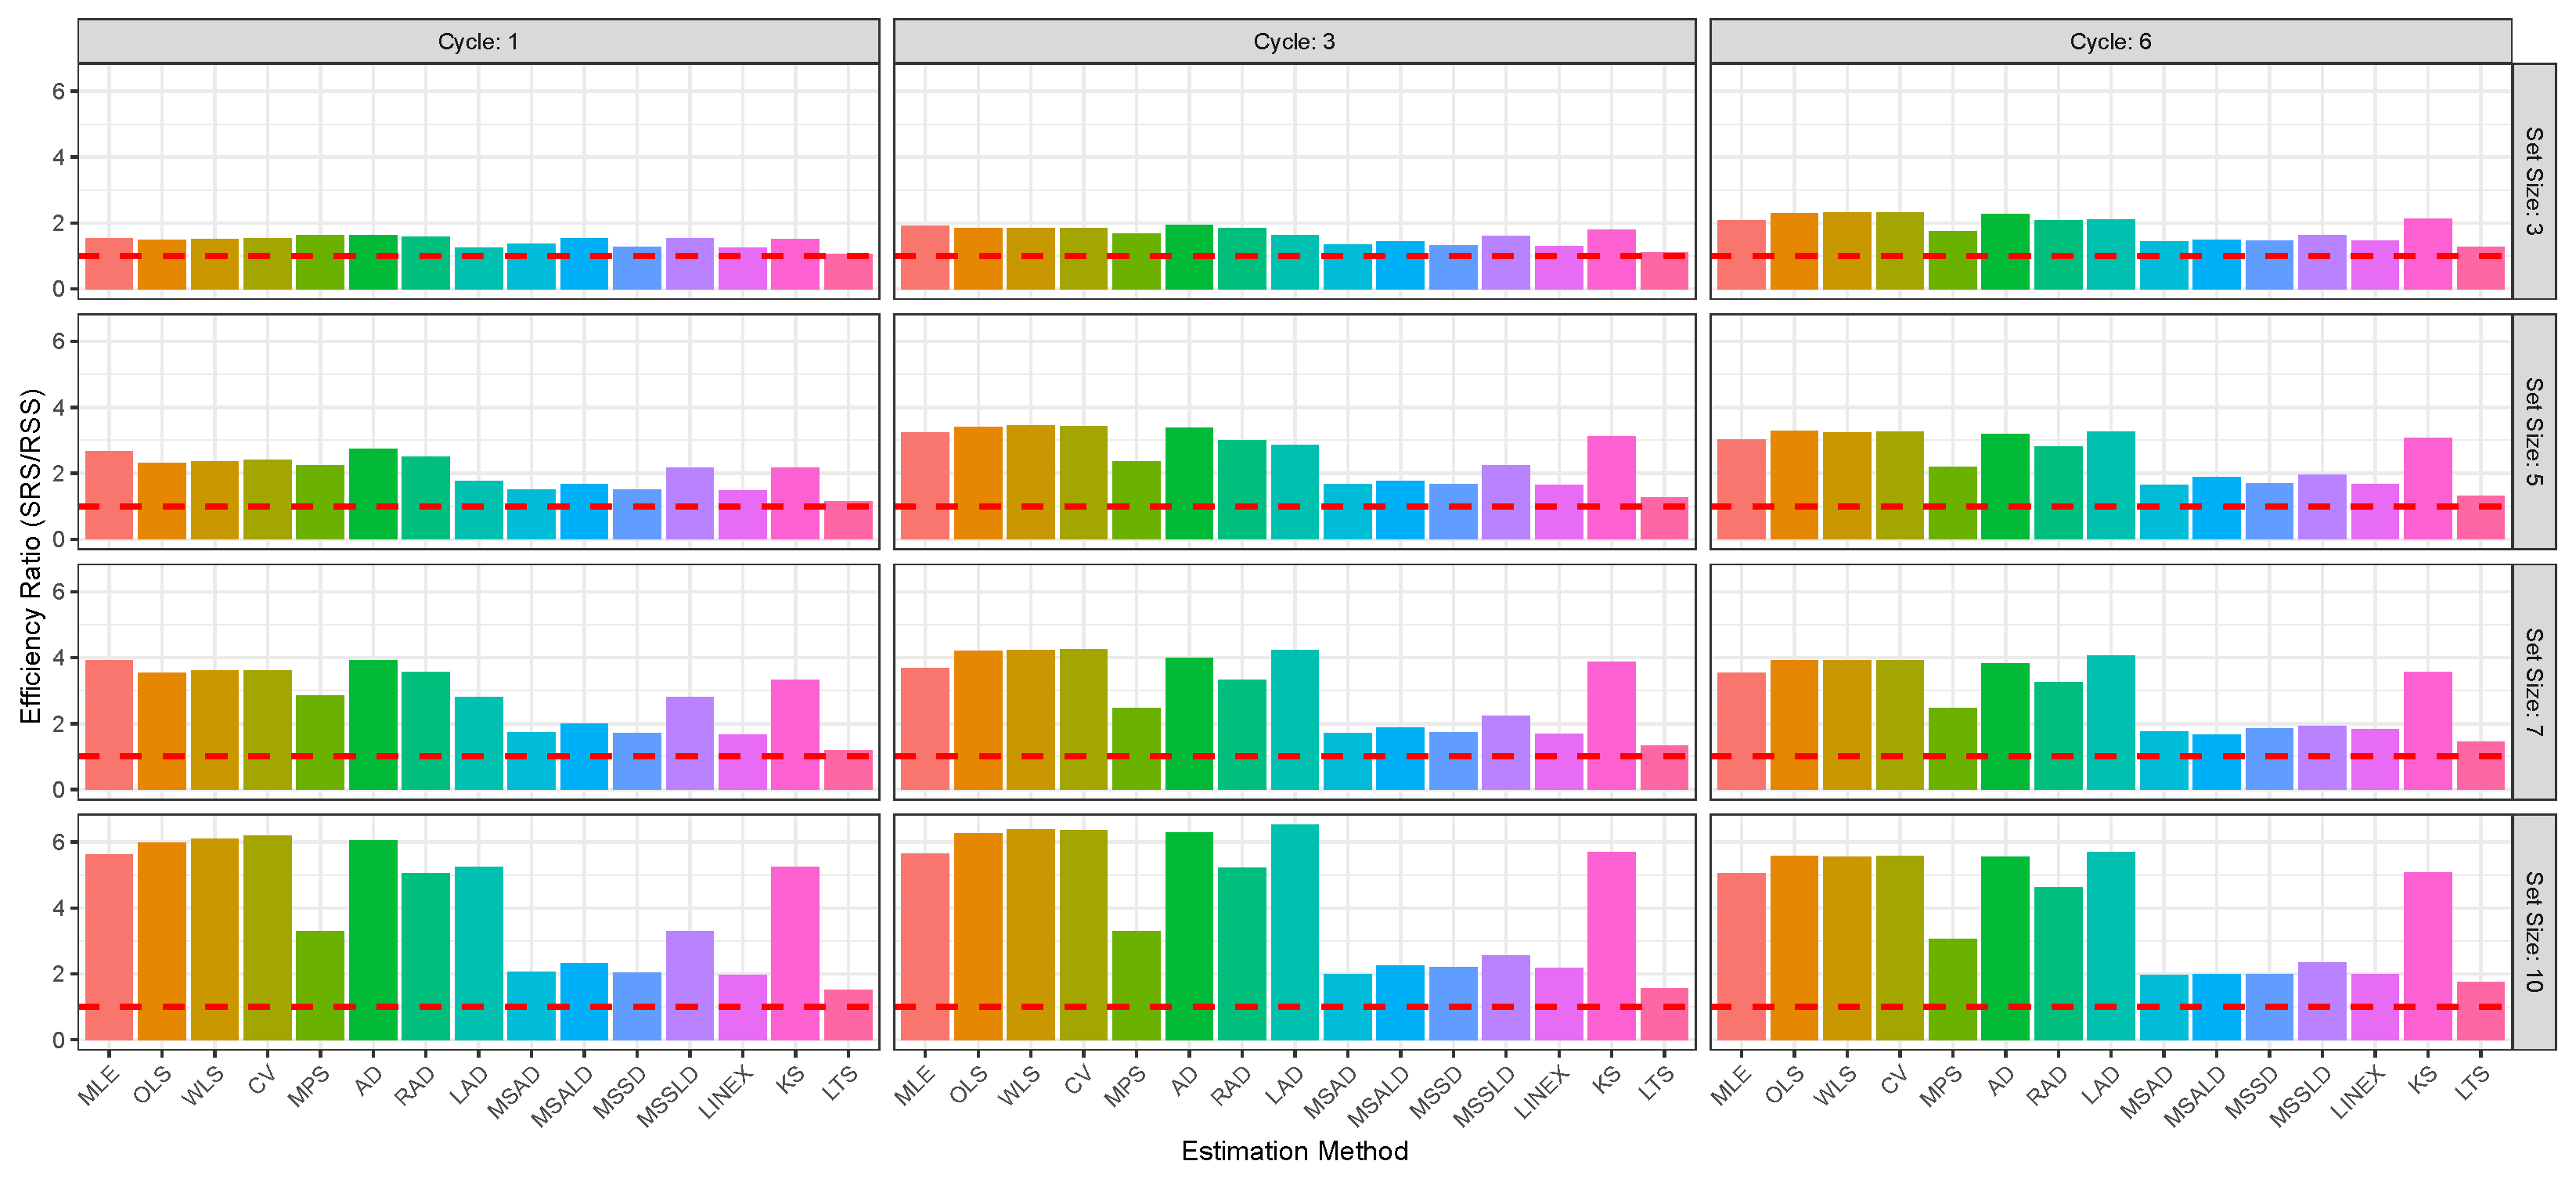
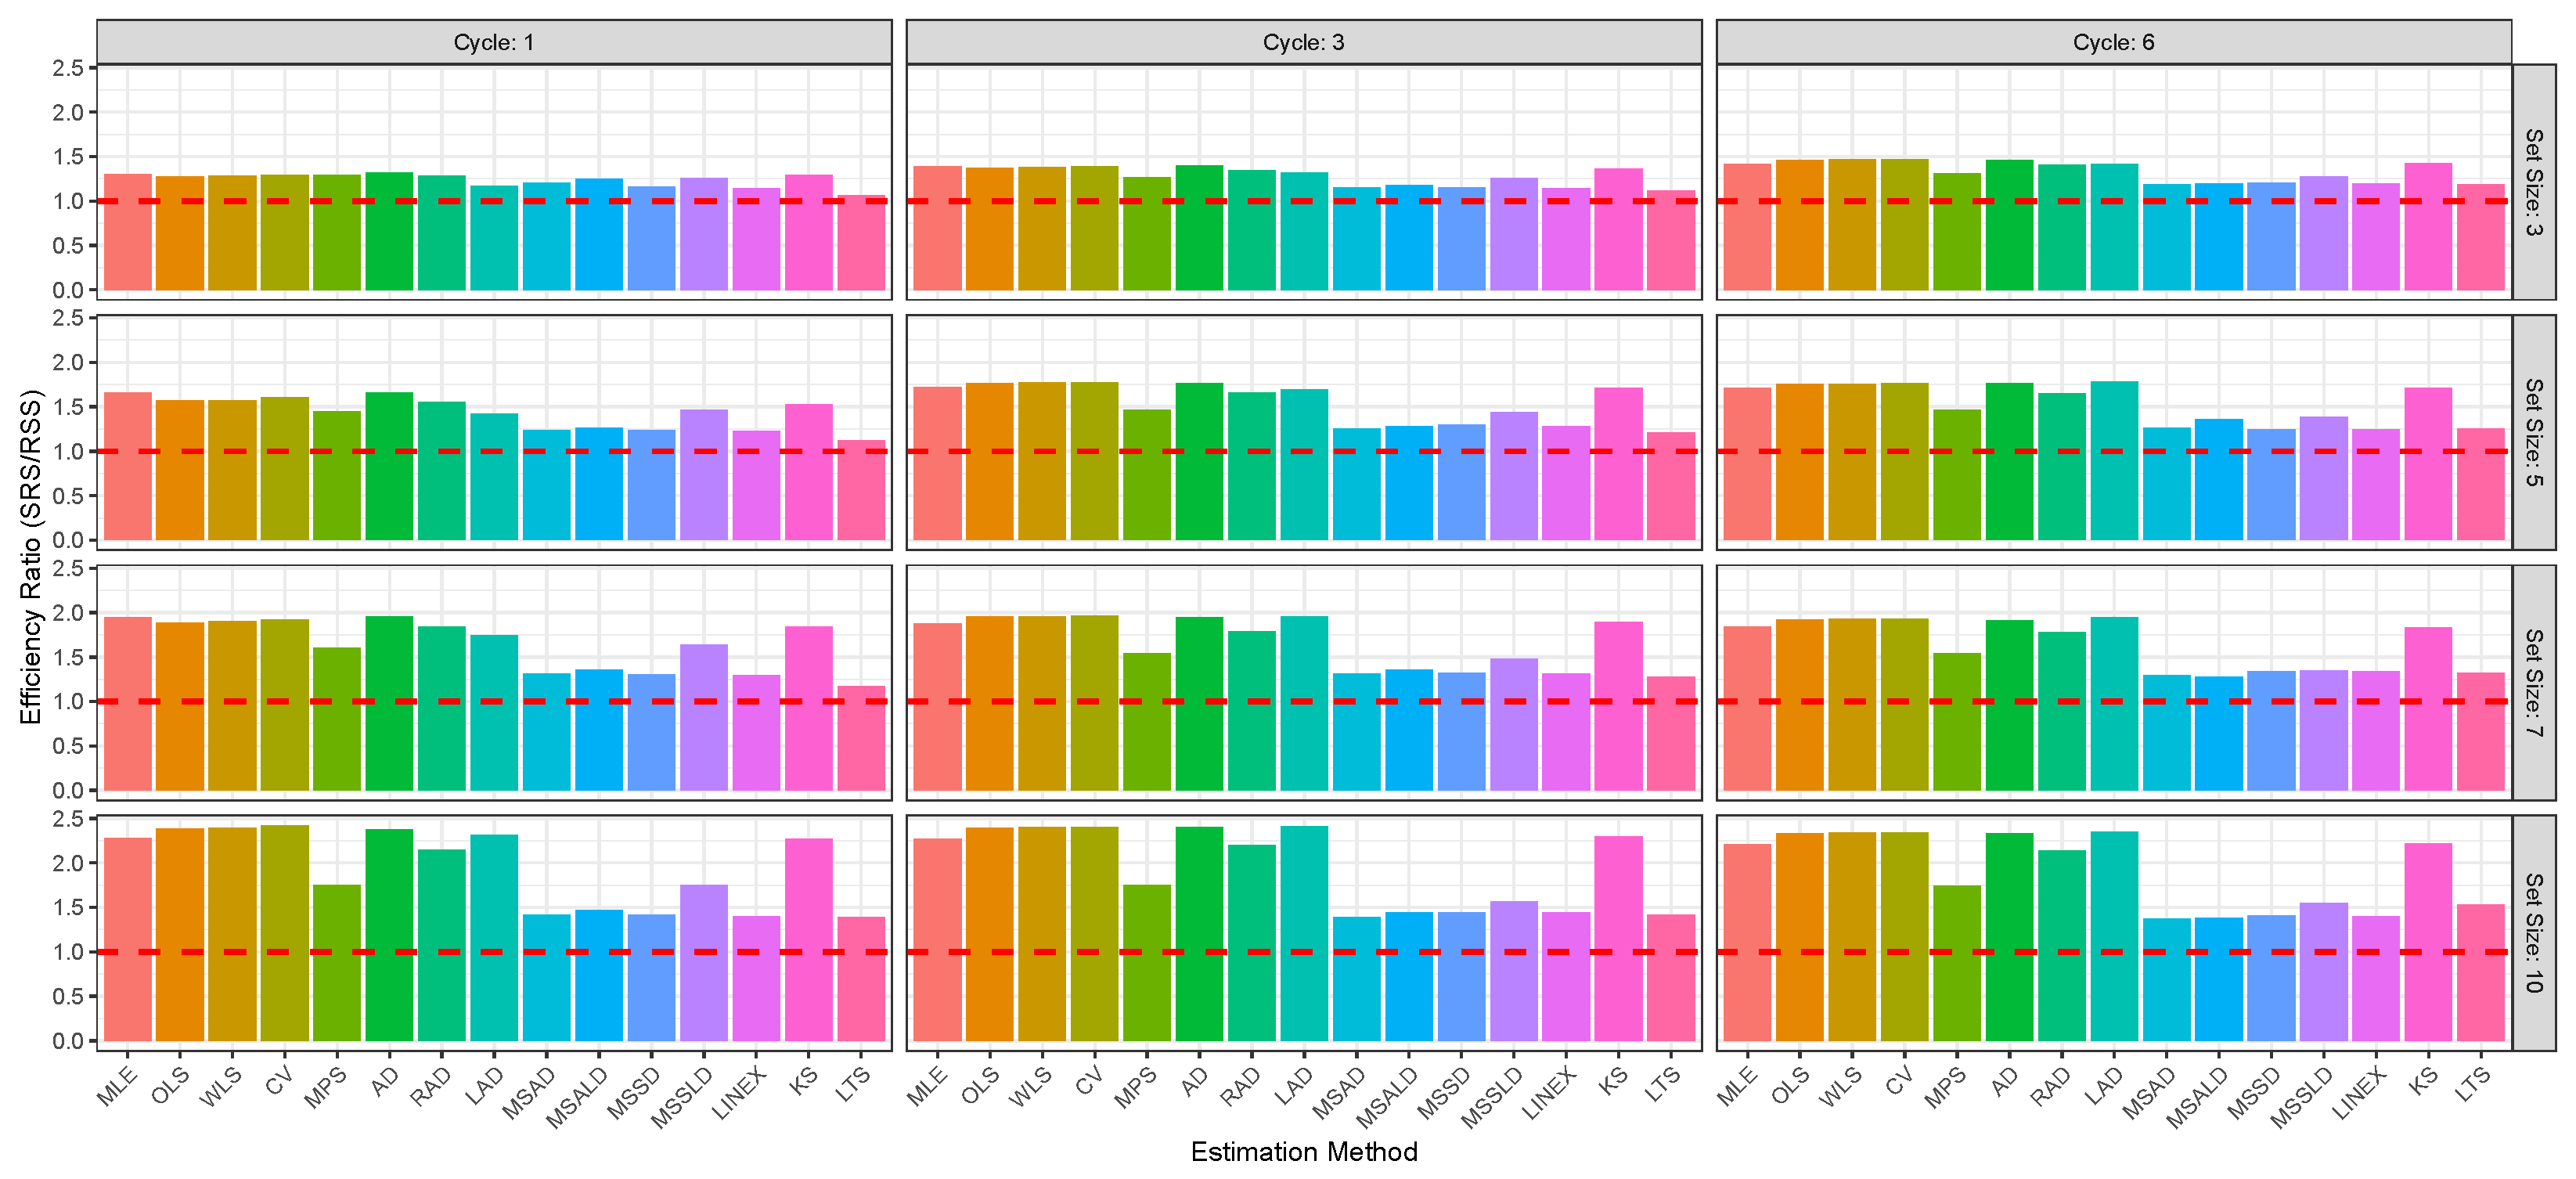
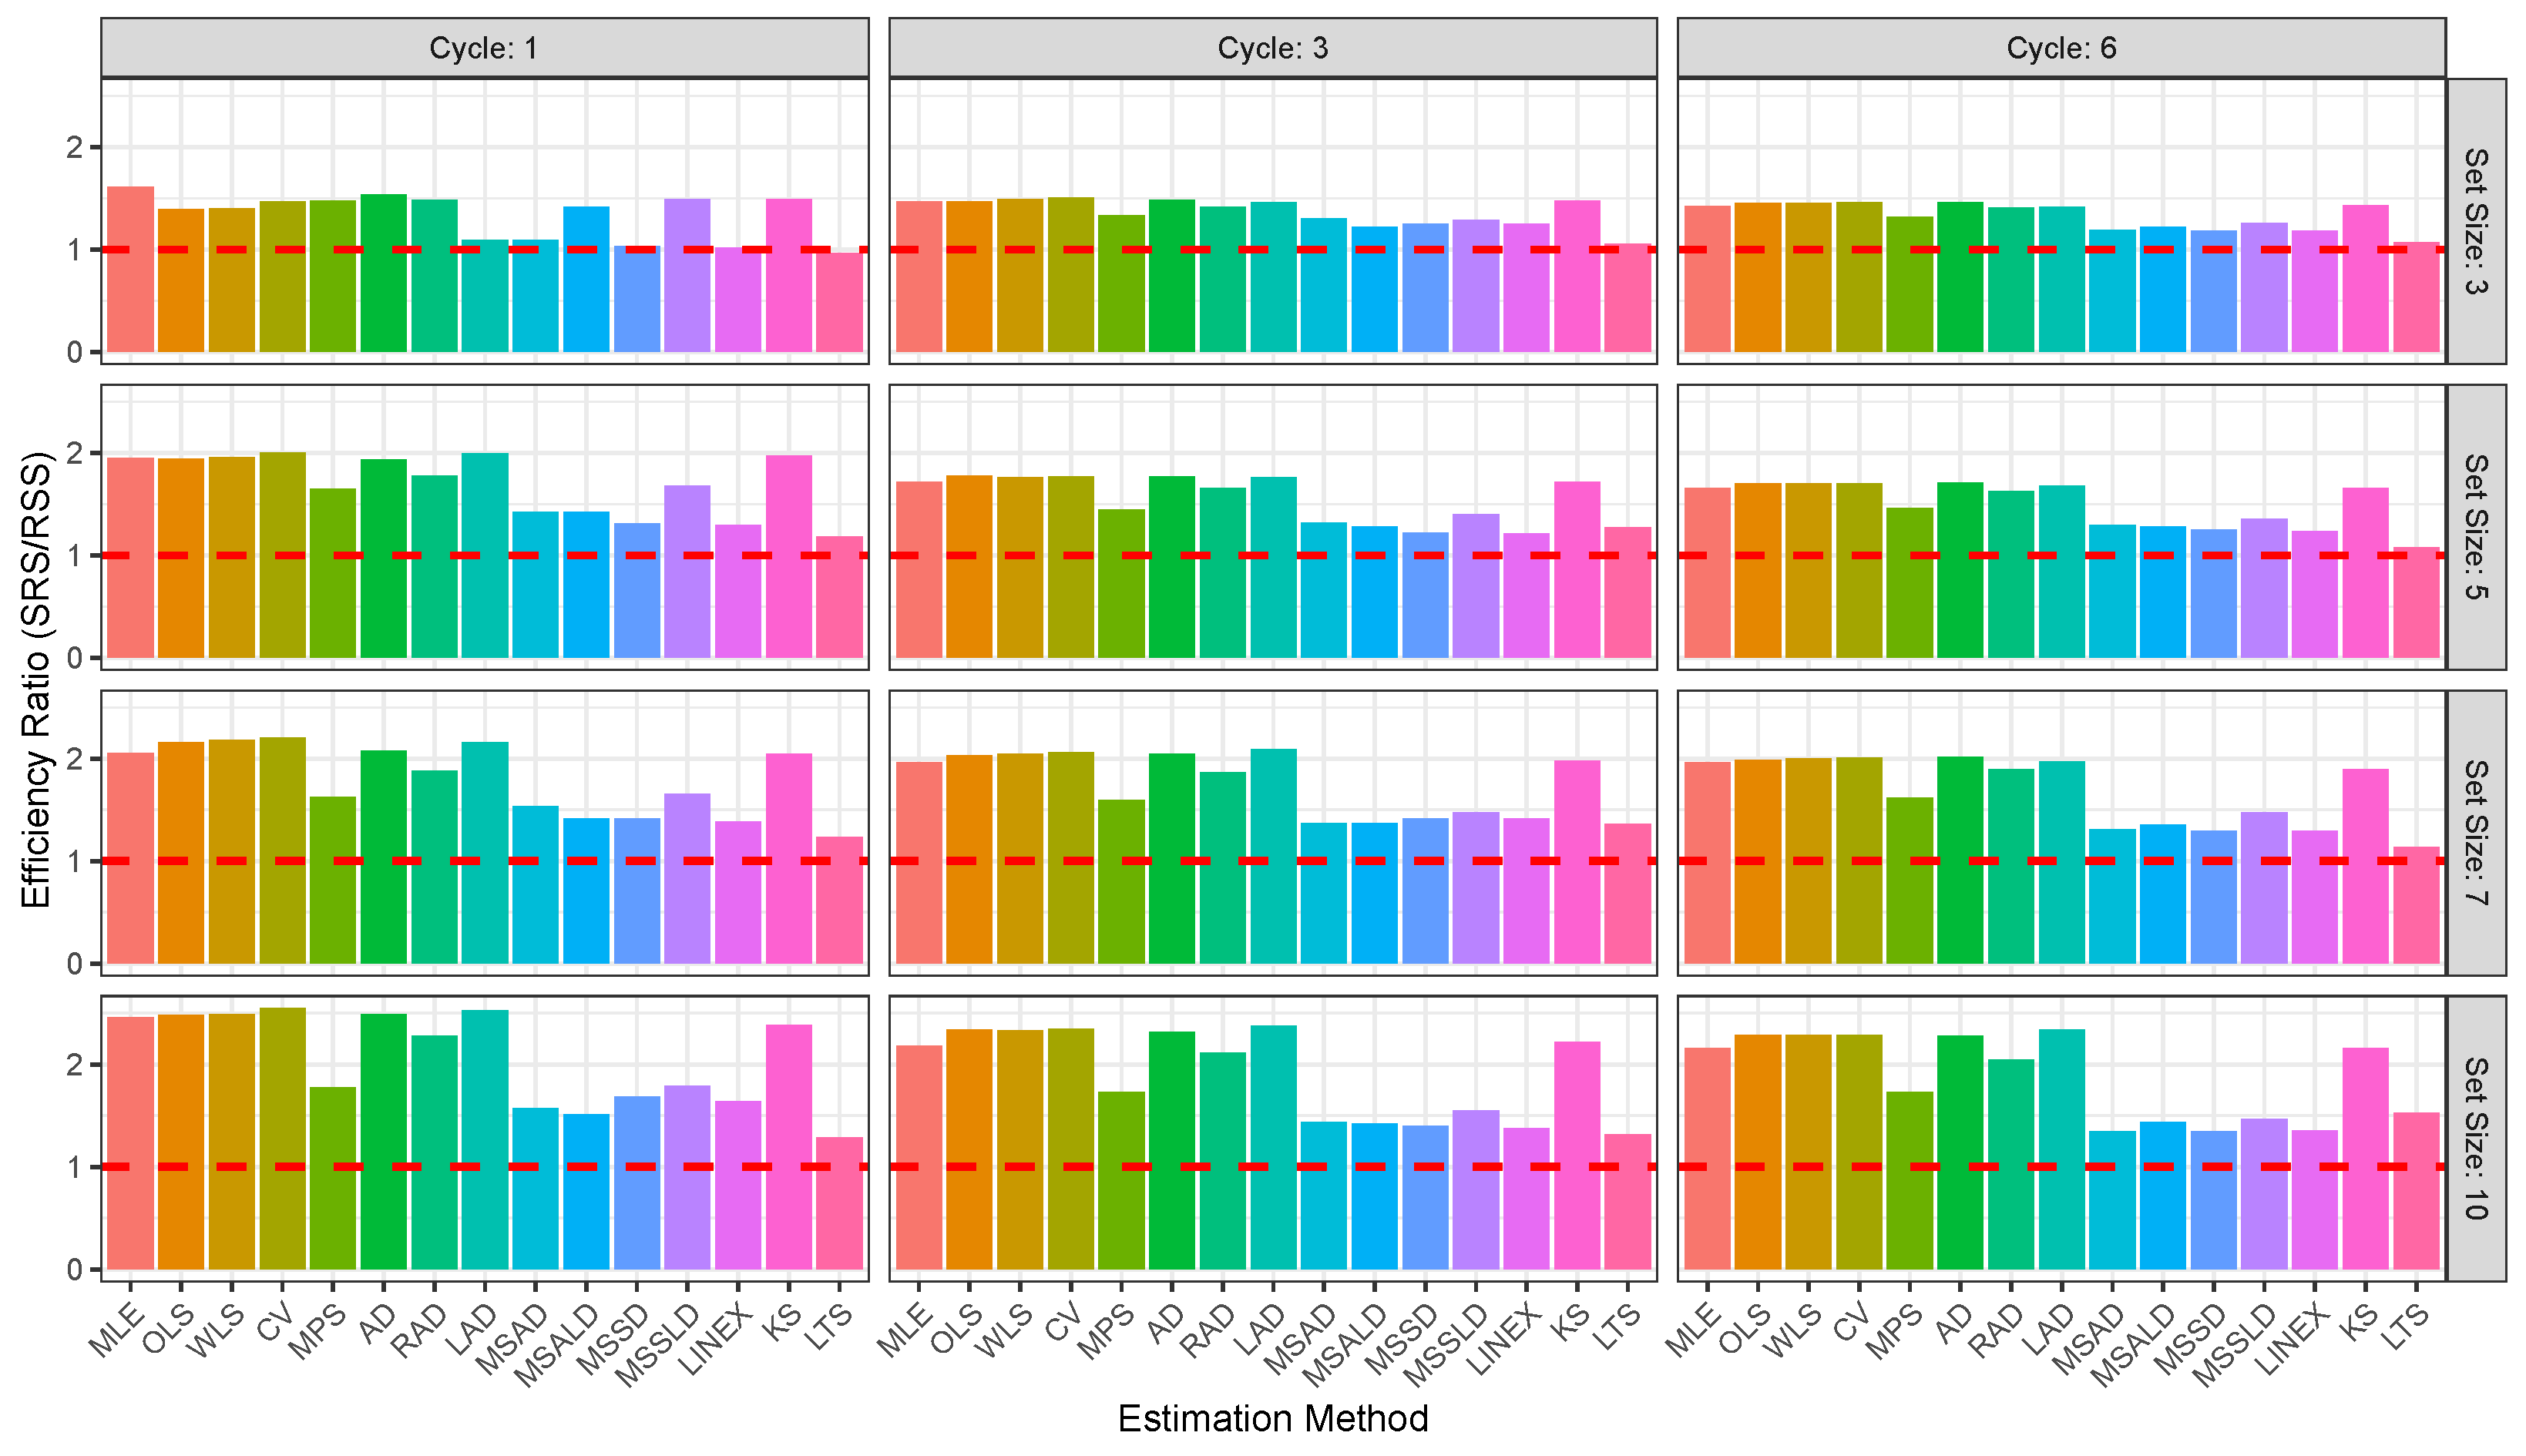
Figure 2, Figure 3, Figure 4, Figure 5, Figure 6 and Figure 7 enable direct comparison of estimation efficiency between SRS and RSS approaches. They display the efficiency ratios (ERs) between SRS and RSS which are calculated for the bias, MSE, and MRE as
E R ( Φ R S S , Φ S R S ) = Φ S R S Φ R S S , Φ = Bias , MSE , MRE .
For illustration of the reults given in Table 1, Table 2, Table 3 and Table 4, we consider three cases, namely the SRS with RSS, the parameter values based on SRS, and finally the effect of parameter values using RSS.
Table 1 and Table 2 aim to compare the RSS and SRS based on a simulation study for ψ = 2 . The following observations can be concluded:
  • The RSS consistently outperforms SRS across the 15 estimation methods, MLE, OLS, WLS, CV, MPS, AD, RAD, LAD, MSAD, MSALD, MSSD, MSSLD, LINEX, KS, LTS, and various sample sizes, delivering mean estimates closer to the true value of ψ = 2 , with lower bias, MSE, and MRE. For illustration:
    The RSS produces estimators closest to parameter ψ = 2 than SRS; for example, at n = 3 , ψ ^ M L E R S S = 2.2791 vs. ψ ^ M L E S R S = 2.6148 , and at n = 60 , ψ ^ M L E R S S = 2.0056 vs. ψ ^ M L E S R S = 2.0237 .
    Also, RSS exhibits lower bias across all methods and sizes; e.g., at n = 15 , B i a s ( ψ ^ M L E R S S ) = 0.2050 vs. B i a s ( ψ ^ M L E S R S ) = 0.3520 , and at n = 42 , B i a s ( ψ ^ M L E R S S ) = 0.1060 vs. B i a s ( ψ ^ M L E R S S ) = 0.2080 .
    Additionally, RSS achieves lower MSE, indicating better precision; e.g., at n = 18 , M S E ( ψ ^ M L E R S S ) = 0.0825 vs. M S E ( ψ ^ M L E S R S ) = 0.1764 , and at n = 30 , M S E ( ψ ^ M L E R S S ) = 0.0189 M S E ( ψ ^ M L E S R S ) = 0.0938 .
    The RSS shows smaller relative errors; e.g., at n = 5 , M R E ( ψ ^ M L E R S S ) = 0.1867 vs. M R E ( ψ ^ M L E S R S ) = 0.3638 , and at n = 60 , M R E ( ψ ^ M L E R S S ) = 0.0385 vs. M R E ( ψ ^ M L E S R S ) = 0.0830 .
  • Based on different estimation methods:
    MLE: RSS excels, e.g., n = 3   B i a s ( ψ ^ M L E R S S ) = 0.6573 , with MSE of 0.9807 vs. B i a s ( ψ ^ M L E S R S ) = 1.0585 , with MSE value 2.8469; and for n = 60 B i a s ( ψ ^ M L E R S S ) = 0.0769 , vs. B i a s ( ψ ^ M L E R S S ) = 0.1660 , with respective MSE values 0.0093 and 0.0450.
    OLS: RSS outperforms, e.g., n = 15   B i a s ( ψ ^ O L S R S S ) = 0.2199 , with MSE of 0.0794 vs. B i a s ( ψ ^ O L S S R S ) = 0.3906 , with MSE value 0.2823.
    MPS: RSS shines, often closest to 2, e.g., n = 18   ψ ^ M P S R S S = 1.9298 , with MSE of 0.0827 vs. ψ ^ M P S S R S = 1.9597 , with MSE value 0.1495.
    LAD: RSS reduces larger errors, e.g., n = 21   B i a s ( ψ ^ L A D R S S ) = 0.1778 , with MSE of 0.0526 vs. B i a s ( ψ ^ L A D S R S ) = 0.3716 , with MSE value 0.2650.
    LTS: RSS mitigates poor performance, e.g., n = 10 B i a s ( ψ ^ L T S R S S ) = 0.9824 , MSE = 4.3108 vs. B i a s ( ψ ^ L T S S R S ) = 1.2664 with MSE = 5.3731.
  • Based on the sample size impact, the RSS’s advantage is most notable in smaller samples. For example:
    When n = 3 , the MSE of the MLE is 0.9807 vs. SRS 2.8469, which narrows slightly in moderate sizes.
    For n = 21 , MSE of the MLE = 0.0353 vs. that based on the SRS 0.1468,
    and it persists in larger sizes; for n = 60 the MLE has MSE = 0.0093 vs. the 0.0450 MSE of SRS.
Based on Table 1 and Table 3 regarding parameter values, ψ = 2 (Table 1) and ψ = 5 (Table 3) under SRS design, one can see, in summary, that the results for ψ = 2 generally exhibit lower absolute bias and MSE, making them better in terms of raw accuracy and precision. However, we have the following specific comments:
  • The estimates in both tables tend to overestimate the true ψ , with values consistently above 2 and 5, respectively. This overestimation is more pronounced in absolute terms for ψ = 5 due to the larger true value.
  • Absolute bias is higher for ψ = 5 than for ψ = 2 across all methods and sample sizes. This is expected, as the same estimation error results in a larger deviation when the true value is 5 compared to 2. For instance, MPS has a bias of 0.8790 for ψ = 2 vs. 1.9816 for ψ = 5 at n = 3 .
  • MSE is consistently higher for ψ = 5 than for ψ = 2 , reflecting the larger scale of errors when estimating a true value of 5. For example, MPS has an MSE of 1.8264 for ψ = 2 vs. 5.9552 for ψ = 5 at 3 n = 3 , and 0.0427 vs. 0.3321 at n = 60 .
  • MRE provides a normalized measure of error and shows mixed results. For small sample sizes (e.g., n = 3 ), MRE is lower for ψ = 5 (e.g., 0.3963 vs. 0.4395 for MPS), indicating better relative accuracy. For larger sample sizes (e.g., n = 60 ), MRE is slightly lower for ψ = 2 (e.g., 0.0824 vs. 0.0926 for MPS), suggesting a slight advantage in relative terms as sample size increases.
  • As sample size n increases from n = 3 to n = 60 , both bias and MSE decrease significantly for ψ = 2 and ψ = 5 , indicating improved accuracy and precision with larger samples.
Utilizing the RSS method when ψ = 2 in Table 1 and ψ = 5 in Table 4, smaller ψ values lead to more stable and accurate estimation, and it is noted the following general trends:
  • As ψ increases from 2 to 5, both bias and MSE increase for most estimators. This suggests that larger values of ψ introduce more variability in estimation, making the estimation problem more challenging.
  • Increasing the sample size helps reduce the impact of larger ψ , leading to lower bias and MSE. However, for ψ = 5 , larger sample sizes are even more crucial to maintain estimation accuracy.

5. Real Data Analysis

To evaluate the effectiveness of the proposed estimation strategies, we chose two real-world datasets and performed a detailed analysis in this section. Our goal was to highlight potential applications and situations where these techniques can be successfully implemented. By carefully analyzing real-world data, this study highlights the practical significance of these estimation methods, demonstrating their relevance for applied research and data-driven decision-making. To compare the estimators, and to verify that our U-LD model provides a good fit for the dataset under study, we conduct a Kolmogorov–Smirnov (KSt) test, Anderson–Darling (ADt) test, and a Cramér–von Mises (CVt) test based on both SRS and RSS for all estimation methods considered in this study.
First Dataset: The first dataset under consideration consists of 20 items tested simultaneously, with their ordered failure times previously reported in [44]. The observed ordered data are as follows (Table 5).
A descriptive statistics to the data is given in Table 6, which shows that the skewness of the dataset is approximately 1.44, indicating that the distribution is positively skewed. Since the median is 0.1328, it means that 50 % of the data points fall below this value, and a standard deviation of 0.1573 suggests that most of the data points are fairly spread out from the mean, with a decent level of variability.
Also, Figure 8 presents graphical representations of the dataset, including the total time on test (TTT) plot, box plot, and violin plot. The estimated PDF, CDF, and probability–probability (PP) plots for failure times data are presented in Figure 9. These visualizations offer valuable insights into the dataset’s characteristics, facilitating a deeper understanding of its structure and trends.
Based on these data, we select a small RSS of size 4 while using the same sample size for the SRS. It is important to note that the SRS and RSS methods are compared using the same number of measured units. Using these methods, we estimate ψ for each design, assuming perfect ranking. The results are summarized in Table 7, indicating that the U-LD model fits the data well, as supported by various plots. For instance, for the OLS method based on RSS, the KSt value is 0.1812 with a p-value of 0.3756. The Anderson–Darling test yields a value of 2.2621 using SRS, while the Cramér–von Mises test result is 0.2151 in RSS. These findings collectively support the adequacy of our model in fitting the dataset. Figure 10 further reinforces this conclusion, where blue dots represent SRS values, red dots red dots represent RSS values. Table 7 highlights the superiority of RSS over SRS in estimating the distribution parameter. For illustration, based on the MSALD, the ADt values are 4.2025 and 2.2891 using SRS and RSS, respectively.
Second Dataset: The second dataset pertains to Turkey, which documented its first COVID-19 patient recovery on 26 March 2020 according to the World Health Organization (WHO). This dataset contains 25 observations of g collected from 27 March through 20 April. It was subsequently analyzed in study [45]. The chronologically ordered observations are as follows (Table 8).
Descriptive statistics of the COVID-19 data are presented in Table 9, revealing that the data are right-skewed with a skewness value of 0.91213. The COVID-19 data are illustrated using the TTT plot, box plot, and violin plot as shown in Figure 11, and the estimated PDF, CDF, and PP plots are offered in Figure 12.
Again, based on COVID-19 data, the estimators considered are compared and the U-LD model is fitted using the Kolmogorov–Smirnov test, the Anderson–Darling test, and the Cramér–von Mises test for both RSS and SRS across all estimation methods in this study. The results are summarized in Table 10, while Figure 13 presents the values of the ADt, CVt, and KSt measures, where blue dots represent SRS and red dots represent RSS. The findings indicate that the U-LD model fits the data accurately, as supported by various plots. For clarification, in the LTS method based on RSS, the KSt value is 0.1004 with a p-value of 0.9410. The Anderson–Darling test value is 0.5166, while the Cramér–von Mises test result is 0.0648. Regarding the comparison between SRS and RSS, Table 10 highlights the superiority of RSS over SRS in estimating the distribution parameter across all cases. For instance, based on the MSSD method, the KS values are 0.2603 and 0.1115, with corresponding p-values of 0.0555 and 0.8812 for SRS and RSS, respectively.
However, in general, it is important to emphasize that the RSS design exhibits superior efficiency compared to the SRS design, as evidenced by its smaller goodness-of-fit values. This consistent advantage of RSS over SRS is observed across all estimates. These findings highlight the benefits of using the RSS approach over SRS for fitting the dataset to the model and obtaining more efficient estimates.

6. Conclusions

This paper thoroughly investigates various estimation methods for the parameter of the U-LD under both RSS and SRS designs. A wide range of estimation techniques is explored, including maximum likelihood estimation, ordinary least squares, weighted least squares, maximum product of spacings, minimum spacing absolute distance, minimum spacing absolute log-distance, minimum spacing square distance, minimum spacing square log-distance, linear-exponential, Anderson–Darling (AD), right-tail AD, left-tail AD, left-tail second order, Cramér–von Mises, and Kolmogorov–Smirnov. The simulation study performed as part of this research shows that the estimators derived from RSS consistently outperform those derived from SRS across all the criteria considered: mean squared error, bias, and efficiency. This suggests that RSS provides more reliable and efficient parameter estimates when applied to the U-LD distribution. Additionally, the analysis of two real-world datasets, failure times of items, and COVID-19 data demonstrates the practical applicability of the proposed estimation methods. The findings clearly highlight the advantages of using RSS over SRS for statistical inference, particularly in the context of U-LD parameter estimation. In conclusion, this study underscores the superiority of RSS-based estimators in parameter estimation for the U-LD distribution. The results emphasize the importance of considering the sampling design when choosing appropriate estimation methods and recommend RSS as a preferable choice for enhanced statistical inference in various practical applications. Further research could explore the robustness of these findings under different sampling schemes and distributional assumptions.
Author Contributions

Conceptualization, S.A.B., A.I.A.-O. and G.A.; Methodology, S.A.B., A.I.A.-O. and G.A.; Software, S.A.B.; Validation, A.I.A.-O.; Investigation, A.I.A.-O. and G.A.; Resources, S.A.B.; Writing—original draft, S.A.B., A.I.A.-O. and G.A.; Writing—review & editing, S.A.B., A.I.A.-O. and G.A.; Visualization, S.A.B. and A.I.A.-O.; Funding acquisition, G.A. All authors have read and agreed to the published version of the manuscript.

Funding

This research was funded by Princess Nourah bint Abdulrahman University Researchers Supporting Project number (PNURSP2025R226), Princess Nourah bint Abdulrahman University, Riyadh, Saudi Arabia.

Data Availability Statement

All the data sets used in this paper are available within the manuscript.

Acknowledgments

The authors express their gratitude to Princess Nourah bint Abdulrahman University Researchers Supporting Project number (PNURSP2025R226), Princess Nourah bint Abdulrahman University, Riyadh, Saudi Arabia.

Conflicts of Interest

The authors declare that they have no conflicts of interest.

References

  1. Ghitany, M.E.; Mazucheli, J.; Menezes, A.F.B.; Alqallaf, F. The unit-inverse Gaussian distribution: A new alternative to two-parameter distributions on the unit interval. Commun. Stat.-Theory Methods 2019, 48, 3423–3438. [Google Scholar] [CrossRef]
  2. Mazucheli, J.; Menezes, A.F.; Dey, S. Unit-Gompertz distribution with applications. Statistica 2019, 79, 25–43. [Google Scholar]
  3. Korkmaz, M.C.; Korkmaz, Z.S. The unit log–log distribution: A new unit distribution with alternative quantile regression modeling and educational measurements applications. J. Appl. Stat. 2023, 50, 889–908. [Google Scholar] [CrossRef]
  4. Mazucheli, J.; Menezes, A.F.B.; Ghitany, M.E. The unit-Weibull distribution and associated inference. J. Appl. Probab. Stat. 2018, 13, 1–22. [Google Scholar]
  5. Korkmaz, M.C.; Chesneau, C. On the unit Burr-XII distribution with the quantile regression modeling and applications. Comput. Appl. Math. 2021, 40, 29. [Google Scholar] [CrossRef]
  6. Korkmaz, M.C.; Altun, E.; Chesneau, C.; Yousof, H.M. On the unit-Chen distribution with associated quantile regression and applications. Math. Slovaca 2022, 72, 765–786. [Google Scholar] [CrossRef]
  7. Korkmaz, M.C. The unit generalized half normal distribution: A new bounded distribution with inference and application. UPB Sci. Bull. Ser. A Appl. Math. Phys. 2020, 82, 133–140. [Google Scholar]
  8. Maya, R.; Jodra, P.; Irshad, M.R.; Krishna, A. The unit Muth distribution: Statistical properties and applications. Ric. Mat. 2024, 73, 1843–1866. [Google Scholar] [CrossRef]
  9. Mazucheli, J.; Menezes, A.F.; Dey, S. The unit-Birnbaum-Saunders distribution with applications. Chil. J. Stat. 2018, 9, 47–57. [Google Scholar]
  10. Al-Omari, A.I.; Alanzi, A.R.; Alshqaq, S.S. The unit two parameters Mirra distribution: Reliability analysis, properties, estimation and applications. Alex. Eng. J. 2024, 92, 238–253. [Google Scholar] [CrossRef]
  11. Fayomi, A.; Hassan, A.S.; Baaqeel, H.; Almetwally, E.M. Bayesian inference and data analysis of the unit–power Burr X distribution. Axioms 2023, 12, 297. [Google Scholar] [CrossRef]
  12. Mazucheli, J.; Menezes, A.F.B.; Chakraborty, S. On the one parameter unit-Lindley distribution and its associated regression model for proportion data. J. Appl. Stat. 2019, 46, 700–714. [Google Scholar] [CrossRef]
  13. Nadarajah, S.; Chan, S. On moments of the unit Lindley distribution. J. Appl. Stat. 2020, 47, 947–949. [Google Scholar] [CrossRef] [PubMed]
  14. Irshad, M.R.; D’Cruz, V.; Maya, R. The exponentiated unit Lindley distribution: Properties and applications. Ric. Mat. 2024, 72, 1121–1143. [Google Scholar] [CrossRef]
  15. Biswas, A.; Chakraborty, S. Stress–strength reliability for the unit-Lindley distribution with an application. Calcutta Stat. Assoc. Bull. 2021, 73, 7–23. [Google Scholar] [CrossRef]
  16. Akdur, H.T.K. Unit-Lindley mixed-effect model for proportion data. J. Appl. Stat. 2021, 48, 2389–2405. [Google Scholar] [CrossRef]
  17. Khalid, M.; Aslam, M. Bayesian Analysis of 3-Component Unit Lindley Mixture Model with Application to Extreme Observations. Math. Probl. Eng. 2022, 2022, 1713375. [Google Scholar] [CrossRef]
  18. McIntyre, G.A. A method of unbiased selective sampling, using ranked sets. Aust. J. Agric. Res. 1952, 3, 385–390. [Google Scholar] [CrossRef]
  19. Takahasi, K.; Wakimoto, K. On unbiased estimates of the population mean based on the sample stratified by means of ordering. Ann. Inst. Stat. Math. 1968, 20, 1–31. [Google Scholar] [CrossRef]
  20. Dell, T.R.; Clutter, J.L. Ranked set sampling theory with order statistic background. Biometrics 1972, 28, 545–555. [Google Scholar] [CrossRef]
  21. Patil, G.P.; Sinha, A.K.; Taillie, C. Ranked set sampling. In Handbook of Statistics; Patil, G.P., Rao, C.R., Eds.; North-Holland: Amsterdam, The Netherlands, 1994; Volume 12, pp. 167–200. [Google Scholar]
  22. Al-Omari, A.I.; Bouza, C.N. Review of ranked set sampling: Modifications and applications. Rev. Investig. Oper. 2014, 35, 215–240. [Google Scholar]
  23. Abu-Dayyeh, W.A.; Al-Subh, S.A.; Muttlak, H.A. Logistic parameters estimation using simple random sampling and ranked set sampling data. Appl. Math. Comput. 2004, 150, 543–554. [Google Scholar] [CrossRef]
  24. Yousef, O.M.; Al-Subh, S.A. Estimation of Gumbel parameters under ranked set sampling. J. Mod. Appl. Stat. Methods 2014, 13, 432–443. [Google Scholar] [CrossRef]
  25. Akgül, F.G.; Şenoğlu, B. Estimation of P(X < Y) using ranked set sampling for the Weibull distribution. Qual. Technol. Quant. Manag. 2017, 14, 296–309. [Google Scholar]
  26. Hussian, M.A. Bayesian and maximum likelihood estimation for Kumaraswamy distribution based on ranked set sampling. Am. J. Math. Stat. 2014, 4, 30–37. [Google Scholar]
  27. Haq, A.; Brown, J.; Moltchanova, E.; Ibrahim Al-Omari, A.I. Best linear unbiased and invariant estimation in location-scale families based on double-ranked set sampling. Commun. Stat.-Theory Methods 2016, 45, 25–48. [Google Scholar] [CrossRef]
  28. Jiang, H.; Gui, W. Bayesian inference for the parameters of Kumaraswamy distribution via ranked set sampling. Symmetry 2021, 13, 1170. [Google Scholar] [CrossRef]
  29. Koyuncu, N.; Al-Omari, A.I. Generalized robust-regression-type estimators under different ranked set sampling. Math. Sci. 2021, 15, 29–40. [Google Scholar] [CrossRef]
  30. Al-Omari, A.I.; Benchiha, S.; Almanjahie, I.M. Efficient Estimation of the Generalized Quasi-Lindley Distribution Parameters under Ranked Set Sampling and Applications. Math. Probl. Eng. 2021, 2021, 1–17. [Google Scholar] [CrossRef]
  31. Pedroso, V.C.; Taconeli, C.A.; Giolo, S.R. Estimation based on ranked set sampling for the two-parameter Birnbaum–Saunders distribution. J. Stat. Comput. Simul. 2021, 91, 316–333. [Google Scholar] [CrossRef]
  32. Alsadat, N.; Hassan, A.S.; Elgarhy, M.; Chesneau, C.; Mohamed, R.E. An efficient stress–Strength reliability estimate of the Unit gompertz distribution using ranked set sampling. Symmetry 2023, 15, 1121. [Google Scholar] [CrossRef]
  33. Irshad, M.; Maya, R.; Al-Omari, A.I.; Hanandeh, A.A.; Arun, S. Estimation of a parameter of farlie-gumbel-morgenstern bivariate bilal distribution by ranked set sampling. Reliab. Theory Appl. 2023, 18, 129–140. [Google Scholar]
  34. Al-Omari, A.I.; Abdallah, M.S. Estimation of the distribution function using moving extreme and MiniMax ranked set sampling. Commun. Stat.-Simul. Comput. 2023, 52, 1909–1925. [Google Scholar] [CrossRef]
  35. Sabry, M.H.; Almetwally, E.M. Estimation of the exponential Pareto Distributions Parameters under Ranked and Double Ranked Set Sampling Designs. Pak. J. Stat. Oper. Res. 2021, 17, 169–184. [Google Scholar] [CrossRef]
  36. Arnold, B.C.; Balakrishnan, N.; Nagaraja, H.N. A First Course in Order Statistics; John Wiley and Sons: New York, NY, USA, 1992. [Google Scholar]
  37. Swain, J.J.; Venkatraman, S.; Wilson, J.R. Least-squares estimation of distribution functions in Johnson’s translation system. J. Stat. Comput. Simul. 1988, 29, 271–297. [Google Scholar] [CrossRef]
  38. Cheng, R.C.H.; Amin, N.A.K. Maximum Product of Spacings Estimation with Application to the Lognormal Distribution; Technical Report; University of Wales: Cardiff, UK, 1979. [Google Scholar]
  39. Cheng, R.C.H.; Amin, N.A.K. Estimating parameters in continuous univariate distributions with a shifted origin. J. R. Stat. Soc. Ser. B (Methodol.) 1983, 45, 394–403. [Google Scholar] [CrossRef]
  40. Anderson, T.W.; Darling, D.A. Asymptotic theory of certain goodness of fit criteria based on stochastic processes. Ann. Math. Stat. 1952, 23, 193–212. [Google Scholar] [CrossRef]
  41. Anderson, T.W.; Darling, D.A. A test of goodness of fit. J. Am. Stat. Assoc. 1954, 49, 765–769. [Google Scholar] [CrossRef]
  42. Pettitt, A.N. A two-sample Anderson-Darling rank statistic. Biometrika 1976, 63, 161–168. [Google Scholar]
  43. MacDonald, P.D.M. Comment on “an estimation procedure for mixtures of distributions” by Choi and Bulgren. J. R. Stat. Soc. Ser. B (Methodol.) 1971, 33, 326–329. [Google Scholar] [CrossRef]
  44. Nigm, A.M.; Al-Hussaini, E.K.; Jaheen, Z.F. Bayesian one-sample prediction of future observations under Pareto distribution. Statistics 2003, 37, 527–536. [Google Scholar] [CrossRef]
  45. Basit, H.; Bashir, S.; Masood, B.; Mushtaq, N. Modelling Unit Interval COVID-19 Data: An Application of Unit Nadarajah-Haghighi Distribution. J. Asian Dev. Stud. 2023, 12, 766–778. [Google Scholar]
Figure 1. Plots of the density and hazard rate functions of the U-LD.
Mathematics 13 01645 g001
Figure 2. Efficiency ratio for bias when ψ = 2 .
Mathematics 13 01645 g002
Figure 3. Efficiency ratio for MSE when ψ = 2 .
Mathematics 13 01645 g003
Figure 4. Efficiency ratio for MRE when ψ = 2 .
Mathematics 13 01645 g004
Figure 5. Efficiency ratio for bias when ψ = 5 .
Mathematics 13 01645 g005
Figure 6. Efficiency ratio for MSE when ψ = 2 .
Mathematics 13 01645 g006
Figure 7. Efficiency ratio for MRE when ψ = 2 .
Mathematics 13 01645 g007
Figure 8. The TTT, box, and violin plots for Dataset 1.
Mathematics 13 01645 g008
Figure 9. The estimated PDF, CDF, and PP plots for Dataset 1.
Mathematics 13 01645 g009
Figure 10. Comparison of values of each measure of ADt, CVt, KSt for Dataset 1.
Mathematics 13 01645 g010
Figure 11. The TTT, box, and violin plots for Dataset 2.
Mathematics 13 01645 g011
Figure 12. The estimated PDF, CDF, and PP plots for Dataset 2.
Mathematics 13 01645 g012
Figure 13. Comparison of values of each measure of ADt, CVt, KSt for Dataset 2.
Mathematics 13 01645 g013
Table 1. Numerical values of simulation measures for ψ = 2 in SRS design.
m × r MetricMLEOLSWLSCVMPSADRADLADMSADMSALDMSSDMSSLDLINEXKSLTS
3 × 1Mean2.61482.48842.47022.51222.20062.33292.28952.79072.80582.22192.77802.34962.83332.45912.9992
Bias1.05851.10251.08901.08440.87900.93070.91361.35731.35900.91241.42330.93921.46331.04831.5891
MSE2.84693.31503.25883.17431.82642.09302.01695.33774.91012.02455.61172.17705.91482.85836.9945
MRE0.52920.55130.54450.54220.43950.46530.45680.67870.67950.45620.71160.46960.73160.52420.7945
3 × 3Mean2.18562.14022.12962.16861.98842.11632.08412.25022.26142.00742.26112.07612.29432.16872.8302
Bias0.48450.53420.52240.52810.44120.48840.46490.62720.70640.48710.79390.46590.82380.54661.2173
MSE0.44660.59550.56240.57720.32930.45010.39240.97061.39440.41022.05880.39322.23320.61424.8901
MRE0.24220.26710.26120.26410.22060.24420.23250.31360.35320.24360.39690.23300.41190.27330.6086
3 × 6Mean2.08032.04832.04272.06711.95972.04372.02822.09832.03911.98982.02032.01142.03212.06592.5867
Bias0.31710.35080.33870.34210.30330.32950.31370.39890.40170.35000.46690.32300.47860.36410.8932
MSE0.17640.22100.20410.21050.14950.18850.16880.31030.31340.20200.62780.17460.66510.23703.0428
MRE0.15860.17540.16930.17100.15160.16480.15680.19940.20080.17500.23350.16150.23930.18200.4466
5 × 1Mean2.36382.32232.30162.34962.06502.22792.16162.57652.57942.07842.55642.20122.61532.33133.1611
Bias0.72760.82020.80220.80460.62970.70010.65951.04101.07370.66771.15760.67881.20300.80701.6265
MSE1.34111.83711.79631.74340.89571.16221.03813.18403.31231.02204.05051.09094.26801.59177.6565
MRE0.36380.41010.40110.40230.31490.35010.32970.52050.53680.33390.57880.33940.60150.40350.8133
5 × 3Mean2.11352.08062.07372.10161.97422.07232.05432.13442.08361.98242.04532.03502.05362.09762.7232
Bias0.35200.39060.37620.38060.33070.36360.34620.44260.47340.37080.51180.35580.52320.40011.0321
MSE0.23290.28230.26280.27200.18850.24020.21860.38030.50750.23690.67340.22290.72600.29713.8606
MRE0.17600.19530.18810.19030.16540.18180.17310.22130.23670.18540.25590.17790.26160.20000.5161
5 × 6Mean2.03752.01772.01572.03171.95382.01662.00762.04871.99781.96421.96431.98731.96972.02972.4589
Bias0.23580.26340.25280.25390.23470.24800.23800.29810.31190.26830.33620.25760.34260.27410.7125
MSE0.09520.11580.10660.10890.08750.10280.09390.15410.16270.11710.26440.10660.28790.12712.1718
MRE0.11790.13170.12640.12700.11730.12400.11900.14910.15600.13420.16810.12880.17130.13710.3562
7 × 1Mean2.22742.18262.17202.21911.99572.13492.08992.35652.40052.01992.39392.09912.42922.20352.9987
Bias0.54930.61740.60480.61200.49140.54270.51430.76090.84660.53990.94220.52830.97180.61081.4101
MSE0.63600.96030.92690.95590.45310.60240.52151.71522.15390.53542.90660.54723.07840.86026.3773
MRE0.27470.30870.30240.30600.24570.27140.25710.38050.42330.27000.47110.26420.48590.30540.7051
7 × 3Mean2.06542.03902.03472.05611.95692.03412.02092.08252.02061.97292.01432.00792.01902.04962.5966
Bias0.29170.32520.31330.31560.28410.30480.28920.37160.37830.32080.44460.30100.45160.33530.8964
MSE0.14680.18290.16820.17330.12760.15740.13950.26500.25820.16420.58510.15200.60790.19693.2744
MRE0.14580.16260.15670.15780.14210.15240.14460.18580.18920.16040.22230.15050.22580.16760.4482
7 × 6Mean2.04302.03012.02942.04161.97702.02882.02172.05122.00311.98341.97391.99731.97682.03782.3620
Bias0.20800.22400.21640.21810.20250.21480.20770.24950.26020.23130.27390.22160.27770.23000.5691
MSE0.07110.08300.07710.07880.06480.07540.07030.10530.10720.08380.13920.07840.14750.08841.4095
MRE0.10400.11200.10820.10910.10120.10740.10390.12480.13010.11570.13700.11080.13880.11500.2846
10 × 1Mean2.16442.11962.10962.14741.98062.10382.07272.23172.20051.99482.22002.06922.24822.14772.9095
Bias0.45540.49700.48260.48900.41640.45880.43770.59120.62950.46330.74830.45040.77070.50801.2664
MSE0.38130.48420.45300.46800.28840.38420.34000.81020.97340.36491.83280.35311.94250.50615.3731
MRE0.22770.24850.24130.24450.20820.22940.21890.29560.31470.23160.37410.22520.38530.25400.6332
10 × 3Mean2.03582.02292.02102.03691.95192.01932.00872.05322.00811.95941.96861.98101.97032.03582.4468
Bias0.23790.27040.25860.25970.23510.25440.24260.30420.32680.26990.33260.25160.33640.27870.6983
MSE0.09380.12070.11090.11320.08630.10550.09490.16120.18280.11330.23560.10170.24390.12972.0157
MRE0.11890.13520.12930.12990.11750.12720.12130.15210.16340.13490.16630.12580.16820.13940.3492
10 × 6Mean2.02372.01172.01172.02061.97372.01132.00772.02451.99331.97891.95981.99511.96152.01662.2897
Bias0.16600.18550.17840.17890.16490.17670.16800.20710.21410.19050.22850.18020.23100.19080.4862
MSE0.04500.05550.05110.05170.04270.04980.04560.06980.07540.05760.08760.05170.09170.05911.1780
MRE0.08300.09270.08920.08950.08240.08840.08400.10360.10700.09520.11430.09010.11550.09540.2431
Table 2. Numerical values of simulation measures for ψ = 2 in RSS design.
m × r MetricMLEOLSWLSCVMPSADRADLADMSADMSALDMSSDMSSLDLINEXKSLTS
3 × 1 Mean2.27912.28262.25962.28231.94992.10902.03252.83732.77691.93662.78652.10692.87142.24633.2292
Bias0.65730.79170.77560.73930.59540.60500.61471.24201.24740.64541.37740.63041.44090.70211.6464
MSE0.98071.71261.66061.41200.68430.78540.76525.23634.48850.79415.71970.83616.13001.19377.8607
MRE0.32870.39590.38780.36970.29770.30250.30740.62100.62370.32270.68870.31520.72040.35110.8232
3 × 3Mean2.10362.06052.05032.08991.92802.04972.01502.16662.13381.93922.13582.02552.15902.09602.8852
Bias0.32970.36350.35000.35070.33130.32890.32770.42980.54310.39870.63580.36070.66040.37041.1554
MSE0.19900.24200.22190.22680.17730.18850.18540.39230.74620.25791.29580.22821.41770.24764.9567
MRE0.16490.18180.17500.17540.16560.16450.16380.21490.27160.19940.31790.18040.33020.18520.5777
3 × 6Mean2.04312.01842.01292.03751.92982.01681.99862.07071.99271.93541.98831.98721.99362.03812.6128
Bias0.22300.24170.23280.23420.23040.22550.22320.28130.33720.28720.39590.25620.40410.25480.8354
MSE0.08250.09820.09040.09330.08270.08390.08060.14430.20370.13000.48390.10600.51270.11043.0274
MRE0.11150.12090.11640.11710.11520.11270.11160.14060.16860.14360.19800.12810.20200.12740.4177
5 × 1Mean2.09672.05002.03102.08441.85742.01851.95572.23232.29841.83322.31891.98452.37382.08553.0986
Bias0.37330.42160.41030.40240.38220.36260.37120.52140.75510.46930.88170.40380.92770.40891.3777
MSE0.24370.36420.34150.30940.22650.21810.22340.73821.70280.34412.69930.27542.97020.30556.3727
MRE0.18670.21080.20520.20120.19110.18130.18560.26070.37750.23470.44080.20190.46390.20450.6888
5 × 3Mean2.03622.00782.00472.03331.91152.01031.98942.06532.00111.91112.00651.96552.01952.03712.6180
Bias0.20500.21990.21320.21490.22850.20540.20890.25170.35910.28930.41920.25350.43190.23340.8125
MSE0.06930.07940.07410.07640.07940.06860.07050.10810.23620.12980.58340.10110.63380.09082.8942
MRE0.10250.10990.10660.10740.11430.10270.10450.12580.17960.14460.20960.12670.21600.11670.4063
5 × 6Mean2.01632.00912.00552.02131.93462.00621.99382.03571.97611.94601.94411.96821.94872.02072.4989
Bias0.14260.15510.14840.14930.16080.14490.14630.17780.24060.20950.26980.19040.27660.16570.6612
MSE0.03220.03870.03500.03580.03890.03320.03360.05150.09390.06720.16580.05570.18540.04392.3645
MRE0.07130.07760.07420.07470.08040.07250.07310.08890.12030.10480.13490.09520.13830.08290.3306
7 ×1Mean2.05702.01451.99862.04761.84802.00731.95942.13962.09441.82262.14321.93832.18072.06012.9184
Bias0.26780.28580.27750.27730.30230.26150.27330.35220.55030.38060.66690.31860.70160.29851.1400
MSE0.12130.14530.13440.13480.13720.11220.11890.29000.82230.21451.60500.16121.78030.15615.1460
MRE0.13390.14290.13870.13860.15120.13070.13660.17610.27510.19030.33350.15930.35080.14920.5700
7 × 3Mean2.01001.99521.99012.01111.90911.99471.98192.02651.95901.90671.94681.94911.94752.01162.4902
Bias0.14840.16010.15330.15330.17820.14870.15490.17780.27580.23430.31410.20370.31870.16960.6576
MSE0.03530.04160.03790.03840.04890.03550.03820.05260.12260.08380.28190.06480.29030.04612.3627
MRE0.07420.08000.07660.07660.08910.07430.07750.08890.13790.11720.15700.10190.15930.08480.3288
7 × 6Mean2.01222.00492.00322.01531.94902.00431.99622.02241.97551.95311.94781.97181.94802.01242.3800
Bias0.10600.11280.10790.10870.12510.10670.10960.12650.19860.17090.21190.15010.21420.12140.4994
MSE0.01770.02030.01840.01880.02360.01790.01900.02590.06320.04540.07540.03620.07730.02341.6739
MRE0.05300.05640.05400.05430.06260.05330.05480.06320.09930.08550.10600.07500.10710.06070.2497
10 × 1Mean2.02311.98881.98032.01871.85701.99241.96322.06201.98731.84591.97221.92781.99942.02132.8033
Bias0.18530.20000.19360.19200.23450.18420.19190.23390.39990.30670.44330.25110.47070.21280.9824
MSE0.05470.06250.05850.05940.08120.05280.05760.10140.32310.13950.62650.10080.77840.07394.3108
MRE0.09260.10000.09680.09600.11720.09210.09590.11700.20000.15340.22160.12560.23530.10640.4912
10 × 3Mean2.00461.99261.99022.00621.92661.99441.98522.01501.95341.93001.93051.96021.93632.00422.4011
Bias0.10890.11570.11080.11070.13590.10980.11490.12800.22780.18990.23710.16210.24420.12550.5302
MSE0.01890.02110.01950.01960.02840.01900.02090.02680.08220.05570.12430.04140.14670.02531.7476
MRE0.05450.05790.05540.05540.06790.05490.05740.06400.11390.09500.11850.08110.12210.06280.2651
10 × 6Mean2.00561.99961.99962.00841.95732.00061.99612.01031.97651.96281.94921.97381.94912.00642.2248
Bias0.07690.08120.07800.07820.09550.07750.08210.08860.15930.13240.16940.12280.17080.08830.3188
MSE0.00930.01070.00970.00980.01400.00950.01030.01290.03970.02740.04520.02440.04600.01250.7777
MRE0.03850.04060.03900.03910.04770.03870.04110.04430.07970.06620.08470.06140.08540.04420.1594
Table 3. Numerical values of simulation measures for ψ = 5 in SRS design.
m × r MetricMLEOLSWLSCVMPSADRADLADMSADMSALDMSSDMSSLDLINEXKSLTS
3 × 1Mean6.01635.64425.58445.74885.15585.50115.34675.98345.31555.07224.75035.49174.73445.71396.1540
Bias2.13862.26332.22842.23291.98162.04261.99702.41502.09422.03992.11952.02602.12582.22152.6270
MSE7.29577.65267.45197.57845.95526.43676.17598.67916.58636.20356.29136.40916.30167.44089.8642
MRE0.42770.45270.44570.44660.39630.40850.39940.48300.41880.40800.42390.40520.42520.44430.5254
3 × 3Mean5.48585.28985.26875.38114.94205.25925.19085.48025.15355.01134.89325.18444.88075.35326.0345
Bias1.27541.34891.32551.34331.17111.26131.21261.50741.43671.29621.51041.23141.51581.38372.0922
MSE2.85783.20533.05633.16172.23012.74292.50313.96383.30822.70733.64372.55163.65323.30027.1188
MRE0.25510.26980.26510.26870.23420.25230.24250.30150.28730.25920.30210.24630.30320.27670.4184
3 × 6Mean5.26385.21215.19145.26144.90945.18455.13595.33315.08224.94714.91275.05644.91255.24575.9793
Bias0.88290.98690.95310.96300.84220.91860.88011.10361.08840.94991.15580.89611.16791.00641.7682
MSE1.38141.73991.62461.68111.13891.48411.33112.21042.00471.47622.22521.33982.26851.78535.6682
MRE0.17660.19740.19060.19260.16840.18370.17600.22070.21770.19000.23120.17920.23360.20130.3536
5 × 1Mean5.70375.41465.34385.52274.98245.34665.21945.66665.15395.00444.80665.28794.79705.48976.0339
Bias1.70911.80631.75281.79011.56901.65921.59951.96181.75461.67421.85931.63321.86251.79762.3403
MSE4.94905.32975.02905.30633.93544.54374.21076.21124.84544.39375.16904.36315.16775.26938.3522
MRE0.34180.36130.35060.35800.31380.33180.31990.39240.35090.33480.37190.32660.37250.35950.4681
5× 3Mean5.30875.21545.20055.28174.91325.19225.13375.37345.10844.96014.86625.08884.85825.28395.9716
Bias0.98521.09671.06071.07060.93611.01530.96851.22301.17591.03241.25590.99161.26341.12511.8366
MSE1.74952.11861.98452.05031.44071.80011.62422.68152.34221.74642.66301.68582.68482.23305.8715
MRE0.19700.21930.21210.21410.18720.20310.19370.24460.23520.20650.25120.19830.25270.22500.3673
5 × 6Mean5.15345.12405.11315.16044.90965.10515.06735.21885.04364.94264.91194.99974.91105.15995.7697
Bias0.67890.76550.73300.73900.65690.71510.67810.86930.86300.76500.91260.71260.91970.79661.4572
MSE0.77450.99950.91040.93580.68410.85230.76221.31841.26000.92321.44320.82271.46131.06604.1061
MRE0.13580.15310.14660.14780.13140.14300.13560.17390.17260.15300.18250.14250.18390.15930.2914
7 × 1Mean5.54695.33645.29745.42584.92815.28525.18465.56255.16174.94624.88725.19824.87665.41666.0369
Bias1.44271.54961.51161.52451.34411.43091.37311.69661.59201.43731.68721.41171.69001.56882.1804
MSE3.70394.08883.88114.00202.92233.46543.19864.91664.06303.28504.41093.32484.41024.17977.6246
MRE0.28850.30990.30230.30490.26880.28620.27460.33930.31840.28750.33740.28230.33800.31380.4361
7 × 3Mean5.19165.14325.12895.19184.87855.11865.06885.26915.06004.92174.86445.00744.85965.18935.8850
Bias0.80090.88940.85420.86320.76820.82630.78801.00720.99260.87481.05860.83071.06670.92211.6339
MSE1.06791.39201.27371.31320.91891.15241.01811.84071.63201.20661.89871.09781.92281.47964.9515
MRE0.16020.17790.17080.17260.15360.16530.15760.20140.19850.17500.21170.16610.21330.18440.3268
7 × 6Mean5.09135.05435.04765.08254.90195.04635.02955.10634.99114.93964.86334.98124.86405.07245.5953
Bias0.54620.61080.58240.58610.53760.57330.54900.67970.69990.60860.76310.57910.76960.62921.2063
MSE0.49590.62300.56430.57490.45960.54080.49410.79630.80480.58930.98030.54711.00210.66403.0215
MRE0.10920.12220.11650.11720.10750.11470.10980.13590.14000.12170.15260.11580.15390.12580.2413
10 × 1Mean5.38165.26735.23875.34444.87205.22285.13365.46865.09164.88634.83105.10204.81705.33826.0120
Bias1.20201.34991.31261.32771.12821.24341.16521.52531.39401.25691.46581.20181.47341.37122.0923
MSE2.58503.16452.99833.11332.07832.66582.34254.04513.20962.52053.49402.45573.50063.25307.1220
MRE0.24040.27000.26250.26550.22560.24870.23300.30510.27880.25140.29320.24040.29470.27420.4185
10 × 3Mean5.14885.09395.08925.13664.90545.08805.06305.17955.04874.94064.91035.00014.91045.12815.7974
Bias0.66700.75070.72070.72700.64820.70690.67380.85030.86210.74730.91100.69540.91790.77651.4901
MSE0.76670.96820.89480.91880.67890.84480.75831.28901.23740.90991.43420.80911.45591.04354.2995
MRE0.13340.15010.14410.14540.12960.14140.13480.17010.17240.14950.18220.13910.18360.15530.2980
10 × 6Mean5.05725.03795.03465.06074.91205.03365.01565.08574.97224.92694.89824.96434.89925.05365.5567
Bias0.46160.51350.49260.49410.46290.48680.47050.57380.59340.52310.64160.50950.64630.53121.0679
MSE0.34890.42940.39490.40090.33210.38630.35560.54460.57470.43130.67220.40930.68330.46122.4519
MRE0.09230.10270.09850.09880.09260.09740.09410.11480.11870.10460.12830.10190.12930.10620.2136
Table 4. Numerical values of simulation measures for ψ = 5 in RSS design.
m × r MetricMLEOLSWLSCVMPSADRADLADMSADMSALDMSSDMSSLDLINEXKSLTS
3 × 1Mean5.70705.43555.36745.55114.81745.26665.06346.02895.10244.66904.58615.22934.61245.55236.3937
Bias1.64851.77471.73871.72361.53841.54971.55912.05851.73911.63971.83241.61551.85521.71472.4671
MSE4.71775.14894.93784.96693.63613.97323.87976.89724.77804.01124.92534.20185.04784.91029.2251
MRE0.32970.35490.34770.34470.30770.30990.31180.41170.34780.32790.36650.32310.37100.34290.4934
3 ×3Mean5.26775.13555.11445.23394.77555.11235.02415.39094.99334.79984.77355.00444.77315.24096.1035
Bias0.91710.98150.95780.96460.92590.90270.90301.13981.24911.10111.31370.98171.32841.01221.8801
MSE1.49851.73941.65211.71101.33651.41031.36462.43662.46551.87142.77921.57882.82991.83786.3713
MRE0.18340.19630.19160.19290.18520.18050.18060.22800.24980.22020.26270.19630.26570.20240.3760
3 × 6Mean5.14915.07305.05995.13104.83495.06835.03185.19634.97674.86164.78424.99044.78905.13065.8489
Bias0.62530.67450.64910.65710.64260.62910.62360.77770.91520.79500.96190.70190.97450.70771.4939
MSE0.66530.75930.70080.72770.64950.65260.64031.04891.38210.99781.51190.81671.55950.83784.4176
MRE0.12510.13490.12980.13140.12850.12580.12470.15550.18300.15900.19240.14040.19490.14150.2988
5 × 1Mean5.28125.11595.04575.23144.59875.04564.88155.55254.88334.53944.52724.95254.55015.25686.2576
Bias1.03221.14871.11601.11571.08101.00071.02651.37881.42211.32381.49841.11321.51651.17372.0771
MSE1.86002.30492.13902.21601.75921.65921.68363.49713.21662.61433.41102.00813.49952.42257.3386
MRE0.20640.22970.22320.22310.21620.20010.20530.27580.28440.26480.29970.22260.30330.23470.4154
5 × 3Mean5.10085.02745.01465.09684.75315.02404.97225.18144.93294.77784.78014.90924.77905.09735.9251
Bias0.57360.62110.59870.60370.63950.57640.58460.72310.93940.80670.97020.68910.98350.65581.5147
MSE0.54080.62470.57590.59710.61350.53200.54050.93981.40200.98781.59410.75211.63770.71544.6201
MRE0.11470.12420.11970.12070.12790.11530.11690.14460.18790.16130.19400.13780.19670.13120.3029
5 × 6Mean5.04695.01955.01015.05664.81505.01444.98885.08594.94264.84254.79614.90304.79625.04475.7196
Bias0.39570.43570.41630.41930.44690.40500.40960.48800.68420.56350.73080.51510.73950.46551.1645
MSE0.25560.30430.28090.28800.31260.26630.27090.40400.75990.49110.85230.41910.87480.34823.1413
MRE0.07910.08710.08330.08390.08940.08100.08190.09760.13680.11270.14620.10300.14790.09310.2329
7 × 1Mean5.18025.04715.00645.15194.59335.03344.91325.35424.81764.52734.61294.86954.61905.17116.2442
Bias0.74080.82290.79490.79500.83710.73240.74680.97091.21041.06201.28940.86331.30700.85221.8648
MSE0.94571.15781.07691.11231.02630.88710.89901.75892.33881.65182.58931.18312.64781.25276.3950
MRE0.14820.16460.15900.15900.16740.14650.14940.19420.24210.21240.25790.17270.26140.17040.3730
7 × 3Mean5.05055.00144.98905.05254.76545.00404.96515.10294.91154.77094.74334.89764.75015.05485.8278
Bias0.42610.45440.43710.43860.49760.42500.44030.51400.75490.64540.79840.55950.81390.48551.2771
MSE0.29100.33150.30210.30930.37210.28940.30520.43490.95660.64161.09080.48981.14530.38323.6990
MRE0.08520.09090.08740.08770.09950.08500.08810.10280.15100.12910.15970.11190.16280.09710.2554
7 × 6Mean5.02804.99934.99685.03264.85515.00224.98385.04844.91744.86724.82654.93354.82715.02185.5840
Bias0.29720.31840.30200.30320.34760.29930.30910.34930.53950.47600.56850.42860.57480.34280.9130
MSE0.13980.15900.14420.14680.18680.14140.15130.19640.45800.35460.52980.28420.54470.18662.0757
MRE0.05940.06370.06040.06060.06950.05990.06180.06990.10790.09520.11370.08570.11500.06860.1826
10 × 1Mean5.07684.98264.95205.06424.61024.98674.91095.17354.81094.56504.62264.81744.62545.07315.9994
Bias0.52770.56660.54880.54870.64540.52310.54160.65790.98560.85311.03570.68711.05460.60351.5077
MSE0.46070.53010.49130.50370.63090.44160.46460.77051.55881.08361.70910.74301.77470.62094.6838
MRE0.10550.11330.10980.10970.12910.10460.10830.13160.19710.17060.20710.13740.21090.12070.3015
10 × 3Mean5.04445.00995.00545.05294.81415.01734.99375.07354.93954.80224.81884.89764.81795.04675.7335
Bias0.29390.31410.29950.30270.37000.29400.30570.35240.62090.51640.63070.44420.63770.33811.0512
MSE0.13580.15460.14020.14480.20680.13440.14500.19760.62250.40340.65110.31730.66610.18302.7578
MRE0.05880.06280.05990.06050.07400.05880.06110.07050.12420.10330.12610.08880.12750.06760.2102
10 × 6Mean5.01074.99484.99325.01914.87534.99624.98465.02354.92814.88014.87164.91364.87165.00765.4286
Bias0.20860.21990.21030.21130.26600.20880.22020.24380.43310.37760.45680.33000.46090.23920.6988
MSE0.06910.07710.07110.07210.10890.06970.07690.09580.29280.21790.33710.17550.34370.09071.3945
MRE0.04170.04400.04210.04230.05320.04180.04400.04880.08660.07550.09140.06600.09220.04780.1398
Table 5. Failure times data set.
0.00090.00400.01420.02210.02610.04180.04730.08340.10910.1252
0.14040.14980.17500.20310.20990.21680.29180.34650.40350.6143
Table 6. Descriptive statistics of failure times data set.
MeasureValueMeasureValue
Count20Skewness1.4406
Mean0.1613Kurtosis2.3473
Standard Deviation0.1573Variance0.0248
Min0.0009Range0.6134
25th Percentile (Q1)0.0379Median0.1328
75th Percentile (Q3)0.2116Max0.6143
Table 7. Estimates and test statistics for each method under the two sampling schemes, SRS and RSS.
Method ψ ^ ADtCVtKStp-Value
SRS RSS SRS RSS SRS RSS SRS RSS SRS RSS
MLE4.06254.61531.66891.08200.23870.12710.19990.35330.17770.4977
OLS3.70684.15522.26211.54460.35090.21510.23650.18120.19610.3756
WLS3.65224.12742.37131.58060.37150.22190.24290.15930.19730.3689
CV3.79724.29242.09261.38080.31880.18410.22610.22170.19060.4102
MPS3.38123.96152.99571.81780.48940.26690.27600.07730.20780.3090
AD3.77674.30212.12981.37020.32590.18200.22850.21210.19020.4127
RAD3.80874.42552.07191.24370.31490.15800.22480.22730.18530.4453
LAD3.72884.12402.21961.58510.34290.22280.23400.19060.19740.3680
MSAD2.98533.69314.20252.28910.71560.35600.32840.02020.23810.1755
MSALD2.98533.69314.20252.28910.71560.35600.32840.02020.23810.1755
MSSD3.32663.92383.13971.87730.51650.27810.28290.06570.21200.2874
MSSLD3.40813.97932.92731.79050.47650.26170.27260.08360.20590.3194
LINEX3.32953.92123.13181.88140.51500.27890.28260.06620.21220.2860
KS3.84344.18662.01121.50500.30340.20760.22090.24450.19490.3834
LTS3.60673.88872.46631.93450.38950.28890.24830.14250.21580.2682
Table 8. COVID-19 recovery rates in Turkey.
0.00740.00950.01130.01500.01800.02120.02290.02310.03280.0385
0.04390.04640.04830.05070.05150.05680.06050.06480.07370.0818
0.09550.10990.12700.13880.1476
Table 9. Descriptive statistics of COVID-19 recovery rates in Turkey.
MeasureValueMeasureValue
Count25Skewness0.9213
Mean0.0559Kurtosis0.0116
Standard Deviation0.0409Variance0.0248
Min0.0074Range0.1402
25th Percentile (Q1)0.0229Median0.0483
75th Percentile (Q3)0.0737Max0.1476
Table 10. Estimates and test statistics for each method under the two sampling schemes SRS and RSS for Dataset 2.
Method ψ ^ ADtCVtKStp-Value
SRS RSS SRS RSS SRS RSS SRS RSS SRS RSS
MLE12.102218.2271.25340.78770.21640.12880.180.14810.35010.5917
OLS9.896115.80232.79550.50360.55390.06410.25540.10490.06320.9194
WLS9.954616.21652.73950.51760.54150.06820.25330.10770.06690.9044
CV10.227816.91572.49030.57550.48650.08220.24340.12010.08670.8219
MPS10.38216.67712.35830.55110.45740.07650.23780.11490.09960.8594
AD10.254616.73562.46690.55660.48140.07780.24240.11620.08880.8505
RAD11.018717.25861.87510.61850.35130.0920.21560.12760.16850.7638
LAD9.316715.94513.40480.50670.68840.06510.27720.10590.03440.9144
MSAD8.666617.87274.21890.7180.8680.11380.30260.14070.01580.6543
MSALD8.666617.87274.21890.7180.8680.11380.30260.14070.01580.6543
MSSD9.765514.4392.92410.57920.58230.07610.26030.11150.05550.8812
MSSLD11.258417.3321.71710.62890.31680.09430.20750.12920.20150.751
LINEX9.761114.21682.92850.61110.58320.08220.26040.11760.05520.8405
KS9.751915.60172.93780.50270.58530.06330.26080.10360.05470.9262
LTS8.26115.12464.80680.51660.99710.06480.3190.10040.00920.941
Disclaimer/Publisher’s Note: The statements, opinions and data contained in all publications are solely those of the individual author(s) and contributor(s) and not of MDPI and/or the editor(s). MDPI and/or the editor(s) disclaim responsibility for any injury to people or property resulting from any ideas, methods, instructions or products referred to in the content.