
MambaLLM: Integrating Macro-Index and Micro-Stock Data for Enhanced Stock Price Prediction


Abstract
1. Introduction
- Unlike previous Mamba-based models (e.g., MambaStock, which focuses solely on stock-level sequences, and S-Mamba, which targets sector-specific patterns), MambaLLM introduces a novel Micro-Stock Encoder that integrates a Tri-Mamba Modeling Layer with tri-directional Mamba blocks to jointly capture temporal, cross-feature, and global dependencies within stock time series.
- A Macro-Index Analyzer module is presented to incorporate high-level market sentiment and trend information, designed specifically for this work. A carefully constructed financial prompt is used to guide DeepSeek R1 7B distillation in generating daily market summaries, which are subsequently fed into FinBERT to obtain domain-specific financial embeddings.
- Combining broad market data (e.g., stock indices) with individual stock cues (e.g., price–volume metrics and technical indicators) enables MambaLLM to generate a dual-perspective market view, capturing both systemic changes and stock-specific fluctuations.
- Comprehensive tests on six major U.S. stocks (AAPL, AMZN, MSFT, TSLA, GOOGL, META) demonstrate that MambaLLM achieves a remarkable 28.50% reduction in RMSE relative to other baselines, maintaining superior resilience amid market turbulence.
2. Related Works
2.1. Neural Networks for Financial Time Series
2.2. Large Language Models (LLMs) for Financial Time Series
3. Methods
3.1. Problem Statement
- Micro-stock Data: This comprises a 12-dimensional characteristic vector capturing intrinsic stock-specific information at day t, defined aswhere each feature in is normalized by MinMax scaling to ensure feature comparability and stable model training.
- Macro-index Context: This involves daily S&P 500 data analyzed through an LLM, such as DeepSeek and FinBERT, to generate textual summaries that reflect the broader market conditions. Subsequently, these summaries are encoded in high-dimensional semantic embeddings, represented as , providing a context-rich macroeconomic perspective.
3.2. Data Representation and Preprocessing
3.2.1. Micro-Stock Features
- SMA: SMA smooth out price fluctuations by calculating the average closing price over a specific period. They help identify trends: SMA10 captures short-term trends (10-day window), while SMA50 reflects medium-term trends (50-day window):where denotes the closing price at time t.
- EMA10: EMA10 assigns greater weight to recent prices, making it more sensitive to recent market movements compared to SMA. This feature allows it to track price trends while emphasizing new data:
- Bollinger Bands: Comprising a middle SMA line (typically 20-day) and upper/lower bands based on standard deviation, Bollinger Bands gauge price volatility. Prices near the upper band may signal overbought conditions, while those near the lower band may indicate oversold conditions:where is the standard deviation of closing prices over the past 20 days.
- MACD: MACD is a momentum indicator that analyzes the relationship between two EMAs (12-day and 26-day). Crossovers of these EMAs generate buy/sell signals, aiding in identifying trend reversals:
- RSI: RSI measures price movement speed and magnitude to determine overbought or oversold conditions. Values above 70 generally indicate overbought status, while values below 30 suggest oversold status:where and are the average gains and losses over a 14-day window.
3.2.2. Macro-Index Data Processing with LLM
You are a professional financial analyst. Based on the overall market performance of the S&P 500 Index and its technical indicators (open, high, low, close, volume, 10-day Simple Moving Average (SMA10), 50-day Simple Moving Average (SMA50), 10-day Exponential Moving Average (EMA10), Bollinger Bands upper, Bollinger Bands lower, Moving Average Convergence Divergence (MACD), Relative Strength Index (RSI)), conduct a comprehensive analysis of the overall market trend. For each trading day, provide a detailed technical analysis of the market as a whole, including but not limited to whether the market is in an overbought or oversold condition, the strength of bullish or bearish trends, market volatility based on Bollinger Bands, and other key technical signals that may influence market movements.
Open: 2425.66
High: 2543.21
Low: 2401.34
Close: 2529.19
Volume: 837M
SMA10: 2760.36
SMA50: 3166.31
EMA10: 2713.64
Bollinger Bands Upper: 2984.12
Bollinger Bands Lower: 2345.88
MACD: -185.0
RSI: 36.0
Key Observations:
- Bullish intraday movement (Open: 2425.66→Close: 2529.19)
- High volume (837M) signals strong market participation
- SMA50 = 3166.31 maintains long-term bullish trend
- MACD = −185 indicates underlying bearish pressure
Interpretation:
- Divergence between price action and MACD
- RSI = 36 suggests oversold conditions
- Bollinger Band positioning implies volatility
Conclusion: Bullish trend with potential reversal signals. Monitor MACD-RSI convergence.
3.3. Proposed MambaLLM Architecture
- Micro-Stock Encoder (Mamba SSM): A selective state-space model that processes normalized micro-stock features.
- Macro-Index Analyzer (DeepSeek R1 7B + FinBERT): Deepseek-R1-7B generates daily textual insights from S&P 500 data, which are converted into 768-dimensional embeddings via FinBERT.
- Cross-Modal Fusion: A multi-layer perceptron (MLP) integrates outputs from the two previous streams to predict the next day’s closing price.
3.3.1. Micro-Stock Encoder
- Embedding Layer: Given a batch of multivariate stock time series input , where B is the batch size, L denotes the number of time steps, and D represents the number of stock-related features (e.g., open, high, low, close, and volume), a dimension permutation is first performed to rearrange the tensor into shape :This operation enables each feature dimension to be treated as an independent token sequence across time, which facilitates token-wise encoding by a linear layer.A linear projection is then applied along the temporal axis to project each feature’s temporal dynamics into a latent representation of dimension d:where and are learnable parameters. The resulting embedding tensor encodes the time-aware feature representations and is passed to the subsequent Tri-Mamba Modeling Layer.
- Tri-Mamba Modeling Layer: This layer is designed to model dependencies from different perspectives and consists of three parallel Mamba modules dealing with different variants of the input:
- -
- Global Mamba (Original Order): Used to capture holistic dependencies over the original sequence.
- -
- Cross-Feature Mamba (Row-Reversed): Applied to model inter-feature relationships by reversing the input along the feature (row) dimension.
- -
- Temporal Mamba (Column-Reversed): Designed to emphasize temporal dependency learning by reversing the input along the time (column) dimension.
Given the embedded input , each directional branch first performs a series of operations within a Mamba Block. The internal structure of a Mamba Block can be described as follows.The input is first projected into two streams via a linear transformation:followed by a one-dimensional convolution and non-linearity on :The transformed signal is then passed through a selective state-space model (SSM), parameterized by discretized state matrices and a learnable step size . The discrete update process is formulated asA selective gating mechanism is applied to combine the SSM output with the auxiliary stream :and finally, the output of the block is computed via a final linear transformation:where ⊙ denotes element-wise multiplication. The selective state-space operator is able to capture long-range dependencies with high efficiency by integrating structured recurrence with data-dependent selection [14].Given the embedded input , the outputs of the three Mamba blocks are computed as follows:The outputs from the three directions are then fused using a learnable weighted sum:where , , and are trainable scalar weights that balance the contributions of the three directional Mamba blocks. A residual connection is applied to enhance representational stability: - Projection Layer: To obtain the final encoded representation suitable for fusion and prediction, a two-stage linear projection is applied to the output tensor from the Tri-Mamba Modeling Layer.In the first stage, a linear transformation is performed along the last dimension (i.e., the hidden dimension d), reducing it to a scalar:Next, the singleton dimension is moved to the middle position via permutation, and the number of features D is projected to a user-defined output dimension using a second linear layer:Finally, the singleton dimension is removed using a squeeze operation to produce the final encoder output:This output vector serves as the micro-level stock representation that is later fused with macro-financial information. The two-step projection enables decoupled control over temporal feature reduction and dimensional alignment.
3.3.2. Macro-Index Analyzer (DeepSeek R1 7B + FinBERT)
3.3.3. Cross-Modal Fusion
3.3.4. Output Layer
3.4. MambaLLM Training
| Algorithm 1: The process flow of MambaLLM |
 |
4. Experiment
4.1. Dataset
- Training set (1 January 2020–31 December 2022), used for tuning model parameters.
- Testing set (1 January 2023–28 February 2025), used for final performance evaluation.
4.2. Baseline Methods
- GRU: Gated Recurrent Unit (GRU) is a simplified variant of recurrent neural networks (RNNs). They use gating mechanisms to control the flow of information, helping alleviate the vanishing gradient problem. GRU models are often employed in sequence data modeling due to their relatively fewer parameters compared to LSTM, faster convergence, and strong predictive power.
- BiGRU: Bidirectional GRU extends the GRU model by processing the input sequence in both forward and backward directions. This structure allows the model to capture dependencies from past and future time steps simultaneously, improving performance on tasks requiring context from both directions.
- LSTM: Long Short-Term Memory (LSTM) networks are a foundational type of RNN designed to capture long-term dependencies in sequential data. LSTMs use specialized gating units (input, forget, and output gates) to learn what information to keep or discard over time, making them effective in many time series forecasting tasks.
- BiLSTM: Bidirectional LSTM processes input sequences in both the forward and backward directions using separate hidden layers. It is particularly useful for tasks where future context can enhance the prediction of current states.
- Informer: Informer [8] proposes an efficient Transformer architecture tailored for long sequence time series forecasting (LSTF), featuring three key innovations: the ProbSparse self-attention mechanism, attention distillation, and a generative decoder to overcome the computational bottlenecks of vanilla Transformers.
- Autoformer: Autoformer [9] proposes a novel decomposition-based Transformer architecture for long-term time series forecasting, embedding progressive series decomposition into model layers and introducing an auto-correlation mechanism that exploits time series periodicity to enhance dependency discovery and computational efficiency.
- Crossformer: Crossformer [52] is a Transformer-based model that explicitly captures both cross-time and cross-dimension dependencies in multivariate time series through a novel Dimension-Segment-Wise embedding and a Two-Stage Attention mechanism.
- MambaStock: MambaStock [53] is a novel stock prediction model based on the Mamba framework. It leverages the Mamba architecture to effectively utilize historical market data for forecasting future stock prices. By directly learning representations from raw price data (open, high, low, close, etc.), MambaStock aims to reduce the need for hand-crafted features or complex preprocessing steps, showing strong performance on multiple real-world datasets.
- S-Mamba: S-Mamba [15] is an architecture designed for time series forecasting (TSF), also based on the Mamba framework. It incorporates bidirectional Mamba layers to capture both intra- and inter-variate correlations and then applies a feed-forward network to model temporal dependencies. By autonomously tokenizing time points via a linear layer and performing forecasts through a final linear mapping, S-Mamba achieves state-of-the-art performance across thirteen public TSF datasets. Its efficient design highlights the generalizability and computational benefits of Mamba-based approaches.
4.3. Evaluation Metrics
- Root Mean Square Error (RMSE): RMSE is defined as the square root of MSE. It provides an interpretable metric because it shares the same units as the original data, allowing for an intuitive assessment of the average magnitude of prediction errors:
- Mean Absolute Percentage Error (MAPE): MAPE expresses the average deviation between predicted and actual values in percentage terms. It helps assess errors relative to the scale of the data and enables comparison across different datasets:
- Mean Absolute Error (MAE): MAE calculates the average absolute deviation between predicted values and their corresponding actual values. In contrast to MSE and RMSE, all errors contribute equally to the final metric, making MAE a straightforward measure of prediction accuracy:
4.4. Experiment Setup
4.5. Experimental Results
4.5.1. Comparison with Baselines
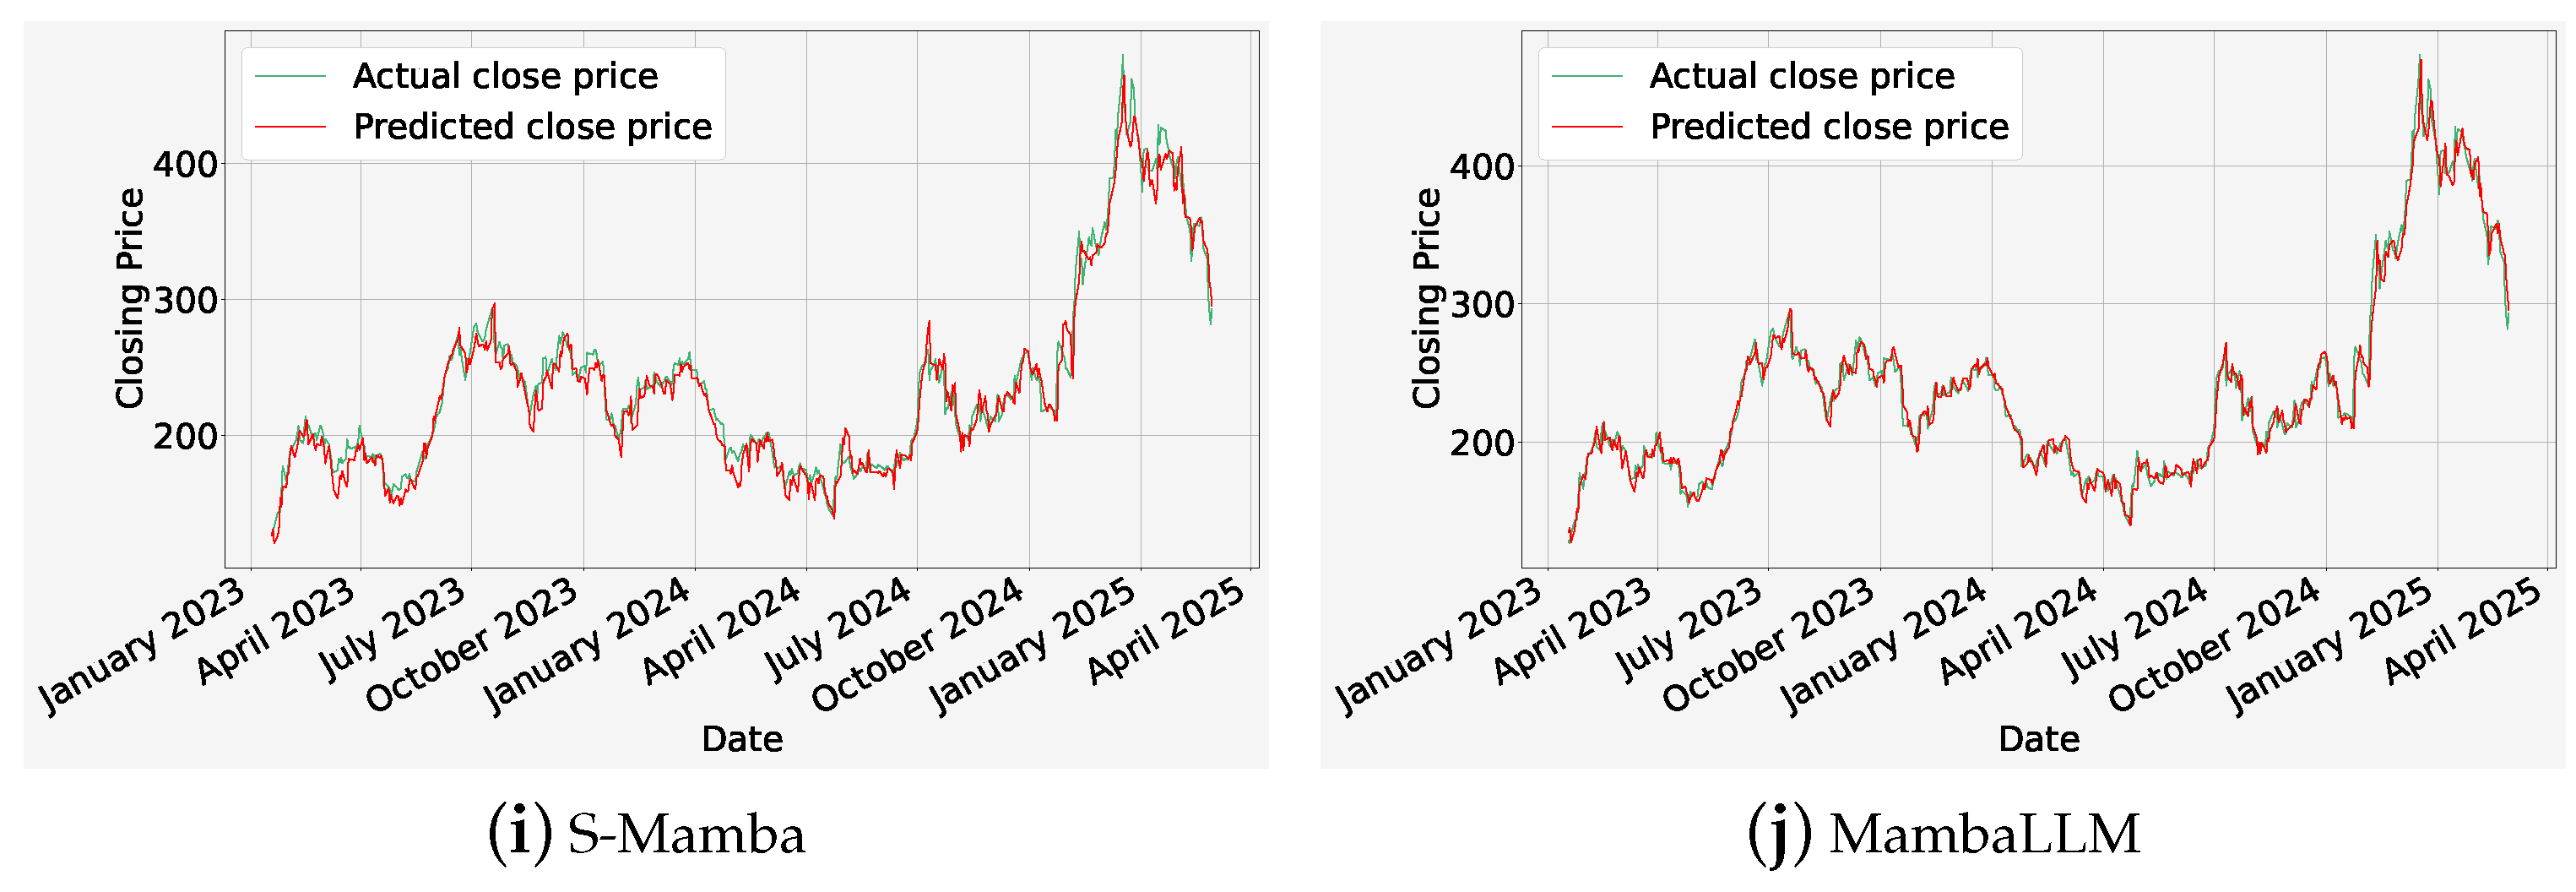
4.5.2. Analysis of Mamba-Based Methods
4.5.3. Analysis of MambaLLM Ablation
4.5.4. Analysis of Computational Efficiency
5. Discussion
6. Conclusions
Author Contributions
Funding
Data Availability Statement
Conflicts of Interest
Abbreviations
| SSM | State-Space Model |
| GRU | Gated Recurrent Unit |
| BiGRU | Bidirectional Gated Recurrent Unit |
| LSTM | Long Short-Term Memory |
| BiLSTM | Bidirectional Long Short-Term Memory |
| LLM | Large Language Model |
| SMA | Simple Moving Average |
| EMA | Exponential Moving Average |
| MACD | Moving Average Convergence Divergence |
| RSI | Relative Strength Index |
References
- Shumway, R.H.; Stoffer, D.S.; Shumway, R.H.; Stoffer, D.S. ARIMA models. Time Series Analysis and Its Applications: With R Examples; Springer: New York, NY, USA, 2017; pp. 75–163. [Google Scholar]
- Franses, P.H.; Van Dijk, D. Forecasting stock market volatility using (non-linear) Garch models. J. Forecast. 1996, 15, 229–235. [Google Scholar] [CrossRef]
- Chong, C.W.; Ahmad, M.I.; Abdullah, M.Y. Performance of GARCH models in forecasting stock market volatility. J. Forecast. 1999, 18, 333–343. [Google Scholar] [CrossRef]
- Chen, K.; Zhou, Y.; Dai, F. A LSTM-based method for stock returns prediction: A case study of China stock market. In Proceedings of the 2015 IEEE International Conference on Big Data (Big Data), Santa Clara, CA, USA, 29 October–1 November 2015; pp. 2823–2824. [Google Scholar]
- Nelson, D.M.; Pereira, A.C.; De Oliveira, R.A. Stock market’s price movement prediction with LSTM neural networks. In Proceedings of the 2017 International Joint Conference on Neural Networks (IJCNN), Anchorage, AK, USA, 14–19 May 2017; pp. 1419–1426. [Google Scholar]
- Baek, Y.; Kim, H.Y. ModAugNet: A new forecasting framework for stock market index value with an overfitting prevention LSTM module and a prediction LSTM module. Expert Syst. Appl. 2018, 113, 457–480. [Google Scholar] [CrossRef]
- Chen, X.; Ma, X.; Wang, H.; Li, X.; Zhang, C. A hierarchical attention network for stock prediction based on attentive multi-view news learning. Neurocomputing 2022, 504, 1–15. [Google Scholar] [CrossRef]
- Zhou, H.; Zhang, S.; Peng, J.; Zhang, S.; Li, J.; Xiong, H.; Zhang, W. Informer: Beyond efficient transformer for long sequence time-series forecasting. Proc. AAAI Conf. Artif. Intell. 2021, 35, 11106–11115. [Google Scholar] [CrossRef]
- Wu, H.; Xu, J.; Wang, J.; Long, M. Autoformer: Decomposition transformers with auto-correlation for long-term series forecasting. Adv. Neural Inf. Process. Syst. 2021, 34, 22419–22430. [Google Scholar]
- Liu, S.; Yu, H.; Liao, C.; Li, J.; Lin, W.; Liu, A.X.; Dustdar, S. Pyraformer: Low-complexity pyramidal attention for long-range time series modeling and forecasting. In Proceedings of the International Conference on Learning Representations, Vienna, Austria, 4 May 2021. [Google Scholar]
- Woo, G.; Liu, C.; Sahoo, D.; Kumar, A.; Hoi, S. Etsformer: Exponential smoothing transformers for time-series forecasting. arXiv 2022, arXiv:2202.01381. [Google Scholar]
- Gu, A.; Johnson, I.; Goel, K.; Saab, K.; Dao, T.; Rudra, A.; Ré, C. Combining recurrent, convolutional, and continuous-time models with linear state space layers. Adv. Neural Inf. Process. Syst. 2021, 34, 572–585. [Google Scholar]
- Gu, A.; Goel, K.; Ré, C. Efficiently modeling long sequences with structured state spaces. arXiv 2021, arXiv:2111.00396. [Google Scholar]
- Gu, A.; Dao, T. Mamba: Linear-time sequence modeling with selective state spaces. arXiv 2023, arXiv:2312.00752. [Google Scholar]
- Wang, Z.; Kong, F.; Feng, S.; Wang, M.; Yang, X.; Zhao, H.; Wang, D.; Zhang, Y. Is Mamba effective for time series forecasting? Neurocomputing 2025, 619, 129178. [Google Scholar] [CrossRef]
- Hoseinzade, E.; Haratizadeh, S. CNNpred: CNN-based stock market prediction using a diverse set of variables. Expert Syst. Appl. 2019, 129, 273–285. [Google Scholar] [CrossRef]
- Mehtab, S.; Sen, J. Stock price prediction using convolutional neural networks on a multivariate timeseries. arXiv 2020, arXiv:2001.09769. [Google Scholar]
- Lu, W.; Li, J.; Wang, J.; Qin, L. A CNN-BiLSTM-AM method for stock price prediction. Neural Comput. Appl. 2021, 33, 4741–4753. [Google Scholar] [CrossRef]
- Du, L.; Gu, Z.; Wang, Y.; Wang, L.; Jia, Y. A few-shot class-incremental learning method for network intrusion detection. IEEE Trans. Netw. Serv. Manag. 2023, 21, 2389–2401. [Google Scholar] [CrossRef]
- Jia, Y.; Gu, Z.; Du, L.; Long, Y.; Wang, Y.; Li, J.; Zhang, Y. Artificial intelligence enabled cyber security defense for smart cities: A novel attack detection framework based on the MDATA model. Knowl.-Based Syst. 2023, 276, 110781. [Google Scholar] [CrossRef]
- Jiang, W. Applications of deep learning in stock market prediction: Recent progress. Expert Syst. Appl. 2021, 184, 115537. [Google Scholar] [CrossRef]
- Gong, J.; Eldardiry, H. Multi-stage Hybrid Attentive Networks for Knowledge-Driven Stock Movement Prediction. In Proceedings of the Neural Information Processing: 28th International Conference, ICONIP 2021, Sanur, Bali, Indonesia, 8–12 December 2021; Part IV 28, pp. 501–513. [Google Scholar]
- Patro, B.N.; Agneeswaran, V.S. Mamba-360: Survey of state space models as transformer alternative for long sequence modelling: Methods, applications, and challenges. arXiv 2024, arXiv:2404.16112. [Google Scholar]
- Liang, A.; Jiang, X.; Sun, Y.; Lu, C. Bi-Mamba4TS: Bidirectional Mamba for Time Series Forecasting. arXiv 2024, arXiv:2404.15772. [Google Scholar]
- Cai, X.; Zhu, Y.; Wang, X.; Yao, Y. MambaTS: Improved Selective State Space Models for Long-term Time Series Forecasting. arXiv 2024, arXiv:2405.16440. [Google Scholar]
- Xu, X.; Liang, Y.; Huang, B.; Lan, Z.; Shu, K. Integrating Mamba and Transformer for Long-Short Range Time Series Forecasting. arXiv 2024, arXiv:2404.14757. [Google Scholar]
- Ma, S.; Kang, Y.; Bai, P.; Zhao, Y.B. FMamba: Mamba based on Fast-attention for Multivariate Time-series Forecasting. arXiv 2024, arXiv:2407.14814. [Google Scholar]
- Yang, J.; Zhang, M.; Fang, R.; Zhang, W.; Zhou, J. Separating the predictable part of returns with CNN-GRU-attention from inputs to predict stock returns. Appl. Soft Comput. 2024, 165, 112116. [Google Scholar] [CrossRef]
- Wang, J.; Cheng, Q.; Dong, Y. An XGBoost-based multivariate deep learning framework for stock index futures price forecasting. Kybernetes 2023, 52, 4158–4177. [Google Scholar] [CrossRef]
- Zhou, T.; Ma, Z.; Wen, Q.; Wang, X.; Sun, L.; Jin, R. Fedformer: Frequency enhanced decomposed transformer for long-term series forecasting. In Proceedings of the International Conference on Machine Learning, Baltimore, MD, USA, 17–23 July 2022; 27268–27286. [Google Scholar]
- Mao, Z.; Wu, C. Stock price index prediction based on SSA-BiGRU-GSCV model from the perspective of long memory. Kybernetes 2023, 5, 5905–5931. [Google Scholar] [CrossRef]
- Zeng, A.; Chen, M.; Zhang, L.; Xu, Q. Are transformers effective for time series forecasting? Proc. AAAI Conf. Artif. Intell. 2023, 37, 11121–11128. [Google Scholar] [CrossRef]
- Lin, S.; Lin, W.; Wu, W.; Zhao, F.; Mo, R.; Zhang, H. Segrnn: Segment recurrent neural network for long-term time series forecasting. arXiv 2023, arXiv:2308.11200. [Google Scholar]
- Wang, S.; Wu, H.; Shi, X.; Hu, T.; Luo, H.; Ma, L.; Zhang, J.Y.; Zhou, J. TimeMixer: Decomposable Multiscale Mixing for Time Series Forecasting. In Proceedings of the Twelfth International Conference on Learning Representations, Vienna, Austria, 7–11 May 2024. [Google Scholar]
- Jiang, Y.; Pan, Z.; Zhang, X.; Garg, S.; Schneider, A.; Nevmyvaka, Y.; Song, D. Empowering time series analysis with large language models: A survey. arXiv 2024, arXiv:2402.03182. [Google Scholar]
- Zhang, Z.; Sun, Y.; Wang, Z.; Nie, Y.; Ma, X.; Sun, P.; Li, R. Large language models for mobility in transportation systems: A survey on forecasting tasks. arXiv 2024, arXiv:2405.02357. [Google Scholar]
- Jin, M.; Zhang, Y.; Chen, W.; Zhang, K.; Liang, Y.; Yang, B.; Wang, J.; Pan, S.; Wen, Q. Position: What Can Large Language Models Tell Us about Time Series Analysis. In Proceedings of the International Conference on Machine Learning, Vienna, Austria, 21–27 July 2024. [Google Scholar]
- Zhou, T.; Niu, P.; Wang, X.; Sun, L.; Jin, R. One Fits All: Power General Time Series Analysis by Pretrained LM. In Proceedings of the Neural Information Processing Systems, New Orleans, LA, USA, 10–16 December 2023. [Google Scholar]
- Gruver, N.; Finzi, M.; Qiu, S.; Wilson, A.G. Large Language Models Are Zero-Shot Time Series Forecasters. arXiv 2023, arXiv:2310.07820. [Google Scholar]
- Jin, M.; Wang, S.; Ma, L.; Chu, Z.; Zhang, J.Y.; Shi, X.L.; Chen, P.Y.; Liang, Y.; Li, Y.F.; Pan, S.; et al. Time-LLM: Time Series Forecasting by Reprogramming Large Language Models. arXiv 2023, arXiv:2310.01728. [Google Scholar]
- Jin, M.; Wen, Q.; Liang, Y.; Zhang, C.; Xue, S.; Wang, X.; Zhang, J.Y.; Wang, Y.; Chen, H.; Li, X.; et al. Large Models for Time Series and Spatio-Temporal Data: A Survey and Outlook. arXiv 2023, arXiv:2310.10196. [Google Scholar]
- Liang, Y.; Wen, H.; Nie, Y.; Jiang, Y.; Jin, M.; Song, D.; Pan, S.; Wen, Q. Foundation Models for Time Series Analysis: A Tutorial and Survey. arXiv 2024, arXiv:2403.14735. [Google Scholar]
- Yu, X.; Chen, Z.; Ling, Y.; Dong, S.; Liu, Z.; Lu, Y. Temporal Data Meets LLM - Explainable Financial Time Series Forecasting. arXiv 2023, arXiv:2306.11025. [Google Scholar]
- Chen, Z.; Zheng, L.; Lu, C.; Yuan, J.; Zhu, D. ChatGPT Informed Graph Neural Network for Stock Movement Prediction. arXiv 2023, arXiv:2306.03763. [Google Scholar] [CrossRef]
- Halder, S. FinBERT-LSTM: Deep Learning based stock price prediction using News Sentiment Analysis. arXiv 2022, arXiv:2211.07392. [Google Scholar]
- Deng, Y.; He, X.; Hu, J.; Yiu, S.M. Enhancing Few-Shot Stock Trend Prediction with Large Language Models. arXiv 2024, arXiv:2407.09003. [Google Scholar]
- Zhou, L.; Zhang, Y.; Yu, J.; Wang, G.; Liu, Z.; Yongchareon, S.; Wang, N. LLM-Augmented Linear Transformer–CNN for Enhanced Stock Price Prediction. Mathematics 2025, 13, 487. [Google Scholar] [CrossRef]
- Wimmer, C.; Rekabsaz, N. Leveraging Vision-Language Models for Granular Market Change Prediction. arXiv 2023, arXiv:2301.10166. [Google Scholar]
- Cao, Y.; Chen, Z.; Pei, Q.; Dimino, F.; Ausiello, L.; Kumar, P.; Subbalakshmi, K.; Ndiaye, P.M. RiskLabs: Predicting Financial Risk Using Large Language Model Based on Multi-Sources Data. arXiv 2024, arXiv:2404.07452. [Google Scholar]
- Xie, Q.; Han, W.; Lai, Y.; Peng, M.; Huang, J. The Wall Street Neophyte: A Zero-Shot Analysis of ChatGPT Over MultiModal Stock Movement Prediction Challenges. arXiv 2023, arXiv:2304.05351. [Google Scholar]
- Lopez-Lira, A.; Tang, Y. Can ChatGPT Forecast Stock Price Movements? Return Predictability and Large Language Models. arXiv 2023, arXiv:2304.07619. [Google Scholar] [CrossRef]
- Zhang, Y.; Yan, J. Crossformer: Transformer utilizing cross-dimension dependency for multivariate time series forecasting. In Proceedings of the Eleventh International Conference on Learning Representations, Kigali, Rwanda, 1–5 May 2023. [Google Scholar]
- Shi, Z. MambaStock: Selective state space model for stock prediction. arXiv 2024, arXiv:2402.18959. [Google Scholar]


| Hyperparameter | MambaLLM |
|---|---|
| Number of Linear layers | 3 |
| Activation function | GELU |
| Learning rate () | 0.0005 |
| Dropout | 0.1 |
| Window size | 10 |
| Dataset | Metrics | GRU | BiGRU | LSTM | BiLSTM | Informer | Autoformer | Crossformer | MambaStock | S-Mamba | MambaLLM |
|---|---|---|---|---|---|---|---|---|---|---|---|
| AAPL | RMSE↓ | 11.45 | 9.60 | 6.94 | 6.29 | 13.63 | 5.39 | 9.71 | 6.03 | 4.61 | 2.93 |
| MAPE↓ | 4.27 | 3.38 | 2.87 | 2.62 | 5.96 | 2.16 | 4.35 | 2.26 | 1.79 | 1.12 | |
| MAE↓ | 8.86 | 7.10 | 5.54 | 5.05 | 11.71 | 4.17 | 8.36 | 4.58 | 3.48 | 2.16 | |
| AMZN | RMSE↓ | 7.11 | 6.60 | 8.59 | 6.11 | 11.39 | 5.26 | 5.45 | 7.86 | 5.00 | 3.28 |
| MAPE↓ | 3.27 | 2.79 | 4.78 | 3.15 | 5.97 | 2.64 | 2.58 | 3.06 | 2.48 | 1.57 | |
| MAE↓ | 5.36 | 4.71 | 6.89 | 4.81 | 9.05 | 4.04 | 4.07 | 5.42 | 3.87 | 2.45 | |
| MSFT | RMSE↓ | 14.93 | 12.31 | 12.77 | 10.85 | 15.27 | 9.06 | 15.09 | 9.12 | 7.42 | 5.66 |
| MAPE↓ | 3.08 | 2.56 | 2.92 | 2.45 | 3.29 | 1.99 | 3.50 | 2.00 | 1.57 | 1.18 | |
| MAE↓ | 11.81 | 9.74 | 10.65 | 8.90 | 11.79 | 7.23 | 12.52 | 7.20 | 5.71 | 4.27 | |
| TSLA | RMSE↓ | 15.24 | 12.23 | 13.54 | 15.71 | 15.98 | 16.92 | 14.93 | 13.67 | 12.20 | 9.75 |
| MAPE↓ | 4.77 | 3.65 | 4.12 | 4.94 | 5.01 | 5.58 | 4.62 | 3.99 | 3.89 | 2.84 | |
| MAE↓ | 11.32 | 8.79 | 9.93 | 11.71 | 11.91 | 13.06 | 10.98 | 9.71 | 9.09 | 6.79 | |
| GOOGL | RMSE↓ | 5.93 | 5.33 | 6.69 | 6.02 | 7.65 | 5.13 | 6.01 | 6.39 | 4.63 | 2.89 |
| MAPE↓ | 3.25 | 3.00 | 3.65 | 3.31 | 4.26 | 2.90 | 3.34 | 3.35 | 2.39 | 1.44 | |
| MAE↓ | 4.66 | 4.22 | 5.27 | 4.76 | 6.19 | 4.06 | 4.75 | 4.96 | 3.48 | 2.09 | |
| META | RMSE↓ | 46.27 | 43.62 | 24.33 | 22.69 | 53.47 | 18.23 | 33.76 | 21.57 | 12.82 | 10.41 |
| MAPE↓ | 6.91 | 6.04 | 5.15 | 4.04 | 9.77 | 3.87 | 5.05 | 2.89 | 2.56 | 1.87 | |
| MAE↓ | 32.94 | 30.04 | 18.78 | 16.10 | 40.38 | 14.08 | 22.71 | 13.04 | 9.81 | 7.27 |
| Dataset | Metrics | MambaStock | S-Mamba | MambaLLM |
|---|---|---|---|---|
| AAPL | RMSE↓ | 6.03 | 4.61 | 2.93 |
| MAPE↓ | 2.26 | 1.79 | 1.12 | |
| MAE↓ | 4.58 | 3.48 | 2.16 | |
| AMZN | RMSE↓ | 7.86 | 5.00 | 3.28 |
| MAPE↓ | 3.06 | 2.48 | 1.57 | |
| MAE↓ | 5.42 | 3.87 | 2.45 | |
| MSFT | RMSE↓ | 9.12 | 7.42 | 5.66 |
| MAPE↓ | 2.00 | 1.57 | 1.18 | |
| MAE↓ | 7.20 | 5.71 | 4.27 | |
| TSLA | RMSE↓ | 13.67 | 12.20 | 9.75 |
| MAPE↓ | 3.99 | 3.89 | 2.84 | |
| MAE↓ | 9.71 | 9.09 | 6.79 | |
| GOOGL | RMSE↓ | 6.39 | 4.63 | 2.89 |
| MAPE↓ | 3.35 | 2.39 | 1.44 | |
| MAE↓ | 4.96 | 3.48 | 2.09 | |
| META | RMSE↓ | 21.57 | 12.82 | 10.41 |
| MAPE↓ | 2.89 | 2.56 | 1.87 | |
| MAE↓ | 13.04 | 9.81 | 7.27 |
| Module | RMSE↓ | MAPE↓ | MAE↓ |
|---|---|---|---|
| Without Mamba | 29.71 | 17.36 | 24.61 |
| Without LLM | 4.00 | 2.17 | 3.06 |
| Mamba + LLM (Attention-based fusion) | 3.71 | 1.82 | 2.69 |
| MambaLLM (concatenation fusion) | 2.89 | 1.44 | 2.09 |
| GRU | BiGRU | LSTM | BiLSTM | Informer | Autoformer | Crossformer | MambaStock | S-Mamba | MambaLLM | |
|---|---|---|---|---|---|---|---|---|---|---|
| RMSE | 5.93 | 5.33 | 6.69 | 6.02 | 7.65 | 5.13 | 6.01 | 6.39 | 4.63 | 2.89 |
| Inference Time (s) | 0.75 | 0.77 | 0.72 | 0.75 | 1.24 | 0.03 | 0.50 | 0.49 | 0.55 | 0.52 |
| Inference Memory (MB) | 1167 | 1237 | 1159 | 1255 | 1249 | 1229 | 1037 | 1027 | 1029 | 1093 |
Disclaimer/Publisher’s Note: The statements, opinions and data contained in all publications are solely those of the individual author(s) and contributor(s) and not of MDPI and/or the editor(s). MDPI and/or the editor(s) disclaim responsibility for any injury to people or property resulting from any ideas, methods, instructions or products referred to in the content. |
© 2025 by the authors. Licensee MDPI, Basel, Switzerland. This article is an open access article distributed under the terms and conditions of the Creative Commons Attribution (CC BY) license (https://creativecommons.org/licenses/by/4.0/).
Share and Cite
Yan, J.; Huang, Y. MambaLLM: Integrating Macro-Index and Micro-Stock Data for Enhanced Stock Price Prediction. Mathematics 2025, 13, 1599. https://doi.org/10.3390/math13101599
Yan J, Huang Y. MambaLLM: Integrating Macro-Index and Micro-Stock Data for Enhanced Stock Price Prediction. Mathematics. 2025; 13(10):1599. https://doi.org/10.3390/math13101599
Chicago/Turabian StyleYan, Jin, and Yuling Huang. 2025. "MambaLLM: Integrating Macro-Index and Micro-Stock Data for Enhanced Stock Price Prediction" Mathematics 13, no. 10: 1599. https://doi.org/10.3390/math13101599
APA StyleYan, J., & Huang, Y. (2025). MambaLLM: Integrating Macro-Index and Micro-Stock Data for Enhanced Stock Price Prediction. Mathematics, 13(10), 1599. https://doi.org/10.3390/math13101599