1. Introduction
Environmental, social, and governance (ESG) factors have emerged as critical dimensions for assessing non-financial performance and ensuring the long-term sustainable development of businesses. ESG not only impacts corporate behavior, but also shapes investor expectations and regulatory landscapes. China’s rapid economic growth and its increasing integration into global markets have made Chinese enterprises key players in international supply chains and capital markets. With this prominence, the ESG risks faced by Chinese companies have significant potential for contagion and volatility, potentially impacting the broader market through spillover effects. Understanding these spillover dynamics is vital for improving risk management and promoting sustainable business practices within China and the global economy.
Research on ESG has predominantly focused on four key areas. The first area explores the relationship between ESG factors and investment returns, investigating how ESG performance impacts stock returns and portfolio allocations [
1,
2,
3,
4,
5]. Research indicates that investing in stocks of companies with higher ESG rankings can yield excess returns to some extent [
6,
7,
8], and there is a positive correlation between portfolio Alpha and ESG components [
9]. Particularly during financial crises, they can be considered as a hedging tool [
10,
11,
12], and the risk-adjusted performance of portfolios that incorporate ESG or sustainability factors benefits positively. Meanwhile, there are also contrary conclusions, with ESG scores being associated with lower stock returns and higher volatility [
13], higher ESG ETF sustainability ratings not protecting the performance of ESG ETFs over the market [
14,
15], and ESG not being immune during the COVID-19 pandemic [
10].
The second area examines ESG performance across various industries, identifying sector-specific impacts. Firms in sectors like energy, finance, and healthcare with stronger ESG scores tend to exhibit lower volatility and higher risk aversion, especially during adverse market conditions. The literature commonly analyzed fields such as tourism [
9], aviation [
16], hospitality and catering [
17], oil [
18], solar and wind energy [
19], healthcare [
3], financial insurance [
20], and pension fund management [
21]. Overall, the higher the corporate ESG scores, the lower the volatility of stock returns, and there is a direct correlation between stock return volatility and ESG scores [
22]. In addition, ESG factors can significantly explain industry returns [
2]. Companies with better ESG performance tend to have a higher degree of risk aversion and stronger defense mechanisms.
The third area addresses the reliability of ESG ratings, which vary significantly across rating agencies due to methodological differences and transparency issues. Inconsistent ratings highlight the need for more standardized ESG disclosures. Due to reasons, e.g., differences among raters, lack of transparency in data sources, varying weights applied by different institutions, and the unreliable nature of information provided by companies, the reliability of ESG ratings is not always high [
23]. Therefore, economists point out the need for companies to disclose more information about ESG [
24], emphasizing that ESG ratings are a fundamental measure of credit rating changes, especially during financial crises [
25].
The fourth area is the regional impact of ESG factors on financial performance. While ESG factors help mitigate shocks in developed economies, they also foster resilience in emerging markets, including China, where the role of ESG is increasingly significant. In the analysis of the global financial market [
26], the United States, Latin America, and European regional groups exhibit higher bilateral correlations, while the Middle East, Africa, and Asia Pacific regional groups show weaker bilateral correlations, indicating the presence of contagion in developed and/or emerging regions, which is related to portfolio and risk management. The US market is a major propagator of shocks [
27,
28]. Focusing on the European region [
6,
29,
30,
31], ESG sustainability can serve as a company’s ability to withstand unexpected shocks. Analyzing the Indian economic market [
32], it is found that ESG investments have stronger adaptability and resilience compared to traditional benchmark investments. In the Chinese market, the relationship between (ESG) ratings and stock price crash risk has been studied, revealing a statistically and economically significant negative correlation for Chinese companies [
33,
34]. In the Japanese market [
35,
36], corporate ESG performance is positively correlated with stock returns, and strong ESG performance contributes to the stability and market liquidity of the Japanese stock market.
Despite extensive research on ESG, the dynamics of ESG-related volatility spillovers remain relatively underexplored, particularly within large financial networks. This gap is especially critical in China, where the unique market structure and regulatory environment may result in distinct patterns of ESG risk contagion.
As the world’s second-largest economy, China’s market dynamics have a significant impact on the global economy. However, China’s unique market structure, policy environment, and cultural background mean that the spillover effects of ESG risks may differ significantly from those in Western countries. Therefore, studying the spillover relationships in ESG networks not only helps to fill the gap in existing literature, but also has significant implications for understanding ESG risk management in the Chinese market, developing effective risk mitigation strategies, optimizing investment portfolio allocation, and promoting the stability and sustainable development of financial markets.
The financial market is a complex and rapidly changing system, where various assets and sectors interact through information transmission and risk transfer, known as the spillover effect [
37,
38]. Accurately measuring the transmission structure of financial market volatility and identifying its generation process are of great theoretical and practical significance for preventing systemic financial risks and establishing effective financial risk regulation. Research methods for studying the spillover effect are also continuously innovating, one of which is the use of GARCH and its derived models to characterize the clustering characteristics of price return volatility. Studies have examined the mean and volatility spillovers between 11 stock markets in Asia [
39], and the volatility spillover effects of six Southeast Asian stock markets before and after the Asian crisis, finding strong spillovers during the crisis period [
40], as well as changes in the risk contagion mechanism during extreme turbulence in mature markets [
41]. The return, volatility, and leverage spillover effects between global national stock markets, where both mean spillovers and volatility spillovers were amplified have been examined during the global financial crisis [
42]. However, GARCH family models are mainly suitable for testing the volatility spillover effects between markets from a full-sample perspective, and most can only test the spillover effects between two markets. Moreover, these models cannot portray the overall volatility spillover effects of all markets, the spillover contribution of each market, and the time-varying characteristics of volatility spillovers between markets.
Complex network structures provide an appropriate basis for measuring overall risk spillovers and offer important insights into the strength of stock market interdependencies, the directionality of spillovers, and the transmission and reception of financial risk factors between different market conditions. Another method, called the DY method, is based on the generalized variance decomposition constructed with the VAR model [
43], which not only gives the direction of volatility spillovers, but also measures the intensity, scale, and time-varying characteristics of volatility spillovers. In recent years, many studies have used the DY method to study the volatility or information spillover effects between financial markets or financial assets. The credit risk spillover effects of major global financial institutions have been studied [
13,
44], as well as the volatility spillover strength of financial markets and commodity markets [
13].
During periods of high volatility, there is not always a clear advantage of one category over another [
45]. By constructing ESG industry indices and integrating the TENET network method, the structural evolution and direction of information flows between ESG industries were captured, finding that ESG industries show resilience in the face of extreme risks, indicating a lack of significant risk contagion with traditional industries [
46]. By constructing a financial network model based on inter-institutional association networks, evidence was provided for the negative impact of financial network risk spillovers on ESG investments, emphasizing the need to establish a more sustainable and resilient financial system [
47].
This article explores the ESG network risk contagion from the perspective of volatility spillover networks, analyzes how ESG risks among companies in the Chinese market are transmitted through complex network structures, and assesses the potential impact of this risk contagion on market stability and corporate value. By delving into the specific environment of the Chinese market and completing the analysis of the large financial network, this thesis will provide empirical evidence for ESG risk management and policy formulation, offering decision support for investors, companies, and regulatory agencies to promote financial market stability and sustainable economic development.
The contributions of this article are as follows:
Empirically test the volatility spillover network consisting of approximately 5000 stocks and examine the relationship between spillover effects and ESG ratings.
Analyze the spillover effect transmission paths and changes in network topology under different ESG groups during the 2015 stock market crash.
Investigate the spillover effect transmission paths and changes in network topology under different ESG groups during the COVID-19 pandemic in 2020.
The remainder of this article is structured as follows:
Section 2 outlines the methodological framework, including the VAR-DY method.
Section 3 details the data sources and descriptive statistics.
Section 4 presents the empirical findings, focusing on network characteristics and spillover pathways.
Section 5 discusses the results and suggests avenues for future research. Finally,
Section 6 concludes with policy implications for investors, companies, and regulators.
3. Data
This research utilizes the Huazheng ESG grading dataset, which spans from 2013 to 2023, and consists of 2212 daily observations, providing a comprehensive evaluation of the environmental, social, and governance performance of Chinese-listed companies (ESG data source:
https://www.chindices.com/esg-data.html) (accessed on 12 April 2025). The dataset covers 44 key indicators across 16 themes, including critical areas, e.g., climate change, resource utilization, and human capital management, creating a multidimensional framework for assessing corporate ESG practices. As of November 2022, the Huazheng ESG rating system has been applied to all A-share listed companies in China, offering extensive coverage for empirical analysis.
The Huazheng ESG ratings are based on a nine-tier scale ranging from “AAA” to “C”, incorporating both traditional financial metrics and alternative data sources. The ratings are updated quarterly using an algorithmic big data engine, ensuring timely and dynamic assessments. This dataset serves as a crucial foundation for the network analysis conducted in this study, enabling the exploration of patterns, trends, and relationships within ESG performance. The network approach will allow us to propose and test original theoretical hypotheses about the transmission of ESG risks and the impact of different ESG factors on corporate behavior and market dynamics. The insights gained from this analysis will have valuable implications for investment strategies and corporate governance practices.
For the purposes of this study, the dataset covers 5356 stocks from the Chinese market. The distribution of ESG ratings is uneven, with a predominance of stocks rated BBB, BB, and B, while higher-rated stocks (AAA and AA) and lower-rated stocks (C) are relatively fewer. To facilitate a more balanced analysis, we consolidate the top tier ratings of AAA and AA into a single “A” category, and similarly, we merge the lowest ratings (C and CC) into a combined “CC” category. As a result, the empirical analysis focuses on six distinct sub-networks: A (including AAA, AA, and A), BBB, BB, B, CCC, and CC (including CC and C).
All the stocks in the dataset have passed stationarity tests, ensuring the validity of the time-series analysis. Detailed company-level data and ESG ratings for each stock are presented in
Table 1, providing a comprehensive overview of the sample used in this study.
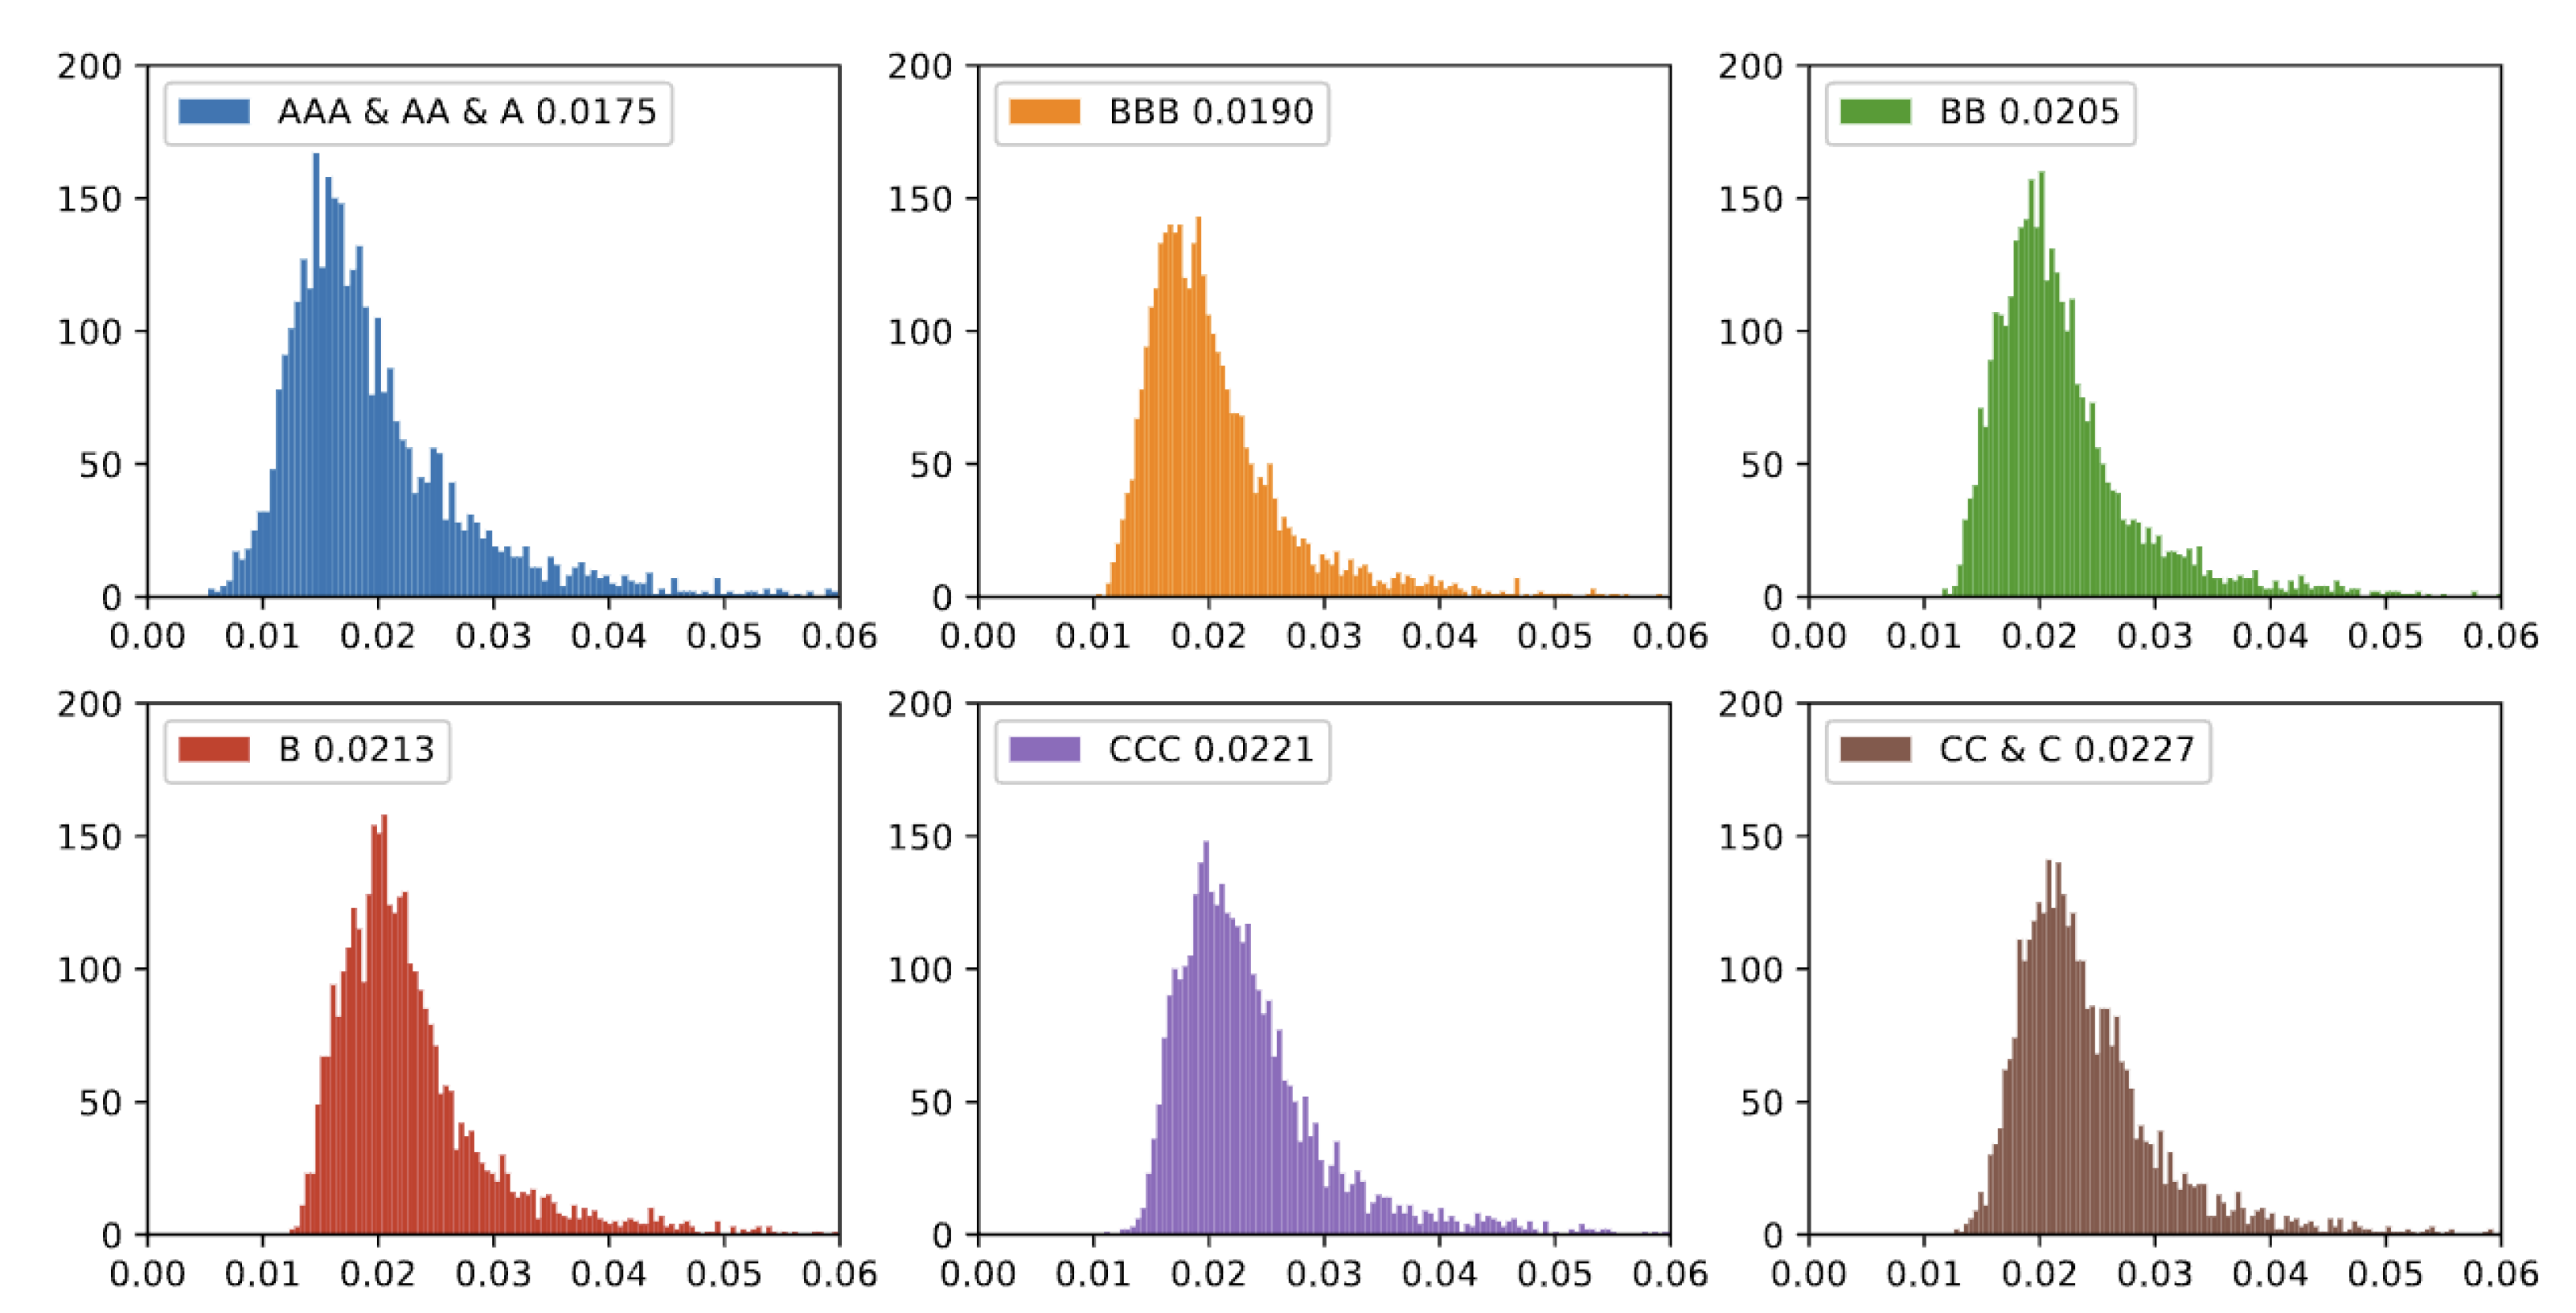
Table 2 presents the descriptive statistics of volatility for different credit rating categories. The sample size after passing the stationarity test is 3397. The volatility for the AAA/AA/A category has a mean of 0.0199 and a standard deviation of 0.0093, with a minimum value of 0.0053. For the BBB category, the mean volatility is 0.0207, with a standard deviation of 0.0073. In the BB category, the mean volatility is 0.0223, with a standard deviation of 0.0075. The B category shows a mean volatility of 0.0231 and a standard deviation of 0.0078. The CCC category has a mean volatility of 0.0239, with a standard deviation of 0.0078. For the CC/C category, the mean volatility is 0.0244, with a standard deviation of 0.0074. The skewness values for all groups indicate a certain degree of right skew. Additionally, the kurtosis values indicate leptokurtic distributions with sharper peaks and fatter tails compared to a normal distribution. These high Jarque-Bera statistics confirm that the volatility distributions are significantly non-normal, with more pronounced non-normality in lower-rated categories (e.g., BB and B) due to higher skewness and kurtosis. Furthermore, the Augmented Dickey-Fuller (ADF) test results indicate the stationarity of the volatility time series for each category. As illustrated in
Figure 1, it is evident that the mean volatility increases sequentially with the credit rating category from AAA/AA/A to CC/C.
4. Results
In this section, we investigate the time-varying behaviors of variance information spillovers. We use the VAR-DY method with the lag order as p = 1, and the H-step ahead forecast error variance with H = 10, respectively.
4.1. Network Analysis
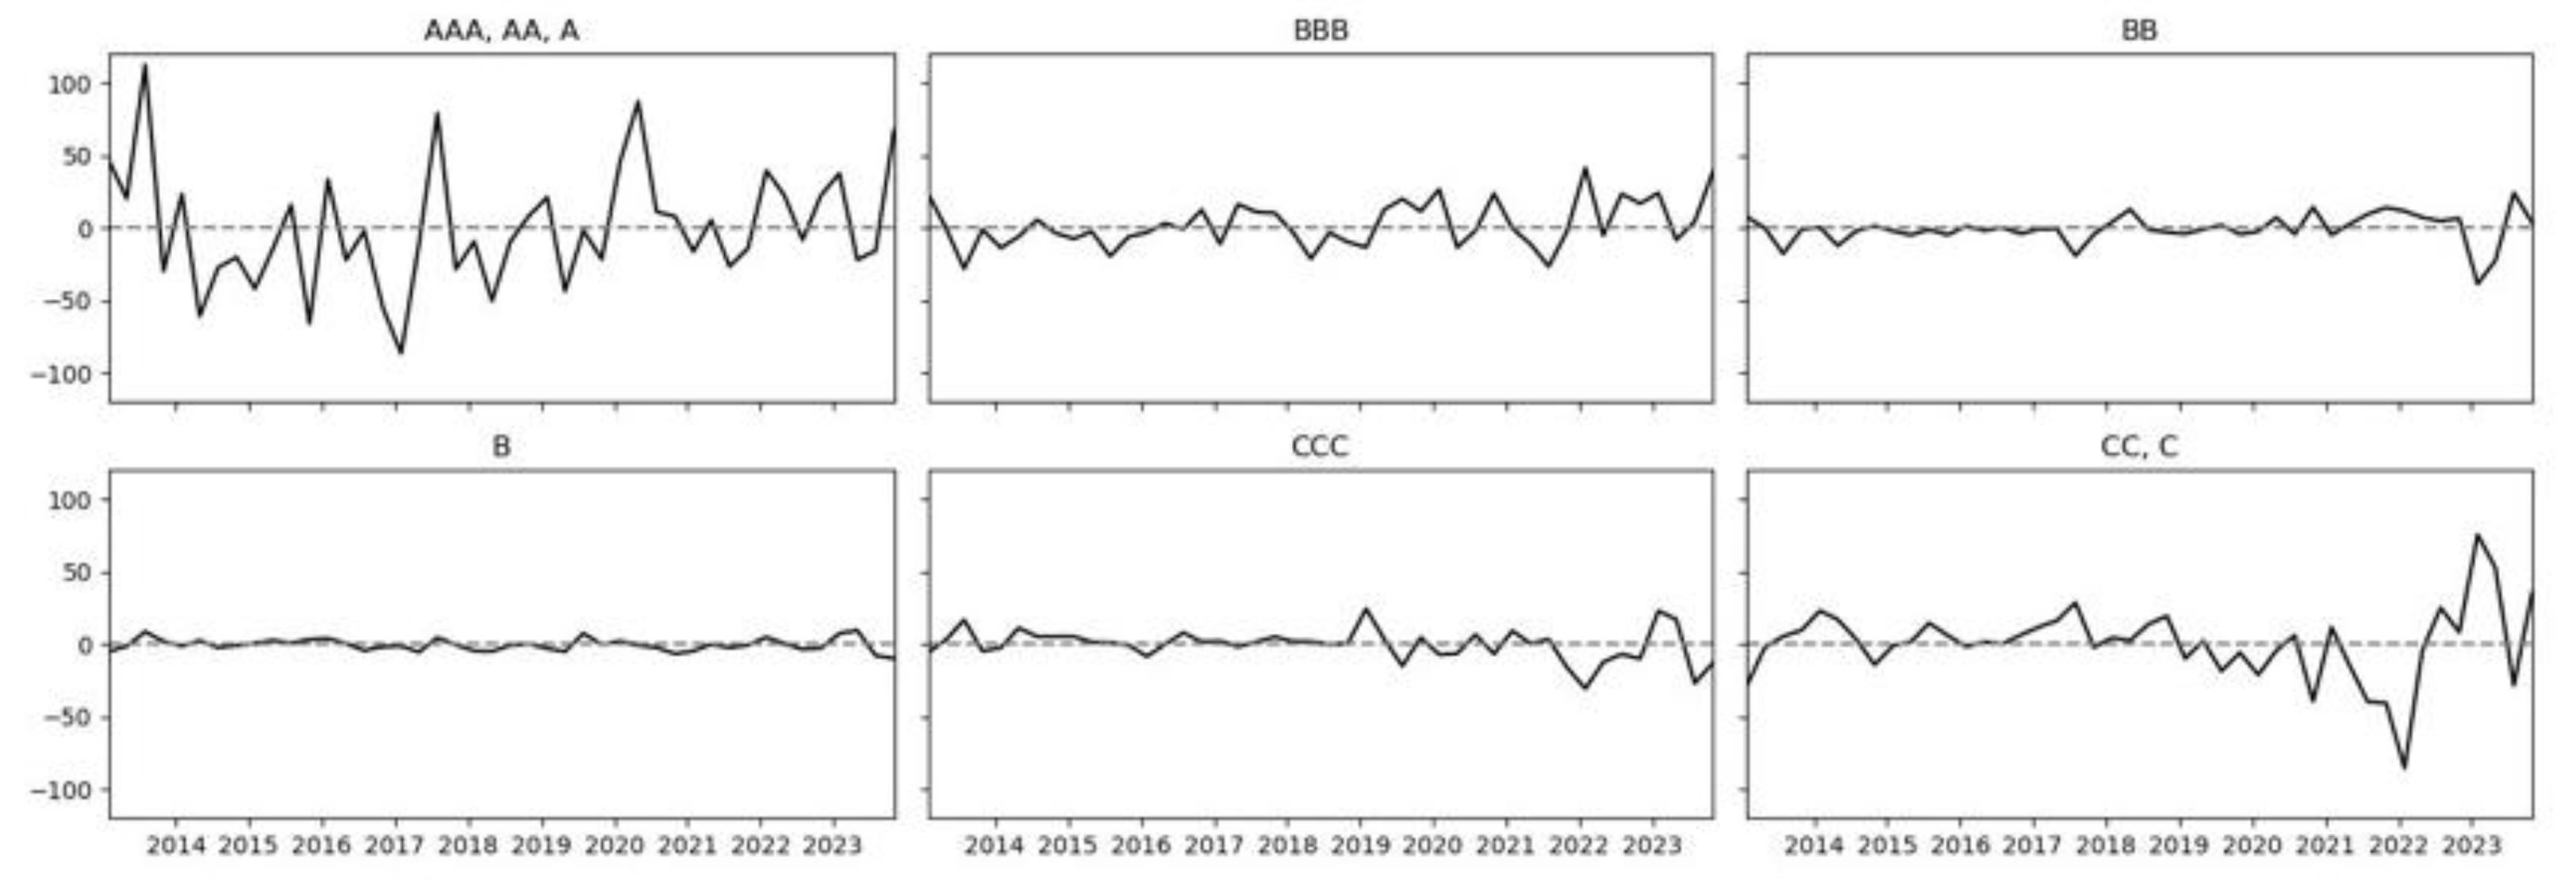
Firstly, analyzing the spillover intensity among different rating networks,
Figure 2 illustrates the net spillover intensity of various ESG ratings from 2013 to 2023 over time. The values in the chart range from −100 to 100, where positive values indicate a positive spillover effect, and negative values indicate a negative spillover effect. There are noticeable differences in the net spillover intensity of different ESG ratings. High ratings such as AAA, AA, and A typically exhibit a stronger positive spillover effect, which may be due to the better investor confidence and lower perceived risk market expectations for these rated companies. In contrast, low ratings like CCC, CC, and C often show a stronger negative spillover effect, reflecting the market concerns and potential risk assessments of these rated companies. Moderate ratings such as BBB and BB may exhibit volatility, depending on market sentiment, industry dynamics, and macroeconomic conditions. These comparisons between ratings reveal the market sensitivity to different ESG ratings. In addition, the intensity of spillover from high ratings to low ratings is continuously diminishing.
When analyzing the topological properties of different sub-networks, to reduce the differences in topological properties caused by different numbers of nodes in each sub-network, standard processing has been carried out in accordance with the definitions of topological properties. The specific centrality-related data can be found in
Table 3. In the ESG grading network, it has been observed that as the rating decreases from AAA/AA/A to CC/C, the mean of closeness centrality and eigenvector centrality decreases. This is because high-rated companies play a key bridging role in the network, connecting different parts of the network. However, their influence may not be transmitted through direct contacts, but indirectly affects other companies through their position in the network. In addition, the ESG rating network may have a non-uniform structure, where some nodes are very important in some respects but not in others. At the same time, the dynamics within the network and market perceptions of companies may not fully align with the rating criteria, further affecting the performance of centrality indicators. These factors work together to result in a complex pattern of relationships between the different centrality indicators and the ratings.
In the ESG grading network, as the rating increases (CC/C to AAA/AA/A), the network average shortest path length and the average connectedness strength increases. This means that high-rated companies tend to establish closer and more frequent contacts, reflecting their pursuit of long-term and in-depth cooperative relationships to maintain their ESG ratings. The increase in network average shortest path length may indicate the important position of these companies in the network, causing connections between other companies to require more intermediate nodes. These changes may be due to high-rated companies adopting a more selective connection strategy, prioritizing connections with companies that can bring positive impacts, while reducing connections with companies that may negatively affect their ratings. This strategy may lead to a more stratified and modular network, where high-rated companies may form their own sub-networks or modules, with close internal connections but fewer connections with other modules. Overall, these phenomena may be the result of the increased market emphasis on ESG ratings, and the strategies adopted by companies to optimize network structure and connection patterns.
4.2. Analysis of 2015 Stock Market Crash
From the second half of 2014 to the middle of 2015, China’s stock market, especially the Shanghai Composite Index, experienced a significant rise. From the middle of 2014 to June 2015, the Shanghai Index soared from around 2000 points to over 5000 points. During this period, the main drivers of the market came from investors’ optimistic expectations [
57], government supportive policies [
58], and a large influx of leveraged funds [
59]. Due to the continuous rise and the release of favorable policies, investors generally expected the market to continue to rise, which further promoted the formation of a market bubble. Leveraged trading became the norm, with many investors borrowing money to enter the stock market, further intensifying the speculative nature of the market. In the middle of June 2015, as regulators tightened control over leveraged funds, the market began a sharp correction. Within just a few weeks, the stock market plummeted from its peak, and panic spread among investors, pushing the market into a rapid downward spiral [
60,
61]. During the stock market decline, the Shanghai Composite Index fell from above 5000 points to below 3000 points between June and August 2015, with trillions of yuan in market value evaporating. Investors suffered heavy losses, and the market was plunged into extreme panic.
To prevent excessive market fluctuations, regulatory authorities introduced a circuit breaker mechanism at the beginning of 2016. However, this mechanism exacerbated market panic and liquidity issues in actual operation. Under the circuit breaker mechanism, excessively long trading suspensions led to more selling pressure, further drying up market liquidity. Due to the frequent triggering of the circuit breaker, market liquidity plummeted, and investors were unable to sell their stocks in a timely manner, causing the market panic to spread further.
To stabilize the market, the government implemented a series of measures, including suspending initial public offerings (IPOs), establishing a national team to intervene in the market for rescue, and restricting shareholders from reducing their holdings. These measures gradually stabilized market sentiment and prevented further market decline. With government intervention and the self-correcting mechanisms of the market, the market gradually recovered from the end of 2015 to 2016. Although it did not fully recover to the levels during the peak of the bubble, the market gradually stabilized, and investor confidence was partially restored. At the beginning of 2016, China’s securities market introduced a circuit breaker mechanism. However, due to severe market fluctuations, the mechanism exacerbated market panic and was eventually suspended on January 8th.
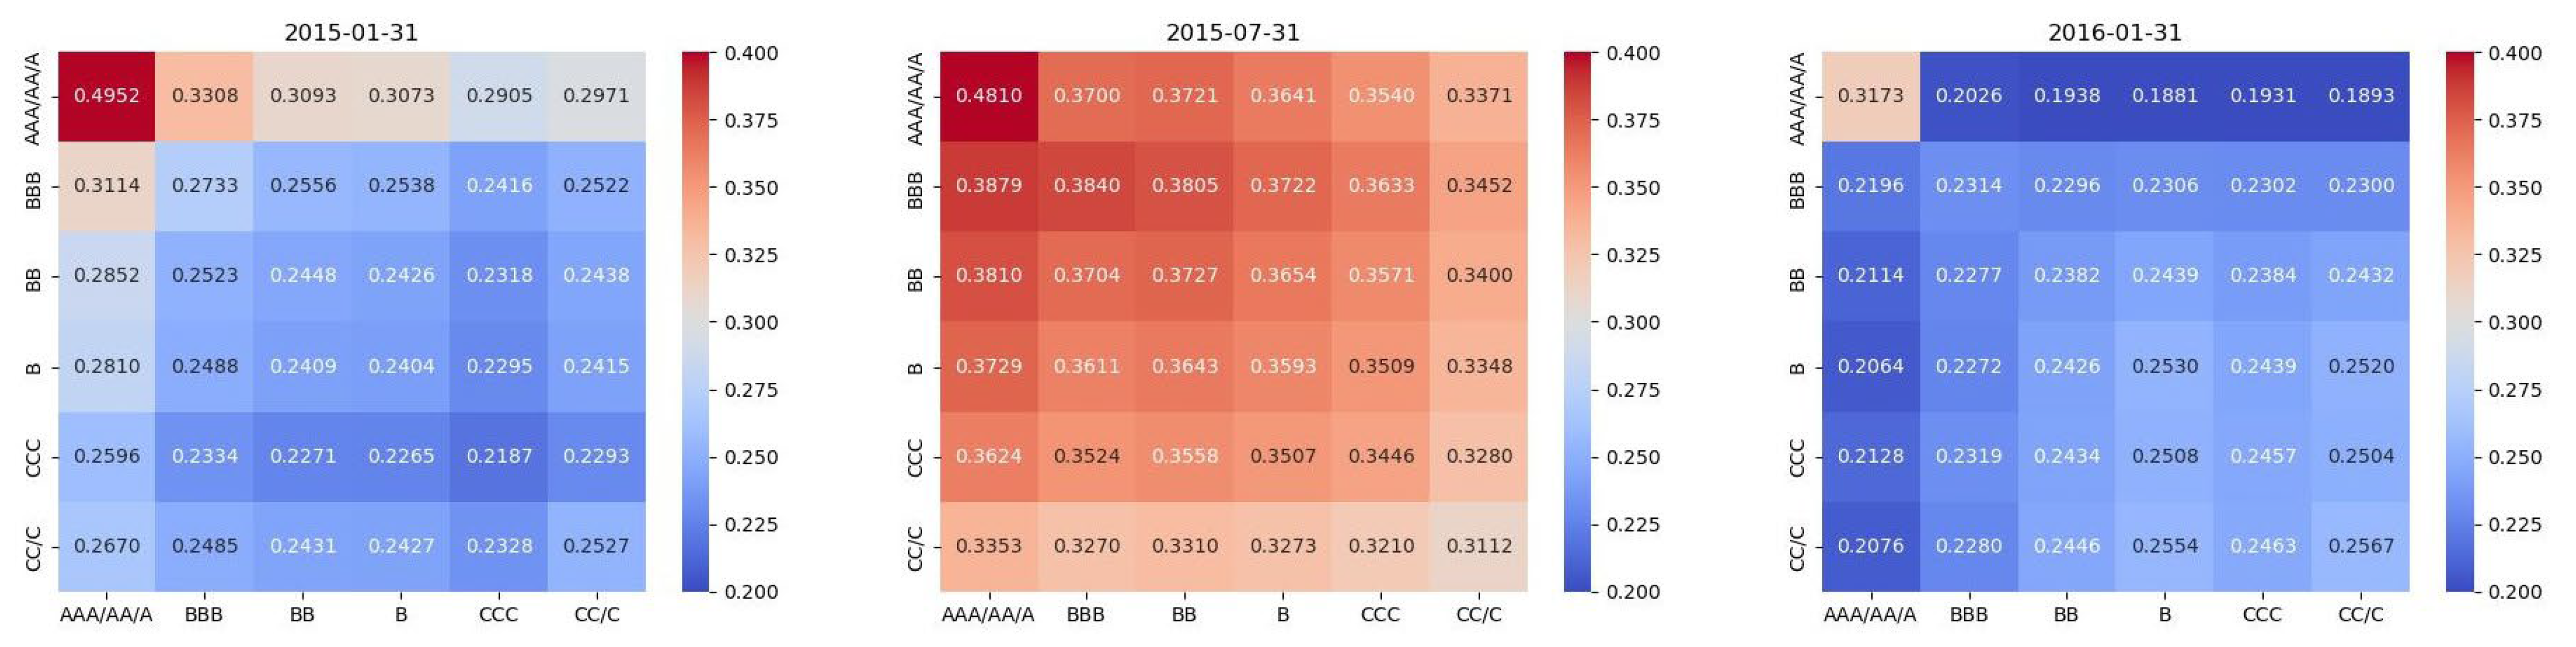
Regarding the spillover relationships between different rating sub-networks, we present directed heat maps of the volatility spillover relationships at different times, where the inter-rate spillover relationships are visually represented by color intensity. The depth of the color indicates the strength of the spillover. High ratings such as AAA/AA/A have the strongest spillover capabilities and are the main sources of spillover, while low ratings such as CC/C may exhibit weaker positive or negative relationships and are the main recipients of spillover.
To better analyze the changes in the ESG rating network structure before and after the stock market crash, we define the “early” stage as the period from January to May 2015. The “mid” stage covers the period from June to October 2015, marked by severe turbulence, and the “late” stage is from October 2015 to March 2016, when the market gradually stabilized. We can observe the following trends in
Table 4. The CC of different rating networks mostly decreased from the early to the mid period, while the EC increased, before both returned to stable levels in the late period. This indicates that during the stock market turbulence, the highest-rated companies experienced complex changes in terms of information transmission efficiency and influence within the network.
In
Table 5, we found that during the 2015 stock market crash, from the early to the mid period, the ASPL and ACS of different rating sub-networks generally increased to varying degrees, before stabilizing in the late period. For instance, the ASPL of the AAA/AA/A network rose from 0.1831 in the early period to 0.3887 in the mid period, then decreased to 0.1316 in the late period. Similarly, the ACS increased from 0.3167 in the early period to 0.7774 in the mid period, before dropping to 0.4229 in the late period. These findings suggest that the stock market crash significantly affected the network’s topology, with the network’s connectivity and connection strength first weakening and then strengthening.
From
Figure 3, during the early stage of the 2015 stock market crash, AAA/AA/A played the main role of volatility spillover sender, while CC/C was the spillover receiver, with the intensity of spillover from AAA/AA/A to CC/C being 0.2971. The volatility spillover intensity decreased with the decline in each group’s rating (from AAA/AA/A to CC/C).
Looking at the specific changes from the early to the mid stage, the spillover intensity of all ESG groups increased significantly. For example, the intensity of spillover from AAA/AA/A to CC/C rose from 0.2971 to 0.3371. From the mid stage to the late stage, the spillover intensity of all ESG groups dropped sharply to a level close to that of the early stage. For instance, the intensity of spillover from CC/C to AAA/AA/A fell from 0.3371 to 0.1893. Notably, the relationship between the decline in ESG ratings and the decrease in spillover intensity remained unchanged in the mid and late stages.
As described in the text, the main factor behind the 2015 stock market crash was “leverage”. Investors used financing and leveraged tools to push up stock prices, significantly increasing market volatility. Moreover, due to the inherent nature of leverage, when market prices fell, the panic selling and margin calls triggered by leverage caused equally severe price fluctuations. However, the impact of leverage varied across different stocks. Leverage providers (such as securities companies and investment banks) typically prioritized providing financing for stocks with large market capitalization, high liquidity, and good asset credit, which largely overlapped with high ESG-rated groups, such as AAA/AA/A. In contrast, stocks with small market capitalization, poor liquidity, and low asset credit, like CC/C, were more risky and less likely to receive leverage support.
Therefore, the “leverage” factor made high-rated stocks the main senders of spillover effects, while low-rated stocks acted as receivers. During periods of severe market volatility, the spillover intensity of all rating groups increased, but the spillover relationships and patterns remained consistent. The above analysis has been further supplemented and refined in the text.
4.3. Analysis of COVID-19 Pandemic Shock
In January 2020, the COVID-19 pandemic first broke out in China and quickly spread to other countries. The Chinese government implemented strict lockdown measures to control the epidemic. During this period, the A-share market experienced a significant decline after the resumption of trading following the Spring Festival, especially on 3 February 2020, when the Shanghai Composite Index plummeted nearly 8% at the opening, setting a record for the largest single-day drop in many years [
62]. In the global market, although there were some early fluctuations, the market generally took a wait-and-see attitude, and no large-scale panic selling occurred [
34].
In March 2020, as the pandemic rapidly spread globally, it triggered panic selling in the global stock markets. The S&P 500 index triggered the circuit breaker mechanism four times in just ten days, marking the first time in history that it had been triggered so many times in such a short period. Market volatility surged dramatically. The frequent triggering of the circuit breaker mechanism reflected the extreme market concern over the spread of the pandemic, expectations of economic recession, and uncertainty [
63].
Facing market panic, governments and central banks around the world quickly introduced large-scale monetary and fiscal policies, including interest rate cuts, quantitative easing (QE), and direct fiscal support. For instance, the United States launched a USD 2 trillion economic stimulus package, and the Federal Reserve announced an unlimited quantitative easing policy. These measures aimed to stabilize market sentiment and support economic recovery. The liquidity support and restoration of market confidence brought about by policy intervention led to a rebound in the stock market. Although economic data remained weak, the market gradually recovered from the lows of March, especially with technology stocks showing strong performance.
As the pandemic spread, actual economic data began to emerge, particularly in areas such as unemployment rates, business bankruptcies, and supply chain disruptions, revealing the far-reaching impact of the pandemic on the global economy [
64].
Compared to other major global markets, China’s stock market experienced less volatility in the early stages of the pandemic. Although the A-share market also saw a certain decline at the beginning of the outbreak in early 2020, it rebounded quickly, and its volatility was significantly lower than that of European and American markets. The Chinese government took swift and strong intervention measures at the onset of the pandemic, such as city lockdowns, strict epidemic prevention measures, and large-scale economic stimulus policies. These measures effectively controlled the spread of the pandemic and boosted market confidence. The investor structure of China’s stock market is somewhat unique, with a high proportion of individual investors and relatively fewer holdings by institutional investors. This makes the market more susceptible to investor sentiment in the short term, but it also means that the market recovers more quickly after the introduction of government confidence measures.
During the COVID-19 pandemic, we define the “early” stage as the period from October to December 2019, the “mid” stage spans the period from January to March 2020, characterized by significant volatility and declines, and the “late” stage is from April to June 2020, as markets showed early signs of recovery due to stimulus measures.
Table 6 and
Table 7 show varying trends in CC, EC, ASPL, and ACS across different rating networks. CC and ASPL declined from the early to the mid period, then rose in the late period. EC and ACS generally decreased from the early to the mid period, with a slight increase in the late period. These trends indicate fluctuating information transmission efficiency and influence within the network during the pandemic, reflecting dynamic market conditions and the differential impact of the pandemic on various ratings.
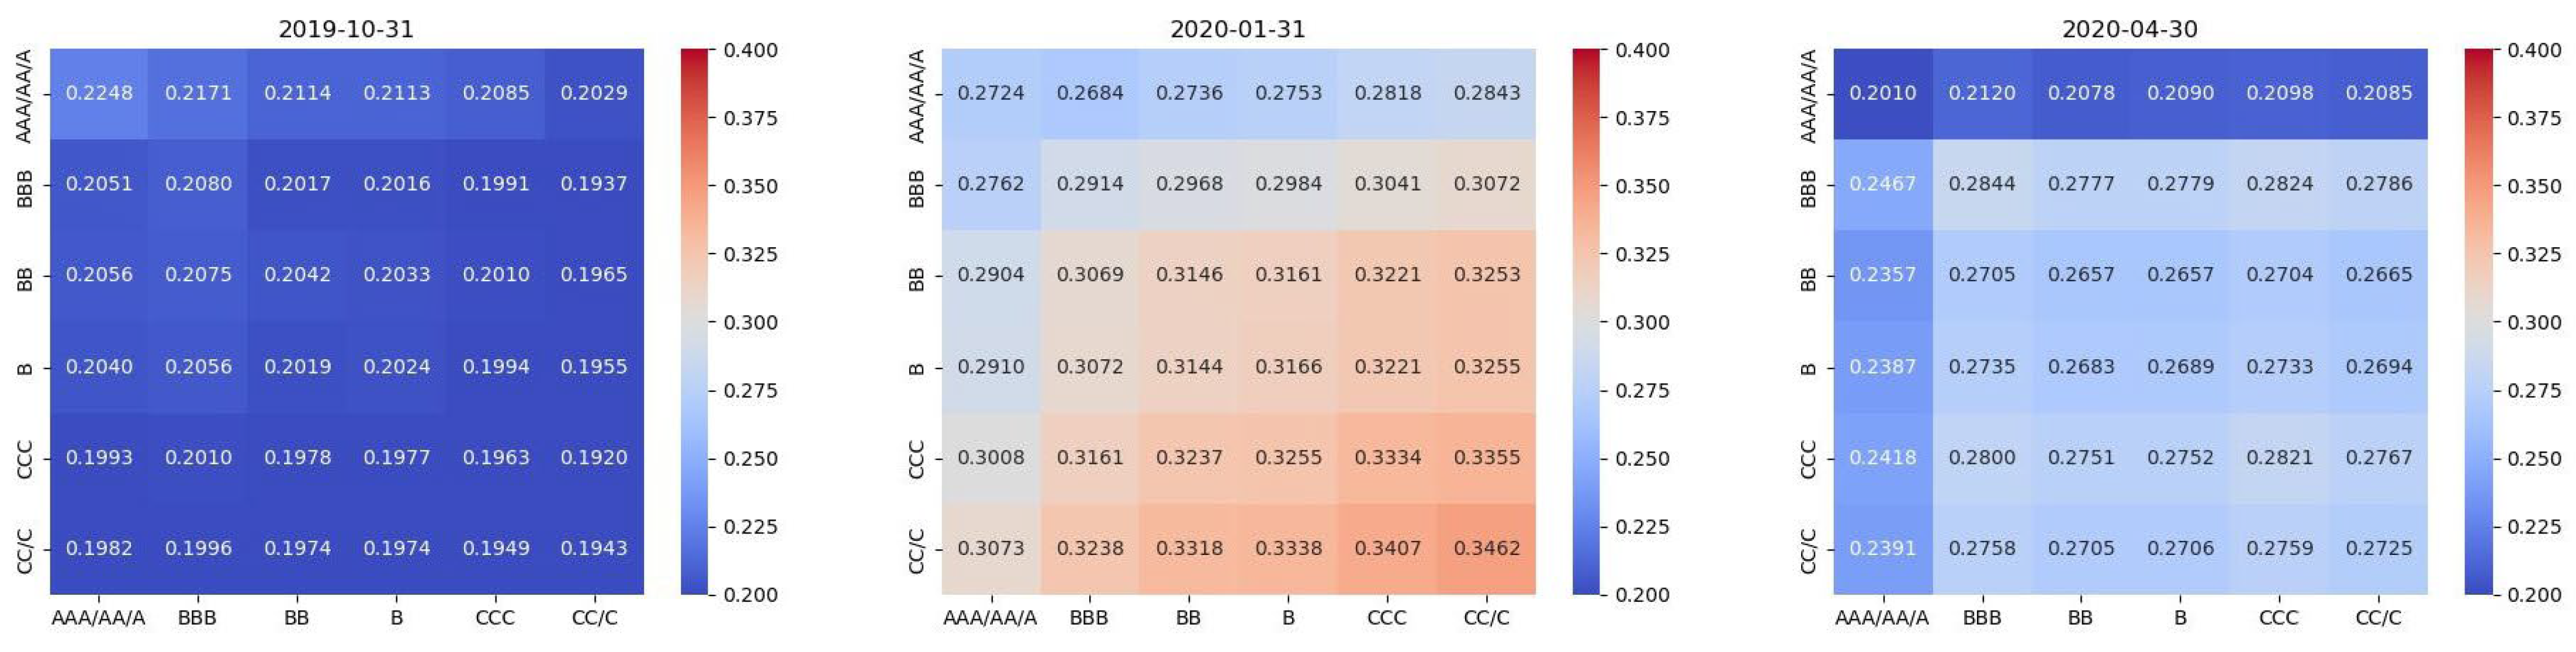
From
Figure 4, during the early stage of the COVID-19 pandemic shock, AAA/AA/A-rated stocks were the primary senders of volatility spillovers, while CC/C-rated stocks were the receivers, with a spillover intensity of 0.2029. The spillover intensity decreased with lower ratings.
From the early to the mid stage, the spillover intensity increased for all ESG groups. For example, the intensity from AAA/AA/A to CC/C rose from 0.2029 to 0.2843. Significantly, the direction of spillover changed. As the ratings decreased, from AAA/AA/A to CC/C, the spillover intensity increased, making CC/C the main sender and AAA/AA/A the receiver. This contrasts sharply with the 2015 stock market crash spillover pattern.
From the mid to the late stage, the spillover intensity dropped markedly for all ESG groups, returning to levels close to the early stage. For instance, the intensity from CC/C to AAA/AA/A fell from 0.2843 to 0.2085. The relationship between rating decreases and spillover intensity increases remained unchanged in the mid and late stages.
As described in the text, the main driver of market volatility during the COVID-19 pandemic was “liquidity”. External shocks from the pandemic disrupted supply chains and reduced consumption, severely affecting upstream corporate profits. Investors tended to avoid companies with poor profitability, small market capitalization, and low risk resistance. These companies, often with poor stock liquidity, faced liquidity crises as investors withdrew funds, causing rapid share price declines. Similarly, when the pandemic eased and investors returned to the market seeking profits, the prices of illiquid stocks rebounded quickly. This phenomenon was observed in both the Chinese and US markets.
The “liquidity” factor caused all rating groups to experience increased spillover intensity during the pandemic, with low-rated groups becoming the primary senders and high-rated groups the receivers. This differs from the 2015 stock market crash due to the different core factors causing market volatility.
6. Conclusions
This study examines risk contagion paths among different ESG-rated groups in China’s stock market by constructing a large-scale volatility spillover network with the VAR-DY method. It finds that high ESG-rated stocks (AAA/AA/A) lie at the network’s core, positively impacting market stability. Yet, during extreme events like the 2015 Chinese stock market crash and the COVID-19 pandemic, volatility spillovers intensified, with ESG ratings and risk spillover directions varying due to event specific drivers.
The research makes academic contributions by building the first large-scale individual stock network in China, refining the analysis of risk contagion pathways between ESG sub-networks, and offering event driven explanations for spillover patterns. Compared to the existing literature, it provides new insights into systemic risk analysis and event-background analysis, introducing a Chinese market perspective to global ESG research.
However, the study has limitations. ESG data from Huazheng may diverge from other agencies due to differences in data collection and evaluation methods. Also, the China-specific focus requires further universality testing of the conclusions. Future research could use data from multiple agencies to boost result robustness and extend the analysis to multi-asset classes or global markets. Exploring industry characteristics, investor behavior, or information disclosure alongside ESG ratings will offer a more comprehensive view of financial market sustainability.
In summary, this research provides a new framework for understanding financial stability in the Chinese market through ESG rating-based risk contagion analysis. As global sustainable development attention grows, ESG factors will play an increasingly important role in investment decisions and risk management. Future research should continue to explore their diverse roles in dynamic market environments.


