Article

Enhanced ResNet50 for Diabetic Retinopathy Classification: External Attention and Modified Residual Branch

College of Mechanical and Electronic Engineering, Nanjing Forestry University, Nanjing 210037, China
*
Author to whom correspondence should be addressed.
Mathematics 2025, 13(10), 1557; https://doi.org/10.3390/math13101557
Submission received: 2 April 2025 / Revised: 6 May 2025 / Accepted: 7 May 2025 / Published: 9 May 2025

Abstract

:
One of the common microvascular complications in diabetic patients is diabetic retinopathy (DR), which primarily impacts the retinal blood vessels. As the course of diabetes progresses, the incidence of DR gradually increases, and, in serious situations, it can cause vision loss and even blindness. Diagnosing DR early is essential to mitigate its consequences, and deep learning models provide an effective approach. In this study, we propose an improved ResNet50 model, which replaces the 3 × 3 convolution in the residual structure by introducing an external attention mechanism, which improves the model’s awareness of global information and allows the model to grasp the characteristics of the input data more thoroughly. In addition, multiscale convolution is added to the residual branch, which further improves the ability of the model to extract local features and global features, and improves the processing accuracy of image details. In addition, the Sophia optimizer is introduced to replace the traditional Adam optimizer, which further optimizes the classification performance of the model. In this study, 3662 images from the Kaggle open dataset were used to generate 20,184 images for model training after image preprocessing and data augmentation. Experimental results show that the improved ResNet50 model achieves a classification accuracy of 96.68% on the validation set, which is 4.36% higher than the original architecture, and the Kappa value is increased by 5.45%. These improvements contribute to the early diagnosis of DR and decrease the likelihood of blindness among patients.

1. Introduction

Diabetes is a chronic disease characterized by insufficient insulin secretion from the pancreas or a decrease in the body’s sensitivity to insulin, resulting in an increase in blood sugar levels [1,2,3]. According to the statistics of the China Diabetes Market Report: 2024–2032, China is presently the nation with the greatest number of diabetics globally, and the prevalence of diabetes has risen to about 12%. Long-term complications of diabetes can result in serious vision problems, with DR serving as the primary cause of blindness among individuals aged 20–64 [
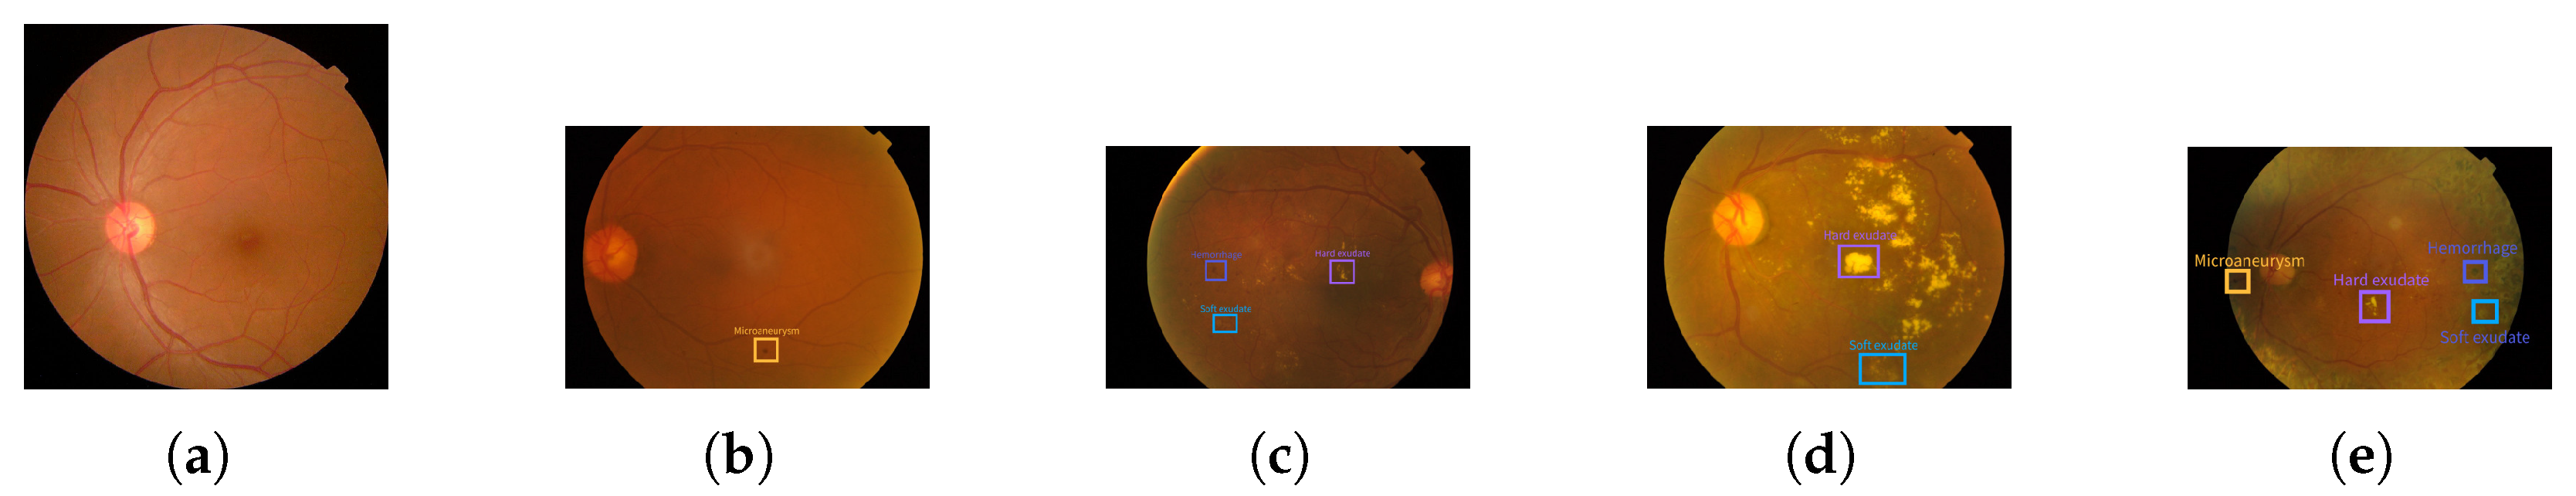
4]. DR is a severe eye complication resulting from diabetes, characterized by thinning of the retinal blood vessel wall, hemorrhage, fluid exudation, macular edema, and abnormal angiogenesis. These pathological changes may eventually lead to vision loss or even blindness [5]. The pathologic features of DR include microaneurysms (MAs), hard exudates (EXs), soft exudates (SEs), and hemorrhages (HEs) [6]. Based on the International Clinical Diabetic Retinopathy Scale (ICDRS), the types of DR are classified as normal, mild nonproliferative, moderately nonproliferative, severe nonproliferative, and proliferative. These five types of DR are illustrated in Figure 1 below.
Screening for DR facilitates the early detection and management of DR because it is often asymptomatic in the early stages. Many patients remain unaware of the condition until significant vision impairment occurs [7,8]. However, the number of DR patients continues to rise, while experienced ophthalmologists are both scarce and unevenly distributed [9]. In addition, even professional ophthalmologists are susceptible to misdiagnosis. Therefore, the use of computer-aided diagnosis can effectively alleviate these challenges by reducing the workload of ophthalmologists, shortening examination times, and enabling patients to gain a faster understanding of their condition. In recent years, convolutional neural networks (CNNs) have achieved remarkable advancements in the domain of computer vision and have become an important tool for various applications. Benefiting from the powerful feature extraction capability of CNNs, they are widely used in DR classification tasks [10,11,12]. To be specific, a neural network architecture named DcardNet is designed in [13], which adopts adaptive rate dropout to improve classification accuracy and reliability and generates three independent classification levels to meet the needs of clinical diagnosis. The accuracy of the network in DR classification is better than that of the existing models, which could accurately identify patients who needed further diagnosis by ophthalmologists and provided important technical support for reducing the visual damage caused by DR. The application of the ResNet architecture in retinal image classification is developed in [14]. Compared with other deep learning models, the ResNet-18 model with Swish activation function is experimentally proved to perform best. Ref. [15] uses a fusion dark channel prior approach for color enhancement and uses the EfficientNetV2 model for DR lesion detection, which can achieve efficient classification. In [16], a new approach is proposed to solve the problem of limited accuracy and interpretability of deep neural networks (DNNs) caused by limited datasets. Based on this method, the eye tracker is used to obtain the eye movement view of the ophthalmologist at the time of diagnosing DR and combined with the original fundus image (using OTSU fusion and weighted fusion). The attention guidance mechanism of Class Activation Map (CAM) regularization significantly improves the accuracy and interpretability of the early DR detection model. On the DIARETDB0 and DIARETDB1 public datasets, the accuracy of the model is 94% and 94.83%, respectively. However, despite the promising results achieved by CNN-based DR grading methods, several challenges remain in their practical clinical application. First, DR features do not exist in isolation but often appear at the same time and may appear in different combinations in different grades. It is easy to confuse and affect the diversity between categories. Second, there is a significant class imbalance in DR datasets, with certain grades being overrepresented, while others are underrepresented. As a result, models tend to focus disproportionately on the grades with abundant samples, neglecting those with fewer examples. This imbalance adversely affects the model’s generalization ability. The above two problems increase the complexity and difficulty of the DR grading task. The attention mechanism aids in capturing fine-grained features in the majority of computer vision tasks and has found extensive application in image classification [17,18,19,20]. To leverage this capability, a new DR classification model, CABNet, is addressed in [21] to improve the model performance by learning global features through the Global Attention Module (GAB) and the Category Attention Block (CAB) learning specific local features. In [22], in view of the fact that the classification model cannot highlight the important parts, an innovative texture attention mechanism network is introduced. This architecture first extracts image features using an encoder, then enhances key information through a specialized texture and spatial attention module, and finally performs accurate DR image classification via a feature fusion step. A novel convolutional network called MVDRNet is developed in [23], which automatically detects DR by integrating multi-view fundus images and using deep convolutional neural networks (DCNNs) and attention mechanisms. Thus, the problem of incomplete lesion characteristics caused by visual field limitation in the single-view method can be solved. In [24], a two-branch CNN-Trans model is proposed for fundus image classification. This model includes CNN-LSTM and ViT branches, where the CNN-LSTM branch extracts features through Xception, and combines LSTM and a coordinate attention mechanism to enhance feature extraction, and the ViT branch uses a self-attention mechanism to capture global features. They are fused to perform classification, achieving an accuracy of 80.68%, which is comparable to the best existing methods.
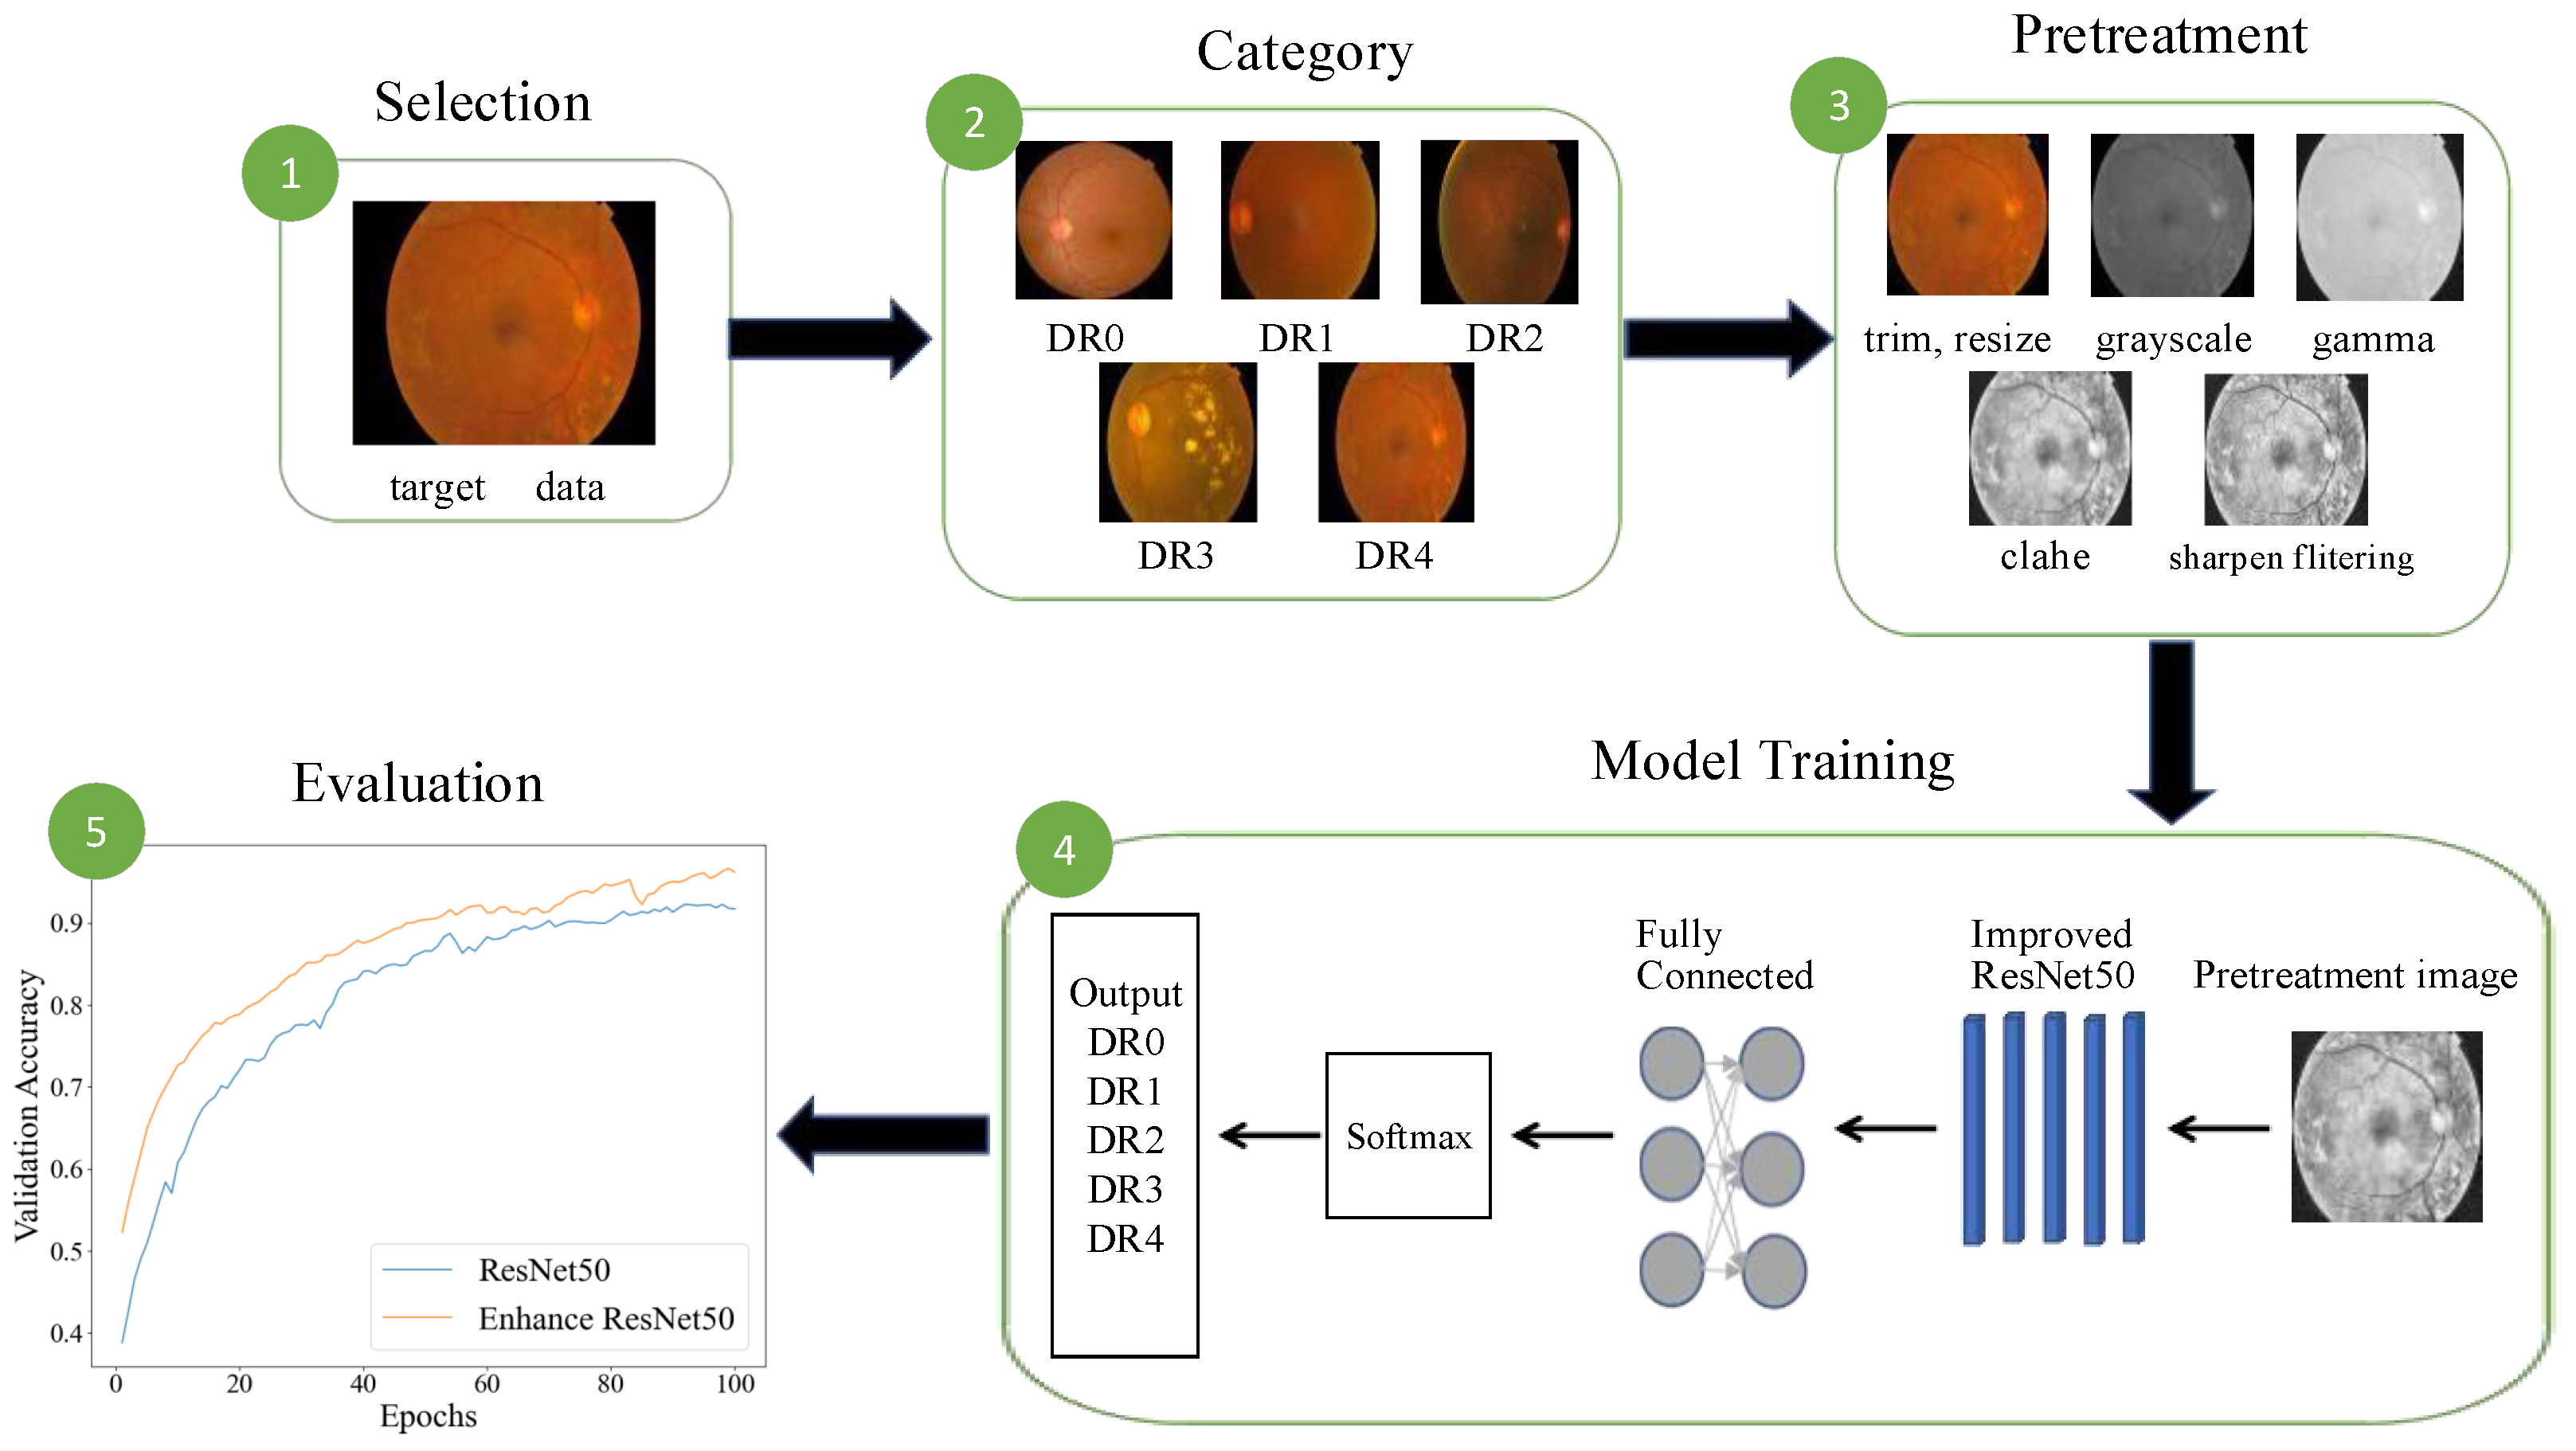
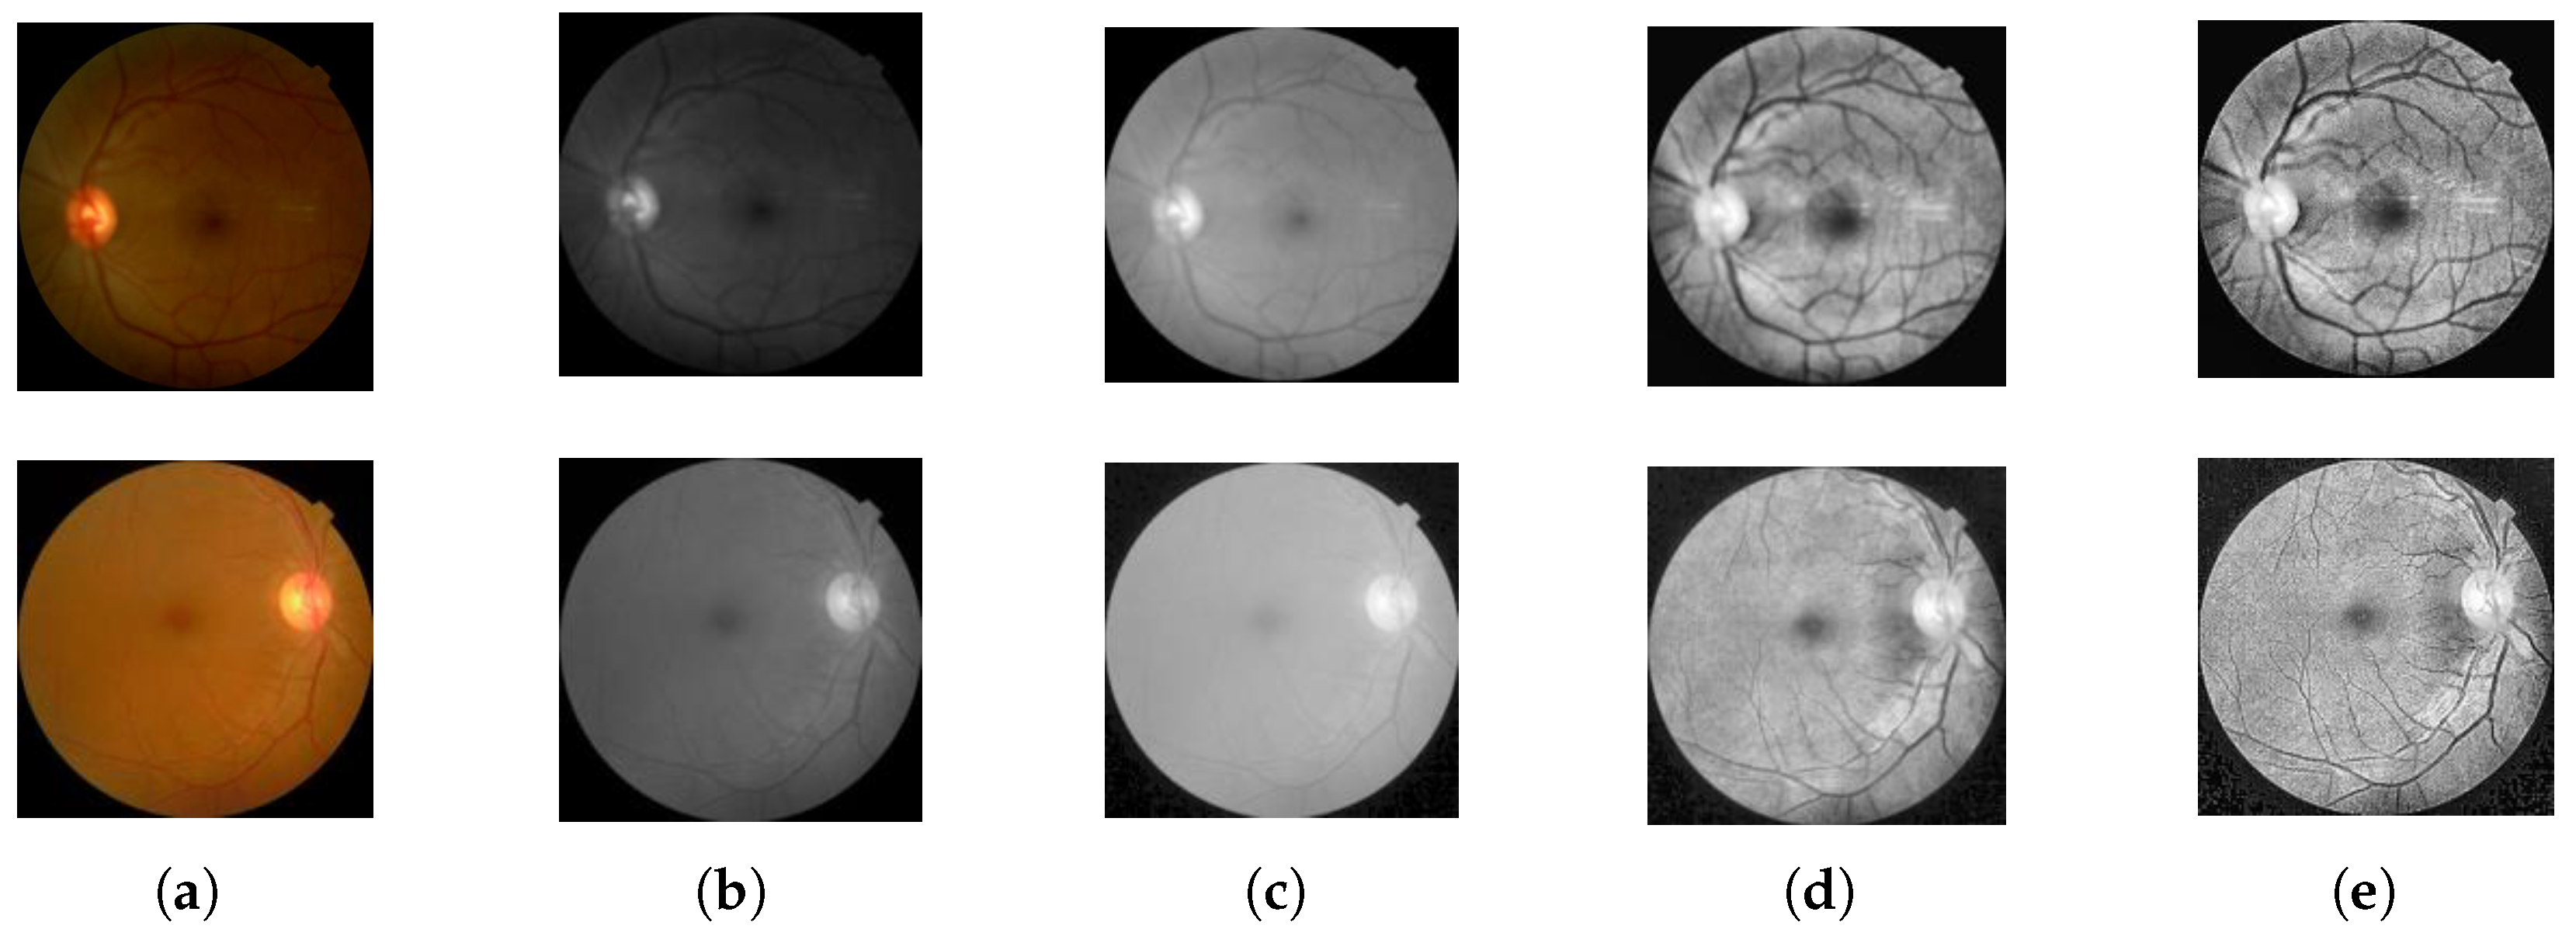
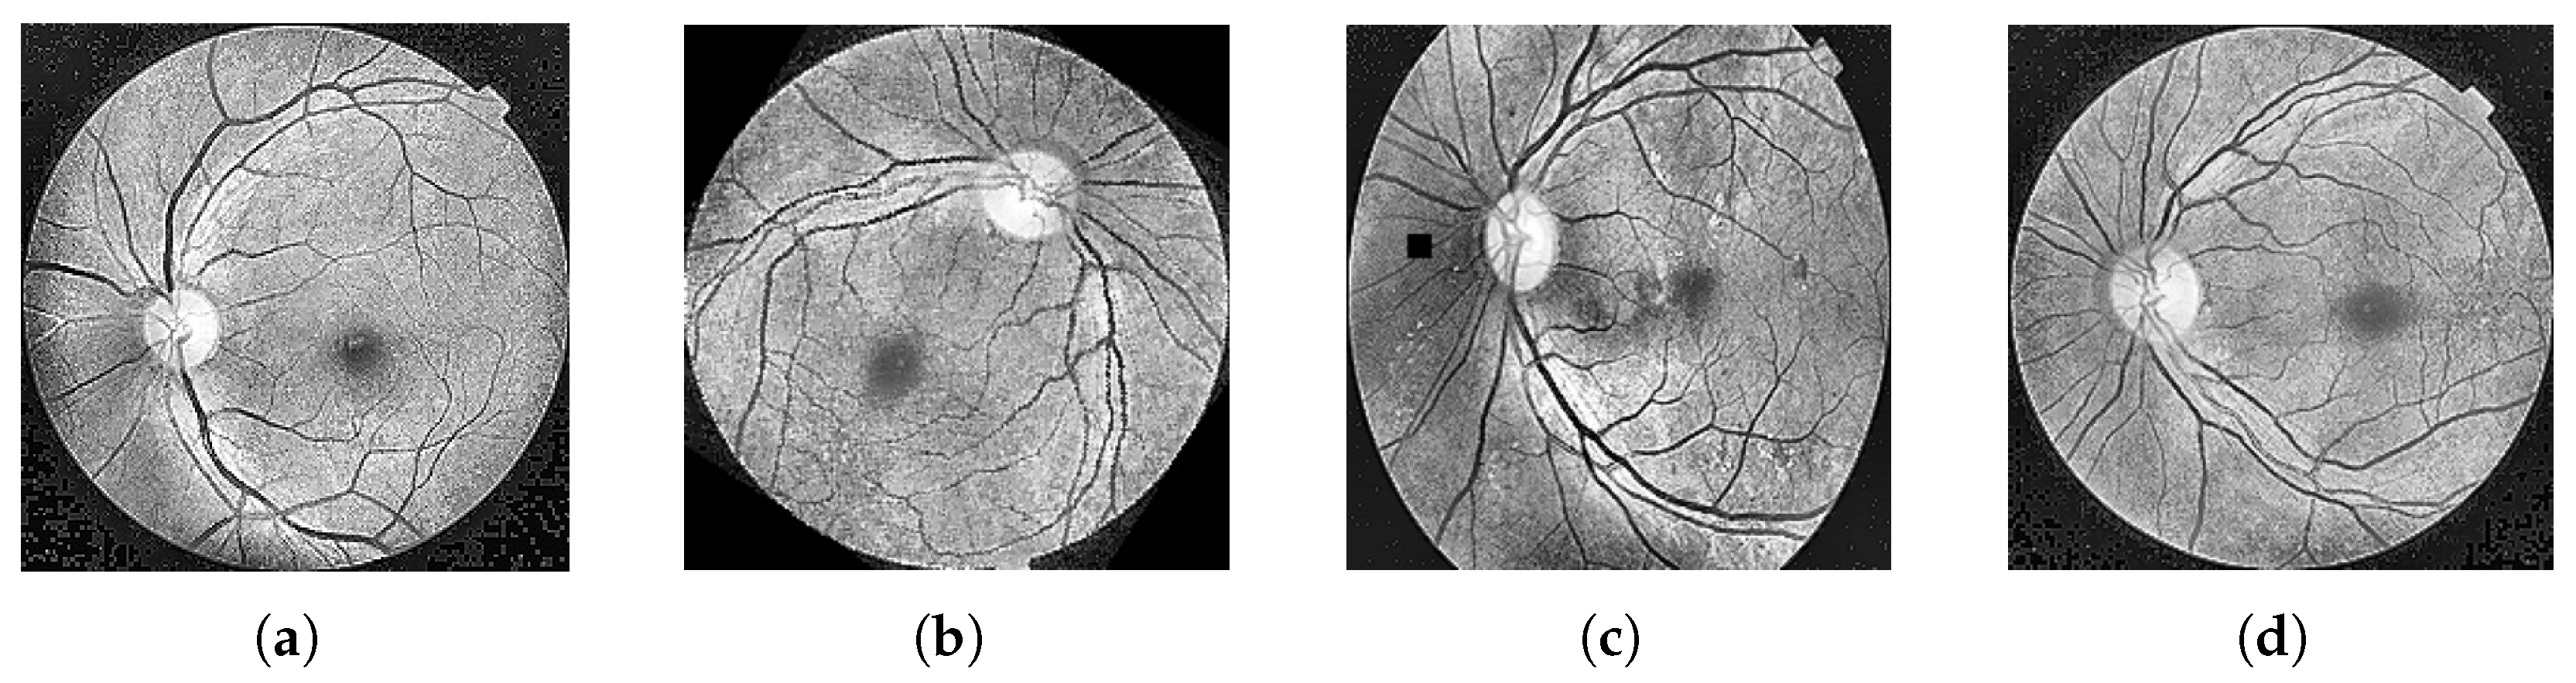
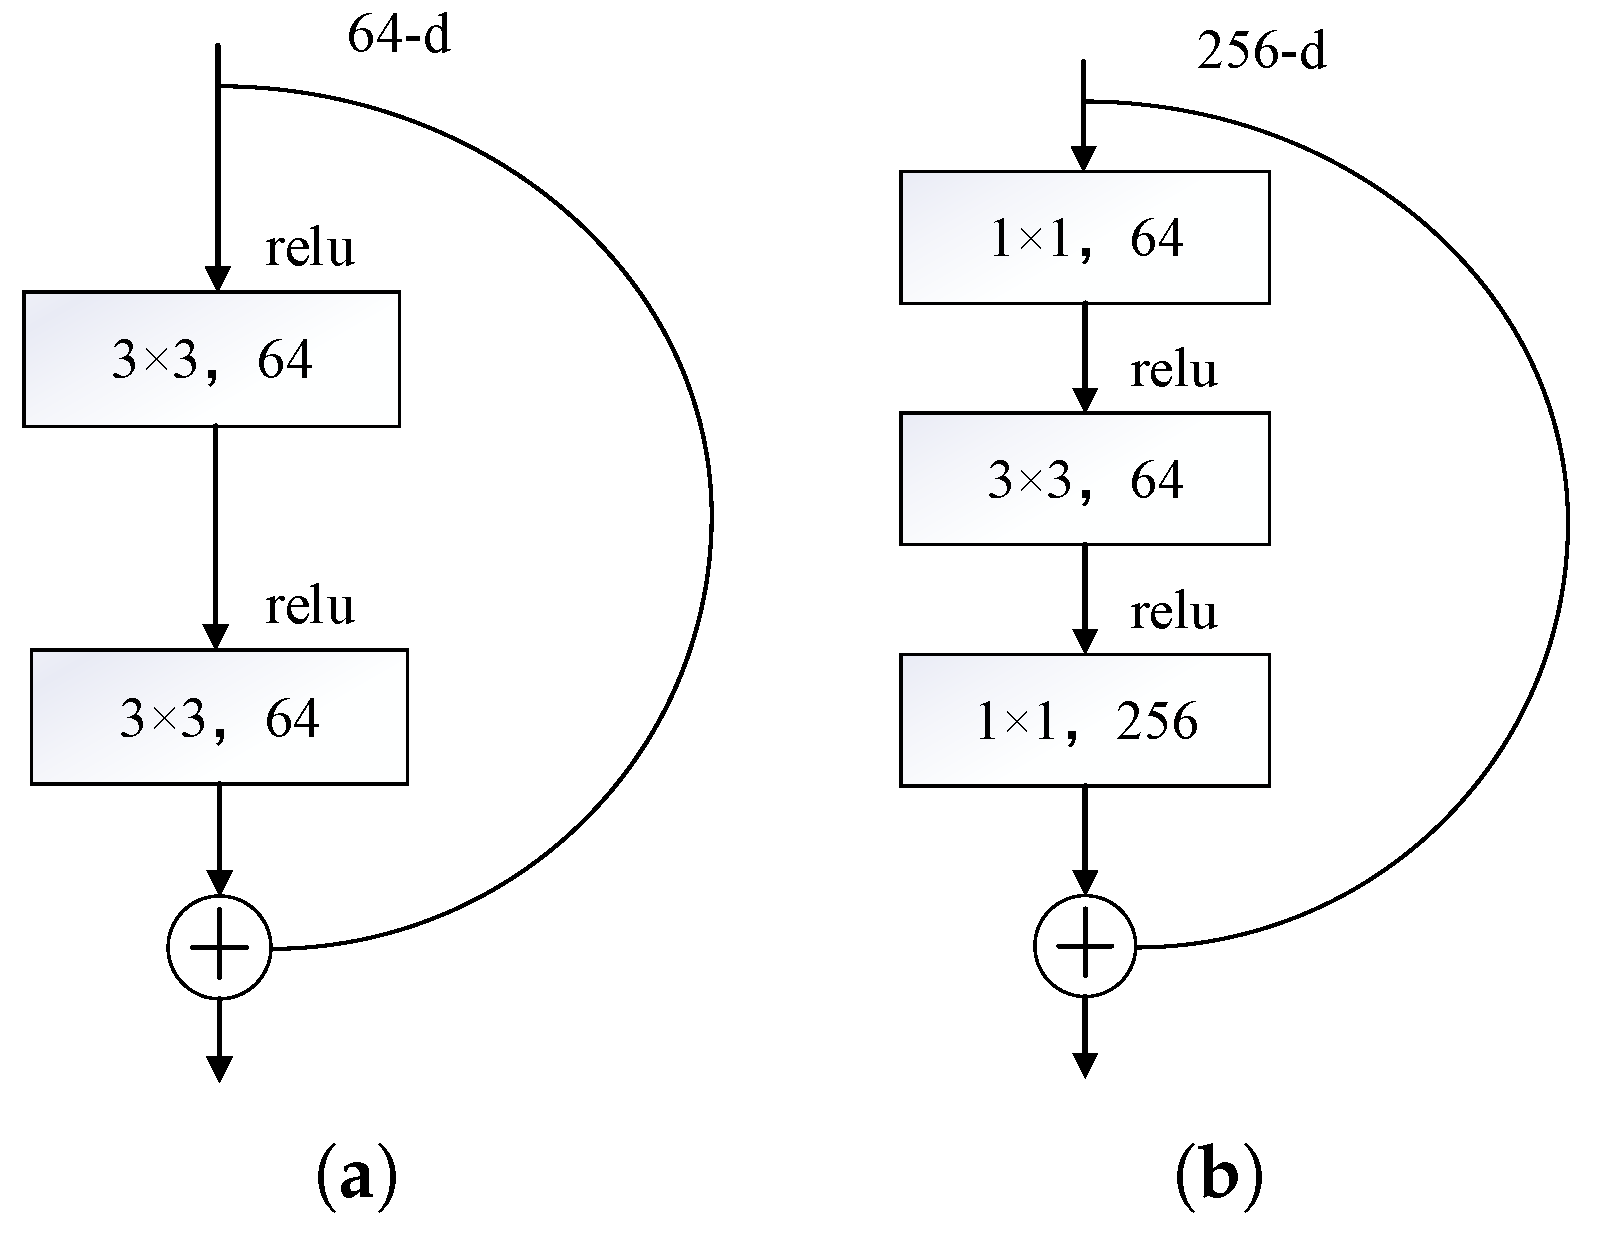
In addition to employing the attention mechanism to address the issue of fine-grained feature extraction, DR images often suffer from problems such as poor image quality and significant scale disparities. Regarding this observation, our research carries out image preprocessing and image augmentation by taking the classical model Resnet50 as the benchmark model. Meanwhile, the external attention mechanism is adopted to replace the 3 × 3 convolution of the residual structure, and multiscale convolution is further added at the residual connection branch to introduce a nonlinear transformation. This makes the residual connection no longer a simple linear identity mapping. To boost the model training process, the traditional SGD optimizer is replaced by the Sophia optimizer, which integrates the advantages of momentum and adaptive learning rates, enabling more efficient parameter adjustments during training. This accelerates convergence and improves training stability and overall model performance. The main enhancements are given as follows: (1) improved perception of image details, enabling the model to better handle the intricacies of DR classification; (2) enhanced expressive capability through nonlinear transformations, enriching the model’s capacity to represent complex patterns; (3) optimized training process, resulting in faster convergence and greater stability.

2. Image Datasets and Methods

2.1. Image Datasets

In this study, the DR dataset published by Kaggle in 2019 is selected as the training set and validation set, which is provided by a number of medical institutions, and the download link is https://www.kaggle.com/datasets/himanshuagarwal1998/diabetic-retinopathy (accessed on 31 December 2020). The dataset is composed of three-channel high-resolution color fundus images acquired under different imaging conditions. The dataset was divided into DR0, DR1, DR2, DR3, and DR4 according to the International Clinical Diabetic Retinopathy Scale (ICDRS) [25], with a total of 3662 different images, each with its own name and corresponding lesion category.

2.2. Methods

The main purpose of this paper is to use the deep learning model Resnet50 presented in [26] for early diagnosis of DR and to enhance the accuracy of diagnosis by modifying the network structure and the optimizer. However, due to the problems of noise, uneven illumination, and insufficient contrast in original medical images, the learning effect of the model and the diagnostic accuracy will be degraded. In addition, DR datasets, especially DR samples with early-stage lesions (e.g., mild non-value-added DR), are often limited in number, which leads to model overfitting, poor generalization ability, and poor performance in the face of unseen images. Therefore, it is necessary to perform image preprocessing and image augmentation on the original image. The system flow diagram of the DR classification system is demonstrated in Figure 2.

2.2.1. Image Preprocessing

As shown in Figure 1, image preprocessing is required due to the poor image quality of the original dataset. In order to remove extraneous information and enable the model to concentrate on the central region of the retina that contains the lesion features, the black border of the DR image is first cropped. In view of the fact that the original image size is different and some of the images are large, which not only increases the complexity of data processing but also brings a heavy computational burden to model training, the resize method is used to unify the images into 224 × 224 specifications [27]. Fundus images have become a key tool for the analysis and diagnosis of a wide range of cardiovascular and ophthalmic diseases [28], but they are too bright or too dark depending on the location and conditions (e.g., light intensity, exposure time, etc.). Gamma correction can adjust the overall brightness of the image, making the visual effect of the image more similar to the observation effect of the human eye under natural light so that it is more easily recognized and analyzed by doctors or algorithms, and after repeated attempts and comparisons, the gamma value is γ = 1 2.2 , and the details of the image are most clearly visible, which helps to enhance the reliability of lesion detection [29]. For making the image details clearer, CLAHE equalization is used to enhance the image details [30]. Finally, the Laplace sharpening filter is employed because the Laplace filter is a commonly used image sharpening method which can highlight the edges and details in the image by calculating the second derivative of the image, make the lesion features such as blood vessels in the image clearer, further enhance the visual effect of the image, and help to improve the model’s detection ability for lesion features. The pre-processed image is shown in Figure 3. There is a risk of overfitting the images due to the imbalance in the sample size between different categories in the DR image data. There are 1805 normal retinal images in Kaggle’s diabetic retinopathy dataset and a total of 1857 images of the four types of disease, of which the DR3 category had the lowest number of 193 images. Table 1 lists the original DR dataset.
As shown in Figure 3, compared with the original image, the pretreated DR image has clearer edge details and vascular morphology, and the lesion features are easier to identify, which is helpful for accurate diagnosis of the disease.

2.2.2. Image Enrichment

It is clear from Table 1 that there is a bias in the distribution of data and an imbalance between the sample sizes, so image augmentation is required, and this paper adopts a variety of strategies in image augmentation. Initially, the sample size is expanded by randomly rotating the image in the range of [−180°, 180°], performing operations such as horizontal offset, image filling, and horizontal flipping. However, frequent use of these methods can lead to overfitting and weakening the generalization ability of the model. In view of this, this paper further introduces image enhancement techniques, such as CUTOUT, MIXUP, and SMOTE-ENN, to enrich the means of image augmentation, aiming to optimize the performance and generalization effect of the model. The original dataset is divided into a training set, a validation set, and a test set at a ratio of 7:2:1, and the dataset is enriched by image enrichment. Table 2 lists the expanded DR dataset. The expanded image is shown in Figure 4.
As shown in Figure 4, Randomflipped includes random horizontal flips and random vertical flips, Cutout means random occlusion with a 1 × 1 box, and Mixup is a data augmentation method that creates new training samples through linearly interpolating two images along with their labels at a specific scale. In order not to overly affect one image, set the ratio of one image to 0.9 and the other to 0.1.

2.2.3. Model Structure

Theoretically, augmentation in the number of layers of deep learning networks can enhance their expressive ability. However, when the depth of the CNN network exceeds a certain threshold, the network convergence speed will be slowed down and the accuracy will be reduced. ResNet50 reduces the gradient vanishing problem and allows the training of very deep architectures by adding a residual structure, so this paper uses ResNet50 as the underlying model structure, and the ResNet50 model architecture diagram is demonstrated in Figure 5.
As shown in Figure 5, The ResNet50 model consists of five stages; the first stage is the input stem, which includes 7 × 7 large kernel convolution and 3 × 3 maximum pooling. The second to fifth stages are composed of the bottleneck residual structure, and the output of the bottleneck residual structure in the fifth stage is sent to the avgpool for average pooling, and the pooled result is obtained through the fully connected layer and softmax. There are two types of residual structures: normal residual structures and bottleneck residual structures, as shown in Figure 6 below.
As shown in Figure 6a, the residual structure is to add a branch structure to the structure of the normal state network, and the direct backhaul of the gradient is realized through the hop connection, which effectively alleviates the problem of gradient disappearance. Figure 6b shows the bottleneck residual structure, which reduces the number of parameters by introducing a 1 × 1 convolution. The a convolution of 3 × 3 is sent for feature extraction, and finally the original number of channels is restored through the convolution of 1 × 1. There are two reasons for the convolution to restore the original number of channels. First of all, the primary purpose of the design is to ensure that the channel dimensions of the input and output feature maps are strictly consistent; when the residual branch passes through the middle 3 × 3 convolutional layer (the number of channels is compressed to 64), it must be restored to the original input of 256 channels through the 1 × 1 extended convolution so as to realize element-by-element addition with the residual branch shortcut. Secondly, although the amount of computation is reduced by 1 × 1 convolution, the network needs to maintain sufficient semantic expression ability. Therefore, the original channel number is restored by 1 × 1 convolution to ensure that the feature map contains a complete semantic information dimension.

2.2.4. Model Improvements

Self-attention was proposed by Google’s research team in 2017, and self-attention abandons traditional loops and convolutions and establishes long-range dependencies that can capture semantic connections between different areas in an image. This makes self-attention excellent for tasks that require global context to be taken into account. In addition, self-attention can assign weights to inputs based on contextual information at different locations, allowing the model to focus more on information that is closely related to the current location [20]. The formula for the self-attention mechanism is as follows.
A = softmax ( Q K T ) ,
F out = A V .
In Equation (1), Q indicates Query, K indicates Key, and T indicates transpose. In Equation (2), V indicates Value. The self-attention mechanism is to obtain Q, K, and V by linear transformation of the input, and first multiply the Q and K matrices to obtain the attention matrix A, and then multiply A and V to obtain the final output of self-attention.
However, when self-attention calculates weighting, it only considers the similarity between each position and the others, and does not directly consider the global consistency. In 2022, the Tsinghua University team proposed a new attention mechanism, external attention, which relies on two externally set, smaller, learnable, and shareable memories, which can be easily implemented with the help of two consecutive linear layers and two normalized layers. The attention mechanism implicitly learns the features of the entire dataset and is able to consider the connections between different samples. The formula for the external attention mechanism is shown below.
A = Norm ( F M k T ) ,
F out = A M u .
In Equation (3), F represents the input feature matrix, M k is part of the input feature and is used to calculate the attention weight. Norm denotes double normalization. In Equation (4), M u is an external memory module, which is a learnable parameter matrix that serves as a globally shared memory unit to store generic feature representations learned from the entire training dataset. Learn from all samples through backpropagation, rather than relying solely on the features of the current sample. Therefore, for enhancing the efficiency of ResNet50, the 3 × 3 convolution in the residual structure is replaced by external attention, which makes up for the shortcomings of the self-attention mechanism that does not directly consider the global consistency so that the model can perform better when dealing with tasks that need to consider the global context. The residual block is designed to alleviate the problems of vanishing and exploding gradients during the training of deep networks. By adding shortcut connections, residual blocks allow signals in the network to bypass some layers directly, making it easier for the network to train deeper structures. The basic form of the residual block is:
y = F ( x ) + x
where F ( x ) is the feature extraction part in the residual block, x is the input feature, and y is the output feature. In some cases, F ( x ) may not learn useful features, or its output may be close to zero. This means that the output y of the residual block is mainly dependent on the input x, and the contribution of F ( x ) is negligible. At this point, F ( x ) becomes redundant and does not fully function as it should. In order to solve this problem, this paper introduces multiscale convolution in the residual branch to replace the original single-feature extraction method. Multiscale convolutional captures multiple scale information of input features by using convolution kernels at different scales in parallel, including 1 × 1 , 3 × 3 , and 5 × 5 convolutions, where 1 × 1 convolution is mainly to adjust the channel dimension and adjust the feature channel by ascending or decreasing dimensionality, 3 × 3 convolution is used to extract features, and 5 × 5 convolution has a larger spatial coverage, which is specially used to capture global context information and long-distance dependencies in images. After the multiscale feature processing is completed, the multiscale convolution is spliced along the channel dimension through the concat operation. This allows for the integration of characteristics of different receptive fields. Finally, 1 × 1 convolution is used to compress the channels of the spliced high-dimensional features to match the number of input channels in the subsequent network layer. This design ensures that even if the output of the residual part F ( x ) is close to zero in some cases, the multiscale convolutional layer is still able to extract useful features from different scales, thus enriching the feature representation. The improved residual connection is shown in Figure 7.
By introducing multiscale convolution, the network can capture the local and global features in the image more comprehensively and reduce the information omission that may be caused by a single convolution operation. In addition, multiscale convolution improves the model’s ability to perceive features at various scales and improves the robustness and expressiveness of feature learning. This approach effectively reduces potential redundancy in the network, allowing each layer to participate in feature learning more effectively, thereby significantly improving the performance of the overall model. The basic form of the improved residual block is:
y = F ( x ) + Conv 1 × 1 Concat ( Conv 1 × 1 ( x ) , Conv 3 × 3 ( x ) , Conv 5 × 5 ( x ) )
where Concat represents a feature stitching operation, and the convolution operations conv 1 × 1 ( x ) , conv 3 × 3 ( x ) , and conv 5 × 5 ( x ) represent 1 × 1, 3 × 3, and 5 × 5 convolutions applied to the input x. It adds features from different convolution kernels (or different layers) along the channel dimension to form a feature map with more channels. The main purpose of 1 × 1 convolution is to regulate the number of channels so as to guarantee that the stitched feature map is in line with the feature map of the main path regarding the number of channels. This allows for a smooth residual connection.

2.2.5. Optimizer Improvement

The reason for improving the optimizer is that it can significantly improve the efficiency and performance of model training. By employing more advanced optimization strategies, the improved optimizer can boost the convergence of the model, enabling the model to attain better performance with a smaller number of iterations. In this study, for enhancing the efficiency and performance of model training, we used the Sophia optimizer instead of the traditional Adam optimizer. The Sophia optimizer shows stronger adaptability in dealing with heterogeneous curvature and non-convex optimization problems and improves the training effect and accuracy of the model by maintaining the exponential moving average of the diagonal Hessian estimation to make it more stable in complex optimization scenarios.

3. Experimental Results

In this study, an expanded DR dataset including five types is utilized to train the improved Resnet50 model. To confirm the excellent efficiency of the new model, a series of evaluation indicators are validated. Furthermore, ablation experiments were carried out to assess the contributions of different components of the model. The results clearly demonstrated the critical role that each module plays in enhancing the overall performance.

3.1. Evaluation Indicators

During the experiment, define accuracy (Acc), precision (Pre), recall (Rec), specificity (Spe), and Kappa as evaluation indicators to assess the efficiency of the proposed method.
In multi-classification scenarios, a key evaluation metric is overall accuracy, which reflects the proportion of correctly classified samples to the total number of samples and is denoted as
Acc = T P + T N T P + T N + F P + F N
Pre is the ratio of the number of samples correctly classified to the total number of samples, and this metric is recorded as
Pre = T P T P + F P
Rec denotes the ratio of the number of samples correctly predicted to be positive in the true-positive class to the total number of true-positive class samples, and it is expressed as
Rec = T P T P + F N
Spe means the ratio of the number of samples correctly predicted as negative in the true-negative class to the total number of true-negative class samples, and it is shown as
Spe = T N T N + F P
Kappa is a statistical indicator used to measure the accuracy and consistency of classification, which evaluates the consistency of model prediction results with real classification results by comparing the degree of agreement between actual classification results and random classification results. This indicator is recorded as
Kappa = P 0 P e 1 P e ,
where P 0 is the degree of consistency observed; that is, the overall classification accuracy; P e is the degree of expected agreement under random classification.
At the same time, to facilitate model visualization, a confusion matrix is incorporated. It mainly functions to compare the classification results with the actual measured values in the process of image accuracy evaluation, thus demonstrating the accuracy of the classification results. The confusion matrix is presented in Table 3.

3.2. Model Configuration

In this study, the network architecture built is based on the Python(3.8.0) programming language and the Pytorch(1.13.1+cu116) deep learning framework. In the experimental setup, the Sophia optimizer is used, the optimizer’s initial learning rate is set to 0.001, the weight decay coefficient is 1 × 10 4 , the momentum parameter is 0.9, the batch size is 32, and the number of training rounds is 100. In addition, the loss function of the model is optimized by the cross-entropy loss function.

3.3. Experimental Results and Discussion

On the one hand, this section compares the ResNet50 with the original ResNet50 after the modified residual structure to demonstrate the validity and superiority of the improved model. On the other hand, the Sophia optimizer is added on the basis of the modified ResNet50 to further improve the performance of the model.

3.3.1. Performance Comparison Between ResNet50 and Classical CNN Models

In this study, the performance of three classical convolutional neural networks in image classification tasks is compared, and ResNet-50, VGG-16 (a deep network based on stacked convolutional layers, extracting multiscale features through multi-layer receptive fields), and AlexNet (the first deep model of ReLU and Dropout, which laid the structural foundation of modern CNN) were selected as feature extraction networks. The experimental results are shown in Table 4 below.
As can be seen from Table 4, ResNet50 significantly outperforms VGG-16 and AlexNet in key metrics such as accuracy, precision, recall, and Kappa coefficient. Moreover, the number of parameters and computational amount is significantly lower than that of VGG16, so ResNet50 is selected as the benchmark model in this paper.

3.3.2. Performance Comparison of Enhanced ResNet50 with the Original Model

We replaced the residual structure of Resnet50 with external attention and multiscale convolution and replaced the optimizer. The reconstructed convolutional neural network is used to train the pre-trained dataset, and the experimental results of the validation set are displayed in Table 5. Experimental results show that compared with the original model, the improved model has significant improvement in all evaluation indexes, and the validation accuracy and Kappa are increased by 4.36% and 5.45%, respectively, and flops and parameters have not increased significantly. These improvements can be attributed to the following factors: 1. External Attention: By leveraging global spatial interaction and channel interaction, the external attention mechanism enhances the global awareness of the model, enabling the model to more accurately and comprehensively capture input data features. Additionally, its linear time complexity reduces computational overhead, making the approach more efficient. 2. Enhanced Residual Structure: Replacing the residual structure with multiscale convolution can improve the model’s ability to extract local and global features, allowing it to better learn fine-grained image details. This substitution also increases the nonlinearity of the network, enhancing its ability to fit complex patterns. In addition, the use of 1 × 1 convolution reduces the number of parameters. 3. Optimizer Replacement: The introduction of the Sophia optimizer accelerates model convergence, improves the optimization process, and stabilizes model training. This results in better parameter estimation and ultimately leads to significant improvements in all evaluation metrics.
In order to clearly demonstrate the experimental results of the enhanced ResNet50, the relationship between the accuracy and loss of the enhanced ResNet50 model and the number of rounds of the ResNet50 model and ResNet50 is drawn in Figure 8. In addition, the confusion matrix is presented to compare the performance differences between the original and improved models. The results of the confusion matrix are depicted in Figure 9.
It is seen from Figure 8 that the verification accuracy of the improved model consistently exceeds that of the original model, indicating that it has stronger capabilities in feature extraction and classification accuracy. At the same time, the validation loss is consistently lower than that of the original model, reflecting the superiority of the model in fitting the data. The results show that the local feature capture ability enhanced by multiscale convolution and the global perception ability brought by the external attention mechanism jointly improve the feature extraction and generalization ability of the model.
From the above confusion matrix, the classification performance of the improved ResNet50 model has been significantly improved in each category. Specifically, the values on the diagonal increase significantly, suggesting a rise in the number of samples that the model classifies correctly, while a decrease in the values elsewhere indicates a decrease in the number of samples misclassified. This indicates that the ResNet50 model with external attention mechanism and multiscale convolution has more advantages in processing complex features and global information and can more accurately identify and distinguish samples of different classes, thereby effectively enhancing the overall effect of the model.

3.3.3. Performance Comparison of Classical CNN Models with and Without Enhance Blocks

To demonstrate the effectiveness of the augmentation structure in different classical networks, three classical network models were selected: ResNet50, VGG16, and AlexNet. The enhance structure has been added to the top-level feature diagram, and the parameter configuration of the model is the same as in Section 3.2. The experimental results are shown in Table 6 below.
It can be seen from Table 6 above that the evaluation indexes of each classical model are improved to a certain level after adding the enhance structure, and the evaluation index of VGG16 is significantly improved after adding the enhance structure; however, the lack of a 1 × 1 convolution dimensionality reduction mechanism in the original architecture of the model and the embedding of the enhance structure further increasing the network complexity result in a significant increase in its parameter scale and computational overhead. Due to the relatively simple structure of AlexNet, the enhance structure has a relatively limited improvement in its performance, and the number of parameters and calculations has not increased significantly.

3.3.4. Comparison of Model Validation Accuracy Versus Speed

This chapter compares the performance of ResNet50 and its enhanced models in the training and validation phases, systematically evaluates the efficiency difference between the two, and focuses on the following four key indicators: (1) Per-Training Time (Abbreviated as PT-Time), (2) Total Training Time (Abbreviated as TT-Time), (3) Per-Validation Time (Abbreviated as PV-Time), (4) Total Validation Time (Abbreviated as TV-Time). The computer is configured with an NVIDIA GeForce RTX 4060. The experimental data are shown in Table 7 below.
According to the experimental results in Table 7, compared with the ResNet50 benchmark model, the validation accuracy of the enhanced ResNet50 is increased by 4.36% under the condition that the training efficiency is slightly reduced (the total training time is 146.97 min, an increase of 16.35%). The results show that the proposed enhancement module can extract data features more effectively while maintaining reasonable training efficiency so as to improve the validation accuracy without excessive loss of speed.

3.3.5. Comparison with Advanced Methods

To verify that our model is superior to existing models, we compared it to the current state-of-the-art methods, using the test set as the experimental object, and the results are shown in Table 8 below.
According to the experimental results in Table 8 above, the proposed method still maintains the classification accuracy comparable to the existing advanced methods when the scale of the training data is significantly larger than that of the comparison method. It is worth noting that the number of model parameters in this study is significantly lower than that of mainstream methods. Moreover, the dataset in this paper is carried out under a balanced dataset, which effectively avoids the model bias caused by the imbalance of the dataset; that is, the model tends to learn the features of most classes.

3.3.6. Ablation Experiments

In this section, we perform a series of additional experiments to verify the effectiveness of the replacement of the improved ResNet50 module and optimizer. Figure 10 shows the validation accuracy and number of iterations for each module, while Figure 11 shows the results of the ablation experiment and its histogram. In addition, Table 9 details the evaluation results for each module validation set. From the data in the table, it can be seen that the model accuracy (Acc) is improved by 3.32%, 2.07%, and 1.61% after introducing an external attention mechanism to the residual structure, adding multiscale convolution to the residual branch shortcut, and replacing the original optimizer with the Sophia optimizer, respectively. These results fully show that the proposed improvement measures significantly improve the performance of the model. Specifically, the external attention mechanism introduces global information into the model to make its feature representation more robust, thereby improving the generalization ability. Multiscale convolution enhances the capture of local features, allowing the model to process image details more finely. The Sophia optimizer not only improves training efficiency and reduces resource consumption but also accelerates model convergence. These improvements not only achieve excellent performance on the verification set but also significantly improve the reliability and practicability of the model in practical applications.

3.3.7. Test on Additional Dataset

To rigorously assess the generalization ability of the proposed model, we carried out supplementary experiments on the Messidor dataset. The dataset contains 1200 fundus images, divided into four grades (0, 1, 2, 3) by clinical severity. In this study, the sample size was expanded to 14,400 images using the same image preprocessing and image augmentation methods as before. All samples are partitioned into a training set, a validation set, and a test set in the ratio of 7:2:1 to guarantee a balanced distribution of each category, adjusting the final fully connected layer to output four classes. Then, the network needs to be retrained because a different number of classes (from 5 to 4) results in a different distribution of outputs. The model parameter settings are the same as in Section 3.2. The evaluation indicators of the test before and after model enhancement are shown in Table 10, and the results of the confusion matrix are shown in Figure 12 below.

3.3.8. Visual Analytics

To validate the interpretability of the model and gain a better understanding of the impact of using the ResNet50 model before and after enhancement, Grad-CAM is employed to visualize the results. This is shown in Figure 13. The first column shows the pre-treated lesion image, the second column shows the Grad-CAM corresponding to the pre-treated lesion image, and the third column shows the Grad-CAM of the lesion image after model enhancement.
In Grad-CAM-based visualization analysis, the heat map uses three colors—blue, yellow, and red—to characterize the model’s attention to different regions of the input image. Specifically, the red area indicates the parts that the model is highly concerned about and have made significant contributions to decision-making. The yellow area has the second highest degree of attention, which has a certain auxiliary effect on decision-making. The blue area has a smaller contribution and is often considered redundant information. By comparing the Grad-CAM heat maps shown in Figure 13b,c, we observe that the enhanced model, Figure 13c, demonstrates significantly broader and more detailed attention to the lesion areas. Specifically, the area that originally belonged to blue (low concern) was transformed into a yellow or even red (high concern) region in the enhanced model, and the original yellow lesion area was further transformed into a red lesion area, indicating that the attention of the model to this region was significantly improved. This change shows that the enhanced ResNet50 model can more effectively identify and focus on the lesion area, thereby improving the detection accuracy of DR.

4. Summary

In this work, the verification accuracy of the model is significantly improved by introducing an external attention mechanism, multiscale convolution, and the Sophia optimizer into the ResNet50 model. The external attention mechanism enhances the model’s perception of global information, the multiscale convolution of shortcut branches reduces the potential redundancy in the network and improves the capture accuracy of local features, and the Sophia optimizer improves the training efficiency and the accuracy of the model. However, while these improvements have resulted in significant performance gains, there are still some shortcomings. For example, the training time of a model may be extended due to increased complexity, and further tuning may be required on certain datasets to achieve optimal performance. Subsequent research efforts will be concentrated on further refining the model architecture, curtailing the training duration, and investigating additional optimization approaches with the aim of improving the model’s generalization capacity and practicality across a broader spectrum of application scenarios.

Author Contributions

Conceptualization, M.F. and S.Y.; Methodology, M.F., Y.C. and S.Y.; Software, M.F. and Y.C.; Validation, M.F., Y.C. and S.Y.; Formal analysis, S.Y.; Investigation, M.F., Y.C. and S.Y.; Resources, S.Y.; Writing—original draft, M.F. and Y.C.; Writing—review & editing, S.Y.; Supervision, S.Y.; Funding acquisition, S.Y. All authors have read and agreed to the published version of the manuscript.

Funding

This research was funded by National Natural Science Foundation of China, grant number 62103193.

Data Availability Statement

The original contributions presented in this study are included in the article. Further inquiries can be directed to the corresponding author.

Conflicts of Interest

The authors declare no conflicts of interest.

References

  1. Kharroubi, A.T.; Darwish, H.M. Diabetes mellitus: The epidemic of the century. World J. Diabetes 2015, 6, 850. [Google Scholar] [CrossRef] [PubMed]
  2. Yan, S.; Ding, L.; Cai, Y. Proportional-integral observer-based H fuzzy controller design of nonlinear time-varying delayed glucose-insulin system with input saturation. Nonlinear Dyn. 2025, 1–13. [Google Scholar] [CrossRef]
  3. Yan, S.; Chu, L.; Cai, Y. Robust H control of T–S fuzzy blood glucose regulation system via adaptive event-triggered scheme. Biomed. Signal Process. Control 2023, 83, 104643. [Google Scholar] [CrossRef]
  4. Engelgau, M.M.; Geiss, L.S.; Saaddine, J.B.; Boyle, J.P.; Benjamin, S.M.; Gregg, E.W.; Tierney, E.F.; Rios-Burrows, N.; Mokdad, A.H.; Ford, E.S.; et al. The evolving diabetes burden in the united states. Ann. Intern. Med. 2004, 140, 945–950. [Google Scholar] [CrossRef]
  5. Wahab Sait, A.R. A lightweight diabetic retinopathy detection model using a deep-learning technique. Diagnostics 2023, 13, 3120. [Google Scholar] [CrossRef]
  6. Wilkinson, C.P.; Ferris, F.L., III; Klein, R.E.; Lee, P.P.; Agardh, C.D.; David, M.; Dills, D.; Kampik, A.; Pararajasegaram, R.; Verdaguer, J.T. Proposed international clinical diabetic retinopathy and diabetic macular edema disease severity scales. Ophthalmology 2003, 110, 1677–1682. [Google Scholar] [CrossRef]
  7. Antal, B.; Hajdu, A. An ensemble-based system for microaneurysm detection and diabetic retinopathy grading. IEEE Trans. Biomed. Eng. 2012, 59, 1720–1726. [Google Scholar] [CrossRef] [PubMed]
  8. Pinedo-Diaz, G.; Ortega-Cisneros, S.; Moya-Sanchez, E.U.; Rivera, J.; Mejia-Alvarez, P.; Rodriguez-Navarrete, F.J.; Sanchez, A. Suitability classification of retinal fundus images for diabetic retinopathy using deep learning. Electronics 2022, 11, 2564. [Google Scholar] [CrossRef]
  9. Ashwini, K.; Dash, R. Grading diabetic retinopathy using multiresolution based CNN. Biomed. Signal Process. Control. 2023, 86, 105210. [Google Scholar] [CrossRef]
  10. Al-Omaisi, A.; Zhu, C.-Z.; Althubiti, S.A.; Al-Alimi, D.; Xiao, Y.-L.; Ouyang, P.-B.; Al-Qaness, M.A.A. Detection of diabetic retinopathy in retinal fundus images using CNN classification models. Electronics 2022, 11, 2740. [Google Scholar] [CrossRef]
  11. Yan, S.; Gu, Z.; Park, J.H.; Xie, X.; Sun, W. Distributed cooperative voltage control of networked islanded microgrid via proportional-integral observer. IEEE Trans. Smart Grid 2024, 15, 5981–5991. [Google Scholar] [CrossRef]
  12. Wang, J.; Bai, Y.; Xia, B. Simultaneous diagnosis of severity and features of diabetic retinopathy in fundus photography using deep learning. IEEE J. Biomed. Health Inform. 2020, 24, 3397–3407. [Google Scholar] [CrossRef] [PubMed]
  13. Zang, P.; Gao, L.; Hormel, T.T.; Wang, J.; You, Q.; Hwang, T.S.; Jia, Y. DcardNet: Diabetic retinopathy classification at multiple levels based on structural and angiographic optical coherence tomography. IEEE Trans. Biomed. Eng. 2020, 68, 1859–1870. [Google Scholar] [CrossRef]
  14. Sunkari, S.; Sangam, A.; Suchetha, M.; Raman, R.; Rajalakshmi, R.; Tamilselvi, S. A refined ResNet18 architecture with Swish activation function for Diabetic Retinopathy classification. Biomed. Signal Process. Control. 2024, 88, 105630. [Google Scholar] [CrossRef]
  15. Kao, Y.-H.; Lin, C.-L. Enhancing Diabetic Retinopathy Detection Using Pixel Color Amplification and EfficientNetV2: A Novel Approach for Early Disease Identification. Electronics 2024, 13, 2070. [Google Scholar] [CrossRef]
  16. Jiang, H.; Hou, Y.; Miao, H.; Ye, H.; Gao, M.; Li, X.; Jin, R.; Liu, J. Eye tracking based deep learning analysis for the early detection of diabetic retinopathy: A pilot study. Biomed. Signal Process. Control. 2023, 84, 104830. [Google Scholar] [CrossRef]
  17. Fu, J.; Zheng, H.; Mei, T. Look closer to see better: Recurrent attention convolutional neural network for fine-grained image recognition. In Proceedings of the IEEE Conference on Computer Vision and Pattern Recognition, Honolulu, HI, USA, 21–26 July 2017; pp. 4438–4446. [Google Scholar]
  18. Han, K.; Wang, Y.; Tian, Q.; Guo, J.; Xu, C.; Xu, C. Ghostnet: More features from cheap operations. In Proceedings of the IEEE/CVF Conference on Computer Vision and Pattern Recognition, Seattle, WA, USA, 13–19 June 2020; pp. 1580–1589. [Google Scholar]
  19. Wang, Q.; Wu, B.; Zhu, P.; Li, P.; Zuo, W.; Hu, Q. ECA-Net: Efficient channel attention for deep convolutional neural networks. In Proceedings of the IEEE/CVF Conference on Computer Vision and Pattern Recognition, Seattle, WA, USA, 13–19 June 2020; pp. 11534–11542. [Google Scholar]
  20. Vaswani, A.; Shazeer, N.; Parmar, N.; Uszkoreit, J.; Jones, L.; Gomez, A.N.; Kaiser, Ł.; Polosukhin, I. Attention is all you need. In Proceedings of the 31st International Conference on Neural Information Processing Systems (NeurIPS 2017), Long Beach, CA, USA, 4–9 December 2017; pp. 5998–6008. [Google Scholar]
  21. He, A.; Li, T.; Li, N.; Wang, K.; Fu, H. CABNet: Category attention block for imbalanced diabetic retinopathy grading. IEEE Trans. Med. Imaging 2020, 40, 143–153. [Google Scholar] [CrossRef]
  22. Alahmadi, M.D. Texture attention network for diabetic retinopathy classification. IEEE Access 2022, 10, 55522–55532. [Google Scholar] [CrossRef]
  23. Luo, X.; Pu, Z.; Xu, Y.; Wong, W.K.; Su, J.; Dou, X.; Ye, B.; Hu, J.; Mou, L. MVDRNet: Multi-view diabetic retinopathy detection by combining DCNNs and attention mechanisms. Pattern Recognit. 2021, 120, 108104. [Google Scholar] [CrossRef]
  24. Liu, S.; Wang, W.; Deng, L.; Xu, H. CNN-Trans model: A parallel dual-branch network for fundus image classification. Biomed. Signal Process. Control. 2024, 96, 106621. [Google Scholar] [CrossRef]
  25. Zhang, W.; Zhong, J.; Yang, S.; Gao, Z.; Hu, J.; Chen, Y.; Yi, Z. Automated identification and grading system of diabetic retinopathy using deep neural networks. Knowl. Based Syst. 2019, 175, 12–25. [Google Scholar] [CrossRef]
  26. He, K.; Zhang, X.; Ren, S.; Sun, J. Deep residual learning for image recognition. In Proceedings of the IEEE Conference on Computer Vision and Pattern Recognition, Las Vegas, NV, USA, 27–30 June 2016; pp. 770–778. [Google Scholar]
  27. Kommaraju, R.; Anbarasi, M.S. Diabetic retinopathy detection using convolutional neural network with residual blocks. Biomed. Signal Process. Control. 2024, 87, 105494. [Google Scholar] [CrossRef]
  28. Paradisa, R.H.; Bustamam, A.; Mangunwardoyo, W.; Victor, A.A.; Yudantha, A.R.; Anki, P. Deep feature vectors concatenation for eye disease detection using fundus image. Electronics 2021, 11, 23. [Google Scholar] [CrossRef]
  29. Zhang, W.; Zhao, X.; Chen, Y.; Zhong, J.; Yi, Z. DeepUWF: An automated ultra-wide-field fundus screening system via deep learning. IEEE J. Biomed. Health Inform. 2020, 25, 2988–2996. [Google Scholar] [CrossRef]
  30. Hayati, M.; Muchtar, K.; Maulina, N.; Syamsuddin, I.; Elwirehardja, G.N.; Pardamean, B. Impact of clahe-based image enhancement for diabetic retinopathy classification through deep learning. Procedia Comput. Sci. 2023, 216, 57–66. [Google Scholar] [CrossRef]
  31. Moya-Albor, E.; Lopez-Figueroa, A.; Jacome-Herrera, S.; Renza, D.; Brieva, J. Computer-Aided Diagnosis of Diabetic Retinopathy Lesions Based on Knowledge Distillation in Fundus Images. Mathematics 2024, 12, 2543. [Google Scholar] [CrossRef]
  32. Abbasi, S.; Hajabdollahi, M.; Khadivi, P.; Karimi, N.; Roshandel, R.; Shirani, S.; Samavi, S. Classification of diabetic retinopathy using unlabeled data and knowledge distillation. Artif. Intell. Med. 2021, 121, 102176. [Google Scholar] [CrossRef]
Figure 1. There are five types of DR: (a) DR0. (b) DR1, microaneurysm: a common phenomenon of early lesion DR, which is manifested as a dark red dot in the figure. (c) DR2, hemorrhage: the image is mostly a red lesion. (d) DR3, hard exudate: most of the bright yellow spots in the image are formed by lipid deposits caused by vascular leakage. (e) DR4, soft exudate: most of the spots in the picture are yellow/white spots.
Mathematics 13 01557 g001
Figure 2. Systematic flow diagram of the DR classification system.
Mathematics 13 01557 g002
Figure 3. Image preprocessing: (a) cropped image, (b) grayscale image, (c) gamma-corrected image, (d) CLAHE equalized image, (e) Laplace sharpened filtered image.
Mathematics 13 01557 g003
Figure 4. Image enrichment. (a) Original image. (b) Randomflipped. (c) Cutout. (d) Mixup.
Mathematics 13 01557 g004
Figure 5. ResNet50 model structure: 7 × 7 indicates the convolution kernel size, and /2 indicates that the stride size is 2.
Mathematics 13 01557 g005
Figure 6. Residual structures. (a) Normal residual structures. (b) Bottleneck residual structures.
Mathematics 13 01557 g006
Figure 7. Improved residual structure.
Mathematics 13 01557 g007
Figure 8. Model training process. (a) Verification accuracy and round number charts for ResNet50 and Enhance-ResNet50. (b) Verification loss vs. rounds plot for ResNet50 and Enhance-ResNet50.
Mathematics 13 01557 g008
Figure 9. Confusion Matrix. (a) Resnet50 confusion matrix on the validation set. (b) E-Resnet50 Confusion Matrix on the validation set.
Mathematics 13 01557 g009
Figure 10. The accuracy and number of rounds of ablation experiments. ResNet50+multiscale convolution means that only multiscale convolution is added to the ReNet50 base model, ResNet50+Sophia optimizer means that only optimizers are added to the ReNet50 base model, and ResNet50+external attention means that only external attention is added to the ReNet50 base model.
Mathematics 13 01557 g010
Figure 11. Ablation test results with bar chart.
Mathematics 13 01557 g011
Figure 12. Confusion Matrix. (a) Resnet50 confusion matrix on the test set. (b) Enhanced Resnet50 confusion matrix on the test set.
Mathematics 13 01557 g012
Figure 13. Grad-Cam visualization results plot. (a) DR4 pre-process images. (b) ResNet50 Grad-Cam image. (c) Enhanced ResNet50 Grad-Cam image.
Mathematics 13 01557 g013
Table 1. Raw DR dataset.
CategoryQuantity
DR01805
DR1370
DR2999
DR3193
DR4295
Table 2. DR dataset after image enrichement.
CategoryTraining SetValidation SetTest SetTotal
DR028657674034035
DR128477884034038
DR228268074034036
DR328068274034036
DR427888484034039
Table 3. Confusion matrix.
CategoryPredict Positive ClassesPredict Negative Classes
True-positive classTPFN
True-negative classFPTN
Table 4. Performance comparsion of ResNet50 with other classic networks.
ModelAcc (%)Pre (%)Rec (%)Spe (%)Kappa (%)Flops (G)Parameters (M)
Resnet5092.3292.4192.4198.0890.40132.2123.53
VGG1689.9490.0090.0297.4887.42494.92134.30
AlexNet86.8786.9386.9496.7283.589.8914.60
Table 5. Enhanced Resnet50 (abbreviated as E-ResNet50 in the table) with the results of the original model.
ModelAcc (%)Pre (%)Rec (%)Spe (%)Kappa (%)Flops (G)Parameters (M)
Resnet5092.3292.4192.4198.0890.40132.2123.53
E-Resnet5096.6896.7296.7199.1795.85182.3550.51
Table 6. Experimental results of Resnet50, Vgg16, Alexnet and their enhanced models under the validation set.
ModelAcc (%)Pre (%)Rec (%)Spe (%)Kappa (%)Flops (G)Parameters (M)
Resnet5092.3292.4192.4198.0890.40132.2123.53
E-Resnet5096.6896.7296.7199.1795.85182.3550.51
VGG1689.9490.0090.0297.4887.42494.92134.30
E-VGG1693.6893.7793.7598.4292.10976.04350.14
AlexNet86.8786.9386.9496.7283.589.8914.60
E-AlexNet88.3188.3988.3997.0785.3850.0532.59
Table 7. Comparison between enhanced Resnet (abbreviated as E-ResNet50 in the table) and Resnet for accuracy and speed.
ModelAcc (%)PT-Time (min)TT-Time (min)PV-Time (min)TV-Time (min)
Resnet5092.321.23122.940.3332.95
E-Resnet5096.681.47146.970.3939.43
Table 8. Comparison of the proposed method with the advanced method on the test set.
ModelAcc (%)DatasetTime (m)Loss FunctionFlops (G)Parameters (M)
Resnet5092.16Kaggle/2K43.96Cross-entropy loss132.2123.53
E-Resnet5096.52Kaggle/2K52.53Cross-entropy loss182.3550.51
[31]97.30JSIEC1K/1K45.24KL + CCE 71.38
[32]82.32Messidor/1.2K307.2KL
Table 9. Ablation study of enhanced ResNet50 under the validation set.
ModelAcc (%)Pre (%)Rec (%)Spe (%)Kappa (%)
ResNet5092.3292.4192.4198.0890.40
ResNet50 + external attention95.6495.1295.2298.9194.08
ResNet50 + multiscale convolution94.3993.7893.7698.5992.36
ResNet50 + Sophia optimizer93.9393.4193.3298.4591.83
Table 10. Tests of the evaluation indicators of the dataset under additional datasets.
ModelAcc (%)Pre (%)Rec (%)Spe (%)Kappa (%)
Resnet5090.6290.7190.6296.8887.49
E-Resnet5094.5894.6494.5898.1992.77
Disclaimer/Publisher’s Note: The statements, opinions and data contained in all publications are solely those of the individual author(s) and contributor(s) and not of MDPI and/or the editor(s). MDPI and/or the editor(s) disclaim responsibility for any injury to people or property resulting from any ideas, methods, instructions or products referred to in the content.

