1. Introduction
The stability of deep-buried rectangular chambers has always been a hot issue in the geotechnical field. In recent years, the stability of deep chambers has been paid more and more attention by scholars and engineers with the rapid development of underground transportation and mineral exploitation. A series of achievements have been made in the study of the stability of deep-buried chambers [
1,
2,
3,
4]. At present, the main methods to study the stability of underground chamber are the limit equilibrium method, the numerical simulation method, the model test method, and the limit analysis method. Different criteria of instability will lead to different results, and the differences are large. In addition, the complexity of geotechnical materials, the selection of boundary conditions, the division of mesh shape, and the determination of initial conditions will affect the accuracy of calculation results. In the model test, because of the acceleration of the centrifuge, the start-up and braking will affect the experimental results. In the process of the simulation test, it is difficult to accurately simulate the real situation of the model, including model boundary, constraints, construction process, support form of support components, and support parameters. The stress of deep-buried chambers is complex, and the process of elastic–plastic analysis of a chamber step by step is rather tedious. Unlike the limit equilibrium method, the limit analysis theory does not need to consider the stress–strain state and complex load conditions in the process of chamber deformation, and it can solve the ultimate load of chamber failure from the point of view of energy. Thus, a more accurate solution can be obtained than from these methods.
At present, in the stability analysis of underground chambers, the solution of surrounding rock pressure based on limit analysis is widely accepted and used by academia [
5,
6,
7]. Yang et al. [
8] established a two-layer model of collapse block shape of a rectangular tunnel. The upper bound solution of the surrounding rock pressure was obtained and the continuous failure mechanism of the deep cavity roof collapse was deduced by using the upper bound solution. Huang et al. [
9] used limit analysis theory to analyze the three-dimensional stability of a circular tunnel working face in a heterogeneous anisotropic undrained clay. The critical collapse support pressure and stability ratio of the tunnel were obtained. Zhao et al. [
10] used the upper bound theorem to analyze the stability of irregular underground caverns. The influence of geological parameters of the irregular chamber on the mechanism of chamber collapse was given. Guan et al. [
11] deduced the analytical expression of three-dimensional failure mode of an underground chamber by upper limit theorem.
The numerical solution of the collapse block shape of a circular tunnel was derived by Huang et al. [
12] based on the Hoek–Brown failure criterion and the upper bound theorem. According to the upper bound theorem and variational method, Qin et al. [
13] constructed the progressive failure mechanism of the roof of a deep-buried tunnel. The analytical solution of the roof collapse pattern and the collapse area was derived, and the calculation results were verified. Fraldi and Guarracino [
14] proposed and discussed the comprehensive analytical solution of a tunnel collapse mechanism with an arbitrary excavation section in a rock mass under the Hoek–Brown criterion. Perazzelli and Anagostou [
15] used the upper bound theorem of limit analysis to analyze the shape of the failure surface of a gas storage tunnel when arch failure occurs. The influences of geometric parameters and geotechnical parameters on arching pressure were studied. Huang et al. [
16] used the Hoek–Brown failure criterion and the upper bound theorem of limit analysis to study the shape of a collapse block of a square tunnel under pore water pressure. The analytical solution of the collapse block shedding curve was derived. Liu et al. [
17] studied the stability of a deep-buried tunnel working face using the upper bound analysis method. By considering the seepage force on the tunnel face and soil particles, the upper bound solution of supporting pressure required for the stability of a layered seepage soil surface was obtained. A three-dimensional rotation–translation mechanism that simultaneously considers the longitudinal inclination of the tunnel and partial failure of the tunnel face based on the upper bound limit analysis method was presented [
18]. Zhang et al. [
19] proposed an improved failure mechanism for deep-buried caverns, and studied the supporting pressure of deep-buried caverns. The calculated results of the improved failure mechanism are in good agreement with the existing methods, numerical solutions, and field monitoring results.
This study systematically establishes the failure mechanism of rectangular deep-buried chambers and derives an upper bound analytical solution for the surrounding rock pressure based on limit analysis theory. Through in-depth exploration, the influence of various parameters, including geometric characteristics, material properties, and stress conditions, on the surrounding rock pressure and the chamber’s failure mode are thoroughly analyzed. The results not only enhance the theoretical understanding of the mechanical behavior of deep-buried structures but also provide a robust framework for optimizing their design and stability evaluation. These findings are expected to serve as a foundational reference for engineering applications, promoting safer and more efficient construction practices in underground spaces.
2. Upper Bound Theorem of Limit Analysis
The principle of limit analysis includes two parts: the upper bound theorem and the lower bound theorem. This theory is a relatively effective method for solving stability problems in geotechnical engineering. Since its inception in the 1920s, this theory has been developing slowly and has mostly focused on the study of one-dimensional structural problems. Until the 1950s, the upper and lower limit theorems of limit analysis theory were confirmed, and the associated flow rule was proposed by Drucker. The application of limit analysis developed rapidly and was promoted in solving plane and space problems. After decades of development, this theory has been rapidly developed and widely applied in the analysis of foundation bearing capacity, slope, retaining wall, and tunnel stability in geotechnical engineering. Compared with traditional stability calculation theories in geotechnical engineering, such as the limit equilibrium method, the slip line method, and the finite element method, the limit analysis method has its unique features, because no matter how complex the geometric shape and load situation of the structure are, the limit analysis method can always obtain a practical failure load value and provide a clear physical graph of the failure mechanism.
According to the principle of virtual power, the upper limit theorem of limit analysis needs to satisfy the velocity boundary condition and the compatibility condition between strain and velocity. In the velocity field of motion permission, the load obtained based on the condition of equal internal and external power is greater than or equal to the actual ultimate failure load. In the upper limit theorem of limit analysis, it is not necessary to study whether the object satisfies the stress equilibrium condition, but only to calculate the external force power and calculate the internal energy dissipation rate according to the flow law, and the resulting load is one upper limit solution under this condition.
For arbitrary maneuvering admissible velocity field, the upper bound solution of failure load can be obtained according to the internal energy loss rate not less than the external force power. The expression is as follows [
20]:
In the above formula, Ti is the surface force acting on the surface area s of the damaged body. Fi is the physical force acting on the volume V of the damaged body. σij is the stress field associated with Fi and Ti. vi is the velocity field allowed by maneuver. is the strain rate field compatible with vi.
3. Construction of Failure Mode
Based on the kinematical approach of limit analysis, an improved failure mechanism is proposed, and the supporting pressure is investigated for a deep-buried cavity. Reference [
19] proposed a cavity failure mode of “a wedge block + a rotational arc block +
n translational triangular blocks”. However, the destructive mode is too complex and not conducive to specific applications. In this paper, the failure mode constructed in reference [
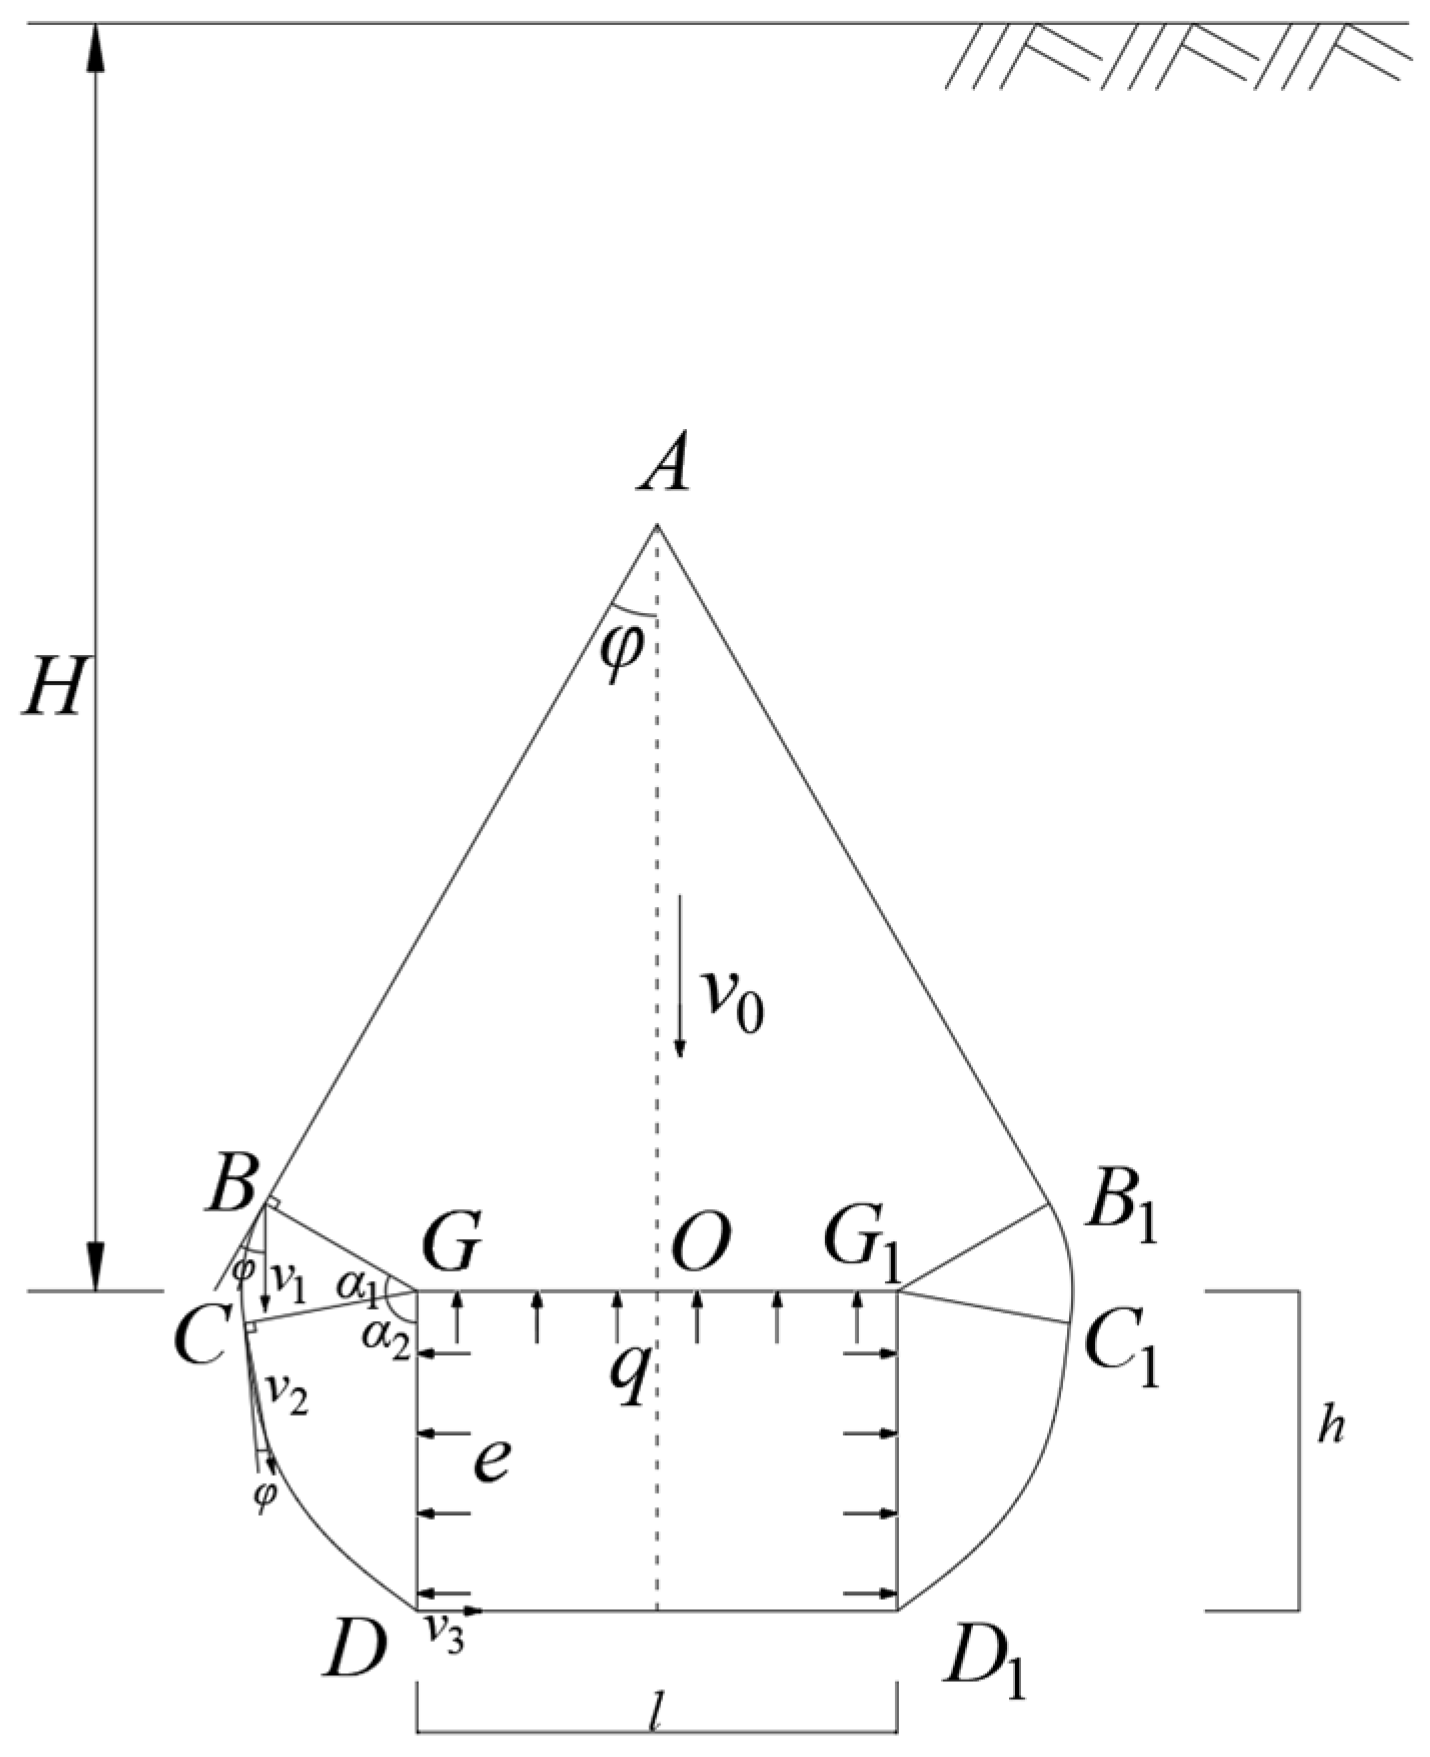
19] is improved. The failure mode of “downward sliding wedge-shaped collapse body + rotating arc body with apex angle as the center + logarithmic helix body with apex angle as the center” is constructed, as shown in
Figure 1. The wedge-shaped block
ABGG1B1 of the roof slides vertically downward at velocity
v0. The rotational block
BGC and
B1G1C1 with
G and
G1 points as the center of the circle, respectively, have rotational failure. The logarithmic spiral region
GCD and
G1C1D1 have rotational failure with
G and
G1 as vertices, respectively. The surrounding rock pressures produced by the top and side walls of the chamber are
q and
e, respectively, and
q =
Ke.
K is the lateral pressure coefficient.
According to the geometric relationship and permissible velocity field for maneuvering, it can be seen that
According to the analysis of the velocity field in the arc radiation shear zone, it can be concluded that:
According to the analysis of the velocity field of the logarithmic spiral radiation shear zone, it can be concluded that
According to the recursive relationship of the length of the line breaks between different speeds, it can be concluded that
In the subsequent analysis, Equations (2)–(8) are very important foundations. Many formulas are derived from this equation.
4. Calculation Process
The analysis here operates under these assumptions: (1) No additional tunnels are near the research subject. (2) The surrounding rock mass is homogeneous. (3) The roadway’s cross-sectional shape is rectangle. Because the failure mode is symmetrical along AO, the solution of surrounding rock pressure can be obtained by calculating only the power of the left half of the failure mode:
4.1. Calculation of External Power
External power includes rock weight power and supporting reaction power.
The total gravity power of the rock body is the sum of three parts: quadrilateral
ABGO, sector
GBC, and logarithmic spiral
GCD. The gravity power of each region can be obtained by multiplying the density, area, and velocity. The external power expression is as follows:
The formula for calculating the area of each rigid block is as follows:
After calculating the area of each region, the gravity power can be calculated separately according to Equation (9).
The gravity power of the quadrilateral
ABGO can be calculated by the following formula:
For the sake of simplicity of the equation,
is used to represent complex formulas. The expression of
is as follows:
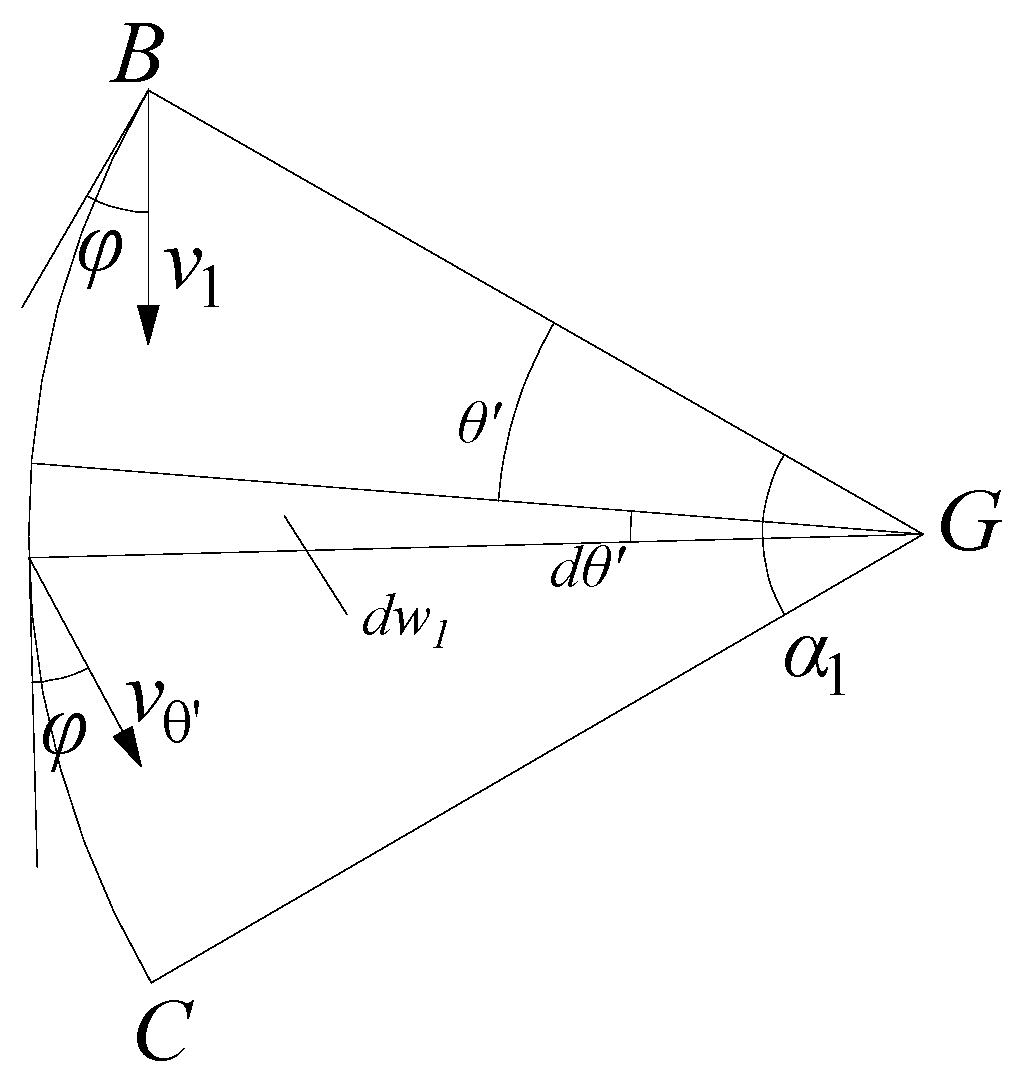
In sector region
GBC, according to
Figure 2, the expression of gravity power of rock mass can be obtained as follows:
For the sake of simplicity of the equation,
is used to represent complex formulas. The expression of
is as follows:
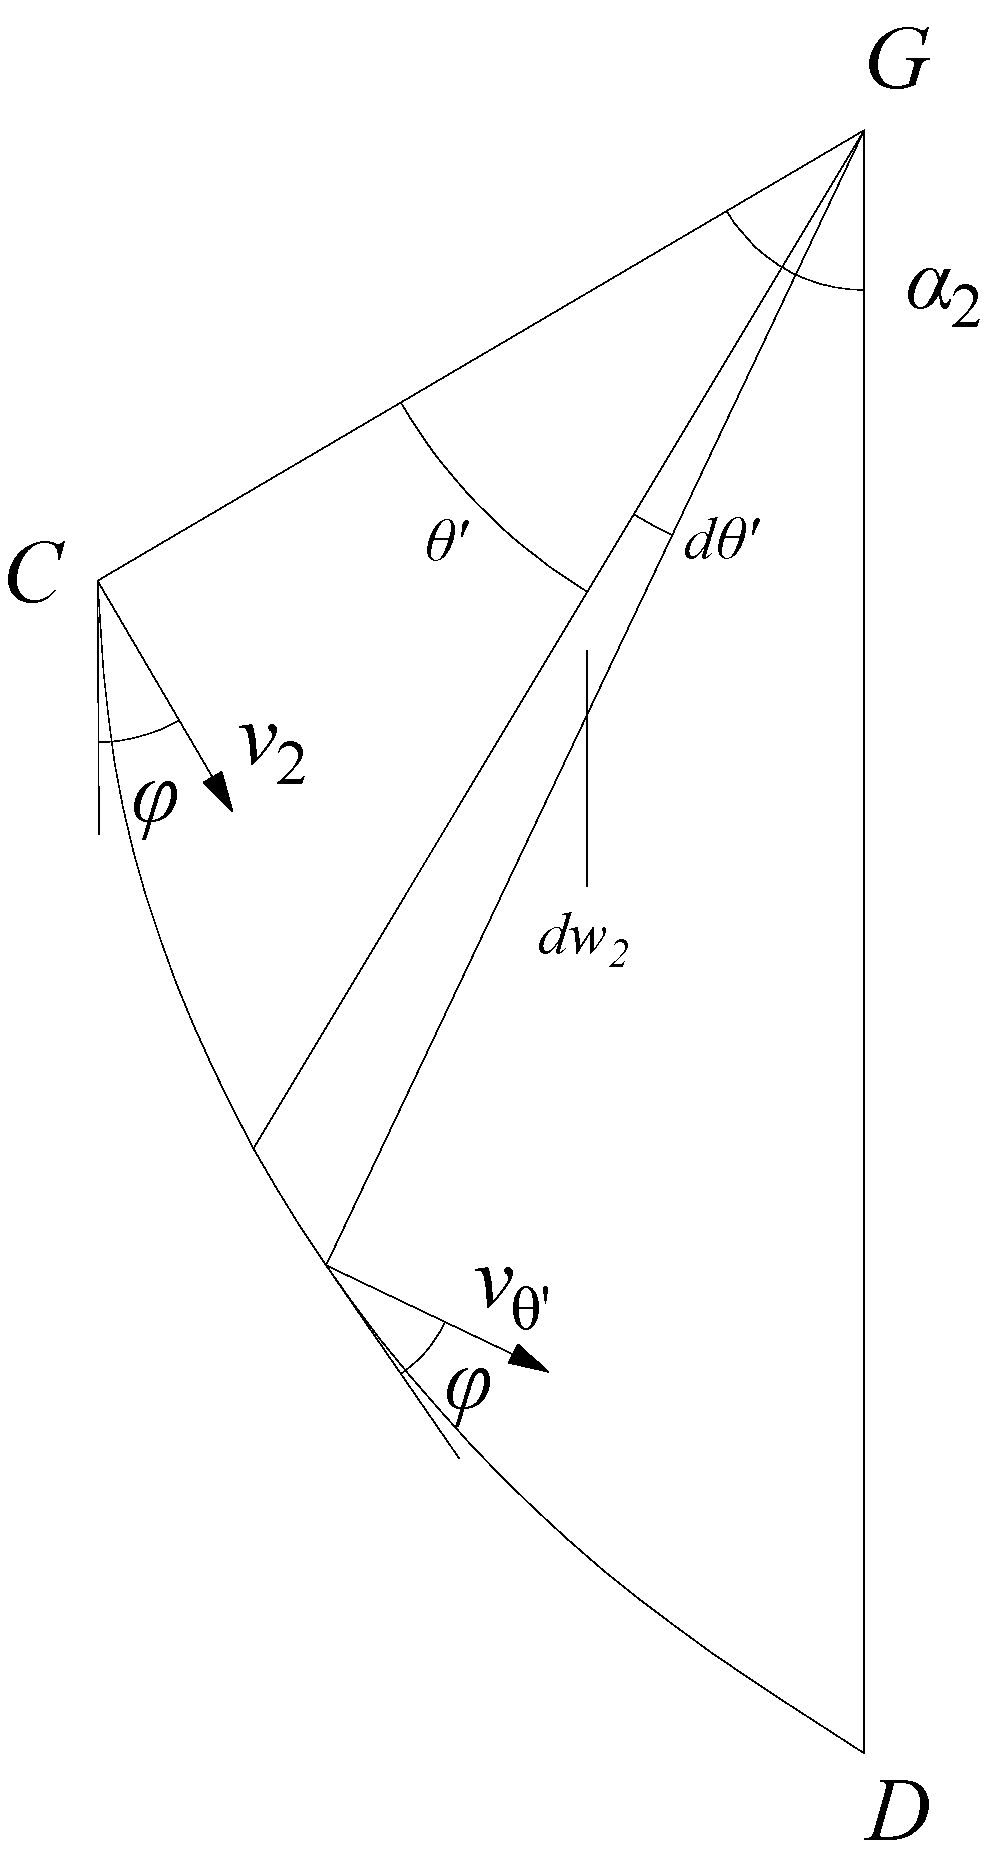
In the logarithmic helix region
GCD, according to
Figure 3, the expression of gravity power of rock mass can be obtained as follows:
where the expression of
is as follows:
Support reaction power can be calculated by the following formula:
The expression of
is as follows:
The total external power of the left half failure mode is the algebraic sum of the rock weight power and the support reaction power.
4.2. Internal Energy Dissipation
Internal energy dissipation occurs on the velocity discontinuity line, the velocity discontinuity section, the circular arc shear zone, and the logarithmic spiral shear zone.
The expression of energy dissipation along the AB discontinuity line is as follows:
where the expression of
is as follows:
The energy dissipation of the arc shear plane
BC and the arc shear zone
GBC are
The expressions of
and
are
The expression of energy dissipation along the discontinuity line
CD is the same as that in the whole logarithmic helical shear zone
GCD.
The total internal energy dissipation in the left half of the failure mode is as follows:
4.3. Solution of Surrounding Rock Pressure
According to the virtual power principle, there are
The expression of surrounding rock pressure can be obtained as follows:
4.4. Confirmation of Constraints
In order to obtain the maximum pressure of the surrounding rock, it is necessary to optimize it under certain constraints. The physical parameters in the formula should conform to the characteristics of rock and rock materials, and the geometric parameters should have practical geometric significance. In summary, the following constraints can be determined:
Combined with the upper bound theorem, the sequential quadratic programming algorithm is used to solve the optimal solution of q by programming with Matlab 2020a.
5. Contrast Validation
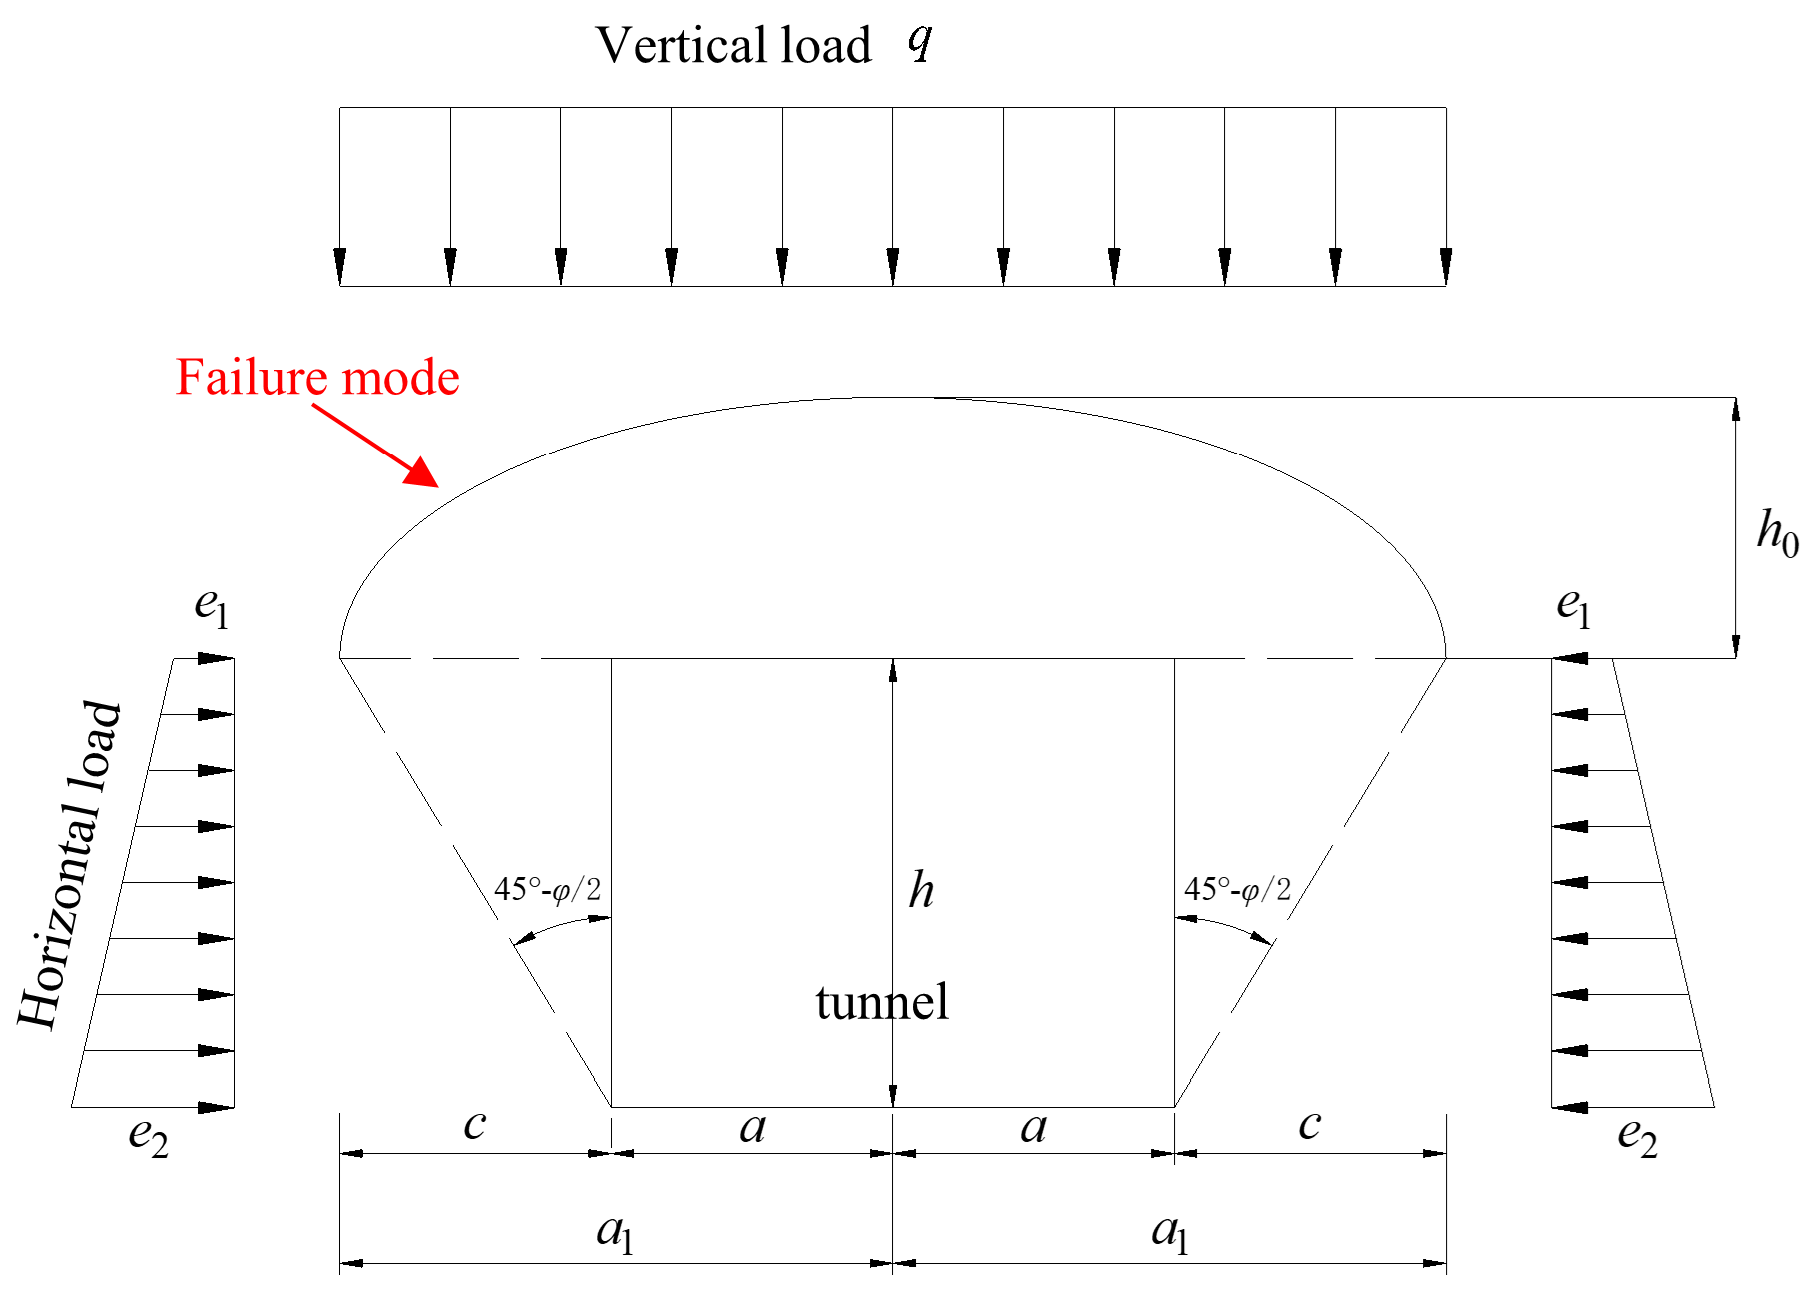
The Protodyakonov falling arch theory is a formula for calculating the loosening pressure of loose strata and fractured rock mass, proposed by Russian scholar Прoтoдъякoнoв in 1907. The Protodyakonov falling arch model is shown in
Figure 4. The formula for calculating the surrounding rock pressure is as follows:
In the formula, h0 is the height of collapse arch, γ is the weight of rock mass, a is half of the width of tunnel, and f is the Protodyakonov coefficient.
Based on a large number of tunnel test results, Atkinson et al. [
21] gave the failure mode of a tunnel as shown in
Figure 5. In this failure mode, the wedge
ABC slides downward at velocity
v0. According to the limit analysis theory, the expression of the surrounding rock pressure
q under the failure mode is as follows:
In the formula, R is the radius of the circular tunnel, is the weight of the rock mass, c is cohesion, and is the internal friction angle.
5.1. Numerical Simulation
In order to verify the scientificity of the failure mode of the deep chamber in this paper, the numerical simulation software FLAC3D 5.0 is used to verify the calculation. The calculated parameters are as follows: chamber height
h = 4 m, width
l = 6 m,
c = 10 kPa,
φ = 30°, and lateral pressure coefficient
K = 1.0. The model has a width of 100 m in the horizontal direction and a thickness of 350 m in the vertical direction. The thickness in the axial direction of the vertical chamber is 10 m. The chamber is located at the center of the horizontal direction. The top is 300 m away from the upper boundary. The model is used to simulate the deformation of a 300 m deep chamber. Displacement constraints are applied to the front, back, left, right, and bottom of the model. The upper part is a free surface without constraints. Only the effect of gravity is considered in the calculation process. The parameters in the numerical simulation are shown in
Table 1.
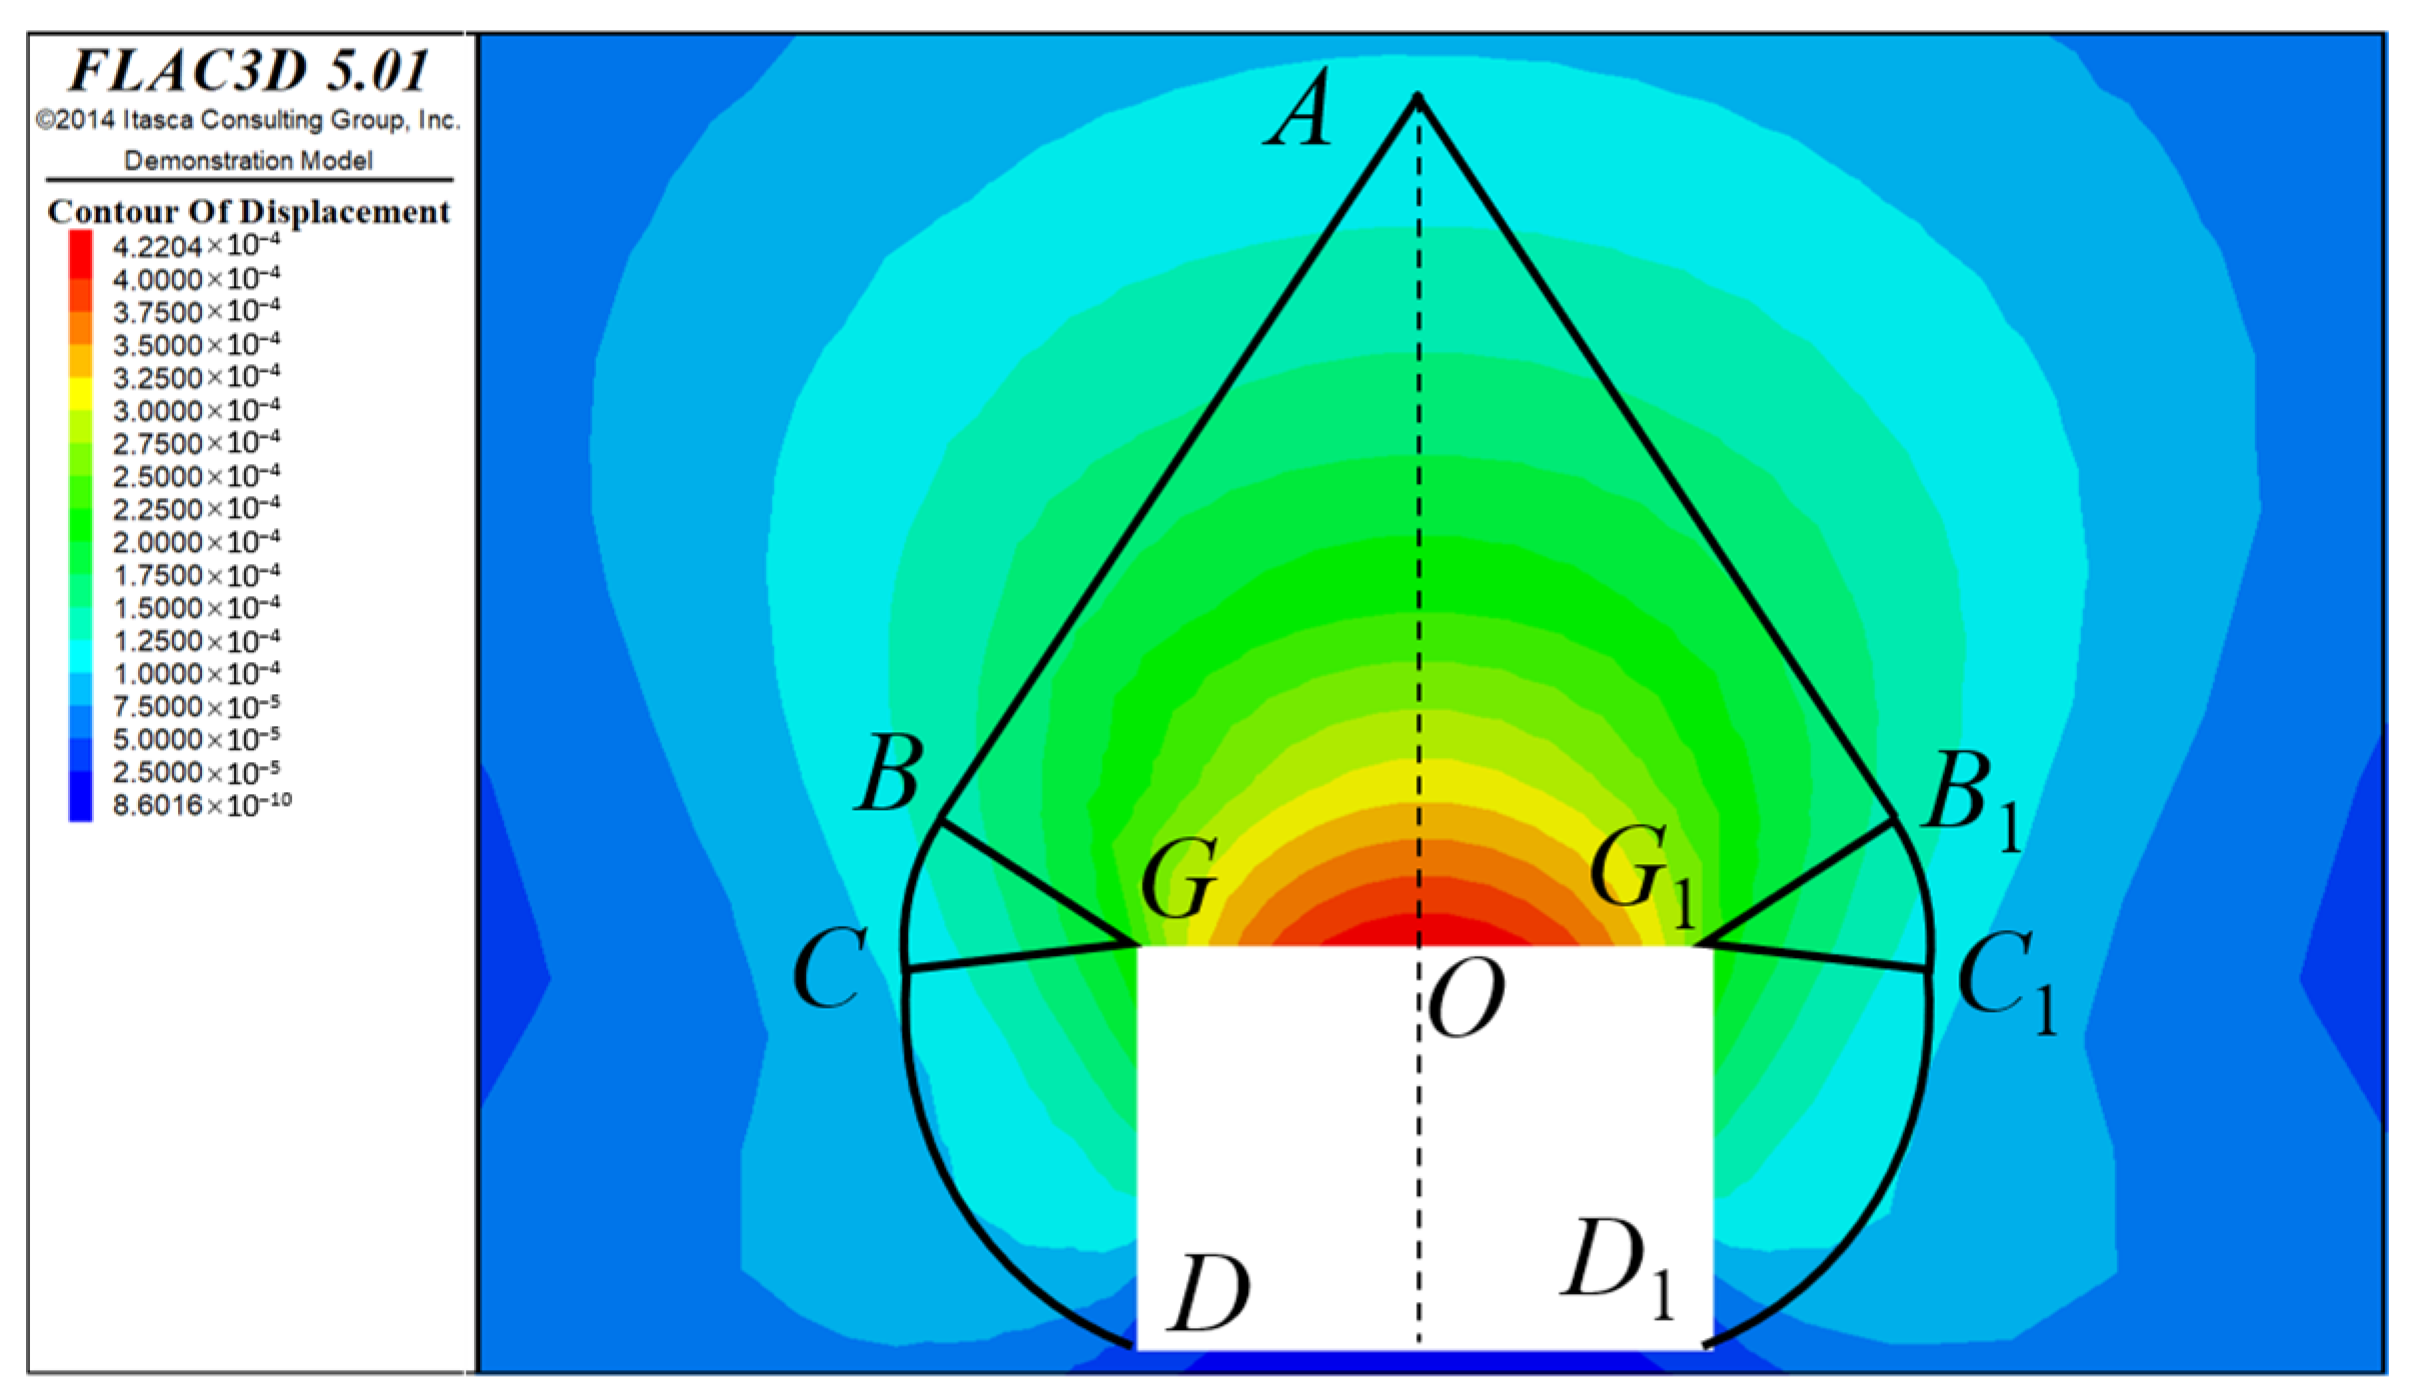
Five sides of the model, the bottom and the front and back boundaries, are fixed. The meshes are divided into radial and rectangular hexahedral meshes around the cylinder. The shear strain increment maps obtained by numerical simulation are placed on the same map as the failure modes in this paper, which is shown in
Figure 6.
From
Figure 6, it can be concluded that the failure mode constructed in this paper is in good agreement with the failure area obtained by numerical simulation, which shows that the failure mode constructed in this paper is scientific and reasonable.
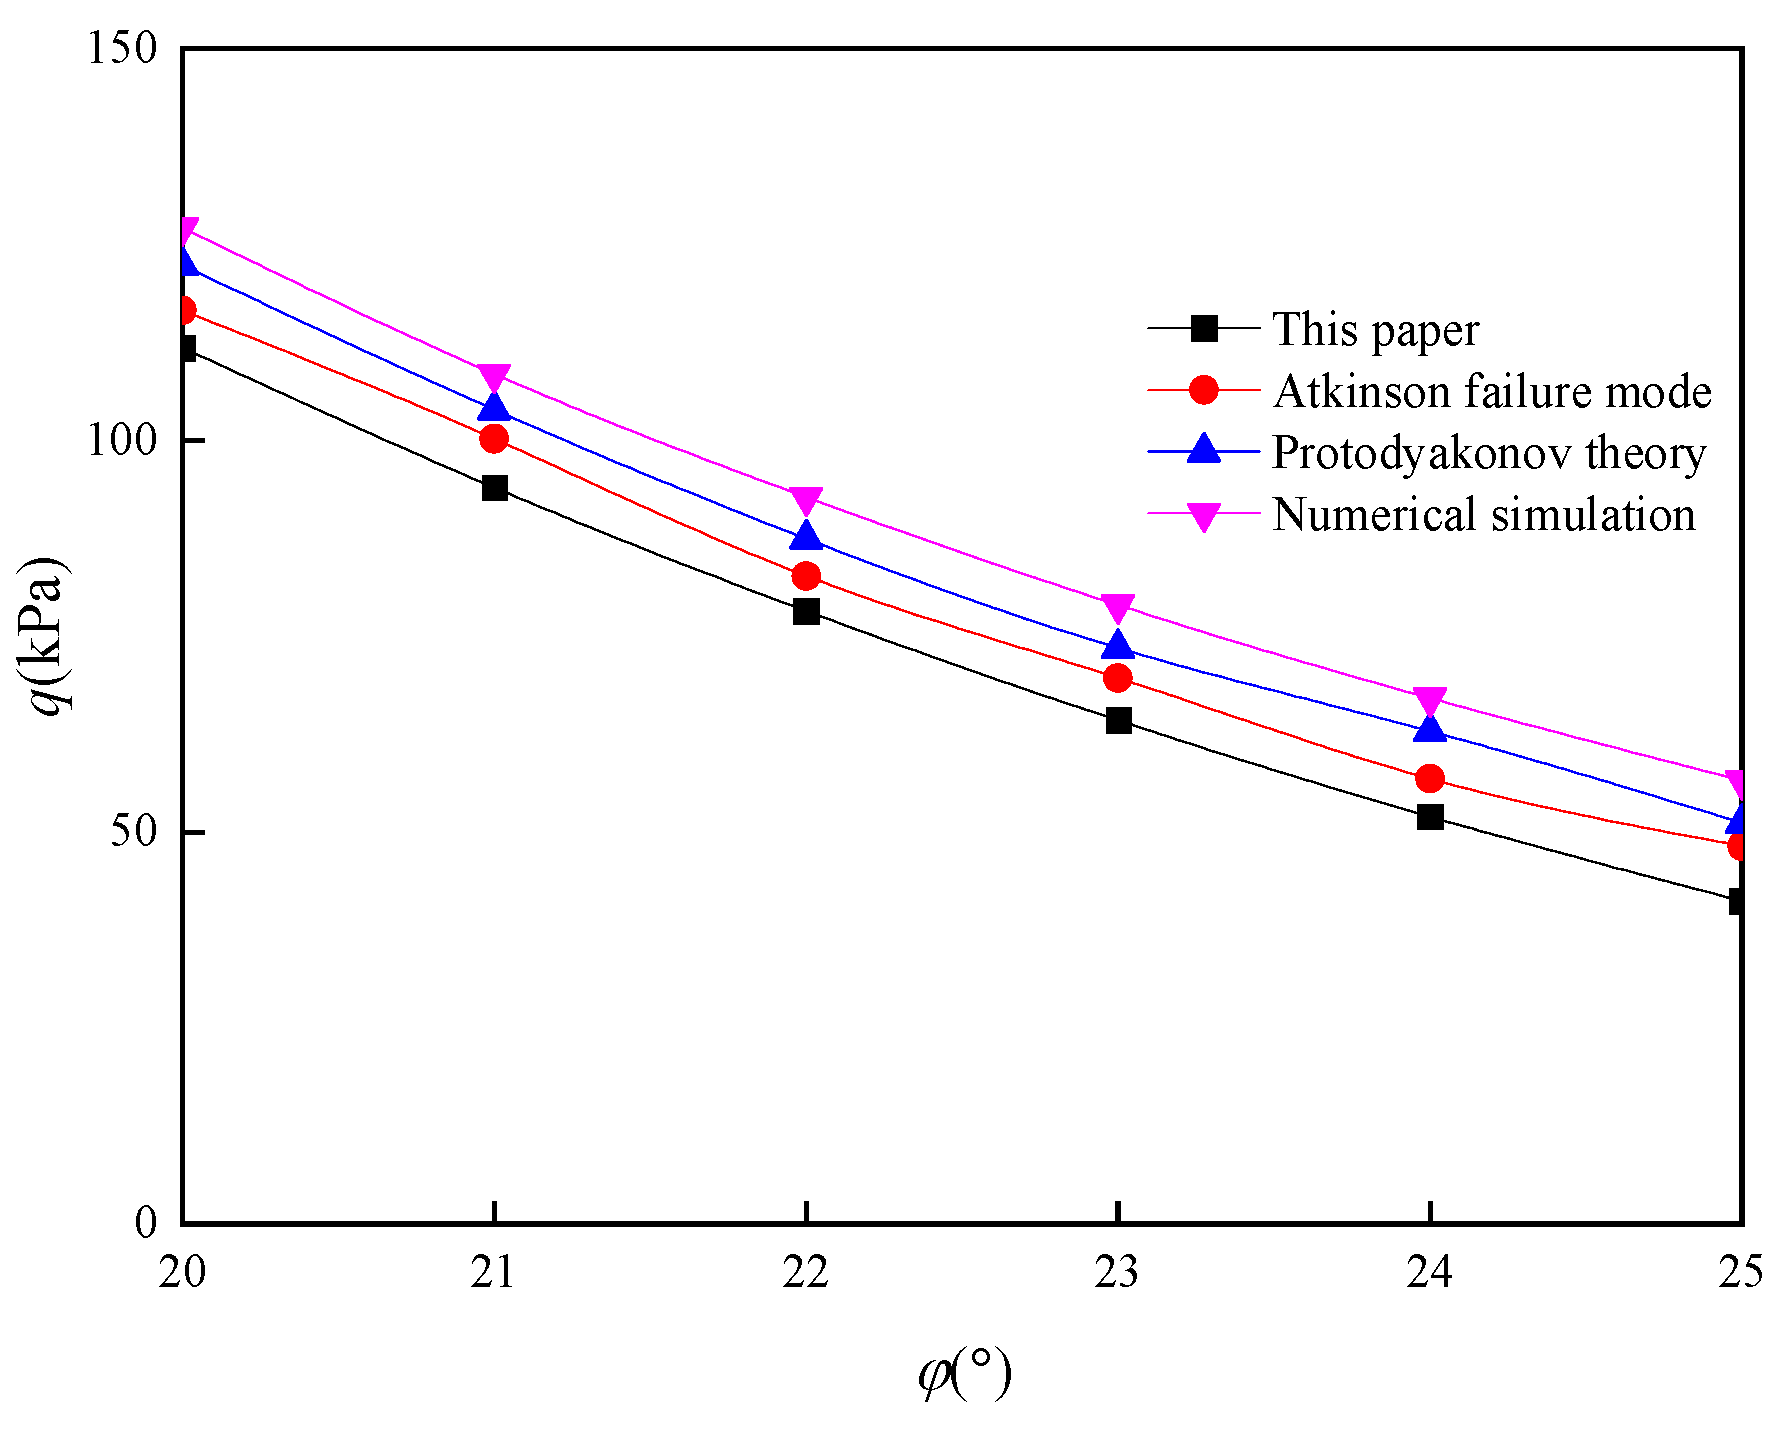
5.2. Comparative Verification
Combining the above three failure mechanisms, the following will theoretically verify the rationality of the calculation method in this paper. The parameters are as follows:
γ = 22 kN/m
3, chamber height
h = 10 m, width
l = 12 m,
c = 25 kPa, and
φ = 20~25°. The surrounding rock pressure under each failure mechanism is calculated, which is compared with the calculated results and numerical simulation results in this paper. The comparison results are shown in
Figure 7.
According to the six conditions under different internal friction angles (
φ = 20~25°) in
Figure 7, it can be concluded that the surrounding rock pressure calculated in this paper is less than that calculated by other methods. According to the upper bound theorem of limit analysis, it is shown that the surrounding rock pressure calculated in this paper is closer to the true solution of surrounding rock pressure and has higher accuracy than other theories. That is to say, the failure mode constructed in this paper is better.
5.3. Engineering Contrast
Taking Jiangyuanling Tunnel in Yueyang, Hunan Province, as the background, the rationality of this method is verified. Jiangyuanling Tunnel is a rock tunnel, and the rock is mainly strong weathered sericite sandy slate. According to the actual geological data, the relevant geological parameters are as follows: the rock mass weight
γ = 20 kN/m
3,
c = 35 kPa, Poisson ratio
µ = 0.4, internal friction angle
φ = 21°, lateral pressure coefficient
K = 1.0, tunnel width is 12 m, and height is 10 m. The result of the surrounding rock pressure calculated by this method is 54 kPa. In order to monitor the surrounding rock pressure during the tunnel construction, the pressure box is installed between the roof and the concrete support in the initial shotcrete support of the tunnel, and two pressure boxes are installed every 30 m to obtain the maximum monitoring results. The results of the surrounding rock pressure are shown in
Table 2.
Table 2 shows that the error between the calculated results and the engineering monitoring results is less than 25%. The calculation results meet the engineering design requirements. At the same time, the rationality of the failure mode and the accuracy of the calculation results are verified.
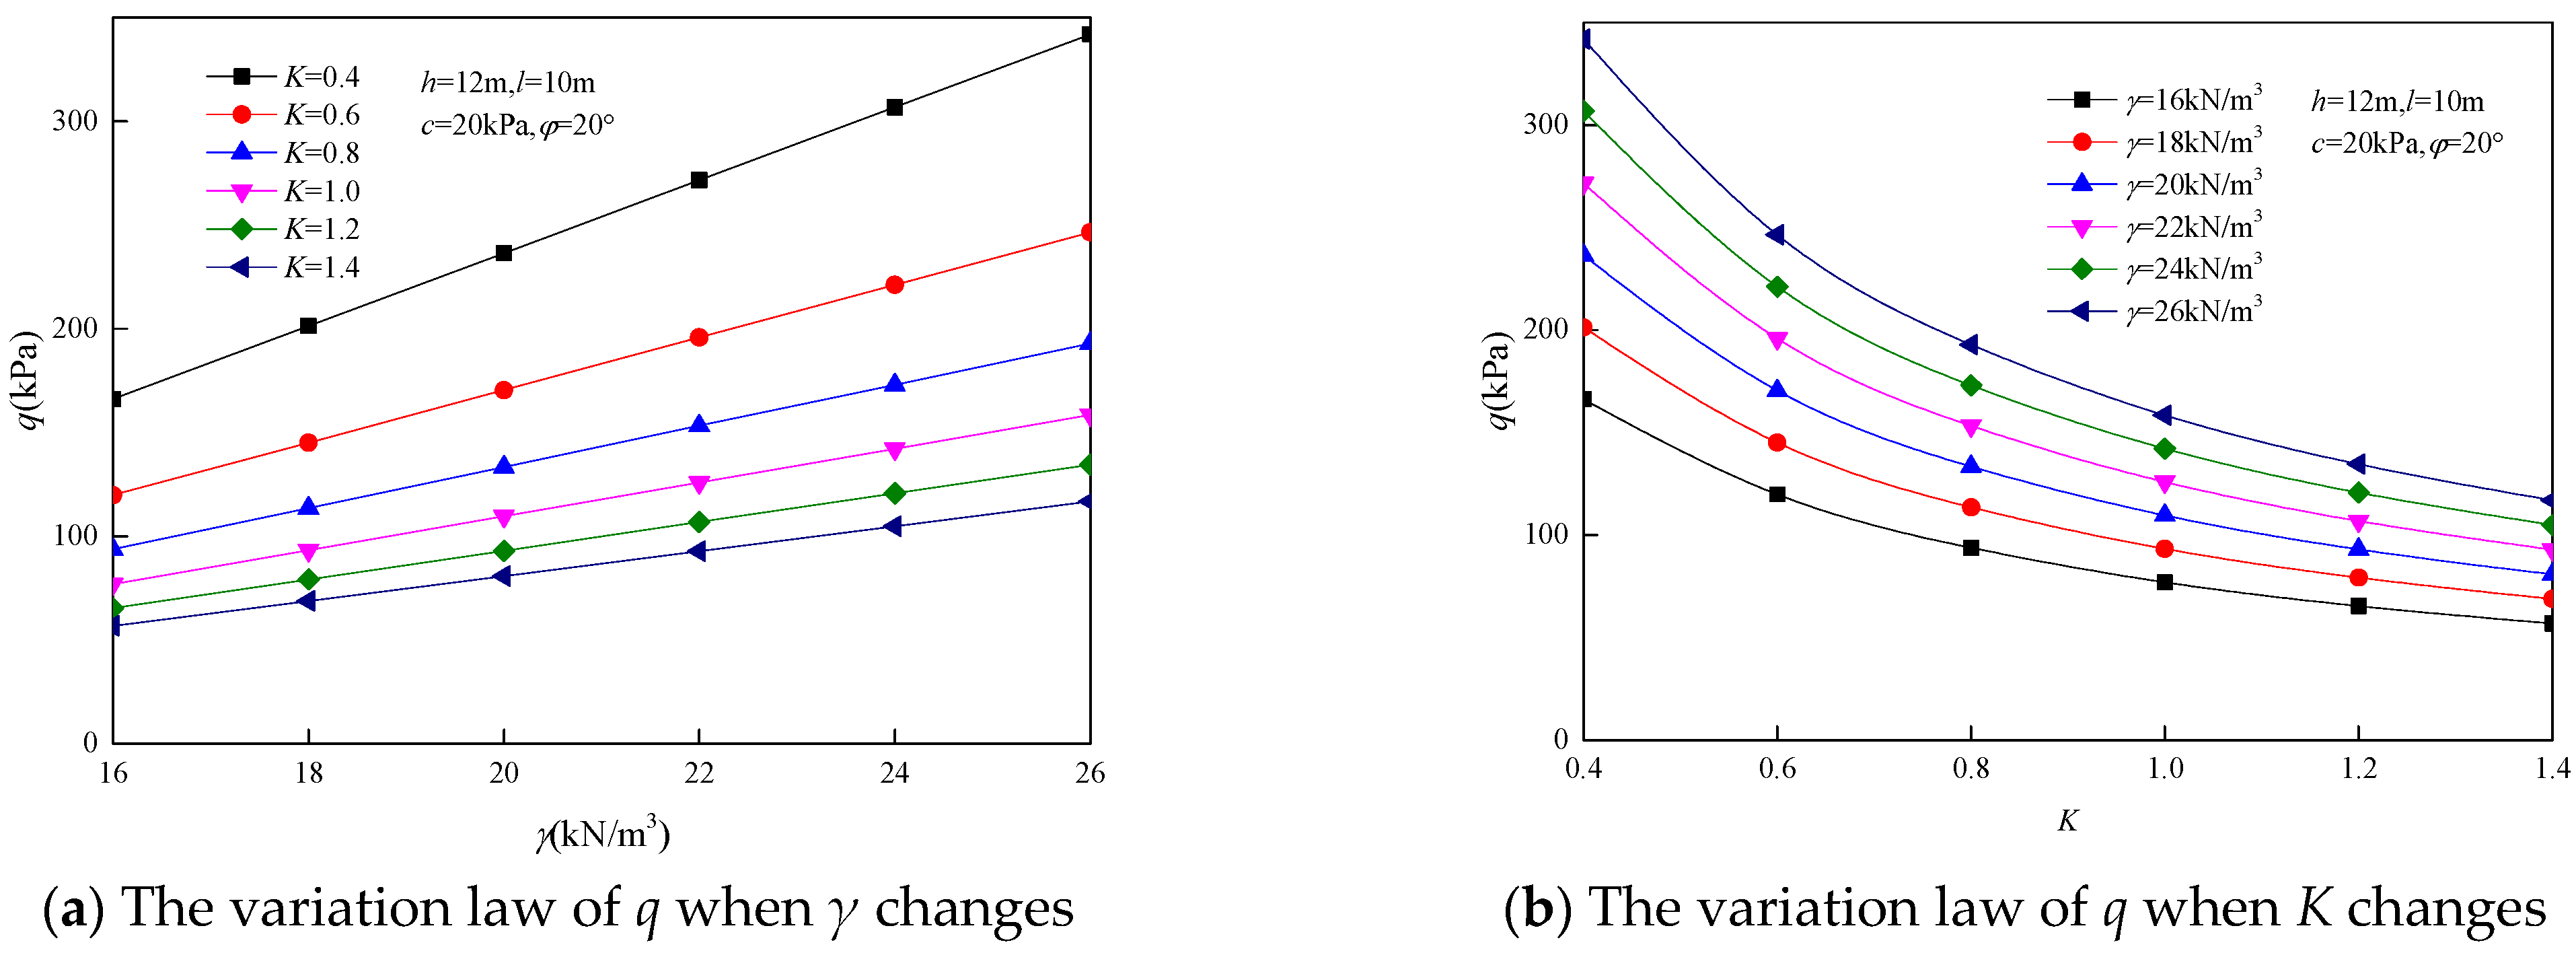
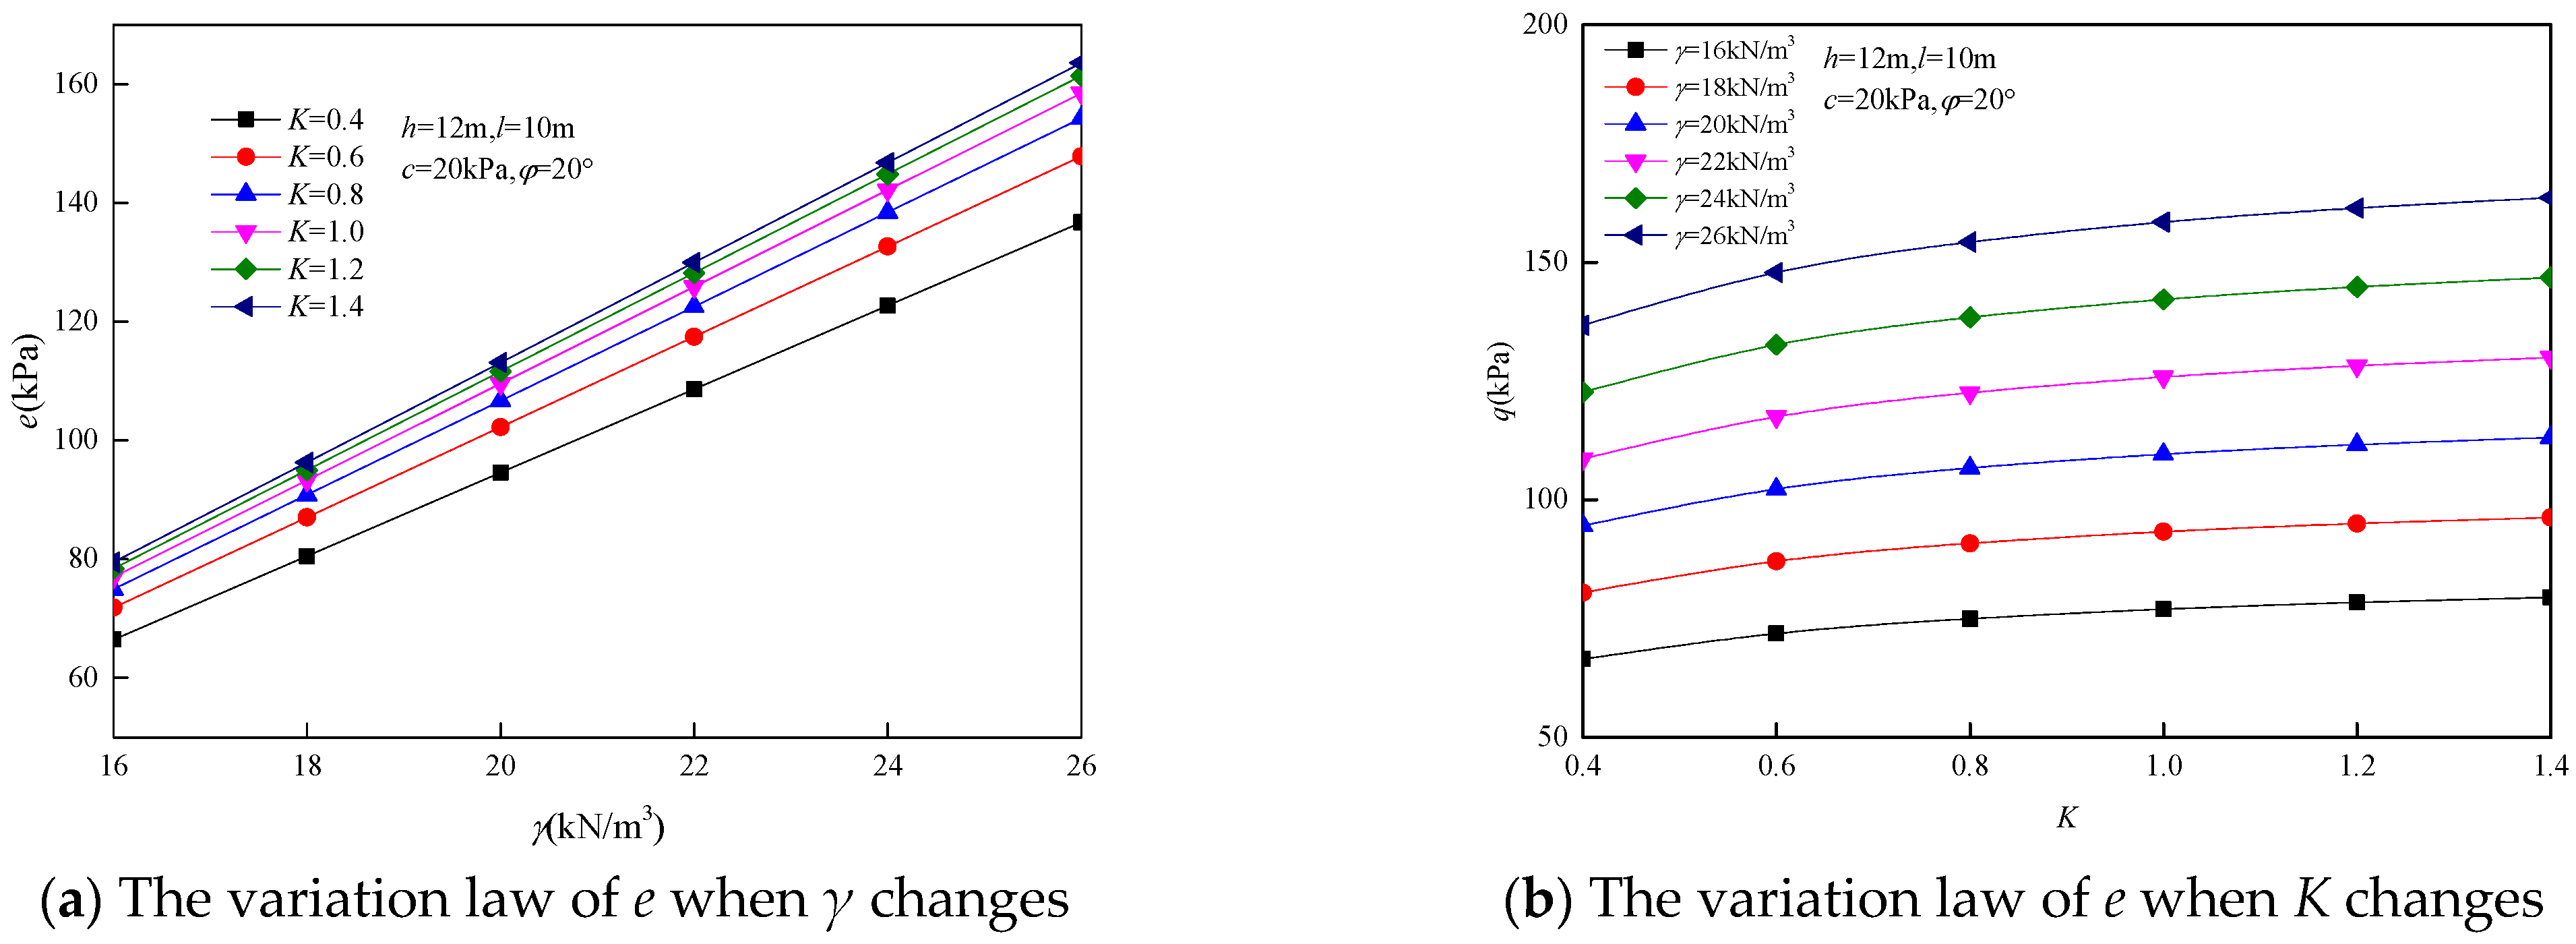
6. Result Analysis
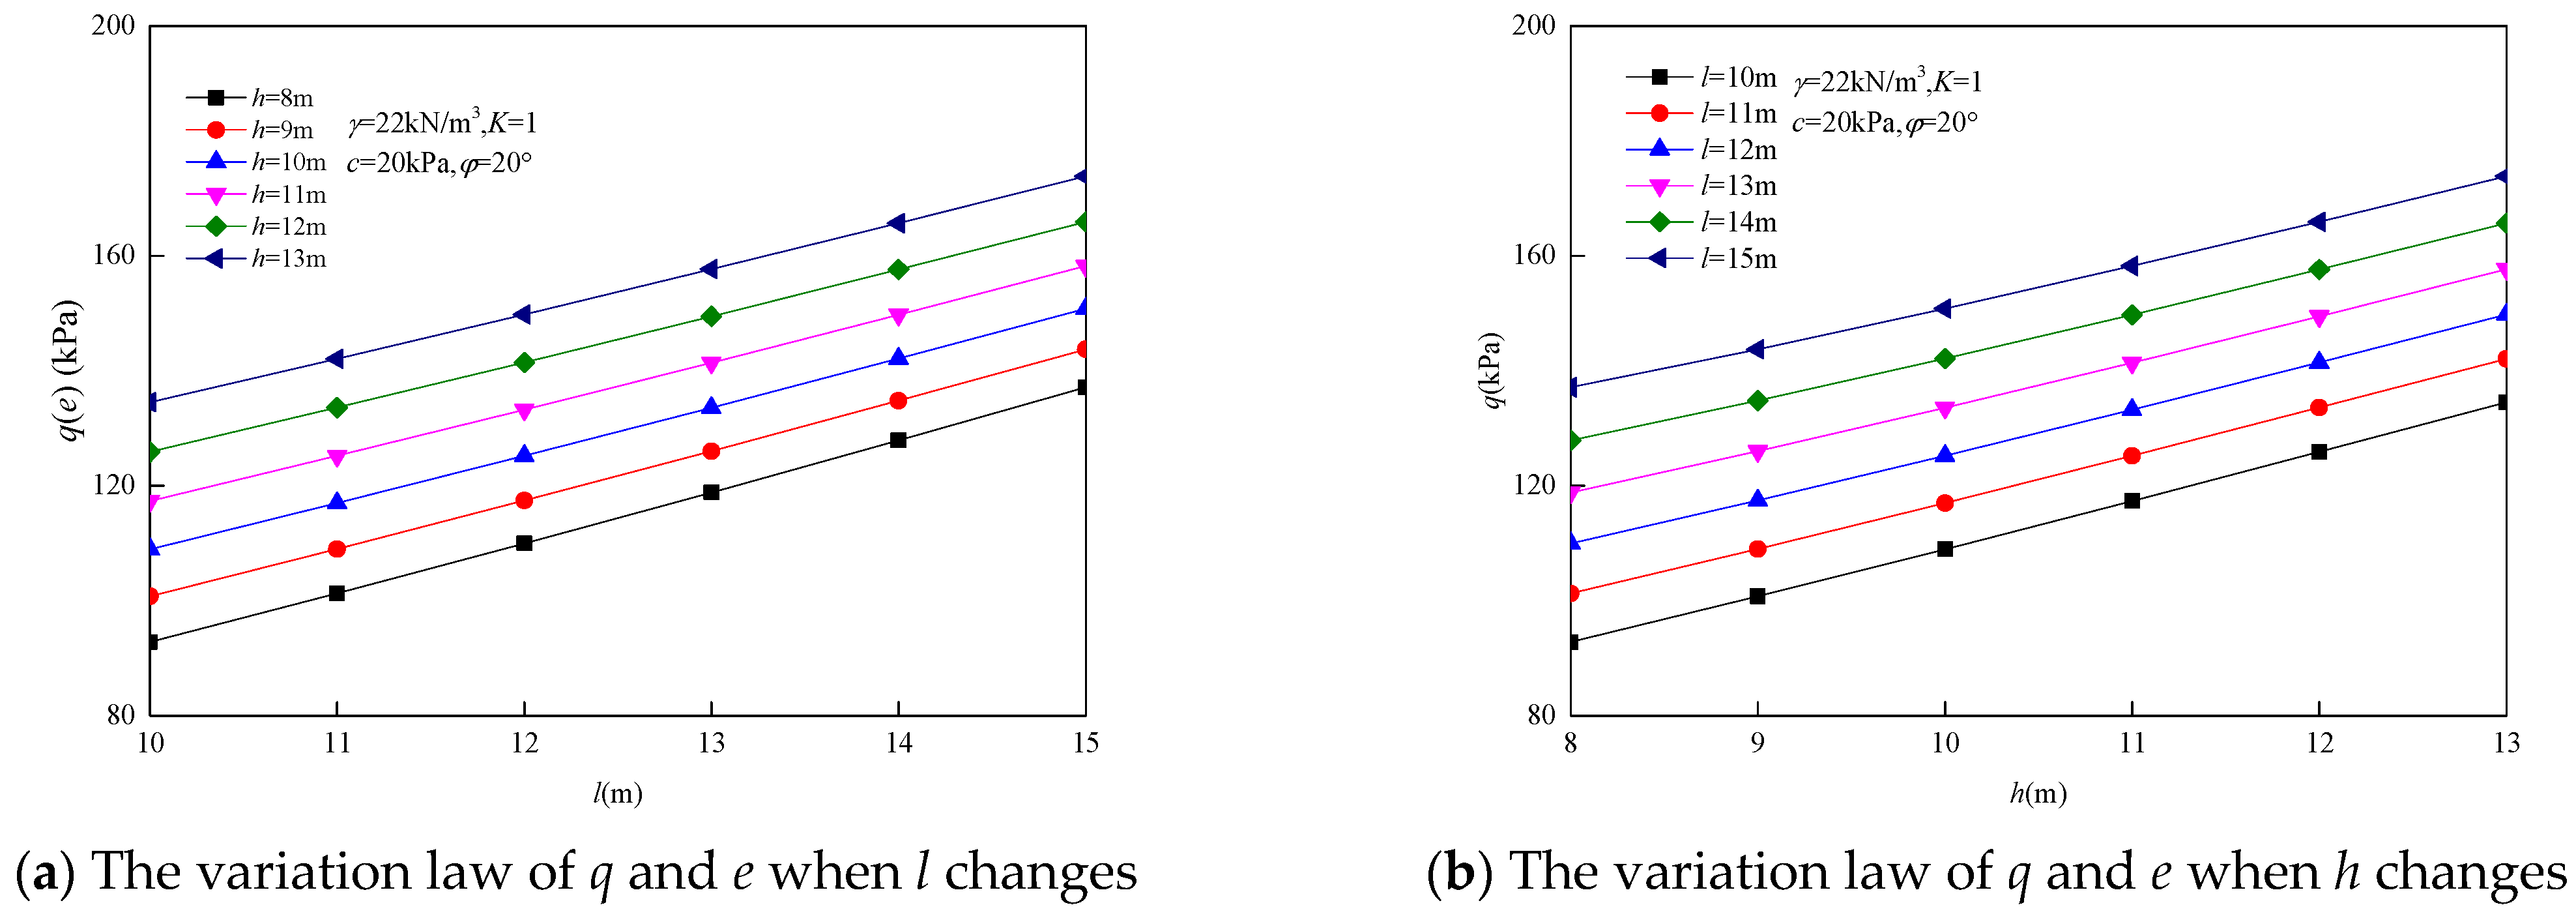
Through the effects of rock gravity γ, the lateral pressure coefficient K, tunnel size, cohesion c, and internal friction angle φ on the surrounding rock pressure q and e are analyzed. The parameters are γ = 16~26 kN/m3, K = 0.4~1.4, tunnel height h = 8~13 m, width l = 10~15 m, c = 18~28 kPa, and φ = 20~30°.
Through calculation, the influence of each parameter on the surrounding rock pressure is shown in
Figure 8,
Figure 9,
Figure 10 and
Figure 11. From
Figure 8 and
Figure 9, it can be concluded that the surrounding rock pressure
q and
e increase linearly with the increase in rock gravity
γ. With the increase in lateral pressure coefficient
K, the surrounding rock pressure
q decreases nonlinearly and the surrounding rock pressure
e increases nonlinearly. This shows that the buried depth of the tunnel has some influence on the surrounding rock pressure. From
Figure 10, it can be seen that the surrounding rock pressure
q and
e increase linearly with the increase in the height and width of the tunnel, and the increasing trend is obvious. This shows that the tunnel size has a great influence on the surrounding rock pressure. From
Figure 11, it can be seen that the surrounding rock pressure
q and
e decrease linearly with the increase in cohesion
c. The surrounding rock pressure
q and
e decrease nonlinearly with the increase in internal friction angle
φ, and the reduction effect is obvious. This shows that the quality of the surrounding rock directly affects the magnitude of the surrounding rock pressure.
7. Conclusions
(1) It is reliable to calculate the surrounding rock pressure by using the failure mode of the deep-buried chamber in this paper. The surrounding rock pressure value calculated in this paper is a strict upper bound solution of the deep-buried chamber, which can be used as the theoretical basis for the excavation and support design and construction of the deep-buried chamber.
(2) The surrounding rock pressure calculated by the failure model in this paper is less than that calculated by the Protodyakonov theory, Atkinson’s failure model, and numerical simulation. It shows that the surrounding rock pressure calculated in this paper is closer to the real solution and has higher accuracy.
(3) Each parameter has a different influence on the surrounding rock pressure. The surrounding rock pressure q and e increase linearly with the increase in rock gravity γ and chamber size, and decrease with the increase in cohesion c and internal friction angle φ. The surrounding rock pressure q decreases with the increase in lateral pressure coefficient K, while the surrounding rock pressure e increases with the increase in lateral pressure coefficient K.
Author Contributions
Conceptualization, D.Z. and L.Z.; methodology, Z.L., X.Y. and C.L.; writing—original draft preparation, L.Z.; writing—review and editing, D.Z., A.J., X.J., Q.L. and Y.Y. All authors have read and agreed to the published version of the manuscript.
Funding
This research was funded by the National Natural Science Foundation of China, grant number 52074116 and 51804113 (Daobing Zhang). The financial support is greatly appreciated.
Data Availability Statement
The data presented in this study are available on request from the corresponding author. The data are not publicly available due to the complexity of the data.
Conflicts of Interest
Authors Zhilin Lv, Xiaochuan Yu and Chang Liu were employed by the company China Gezhouba Group Road & Bridge Co., Ltd. The remaining authors declare that the research was conducted in the absence of any commercial or financial relationships that could be construed as a potential conflict of interest.
References
- Lenz, G.; Poisel, A.; Brandtner, M.; Goricki, A.; Wagner, O.K. Semmering Base Tunnel—Geotechnical models in design and construction. Geomech. Tunn. 2018, 11, 559–565. [Google Scholar] [CrossRef]
- Tellioglu, V. Observations on cracking in concrete tunnel segments—An assessment of correlations. Geomech. Tunn. 2019, 12, 82–95. [Google Scholar] [CrossRef]
- Zhu, X.; Chen, Z.; Ren, Y. Numerical simulation study on the anchorage mechanism of yield supporting in deep tunnel. Geotech. Geol. Eng. 2018, 37, 2091–2102. [Google Scholar] [CrossRef]
- Bobet, A. Deep tunnel in transversely anisotropic rock with groundwater flow. Rock Mech. Rock Eng. 2016, 49, 4817–4832. [Google Scholar] [CrossRef]
- Cheng, H.Z.; Chen, J.; Chen, R.P.; Chen, G.L. Reliability study on shield tunnel face using a random limit analysis method in multilayered soils. Tunn. Undergr. Space Technol. 2019, 84, 353–363. [Google Scholar] [CrossRef]
- Zuo, J.P.; Ma, Z.Y.; Xu, C.Y.; Zhan, S.F.; Liu, H.Y. Mechanism of principal stress rotation and deformation failure behavior induced by excavation in roadways. J. Rock Mech. Geotech. Eng. 2024, 16, 4605–4624. [Google Scholar] [CrossRef]
- Kumar, A.; Chauhan, V.B. Advanced finite element limit analysis and machine learning for assessing the stability of square tunnels in rock slope. Transp. Infrastruct. Geotechnol. 2024, 11, 1928–1962. [Google Scholar] [CrossRef]
- Yang, X.L.; Zhou, T.; Li, W.T. Reliability analysis of tunnel roof in layered Hoek-Brown rock masses. Comput. Geotech. 2018, 104, 302–309. [Google Scholar] [CrossRef]
- Huang, M.; Tang, Z.; Zhou, W.; Yuan, J. Upper bound solutions for face stability of circular tunnels in non-homogeneous and anisotropic clays. Comput. Geotech. 2018, 98, 189–196. [Google Scholar] [CrossRef]
- Zhao, L.; Huang, S.; Zhang, R.; Zuo, S. Stability analysis of irregular cavities using upper bound finite element limit analysis method. Comput. Geotech. 2018, 103, 1–12. [Google Scholar] [CrossRef]
- Guan, K.; Zhu, W.C.; Niu, L.L.; Wang, Q.Y. Three-dimensional upper bound limit analysis of supported cavity roof with arbitrary profile in Hoek-Brown rock mass. Tunn. Undergr. Space Technol. 2017, 69, 147–154. [Google Scholar] [CrossRef]
- Huang, F.; Yang, X.L. Upper bound limit analysis of collapse shape for circular tunnel subjected to pore pressure based on the Hoek–Brown failure criterion. Tunn. Undergr. Space Technol. 2011, 26, 614–618. [Google Scholar] [CrossRef]
- Qin, C.B.; Yang, X.L.; Pan, Q.J.; Sun, Z.B.; Wang, L.L.; Miao, T. Upper bound analysis of progressive failure mechanism of tunnel roofs in partly weathered stratified Hoek–Brown rock masses. Int. J. Rock Mech. Min. Sci. 2015, 74, 157–162. [Google Scholar] [CrossRef]
- Fraldi, M.; Guarracino, F. Analytical solutions for collapse mechanisms in tunnels with arbitrary cross sections. Int. J. Solids Struct. 2010, 47, 216–223. [Google Scholar] [CrossRef]
- Perazzelli, P.; Anagnostou, G. Upper bound limit analysis of uplift failure in pressurized sealed rock tunnels. Int. J. Numer. Anal. Methods Geomech. 2017, 42, 719–735. [Google Scholar] [CrossRef]
- Huang, F.; Zhang, D.B.; Sun, Z.B.; Wu, B. Influence of pore water pressure on upper bound analysis of collapse shape for square tunnel in Hoek-Brown media. J. Cent. South Univ. 2011, 18, 530–535. [Google Scholar] [CrossRef]
- Liu, W.; Albers, B.; Zhao, Y.; Tang, X.-W. Upper bound analysis for estimation of the influence of seepage on tunnel face stability in layered soils. J. Zhejiang Univ.-SCIENCE A 2016, 17, 886–902. [Google Scholar] [CrossRef]
- Ye, Y.L.; Lu, Z.W.; Sun, Y.Z.; Shang, S.J.; Qian, Z.J. Upper bound solution of passive instability on the face of longitudinal inclined shallow buried shield tunnel based on rotation–translation mechanism. Comput. Geotech. 2023, 159, 105473. [Google Scholar] [CrossRef]
- Zhang, D.B.; Liu, Z.Z.; Zhang, J.H. A new failure mechanism for deep cavity and upper bound solution of supporting pressure. J. Cent. South Univ. 2017, 24, 2082–2091. [Google Scholar] [CrossRef]
- Zuo, J.; Ma, Z. Asymmetric deformation and failure behavior of roadway subjected to different principal stress based on biaxial tests. Tunn. Undergr. Space Technol. 2025, 155, 106174. [Google Scholar] [CrossRef]
- Atkinson, J.H.; Potts, D.M. Stability of a shallow circular tunnel in cohesionless soil. Géotechnique 1977, 27, 203–215. [Google Scholar] [CrossRef]
| Disclaimer/Publisher’s Note: The statements, opinions and data contained in all publications are solely those of the individual author(s) and contributor(s) and not of MDPI and/or the editor(s). MDPI and/or the editor(s) disclaim responsibility for any injury to people or property resulting from any ideas, methods, instructions or products referred to in the content. |
© 2024 by the authors. Licensee MDPI, Basel, Switzerland. This article is an open access article distributed under the terms and conditions of the Creative Commons Attribution (CC BY) license (https://creativecommons.org/licenses/by/4.0/).


 ,
, 


