Article

Abnormal Monitoring Data Detection Based on Matrix Manipulation and the Cuckoo Search Algorithm

1
School of Water Conservancy and Environment Engineering & Nanxun Innovation Institute, Zhejiang University of Water Resources and Electric Power, Hangzhou 310018, China
2
School of Environment and Civil Engineering, Dongguan University of Technology & Guangdong Provincial Key Laboratory of Intelligent Disaster Prevention and Emergency Technologies for Urban Lifeline Engineering, Dongguan 523808, China
3
Laboratory of Environmental Hydraulics, Ecole Polytechnique Fédérale de Lausanne, 1015 Lausanne, Switzerland
4
Huai’an Hydraulic Surcey and Design Research Institute Co., Ltd., Huaian 223500, China
*
Author to whom correspondence should be addressed.
Mathematics 2024, 12(9), 1345; https://doi.org/10.3390/math12091345
Submission received: 9 April 2024 / Revised: 26 April 2024 / Accepted: 26 April 2024 / Published: 29 April 2024
(This article belongs to the Special Issue Anomaly and Novelty Detection and Explainability)

Abstract

:
Structural health monitoring is an effective method to evaluate the safety status of dams. Measurement error is an important factor which affects the accuracy of monitoring data modeling. Processing the abnormal monitoring data before data analysis is a necessary step to ensure the reliability of the analysis. In this paper, we proposed a method to process the abnormal dam displacement monitoring data on the basis of matrix manipulation and Cuckoo Search algorithm. We first generate a scatter plot of the monitoring data and exported the matrix of the image. The scatter plot of monitoring data includes isolate outliers, clusters of outliers, and clusters of normal points. The gray scales of isolated outliers are reduced using Gaussian blur. Then, the isolated outliers are eliminated using Ostu binarization. We then use the Cuckoo Search algorithm to distinguish the clusters of outliers and clusters of normal points to identify the process line. To evaluate the performance of the proposed data processing method, we also fitted the data processed by the proposed method and by the commonly used 3- σ method using a regression model, respectively. Results indicate that the proposed method has a better performance in abnormal detection compared with the 3- σ method.

1. Introduction

Due to environmental and ageing effects, structural behaviours and material properties of dams often have changes compared to initial or designed values after running for years, which may affect the heath status of dams [1,2]. In practical engineering, to evaluate the real time running status of dams, engineers commonly install a series of monitoring devices inside the dam and monitor dam’s structural parameters, such as displacement, seepage, and rotation. Once the deformation of the dam exceeds the safety value, the risk of the dam break problem would be very high when the reservoir is operated with high water level. Thus, analyzing the deformation status of the dam is important for evaluating the running status of the dam. Interpolating the displacement data of all monitoring point can provide the deformation field of the dam body. Therefore, displacement is the most crucial parameter [3,4]. Displacement monitoring data modeling is consider as one of the most effective methods to assess a dam’s health status.
Previous researchers developed a numbers of displacement prediction models using monitoring data [5,6,7]. In addition to traditional statistical models, machine learning algorithms such as the neural network method [8], support vector machine method [9,10], and extreme learning machine method [11] were applied to displacement monitoring data modeling in recent years. Most previous studies put emphasis on improving the accuracy of displacement prediction models. As research progressed, the precision of these models has been fairly high.
The reliability of monitoring data modeling not only relies on the performance of prediction model but also depends on the quality of monitoring data [12,13,14]. However, measurement errors of monitoring device are unavoidable in practical engineering due to technical problems such as false reading [15]. Therefore, detecting the abnormal data of displacement monitoring data is of great importance for improving the reliability of displacement prediction models.
Previous studies have proposed different methods to detect outliers in a dataset [14,16,17,18,19]. In early studies, criterion-based methods such as Pauta criterion, Chauvenet criterion, and Grubbs criterion were used to detect outliers [20,21,22]. Each criterion has different usage conditions. Grubbs criterion is applicable to a dataset with few data, whereas Pauta criterion is applicable for dataset with more data. In recent years, statistical theories such as 3 σ criterion have been commonly used to detect abnormal values in monitoring datasets. To increase the rate of outliers being detected, many studies have been conducted to enhance traditional methods [23,24,25]. For example, Zhao et al. improved the 3 σ criterion using the minimum covariance determinant [26]. Song et al. developed an detection method based on the multi-variable panel data model and K-means clustering method [27]. Zhang et al. provided a multi-source information fusion model for outlier detection [28].
These methods exhibited fairly good performance in identifying gross errors. One disadvantage of these methods is that they are mostly computationally complex. Moreover, the outlier detection often depends on time variation tendencies without considering the fluctuations of environmental factors, such as water level and external temperature [29]. In addition, the performance of outliers detection is affected by the setting of threshold, which relies on artificial selection, which may lead to missing judgment and misjudgment problems.
To overcome the shortcomings of these methods, we proposed a outlier detection method which combines matrix manipulation and the Cuckoo Search algorithm to deal with the abnormal dam displacement monitoring data. The principle of the proposed method is that the process line of monitoring data should be continuous while the outliers deviates from the process line [30]. We first generated the scatter plot of the original monitoring dataset, which includes clusters of isolated outliers, normal points, and clusters of outliers. The objective of the proposed method is to identify isolated outliers and clusters of outliers from the scatter plots. For the matrix manipulation method, Gaussian blur and Ostu binarization are used to detect isolated outliers [31,32,33]. We then applied the Cuckoo Search algorithm, which imitates the habit of brood parasitism, to distinguish clusters of normal points and clusters of outliers [34]. To ensure the efficiency of outliers detection, we implement the process of matrix detection and CS algorithm cyclic until the detection results converges. We also compared the abnormal detection performance of the proposed method with the commonly used 3 σ method.
This paper is organized as follows. Section 2 presents the principles of the proposed method, which combines matrix manipulation and the Cuckoo Search algorithm. Section 3 introduces the dataset. The displacement monitoring data of the dam at Jinping-I hydropower station is selected as the dataset. The detection results of the proposed method are presented in Section 4. Comparisons of the proposed model with 3 σ criterion are also discussed. Concluding remarks complete the paper in Section 5.

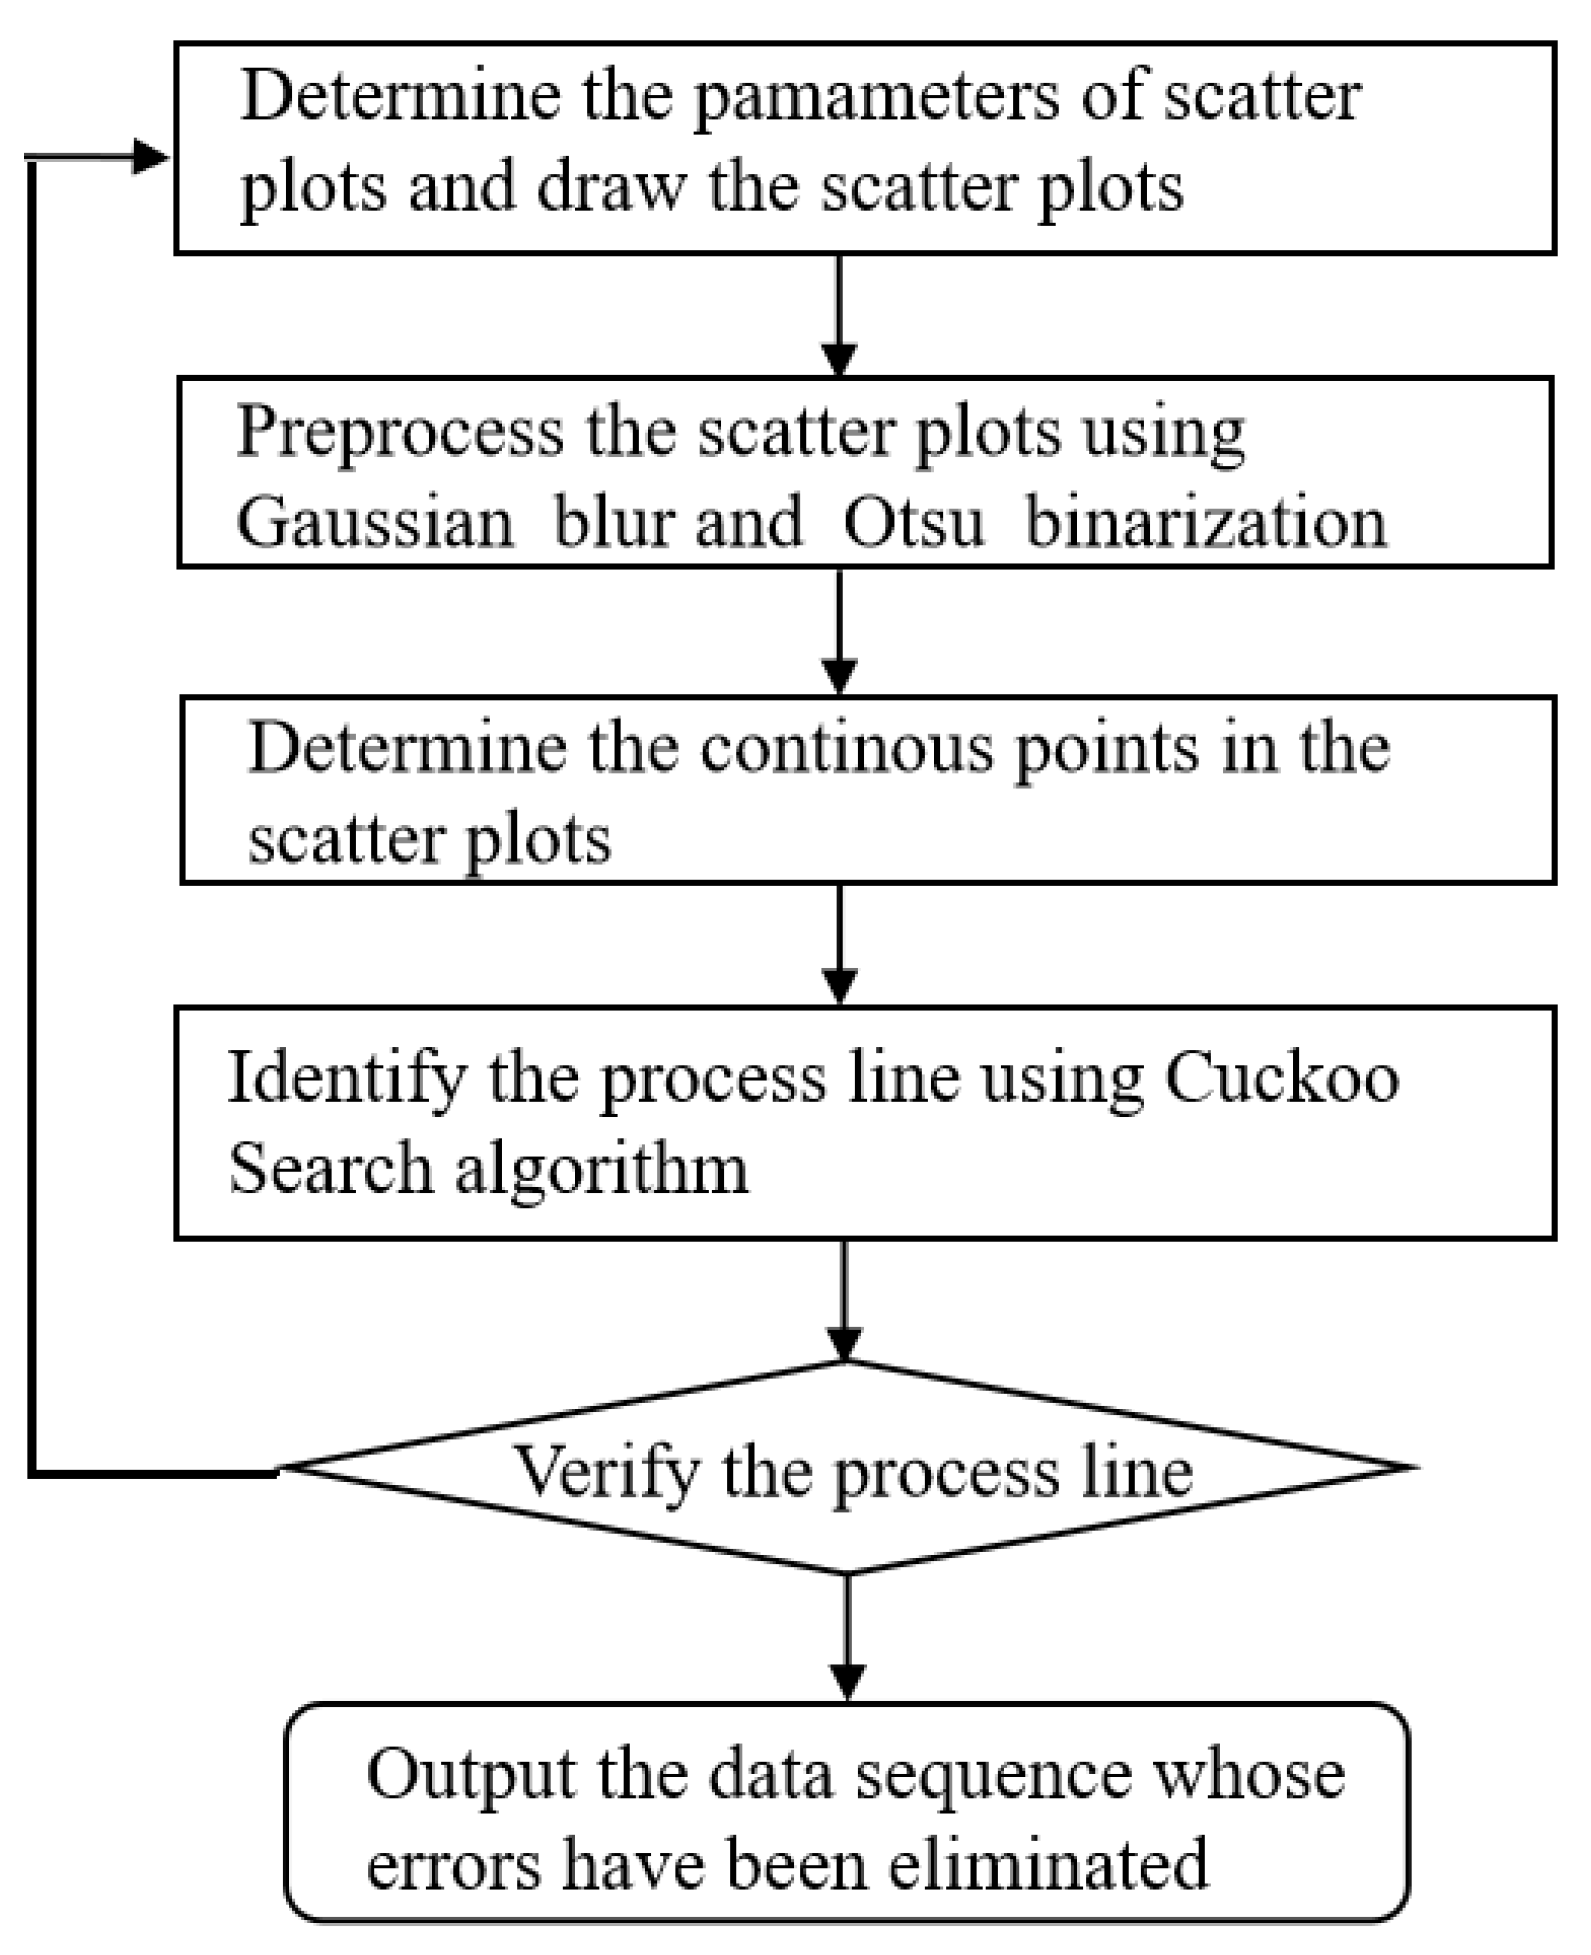
2. Data Processing Method Using Matrix Manipulation and the Cuckoo Search Algorithm

This section presents the mathematical details of the abnormal data processing method on the basis of matrix manipulation and Cuckoo Search algorithm. We first generate a scatter plot of the monitoring data. Once the scatter plot has been drawn, we then consider the scatter plot as an image and export the matrix of the image. Then, the matrix can be pre-processed using Gaussian blur and Ostu binarization. The gray scales of isolated outliers are reduced using Gaussian blur. Then, the isolated outliers are eliminated using Ostu binarization. We then use Cuckoo Search algorithm to distinguish the clusters of outliers and clusters of normal points, so as to identify the process line. Figure 1 shows the flowchart of the proposed abnormal data processing method.

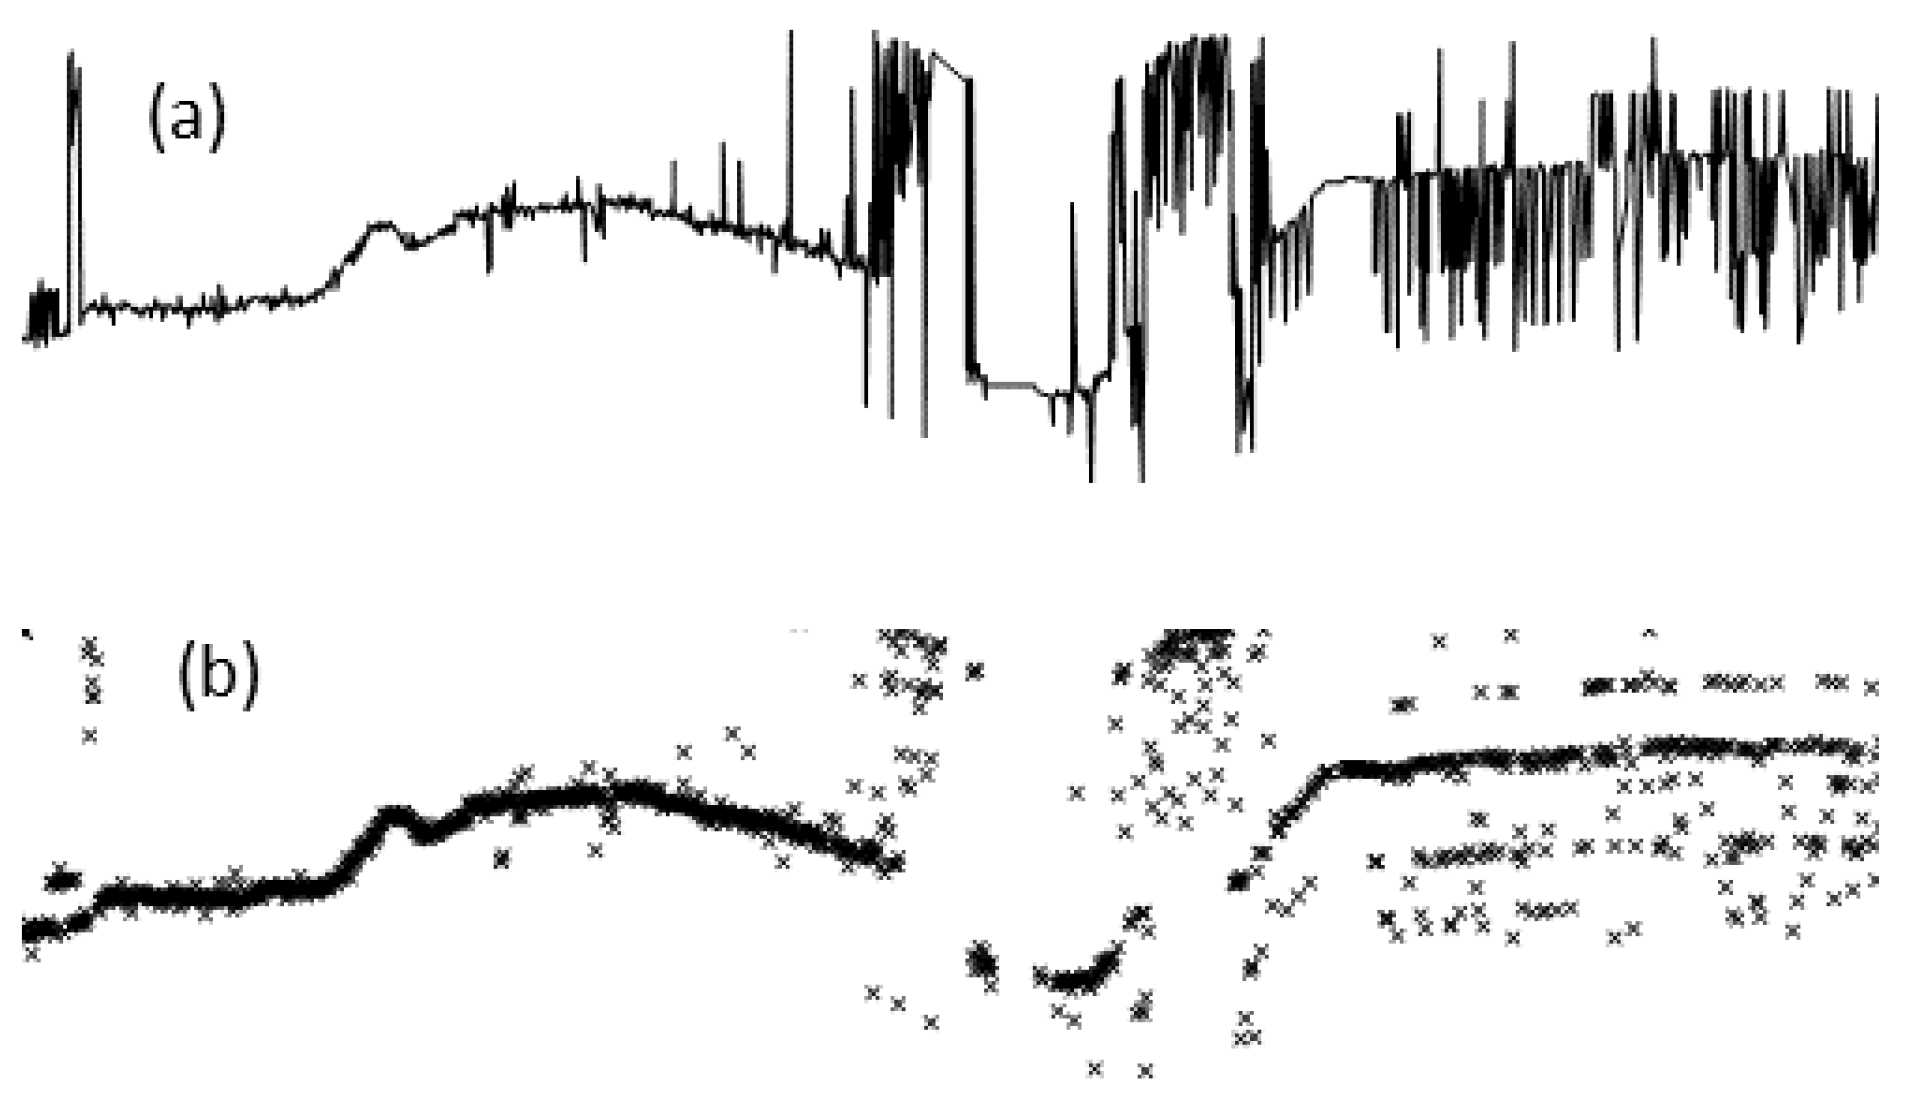
2.1. Data Pre-Processing Using Gaussian Blur and Ostu Binarization

The Principe of the pre-processing method is to consider the plotted data sequence as an image (i.e., matrix), and identify the outliers in the plot using filters (Gaussian blur and Ostu binarization). Figure 2 shows the linear plot and scatter plot of an example data sequence. It can see from the figure that outliers in scatter plot is easier to be separated from the process line as compared with the linear plot. Thus, the first step of data pre-processing is to generate the scatter plot of the monitoring data sequence. Once the scatter plot has been drawn, we then consider the scatter plot as an image and export the matrix of the image. Then, noises can be reduced using various image-processing techniques, such as Gaussian blur and binary threshold. Scatter plot of monitoring data include isolate outliers, clusters of outliers, and clusters of normal points. At the pre-processing stage, most of the isolate outliers in the matrix can be detected and eliminated using Gaussian blur and Ostu binarization.
The Gaussian blur feature is obtained by smoothing an image using a Gaussian function to reduce the noise level. It can be considered as a nonuniform low-pass filter that preserves low spatial frequency and reduces image noise and negligible details in an image. From a mathematical perspective, the Gaussian blur process is the convolution of a matrix with a normal distribution. Convolving an image with a circular box blur will generate a more precise out-of-focus rendering effect. Since the Fourier transform of a Gaussian function is another Gaussian function, Gaussian blur is a low-pass filter for images. It is typically achieved by convolving an image with a Gaussian kernel. The Gaussian kernel filtering function G x , y follows a two-dimension Gaussian distribution:
G x , y = 1 2 π σ 2 e x 2 + y 2 2 σ 2
where σ is the standard deviation of the Gaussian distribution. It controls the variance around a mean value of the Gaussian distribution, which determines the extent of the blurring effect around a pixel. With an increase in σ , the high-frequency information content reduces around the pixel. x , y are the coordinates of neighbor pixels.
The Gaussian weighted matrix W i is:
W i = G 1 , 1 j = 1 n G j G 0 , 1 j = 1 n G j G 1 , 1 j = 1 n G j G 1 , 0 j = 1 n G j G 0 , 0 j = 1 n G j G 0 , 1 j = 1 n G j G 1 , 1 j = 1 n G j G 1 , 0 j = 1 n G j G 1 , 1 j = 1 n G j
where the central pixel is considered as the origin of the coordinate and n is the sum of surrounding pixels and the central pixel. The relation between the gray scale of the central pixel G r a y c and the gray scale of the surrounding pixels G r a y i can be written as:
G r a y c = i = 1 n W i · G r a y i
The Gaussian blur filter provides gradual smoothing and preserves the edges better than any other mean filter. We have used Gaussian blur to reduce the high-frequency components. The size of the Gaussian kernel depends on the noise level in the image. If the kernel size is too large, small features within the image may get suppressed, and the image may look blurred. If the kernel size is too small, eliminating the noises within the image will be compromised.
Ostu binarization is often used to separate intra-image pixels into two parts and determine the threshold of the two parts. This algorithm generate a binary image that helped in displaying the desired scatter areas. The binarization is performed on the mask using an elliptical structuring element to smooth the contour of the scatters, break narrow isthmuses that connected the scatters, remove the outlier pixels, and eliminate thin protrusions from the scatters. For a gray image, G = i i = 1 , 2 , , 255 represents the possible set of gray scales, P = n n = 1 , 2 , , N denotes the set of all pixels. The threshold of the gray scale T G can be expressed as:
T G = T G m a x σ 2
where σ 2 denotes the variance between each part and can be written as:
σ 2 = q 1 1 q 1 μ 1 μ 2 2
with:
q 1 = i = 0 t P i , μ 1 = i = 0 t i P i / q 1 , μ 2 = i = t + 1 255 i P i / 1 q 1
where N i has a number of pixels with gray scale i, P i is the ratio of N i to N, q 1 is the ratio of number of pixels with gray scale lower than T G and N, μ 1 the mean value of the gray scale of pixels in P 1 = n G n T G , μ 2 is the mean value of gray scale of pixels in P 2 = n G n > T G , and G n is the gray scale of n t h pixel.

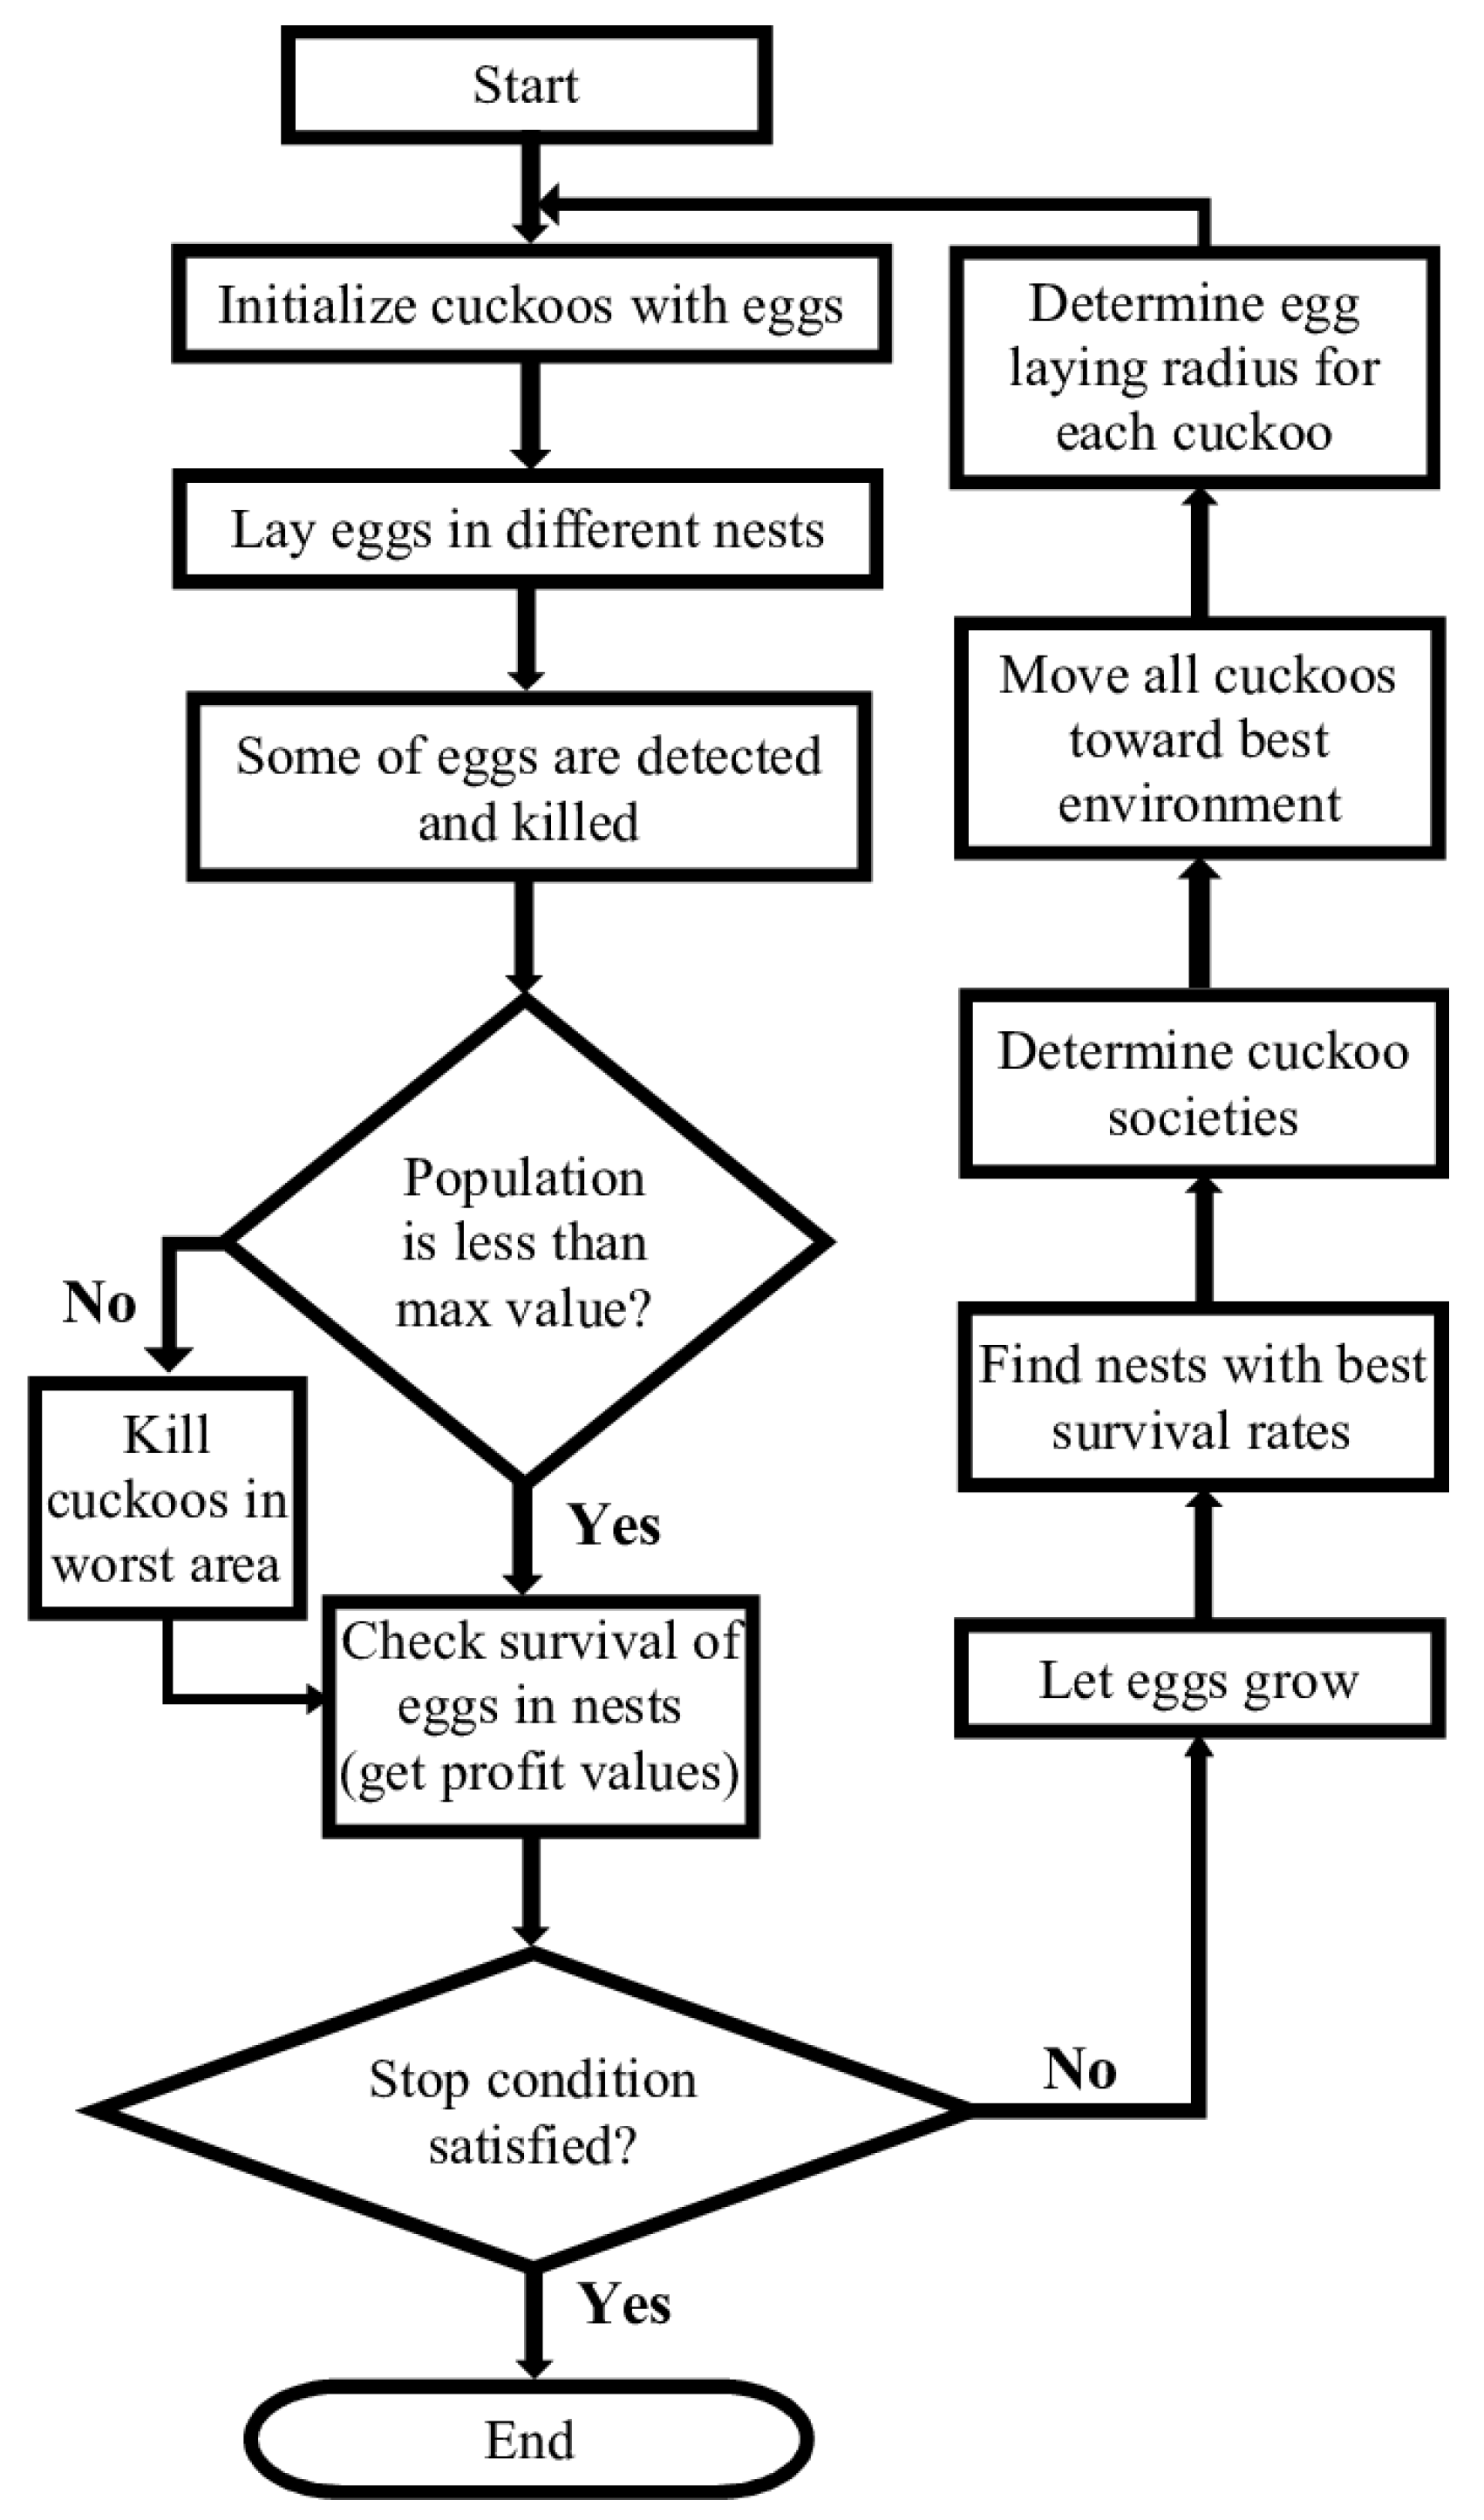
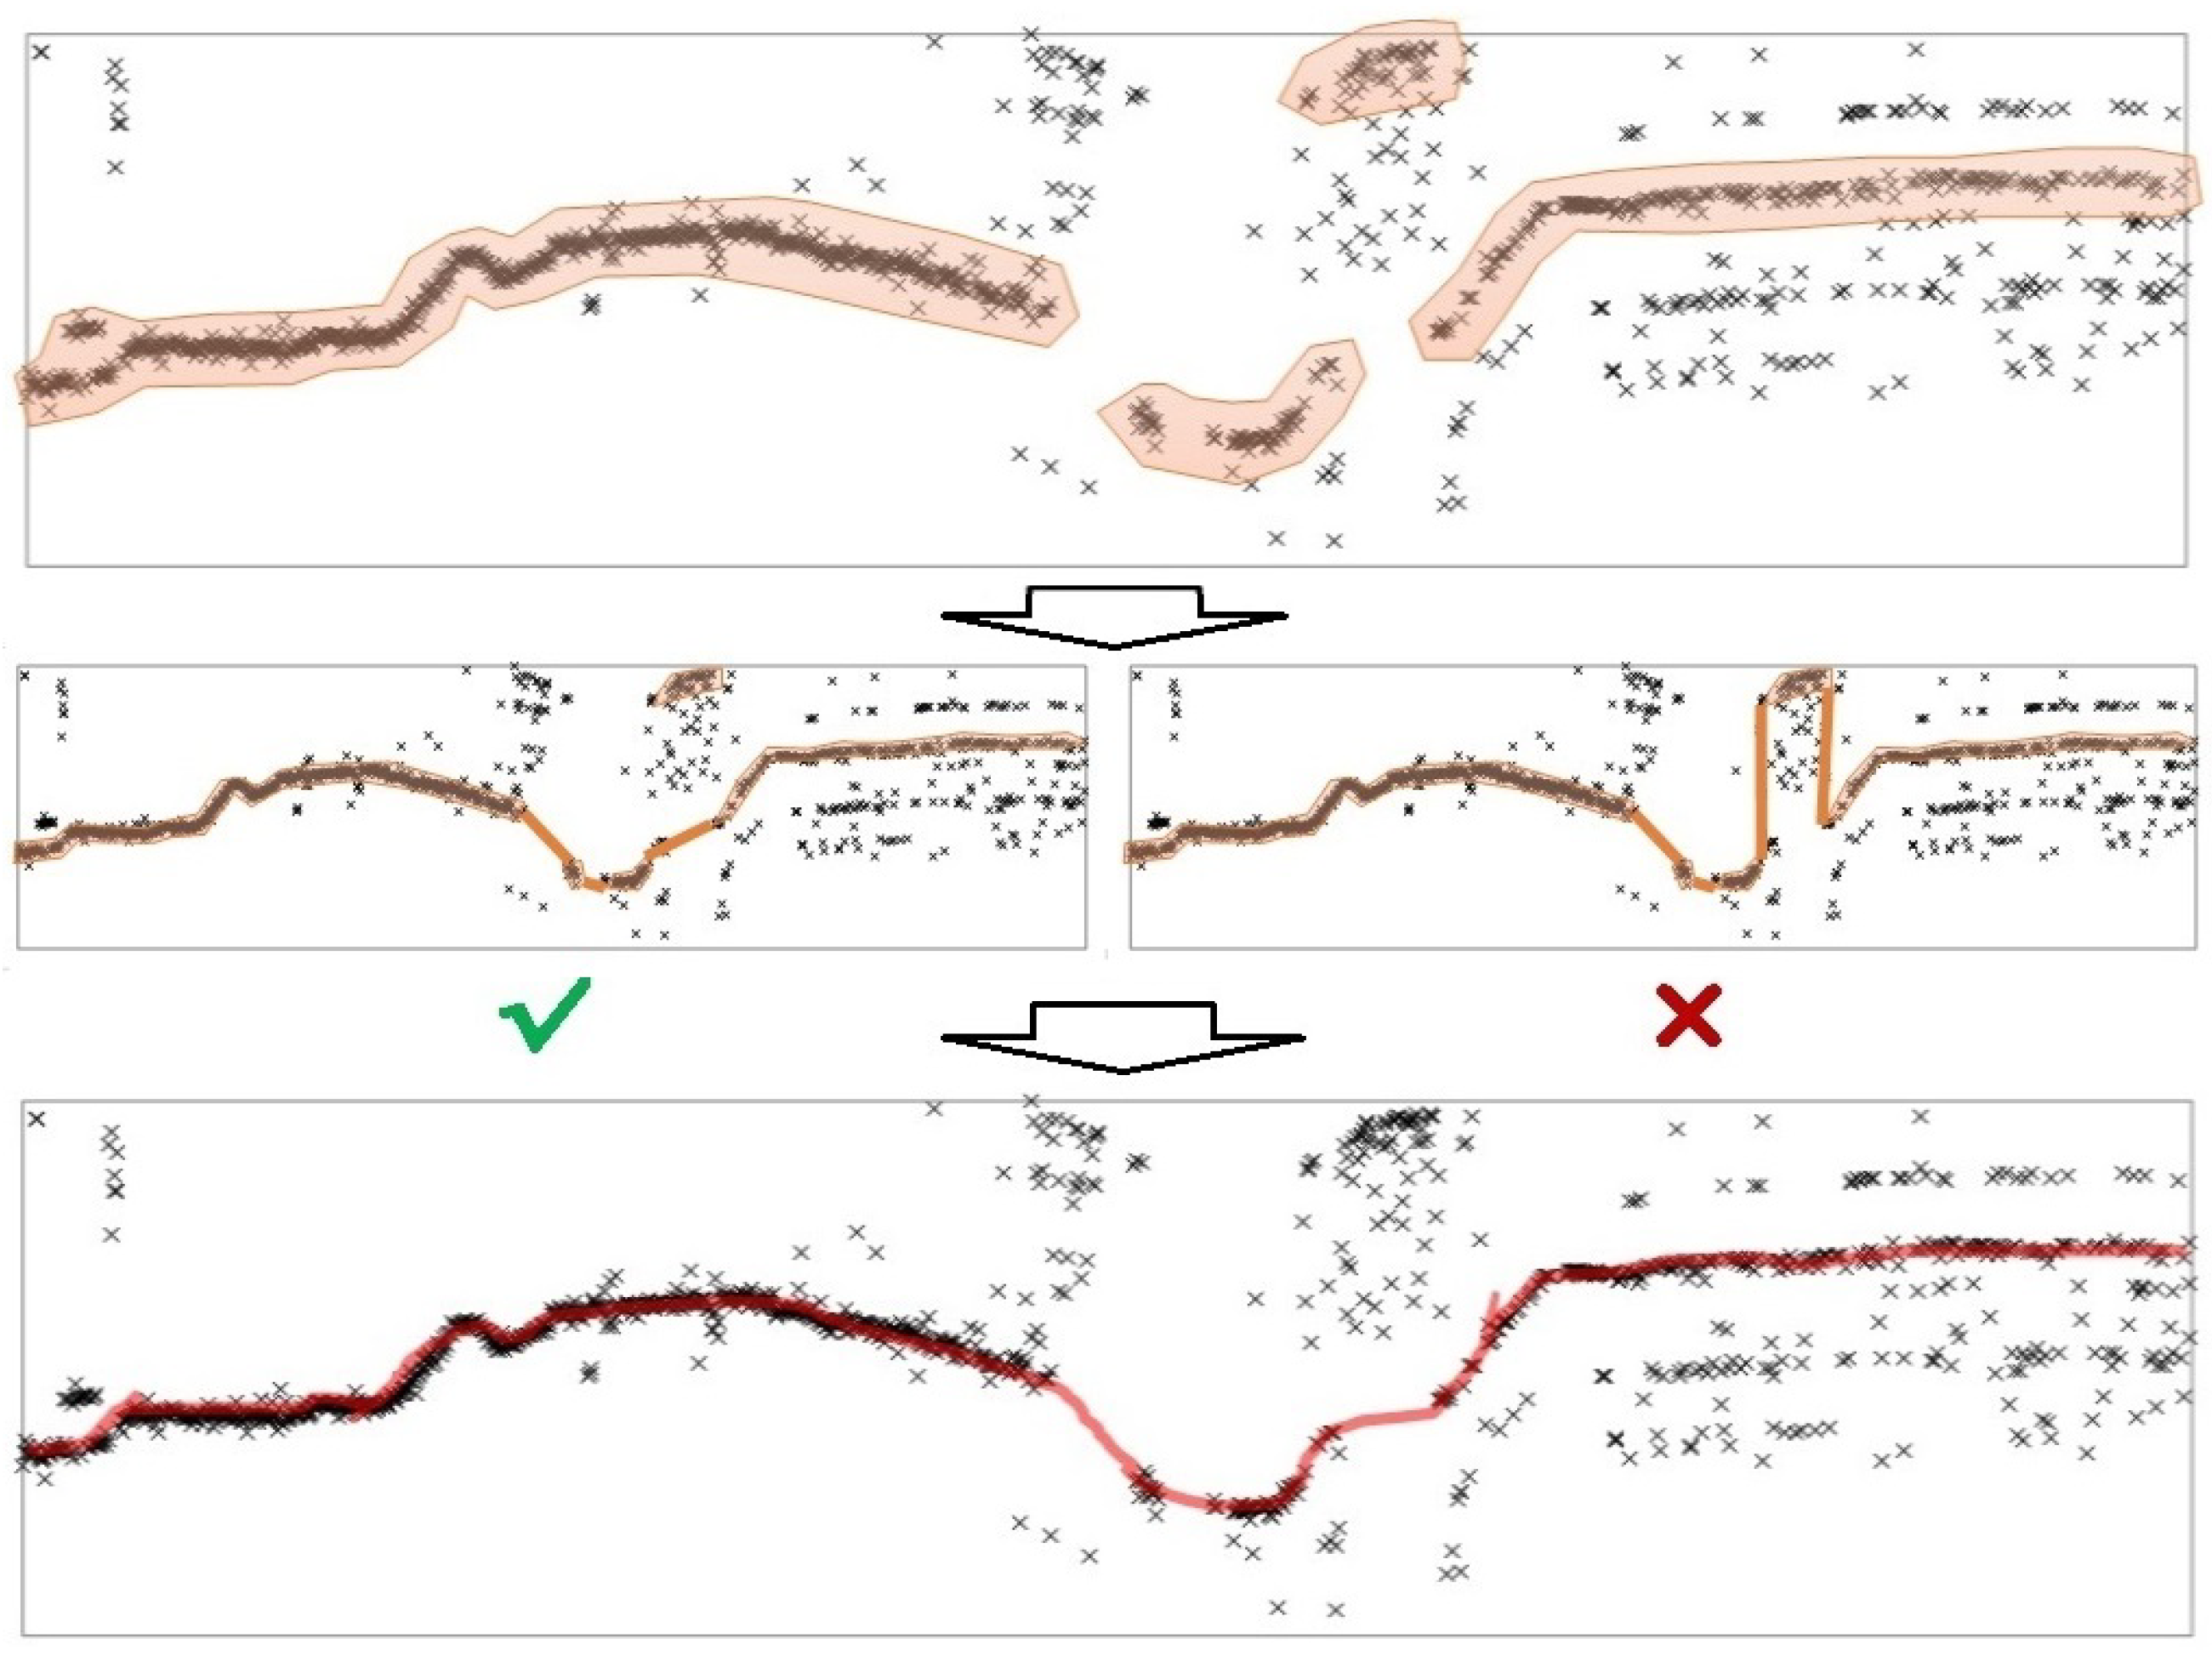
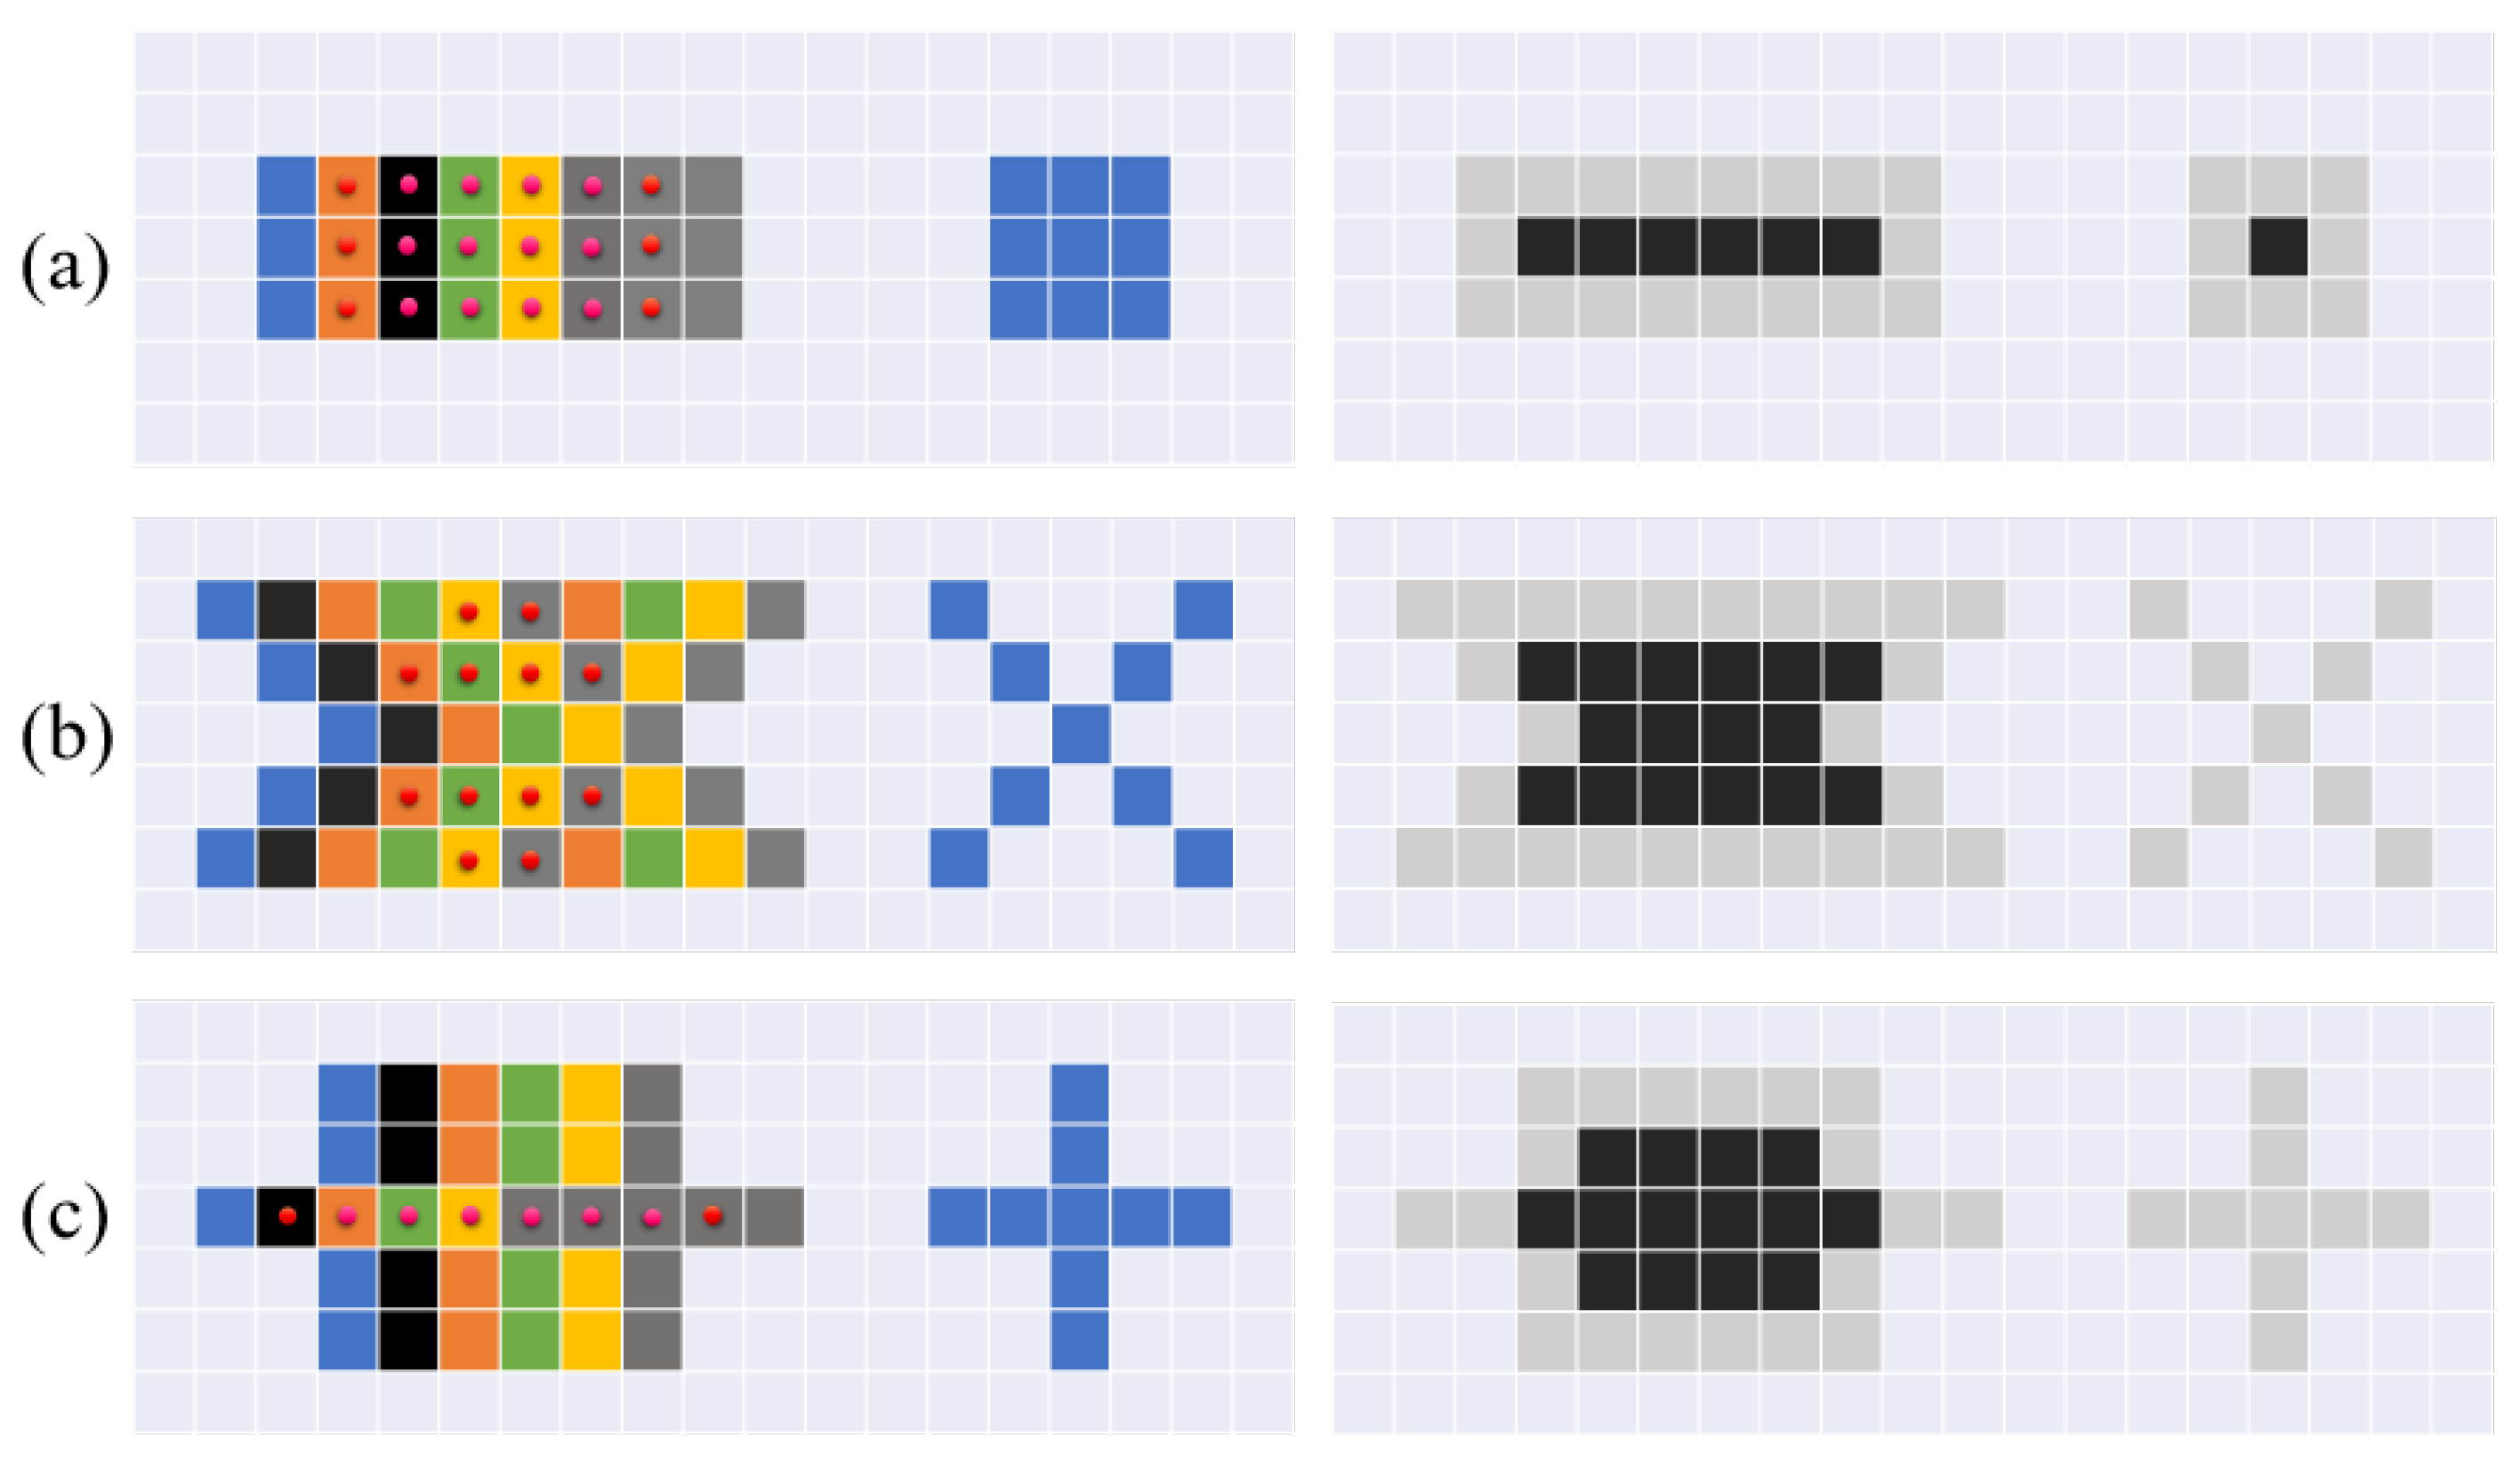
2.2. Process Line Identification Using Cuckoo Search Algorithm
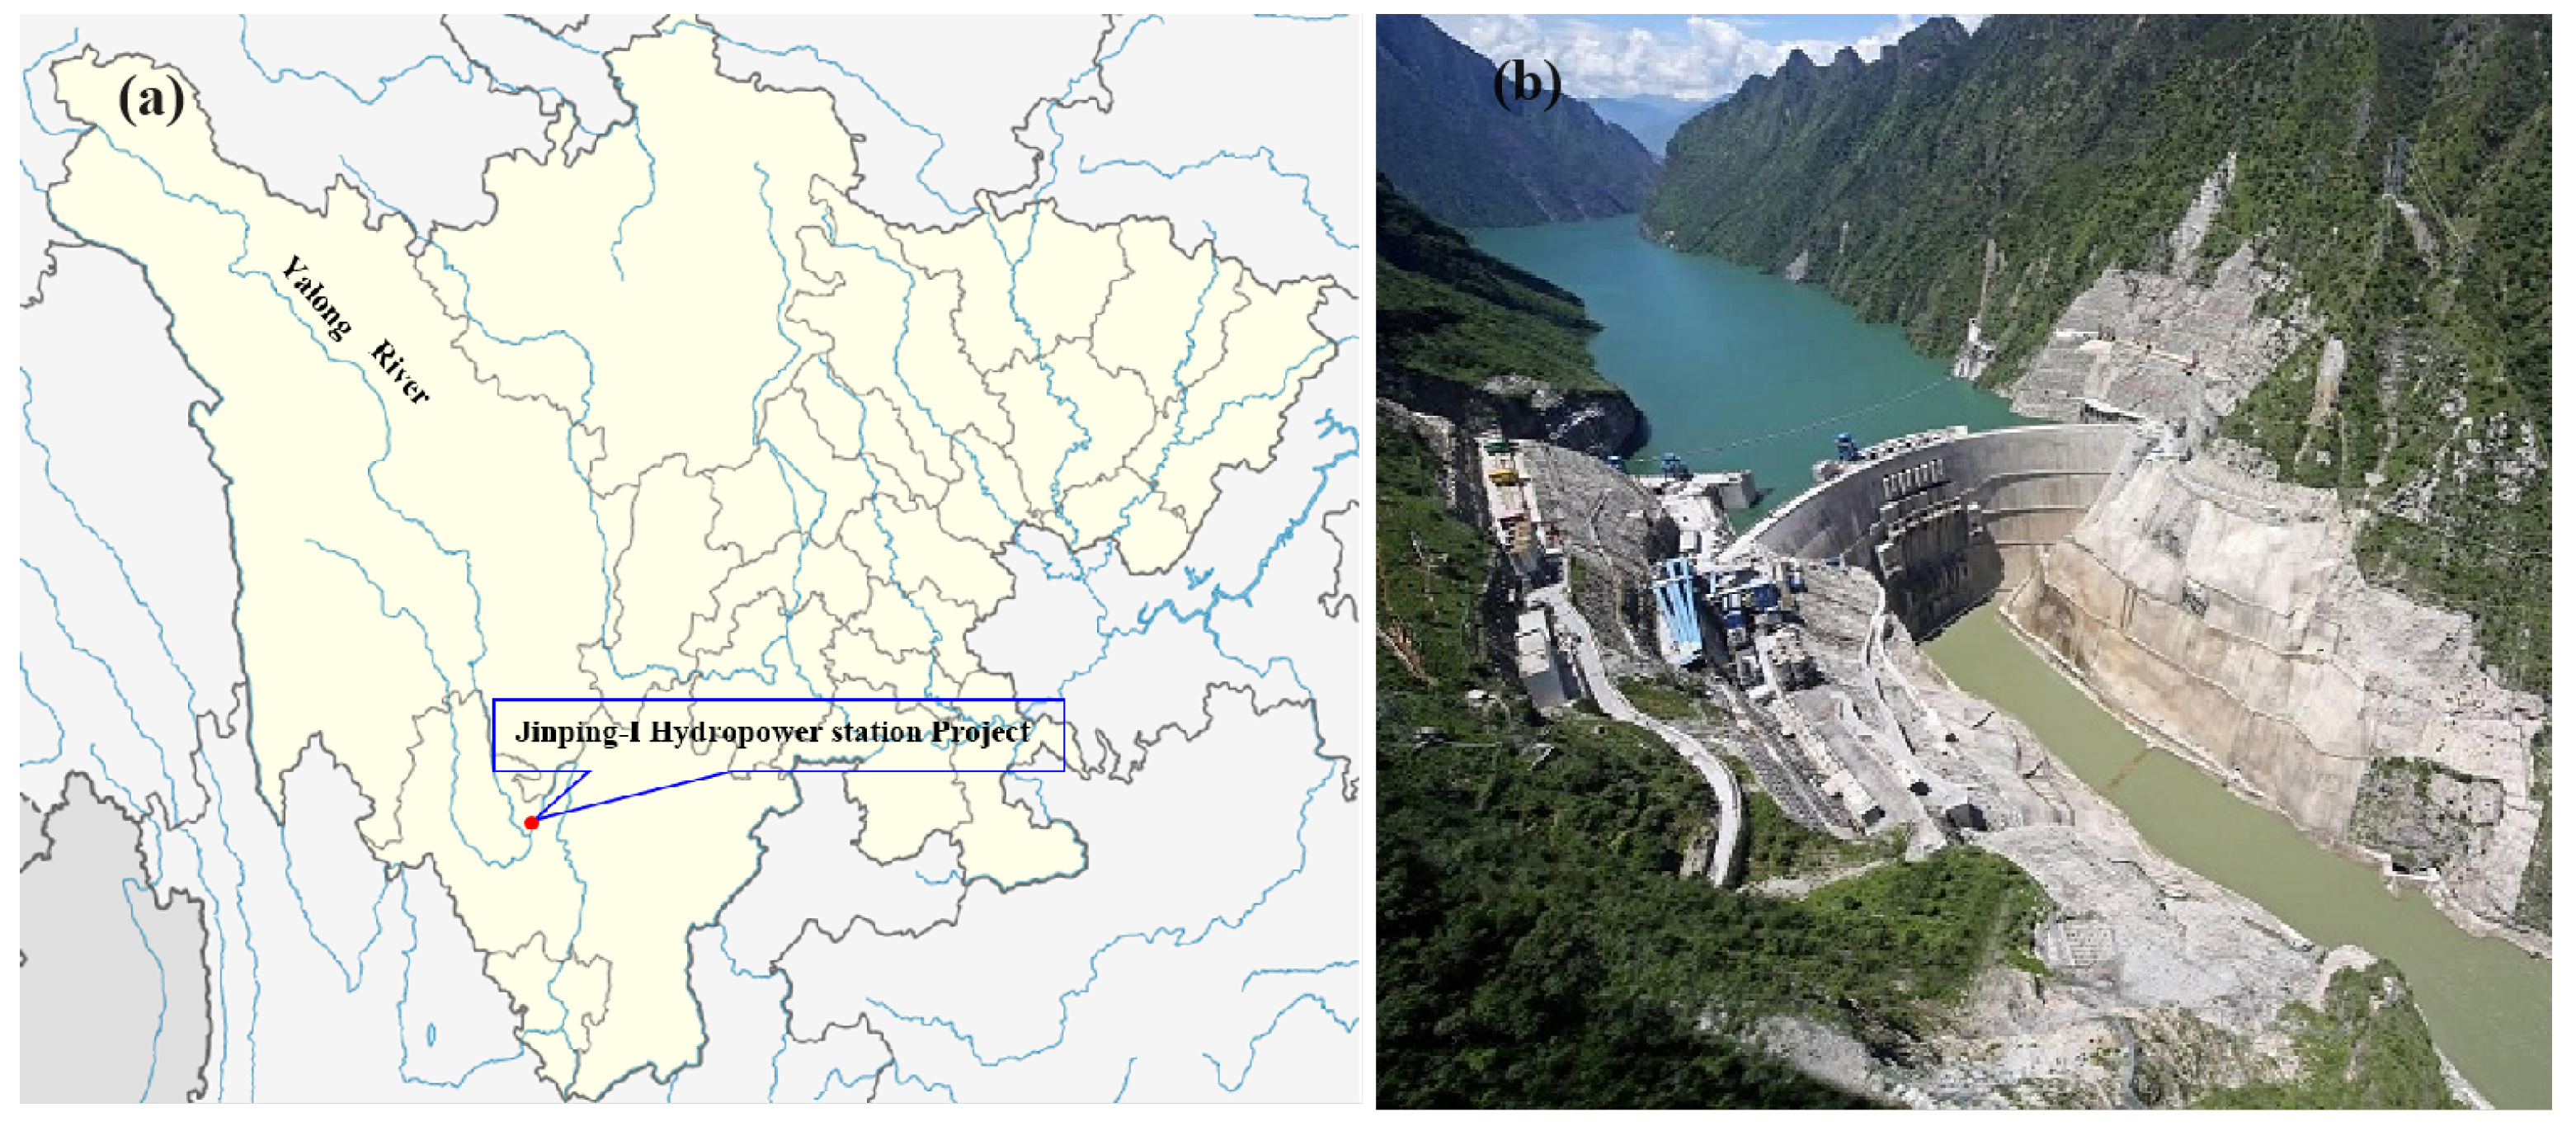
Using Gaussian blur and Ostu binarization, the scatter plot is processed to be a matrix with clusters of pixel. We define the set including all clusters of pixel as C whose expression can be written as:
C = C 1 , C 2 , , C n n = N
The set of all possible combinations of the clusters of pixels ξ can be expressed as:
ξ = C o m b i C i C o m b i , C i C
The objective function of process line is:
F ζ = a 1 j = 1 s x j l x j f + a 2 j = 1 s y j m a x y j m i n b j = 1 s 1 y j + 1 l y j f
where a 1 , a 2 are gain coefficients, b is the loss coefficient, ( x j f , y j l ) denotes the coordinate of the first pixels, ( x j l , y j l ) shows the coordinate of the last pixel, and y j m a x and y j m i n are the maximum and minimum threshold of vertical coordinates. In addition, each C i in a C o m b i obey:
x j 1 b < x j b < x j + 1 b , j = 2 , 3 , , s 1
For arbitrary two pixel clusters C a and C b in C o m b i , x a l < x b l when x b f > x a f . Then, we can consider the process line identification as an optimization question:
max F ( ζ ) s . t . x j 1 b < x j b < x j + 1 b , j = 2 , 3 , , s 1 x a l < x b l , .
The Cuckoo Search algorithm is a stochastic optimization model which is developed based on the brood parasitism of cuckoo birds. Figure 3 shows the flowchart of the Cuckoo Search algorithm.
The algorithm follows three principal rules: (a) Each cuckoo lays only one egg each time and picks one nest to place the egg randomly; (b) The best host nests with the highest-quality eggs is kept in the following generation; (c) The number of available host nests is fixed. Details of the algorithm are as follows:
Step 1: Develop the objective function and determine inputs including the threshold, number of iterations, objective accuracy, etc.
Step 2: Establish the initial generation x 1 , x 2 , , x N randomly. Each cuckoo denotes a dataset of attribute values of continuous point, whose expression can be written as:
N = x 1 x 2 x N F x 1 F x 2 F x N = x 1 e x 1 b y 1 m i n y 1 m a x y 1 e y 1 b x 2 e x 2 b y 2 m i n y 2 m a x y 2 e y 2 b x N e x N b y N m i n y N m a x y N e y N b F x 1 F x 2 F x N
where N is the number of cuckoos. Each cuckoo represents a set of attribute values of continuous points. The best cuckoo x b t and the objective function for each cuckoo are determined in this step.
Step 3: Implement the Levy flight. The expression of Levy flight is:
x i t + 1 = x i t + α L e v y λ i = 1 , 2 , , n
where α denotes the step size, ⊕ denotes the entry-wise multiplications, x i t and x i t + 1 are the positions of t t h and t + 1 t h generations of cuckoos, respectively, and L e v y λ is a random searching vector which follows Levy distribution:
L e v y λ ϕ u v 1 / β ϕ = Γ 1 + β × sin π × β / 2 Γ 1 + β / 2 × β × 2 β 1 / 2 1 / β
where Γ is the Gamma function, u and v are random numbers which follow Gaussian distributions, and β is the parameter of Levy flight. The nests location for the next generation of cuckoos x i t + 1 is given by:
x i t + 1 = x i t + a l p h a 0 ϕ × u v 1 / β x i t x b t
where x b t is the best nest in t t h generation and α 0 is the scaling factor.
Step 4: Eliminate the alien eggs with a probability of P a 0 , 1 . The mathematical expressions can be written as:
x i t + 1 = x i t + r · x r 1 t x r 2 t , i f r < P a x i t , o t h e r w i s e
where r is a random number in the range of 0 to 1 and x r 1 t and x r 2 t are two random nest locations in the t t h generation, respectively.
Step 5: Determine the objective function of renewal nest locations as well as the optimal cuckoo of t + 1 t h generation x b t + 1 . Here, the smaller value between x b t + 1 and x b t is kept as the t + 1 t h optimal cuckoo.
Step 6: Repeat Step 3 and 4 until the number of iteration other termination criteria reach the set values.
Step 7: To enhance the effect of detecting outliers, the procedure combination needs to be implemented cyclic until the result satisfies the requirement. The threshold of R y and R y are:
R y m a x = m a x y 1 , y 2 , , y m , R y m i n = m i n y 1 , y 2 , , y m
R y m a x = m a x y 1 , y 2 , , y n , R y m i n = m i n y 1 , y 2 , , y n
where m counts the number of the pixel clusters in raw data and n counts the number of pixel clusters in processed data. The processed data can be validated once R y m a x = R y m a x and R y m i n = R y m i n .
Figure 4 shows the example of process line detection.

3. Dataset

In this study, we used the monitoring data of the dam at Jinping-I hydropower station as the dataset. The dam is located at Yalong River, Sichuan Province, China, and famous as being one of the highest concrete arch dam worldwide. The elevation of the dam’s crest is 1885 m and that of the dam’s foundation is 1580 m. The normal impounded water level is 1880 m. Figure 5a,b show the geological location and the photo of the dam, respectively.
As shown in Figure 6, the monitoring points were well distributed on the cross section of the dam. As the dataset, we used displacement monitoring data of six selected monitoring points which located on three different plumb lines. The selected monitoring points PL11-1, PL11-3, PL13-1, PL13-3, PL16-1, and PL16-3 are highlighted by red square in Figure 6. The data sequence was separated into two parts, where 80% of the dataset was used to test the detection ability (data during the period 1 July 2017 to 30 February 2018) and 20% of the dataset was used to evaluate the prediction performance (from 1 March 2018 to 30 May 2018).

4. Results

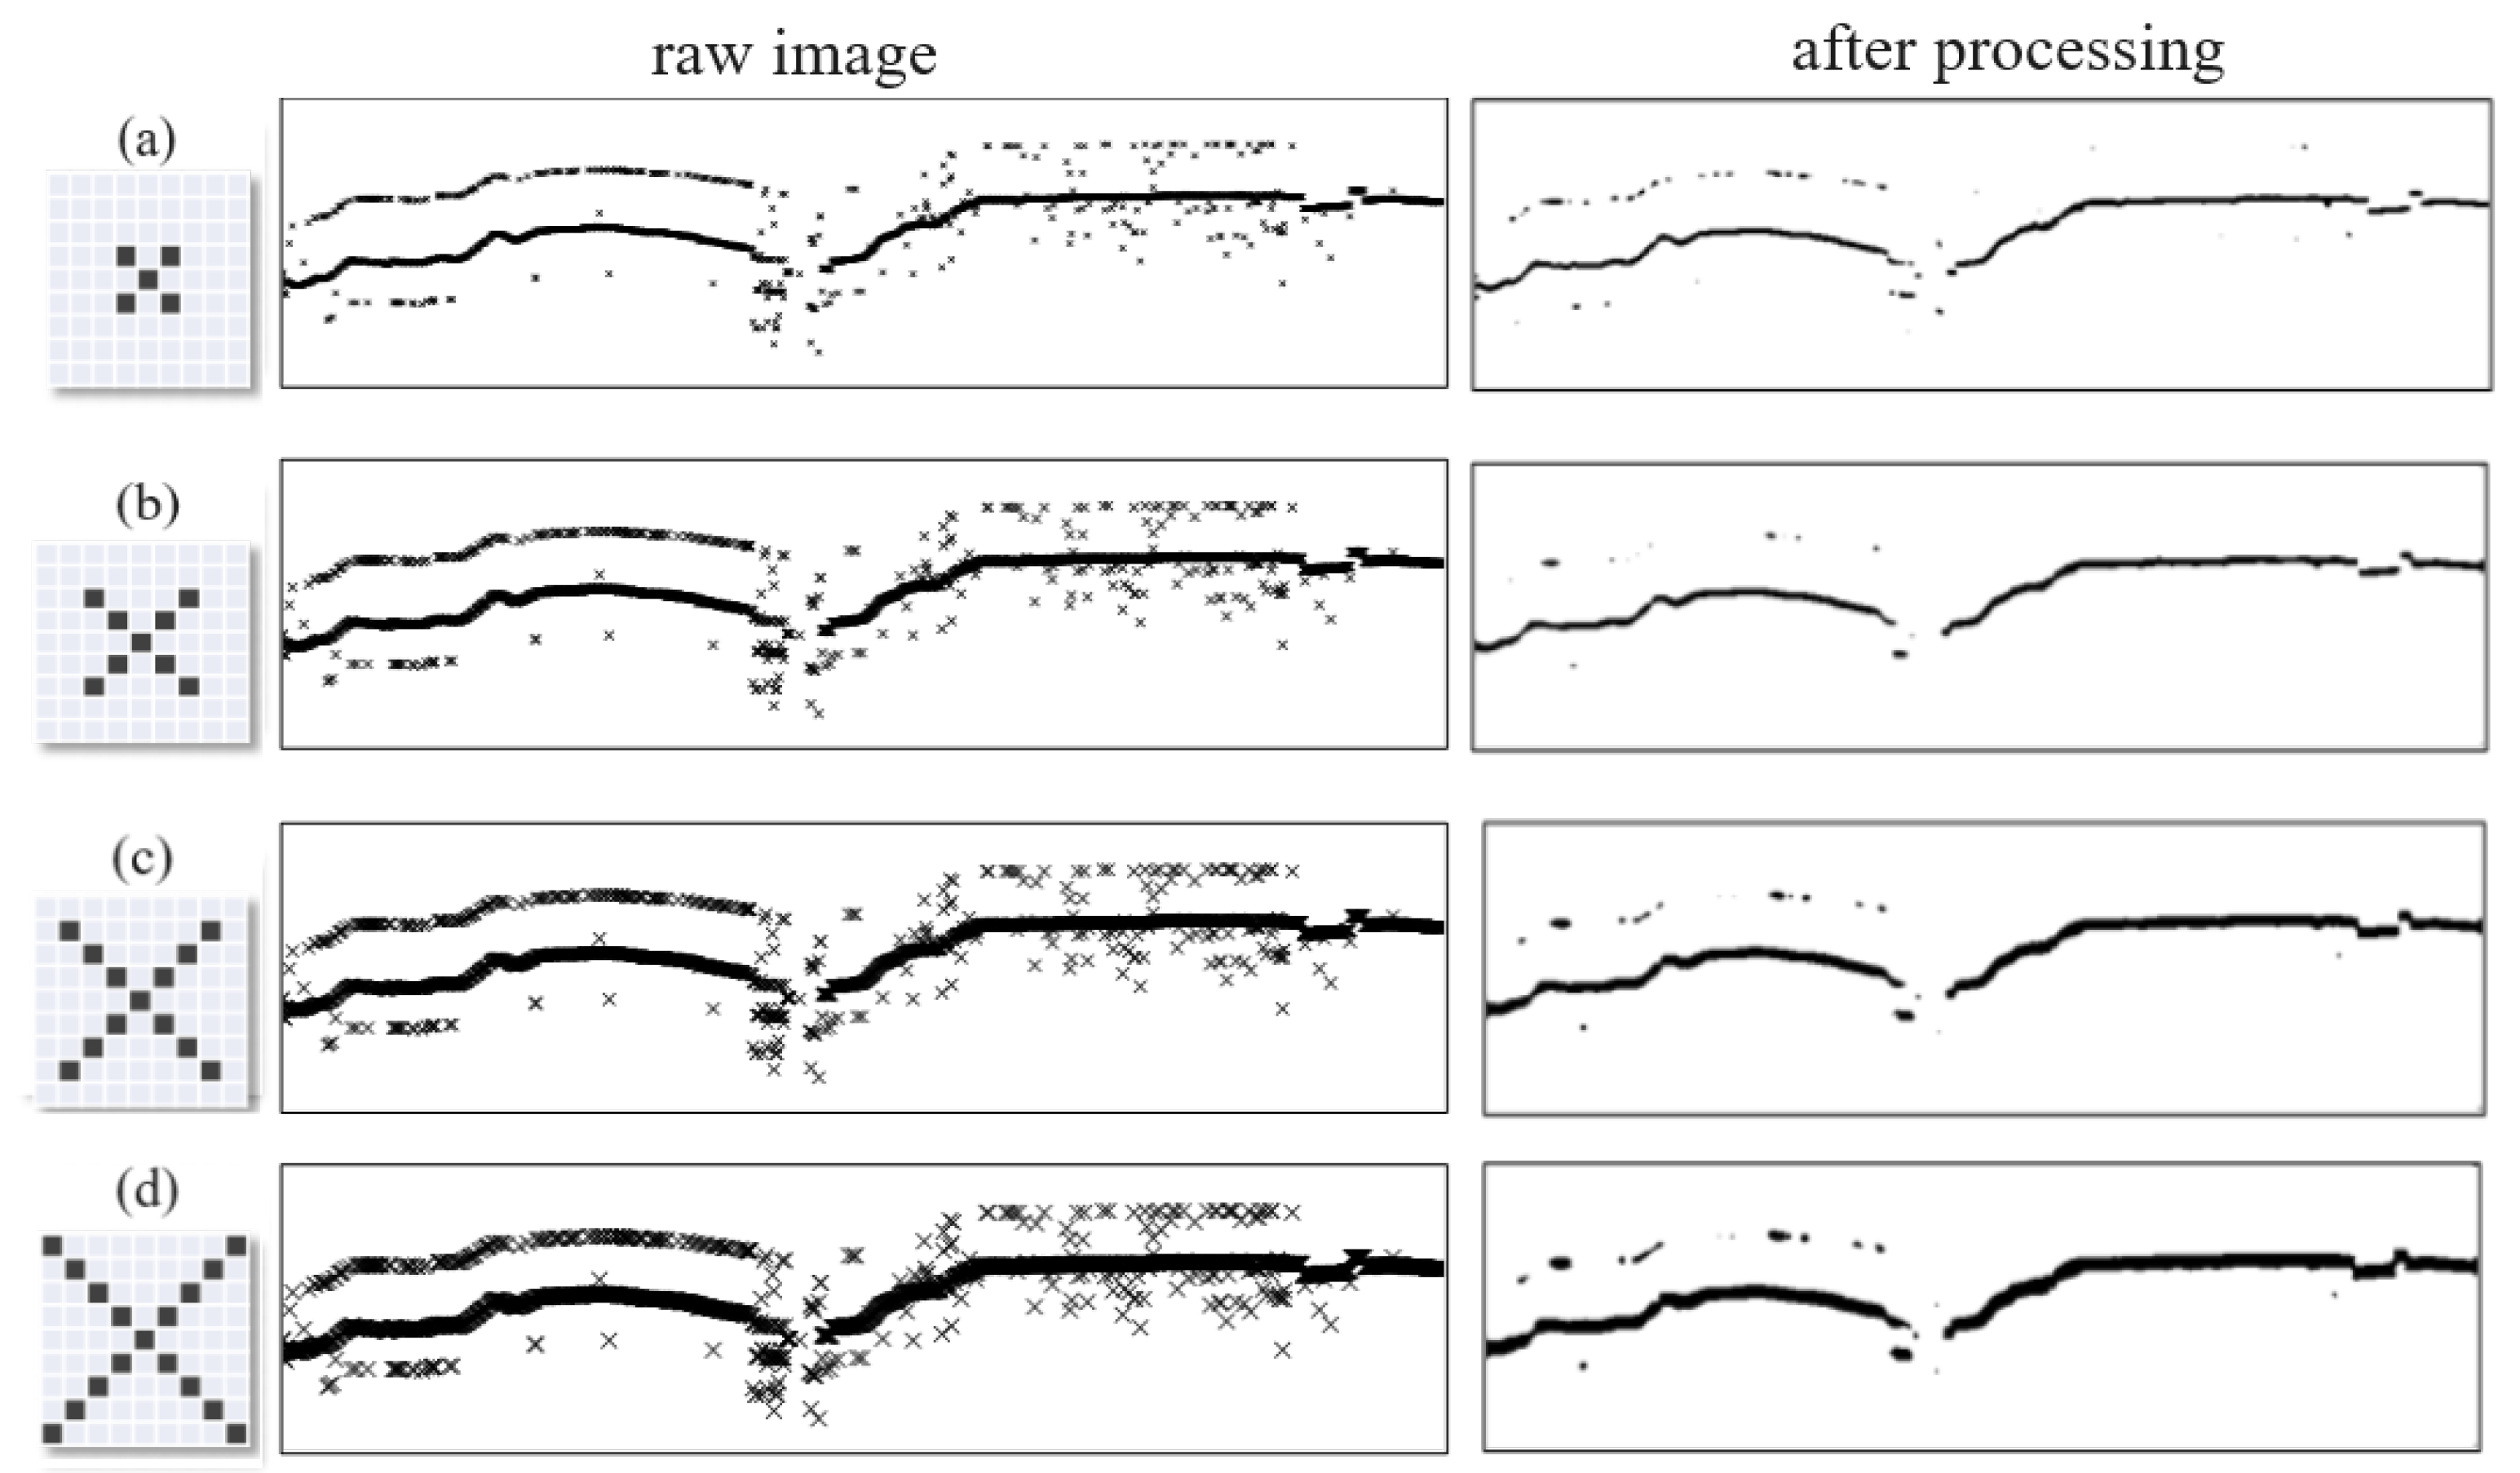
4.1. Optimal Settings of the Scatter Plot of the Original Data

For the data processing method based on matrix manipulation and Cuckoo Search algorithm, the first step is to generate a scatter plot of the original data. Then, the scatter plot is considered an image and the matrix of the image is exported. Attributes of scatter such as shape and size affect the performance of matrix manipulation including Gaussian blur and Ostu binarization. Thus, we first determine the optimal settings of attributes of scatters. Figure 7 shows the stack of patterns with different shapes including square, cross, and isscross. All these three patterns have nine pixels. It can be seen from the figure that when the patterns stacks together, the cross pattern could keep more information as compared with the square pattern and isscross pattern.
To obtain the optimal settings of the attributes of scatters, we constructed a scatter plot of a sample data sequence using four different shapes of scatters (circle, square, cross, and isscross) with the same size, and compared the filtering performance of Gaussian blur and Ostu binarization. Figure 8a–d exhibit the plots processed by Gaussian blur and Ostu binarization using a circle, square, cross, and isscross as scatters, respectively.
It can be seen from the figure that the data processing using cross as the scatter shape has the best performance in outlier detection. Using cross as the scatter shape, more outliers are eliminated, and the clusters of continuous points are identified. Comparing with the square and isscross, cross patterns have more dispersing distributed pixels. Using cross as the scatter shape, the gray scale of isolated outliers can be reduced more intensely by Gaussian blur, and thus, the outlier can be easier eliminated by the filter. In addition, using a circle and square as scatter shapes, the outliers detection performance is significantly worse than that of cross and isscross. The detection performance of scatter plots using a cross is slightly higher than using isscross. Therefore, we selected cross as the shape of scatter in the data preprocessing using Gaussian blur and Ostu binarization.
As the shape of scatters have been selected, the size of the scatters should be determined. To determine the optimal set of scatter size, we compare the outlier detection performance of scatter plot using cross scatter with four different sizes. As shown in Figure 9, the number of pixels of these four sizes are 5, 9, 13, and 17, respectively. Comparing Figure 9 with Figure 8a,b, using a cross with five pixels, the detection performance is similar to those using a circle and square as scatter shapes. This is because when the size of the cross is small, the pixels are centrally distributed, that is, the micro shape is similar to a circle and square. When the size of the cross is increased, the scatter is less centralized distributed. The cross with nine pixels has the best performance in outlier detection, that is, more outliers are detected and eliminated after the data processing. Therefore, a nine-pixels cross is the optimal size and shape.

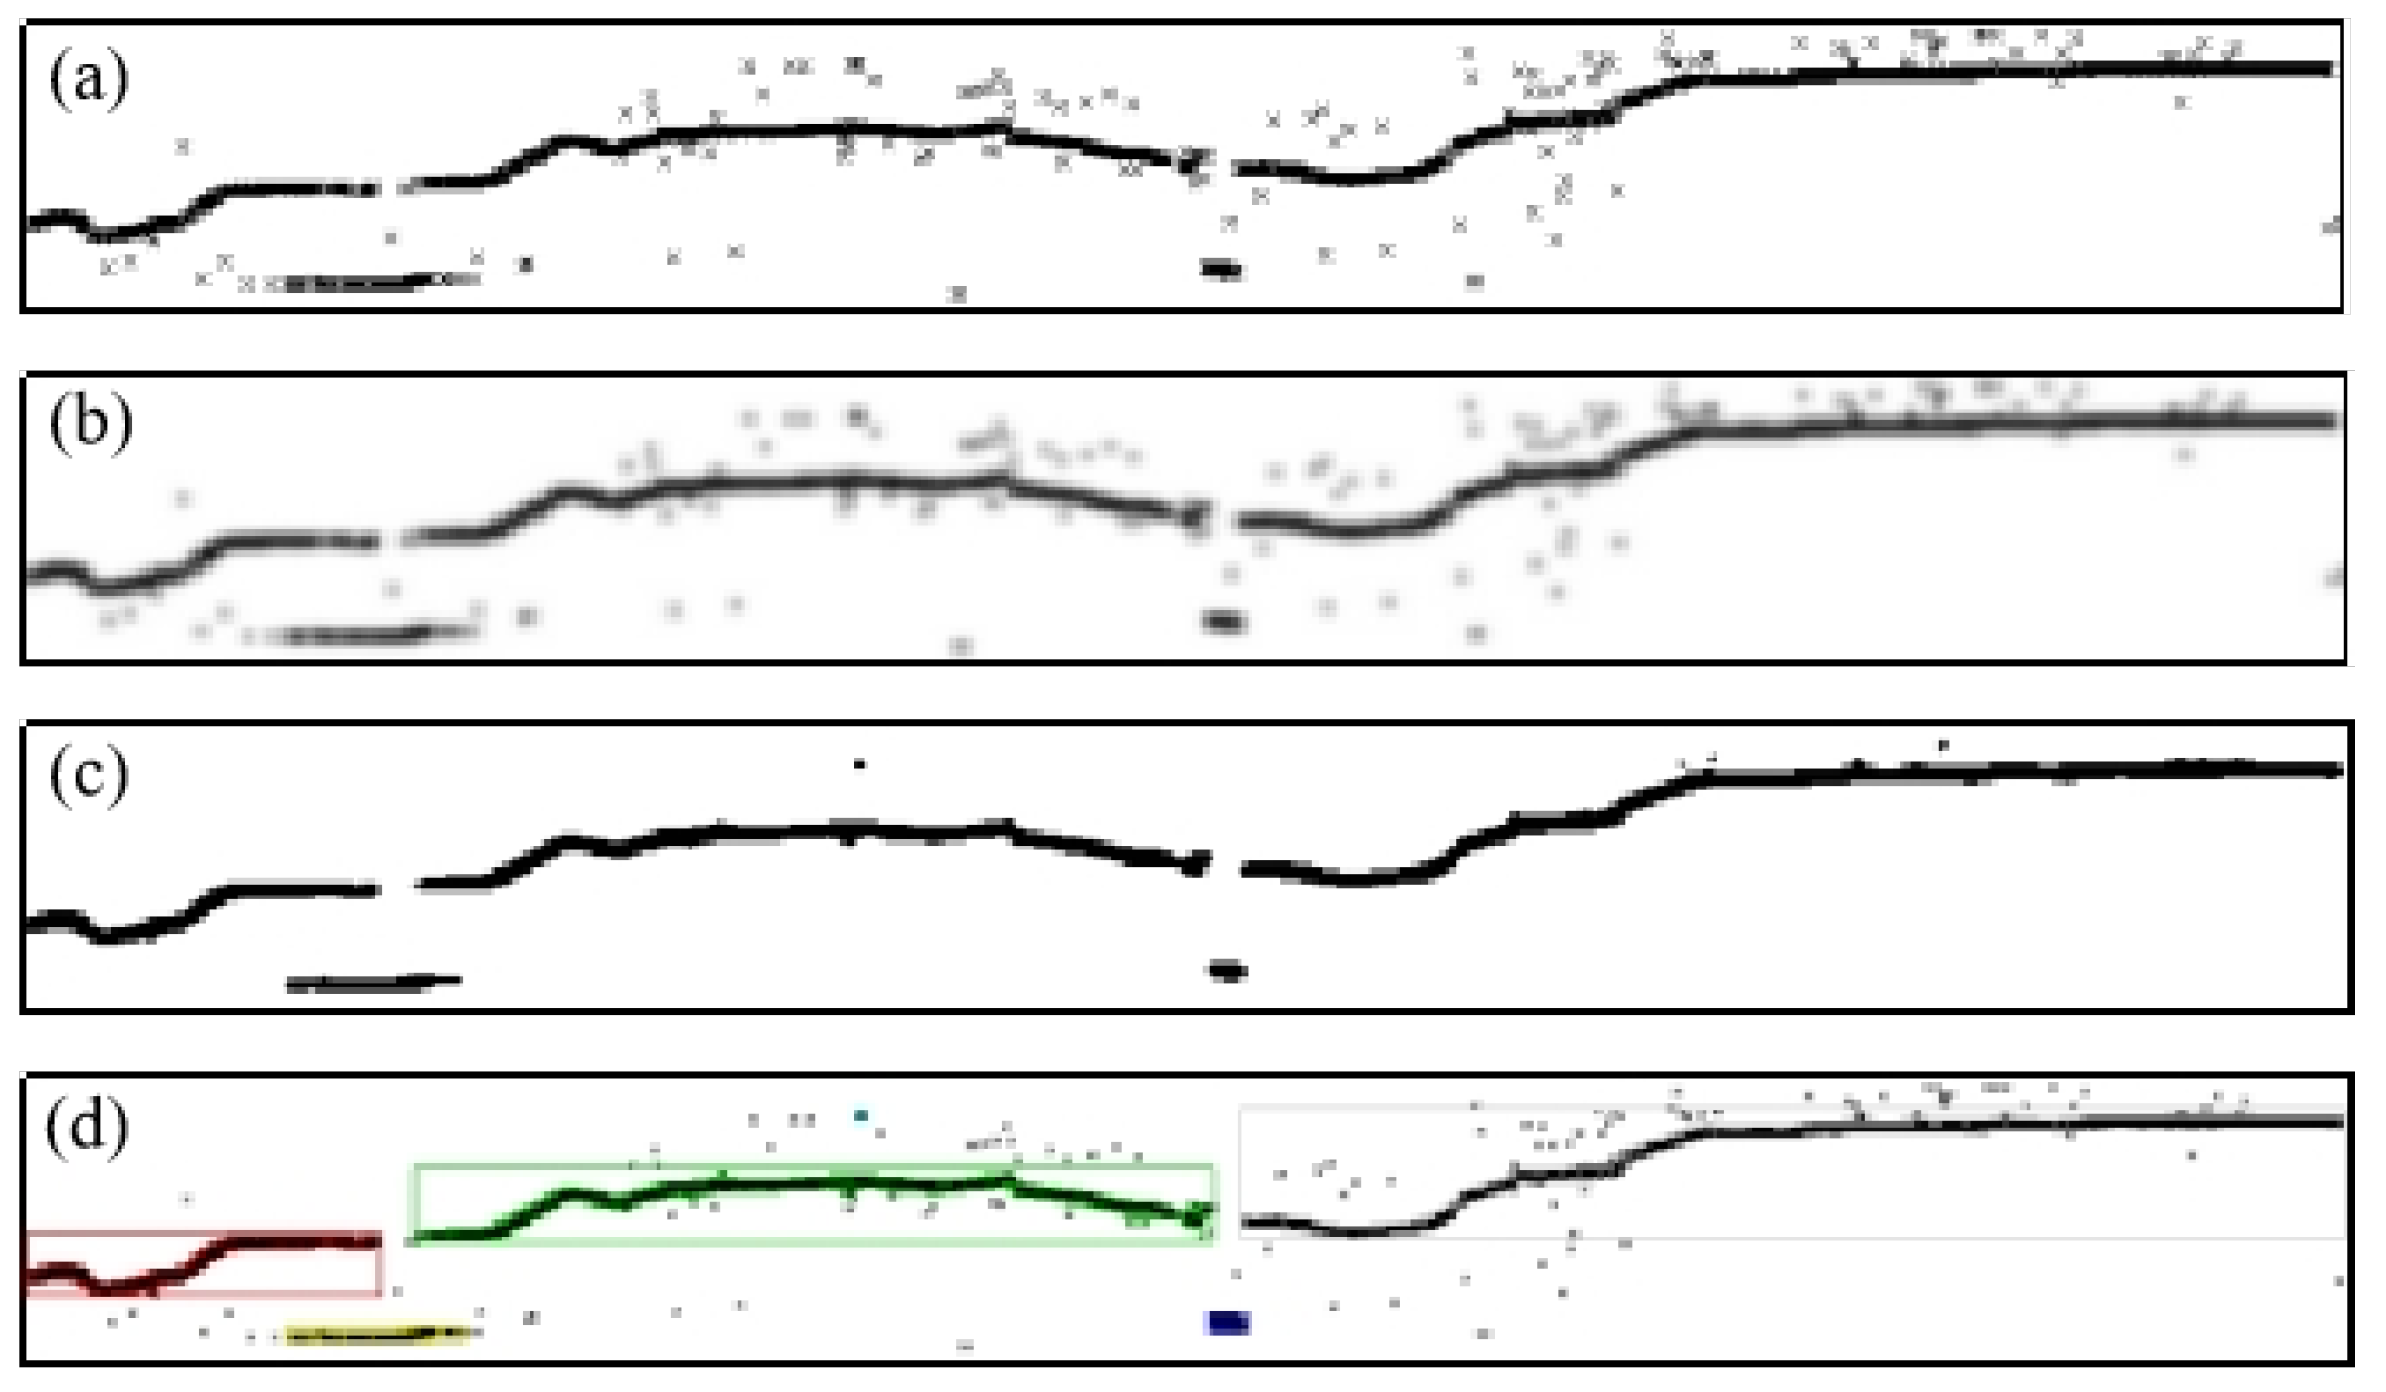
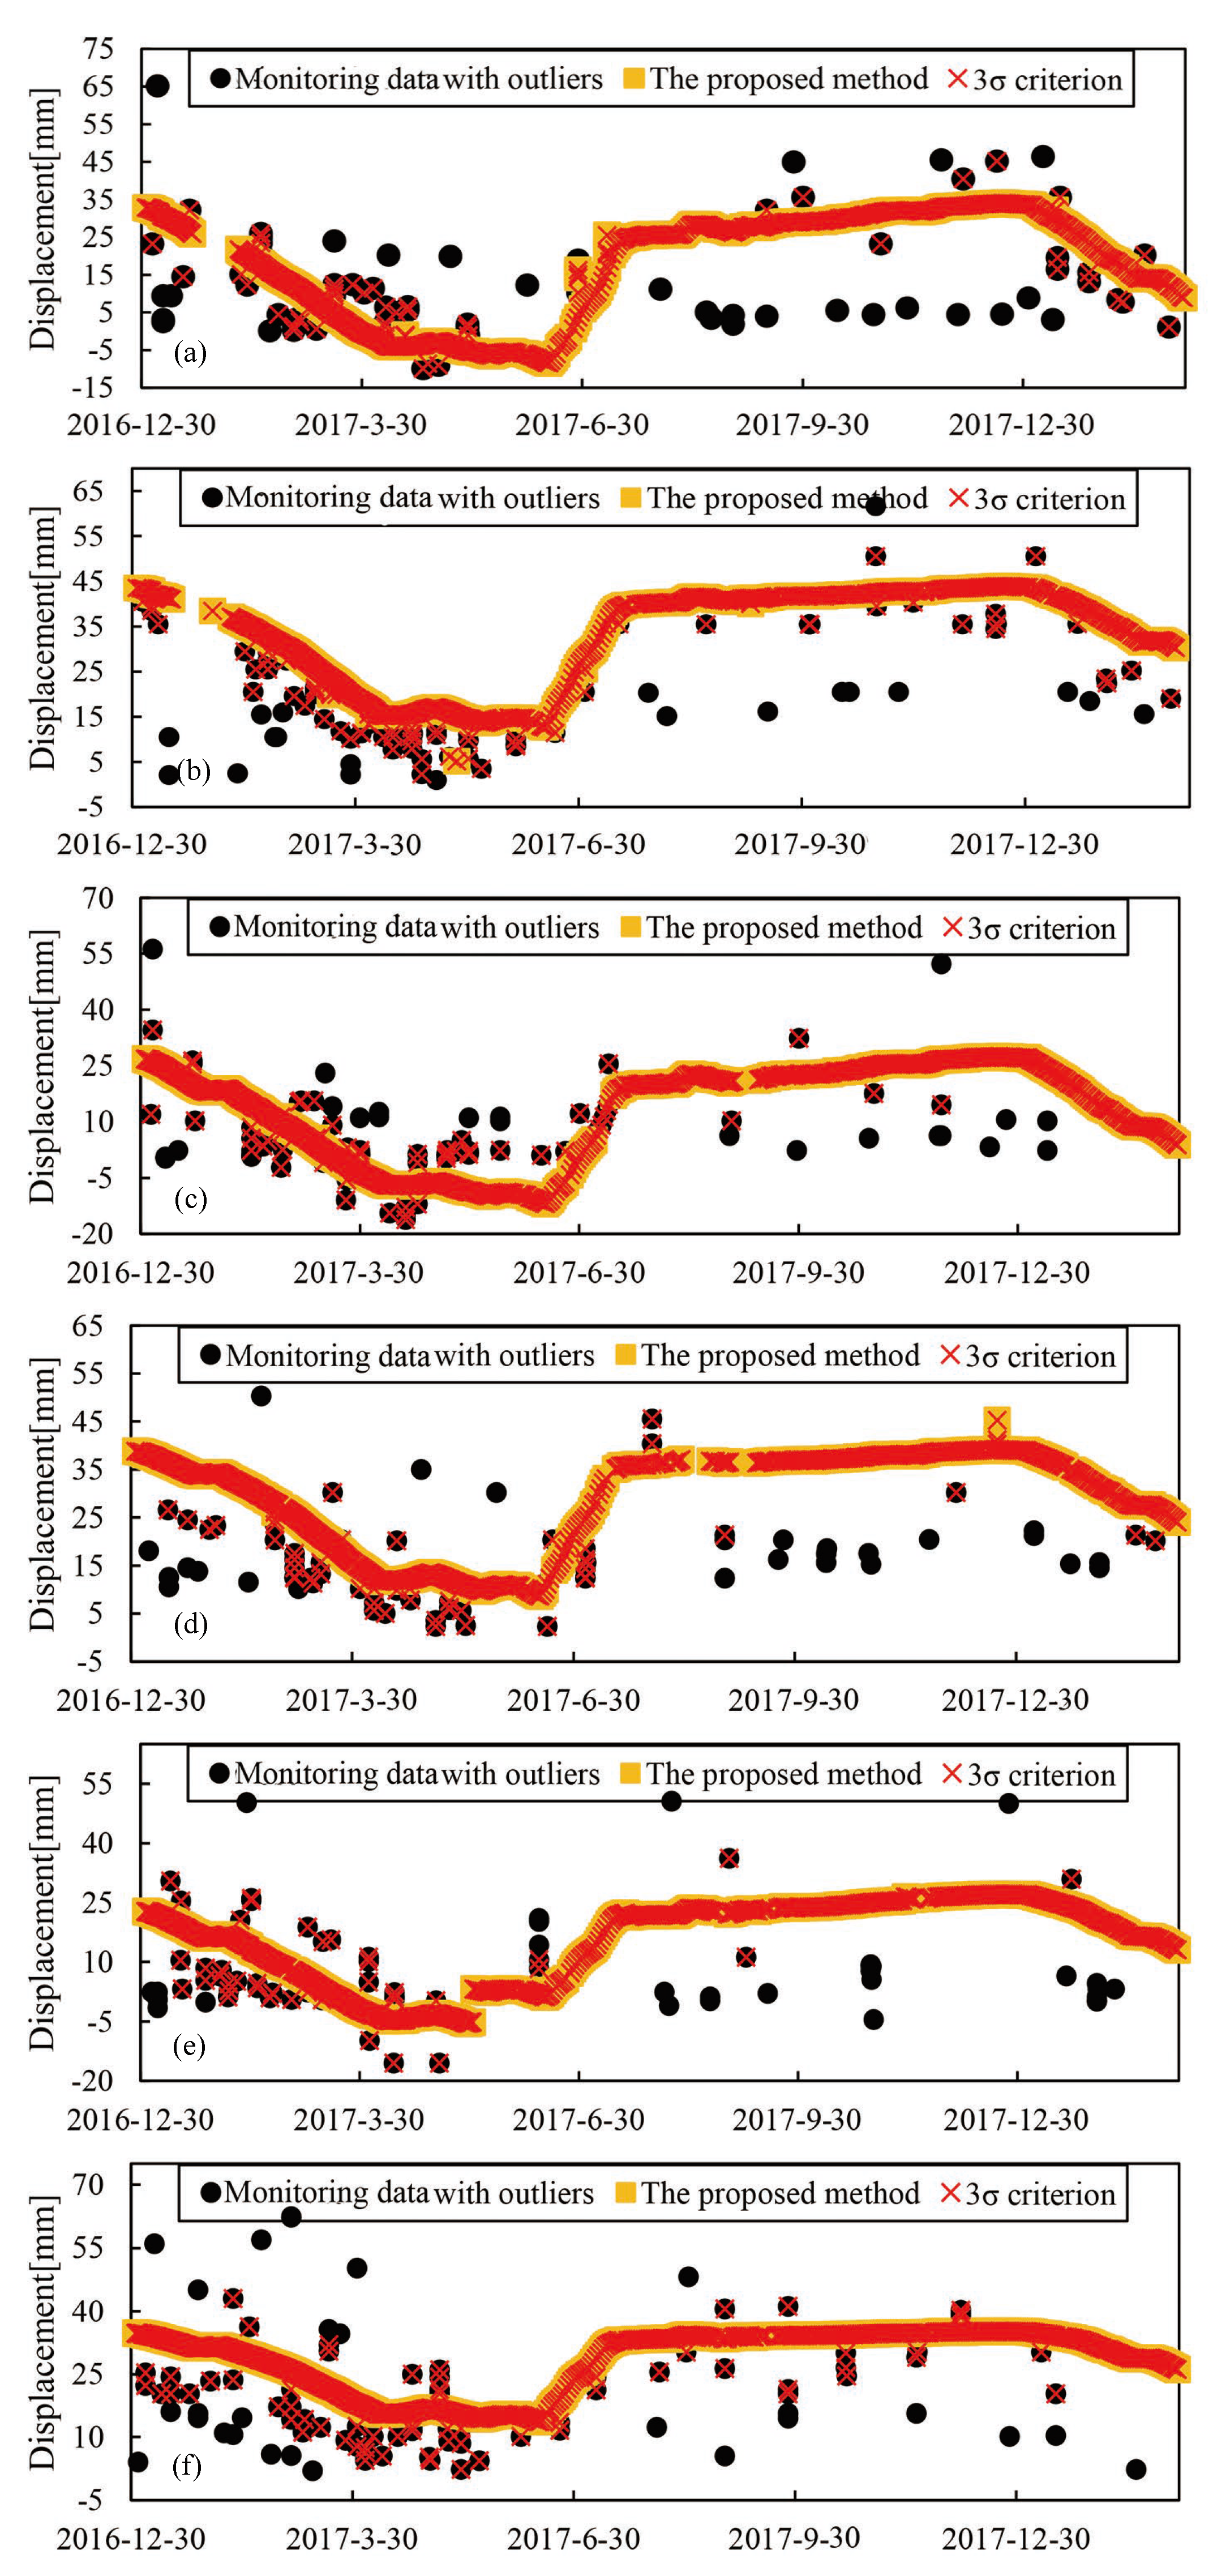
4.2. Results of Abnormal Data Detection Based on the Proposed Method

According to the analysis in Section 4.1, a cross of nine pixels is selected as the scatter in the pre-processing procedure using Gaussian blur and Ostu binarization. For the process line identification using the Cuckoo Search algorithm, Levy flight β is set to 2.0 and the discard probability P a is set to 0.2.
Using the sample data sequence as an example, Figure 10 shows the whole procedure of the proposed method, which combines matrix manipulation and the Cuckoo Search algorithm. As presented in Section 2, the processing procedure of the proposed method consists of three steps: (1) Gaussian blur, (2) Ostu binarization, and (3) process line identification using the Cuckoo Search algorithm.
Displacement monitoring datasets of the six selected monitoring points installed in the dam at Jinping-I hydropower station are used to validate the propose method. Here, in order to verify the processing ability of the proposed method, we added the numbers of outliers in the original dataset, so as to increase the detection difficulty. We then use the proposed method to detect and eliminate outliers in the data sequence. Table 1 shows the total data number N t and number of outliers N d detected by the proposed method for each monitoring point.

4.3. Comparison of the Proposed Method with 3- σ Method

To evaluate the efficiency of the proposed method, we process the same dataset using the 3- σ method, which is a classical method in outlier detection, combining multidimensional regression and 3- σ criterion.
The factors dominating the displacement of dam includes three components: the hydrostatic component δ H , the temperature component δ T , and the aging component δ θ . The expressions of δ H , δ T , and δ θ are as follows:
δ H = i = 0 4 a i H i
δ T = j = 1 4 b j T j
δ θ = c 1 θ + c 2 ln θ
where H is the upstream water level, T j is the external temperature, and θ = t 100 and t is time. The displacement δ can be written as:
δ = a 0 + i = 1 4 a i H i + j = 1 4 b j T j + c 1 θ + c 2 ln θ
where a 0 , a i , b j , c 1 , and c 2 are the coefficients of explanatory variables and can be solved using the least square regression method.
According to the principle of the 3- σ method, the probability of the absolute error between modeling data and original data | ε | less than 3 σ is 99.7%. Here, σ is the residual standard deviation whose expression can be written as:
σ = i = 1 n Y i Y ^ i 2 n k 1
where n is the data number of the dataset, k is the degree of freedom of the model, and Y i and Y ^ i denote the monitoring data sequence and modeling data sequence, respectively.
We suppose that outliers should have a large deviation from the modeling displacement. Thus, 3 σ can be used as the threshold for outlier detection. That is, the monitoring data are regarded as outliers once | ε | exceeds 3 σ . The mathematical descriptions can be written as:
ε > 3 σ Y i i s o u t l i e r ε 3 σ Y i i s v a l i d v a l u e
where:
ε = Y i Y ^ i
Figure 11 compares the outlier detection results obtained by the 3- σ method and the proposed method. Black dots present the original data sequence without outlier detection, and the black dots without marks present outliers detected by the 3- σ method and the proposed method. Red cross and yellow square denote outliers detected by 3- σ method and the proposed method, respectively. For the 3- σ method, only outliers located in the area between monitoring data and modeling data exceeds 3- σ can be detected. Outliers located in the surrounding areas of the process line can not be eliminated. Compared with the 3- σ method, the proposed method has a better performance. It can detect most outliers existing in all these six data sequences.
We defined the ratio of number of detected outliers N d to number of outliers N o as detection ratio r d :
r d = N d N o
Table 2 exhibits the number of detected outliers detected N d and the detection ratio r d of each monitoring point for the proposed method and 3 σ method. The average of r d is 32.22% for the 3- σ method and 9% for the proposed method. Using the 3- σ method, r d ranges between 26.37% and 51.42% for all monitoring points. Using the proposed method, r d ranges between 87.20% and 100% for all monitoring points. In general, the proposed method has a significantly higher performance in outlier detection than the 3- σ method.

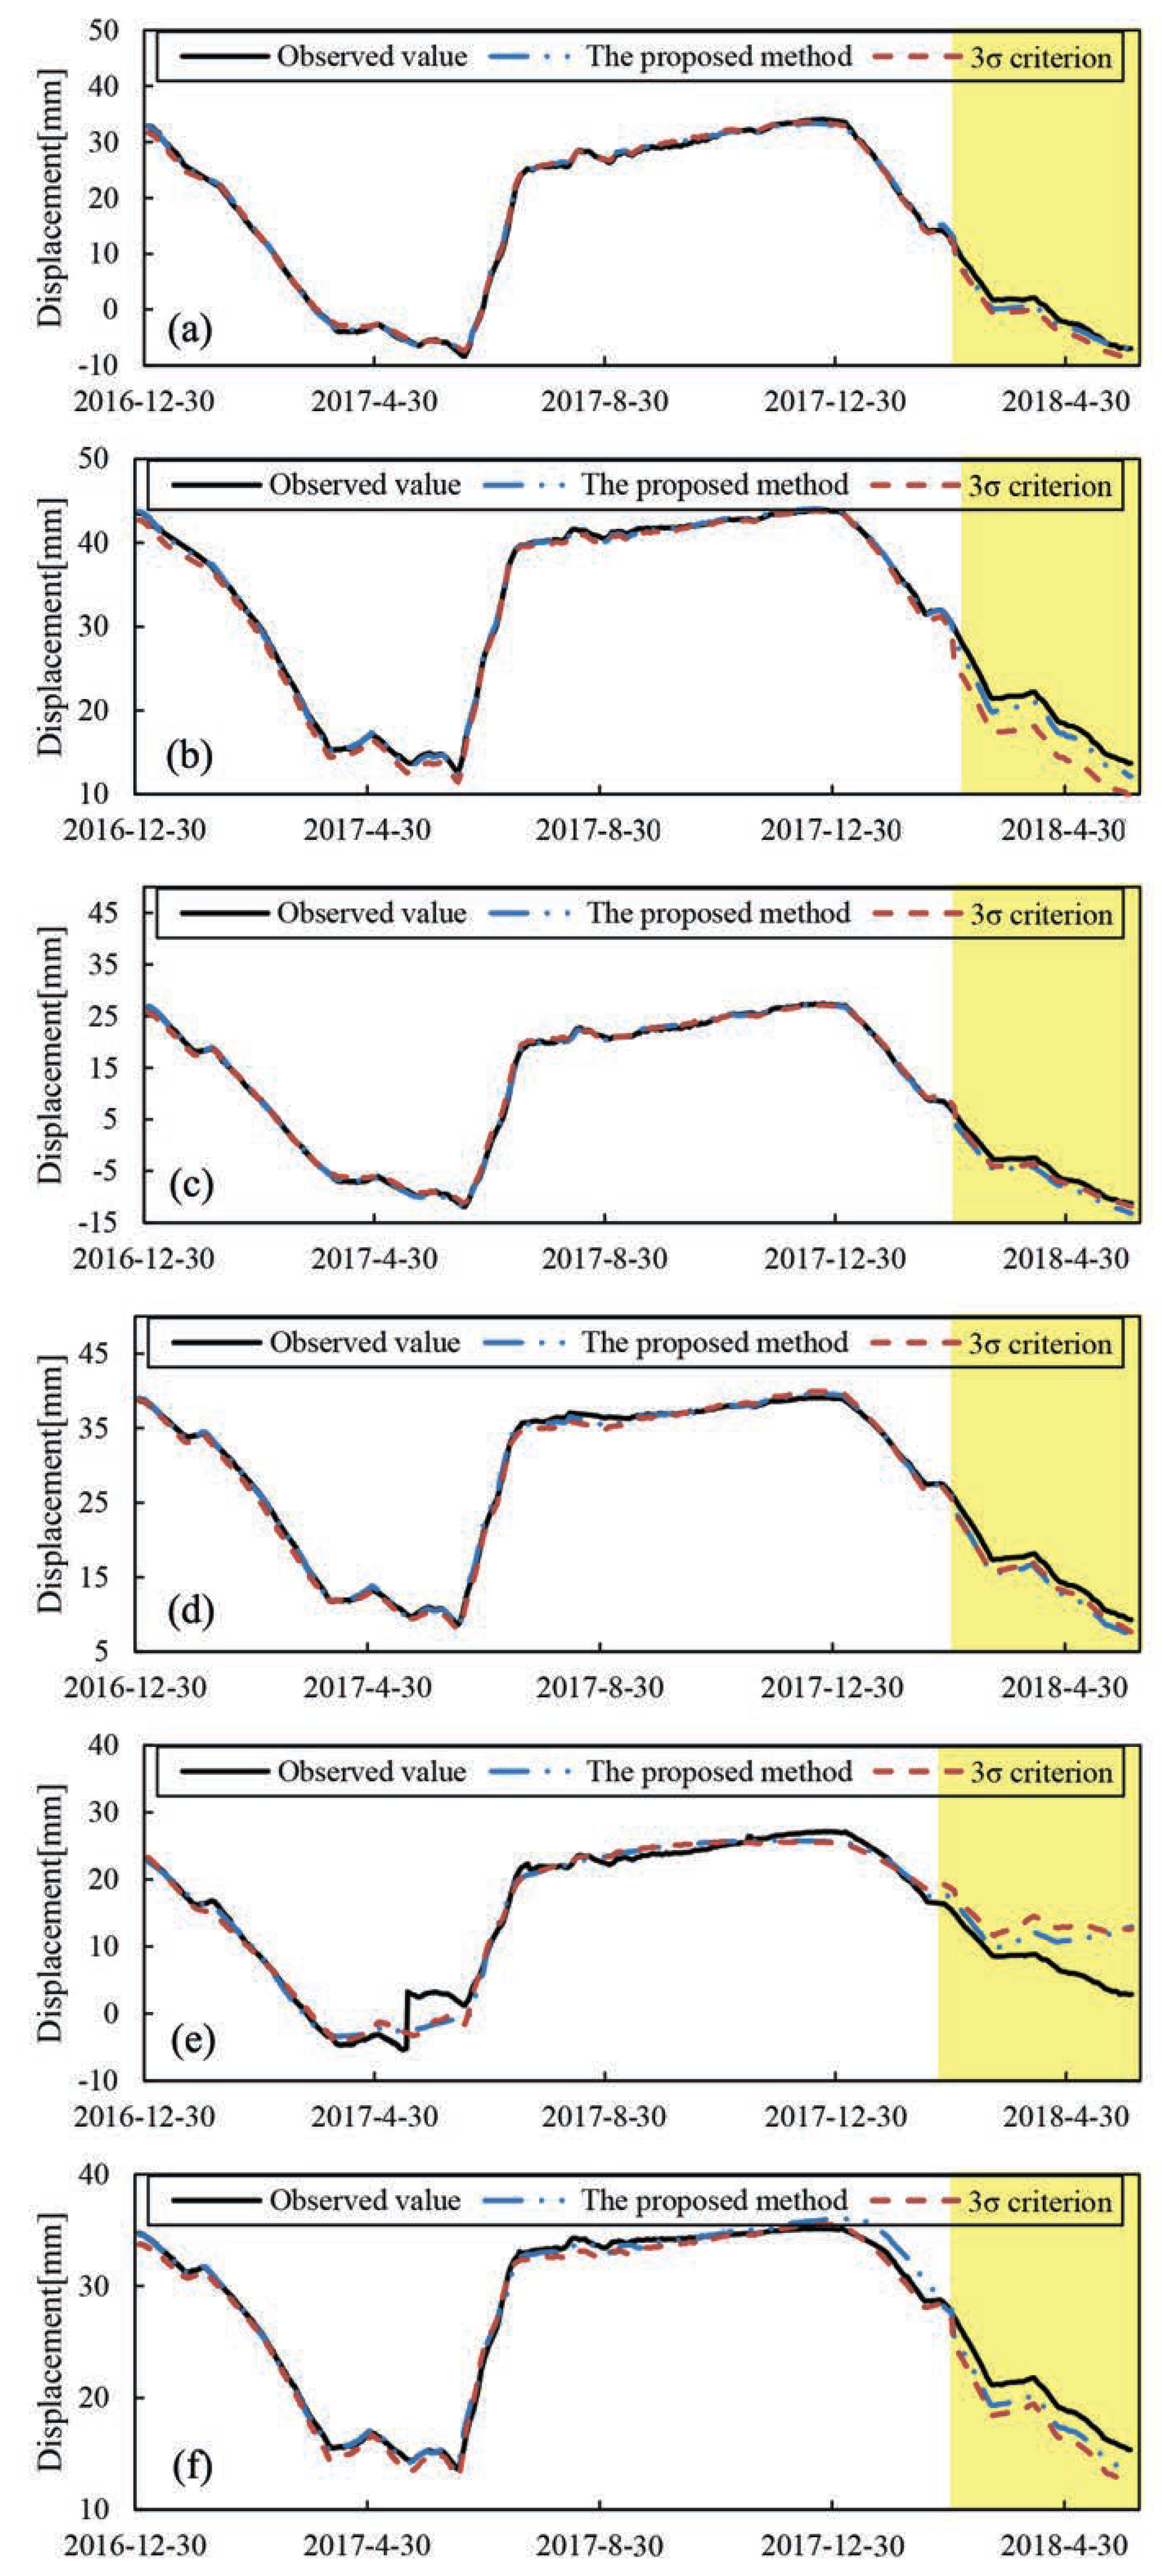
4.4. Regression Model Development Using Processed Data

The regression models are developed using data processed by the 3- σ method and proposed method, to verify the efficiency of outlier detection for monitoring data modeling. The principal expression of the regression model is:
y ^ = a 0 + a 1 x 1 + a 2 x 2 + + a i x i
where y ^ is the modeling data, x i is the explanatory variables, and a i is the coefficients of explanatory variables. x i consists of the three components introduced in Section 4.3: the hydrostatic component δ H , the temperature component δ T , and the aging component δ θ . The coefficients of explanatory variables can be solved using the ordinary least square method.
Figure 12 exhibits the fitting results using data processed by the 3- σ method and proposed method. The displacement modeled using data processed by both these two methods are fitted well with the monitoring data. In general, the prediction results obtained using both datasets are quite similar to the observed data.
The coefficient of determination R 2 and standard deviation RMSE are selected as indicators, to quantify the fitting performance using these two dataset and the predicting accuracy of the model. The equations of R 2 and RMSE are as follows:
R 2 = i = 1 n y ^ i y ¯ i 2 i = 1 n y i y ¯ i 2
R M S E = i = 1 n y i y i ^ 2 n
where y ¯ i is the average of the monitoring data, y ^ i is the modeling data, y i is the monitoring data, and n is the total data.
Table 3 exhibits the R 2 and RMSE of these two dataset for each monitoring point. R 2 exceeded 0.9 for both datasets, which indicates that the regression model can be validated. R 2 ranges between 0.9474 and 0.9854 using the dataset processed by the 3- σ method, ranges between 0.9933 and 0.9998 using dataset processed by the proposed method. It can be noted that the regression model has a better fitting performance using the dataset processed by the proposed method. The regression model developed using the dataset with fewer outliers performs better in prediction accuracy.

5. Conclusions

Displacement monitoring data analysis is an effective method to evaluate the running status of dams. Measurement error greatly affects the accuracy of monitoring data modeling. In order to process the abnormal dam displacement monitoring data, we proposed a data processing method by combining matrix manipulation and the Cuckoo Search algorithm.
In this paper, we first generate a scatter plot of the original monitoring data. Once the scatter plot has been drawn, we then consider the scatter plot as an image and export the matrix of the images. The matrix consists of isolated outliers, clusters of outliers, and clusters of normal data. At the pre-processing stage, the isolated outliers are detected and eliminated using Gaussian blur and Ostu binarization. Gaussian blur reduce the gray scales of isolated outliers, and Ostu binarization eliminate these isolated outliers from the matrix. Using the Cuckoo Search algorithm, we search the optimal series of clusters for determining the process line.
The proposed method is validated using the displacement monitoring data of the dam at Jinping-I hydropower station. By comparing the pre-processed results obtained by different sets of scatter plot, the scatter plots of nine-pixels cross is used in this study. The ratio of outlier detected r d using the proposed method is over 85% for each monitoring point, and it is significantly higher than that of the 3- σ method. In addition, we regress the processed dataset and original dataset using a statistical model, respectively. The results indicate that the regression model fitted with data pre-processed by the proposed model has a better performance compared with the regression model using the original dataset and dataset pre-processed using the 3- σ method.
The proposed method provides a novel solution for detecting outliers in time series data with continuous characteristics. Engineering application of the method in this article is to detect abnormal data in monitoring data of dam displacement. The proposed method is not applicable for datasets without continuous characteristics, i.e., time series data without varying patterns or time-invariance data. One future direction of this study is to increase the engineering applications of the proposed method. The application can be extended to other structures, such as bridges, slopes, etc. In addition, this study introduced the image processing method into abnormal data detection. For both the image processing part and detection part, we selected mutual and routine methods; the detection accuracy can be further improved if we use other high performance methods. Therefore, future studies will need to improve the abnormal detecting performance by introducing a high-ability image processing method and searching algorithm.

Author Contributions

Conceptualization, S.Z.; methodology, S.Z. and Z.M.; validation, Z.M. and Y.W.; formal analysis, X.W., D.L., J.Z. and Y.S.; writing–original draft preparation, Z.M.; writing—review and editing, Y.W.; project administration, Z.M.; funding acquisition, Z.M. and D.L. All authors have read and agreed to the published version of the manuscript.

Funding

This research was supported by the Joint Funds of the Zhejiang Provincial Natural Science Foundation of China (Grants Nos. LZJWY24E090005, LZJWY22E090003), University-Level Key Course of Zhejiang University of Water Resources and Electric Power (Grant No. ZDKC202319), and Nanxun Scholars Program for Young Scholars of ZJWEU (Grant No. RC2023021192).

Data Availability Statement

Data are available upon request.

Conflicts of Interest

Author Xiao Wang was employed by the company Huai’an Hydraulic Surcey and Design Research Institute Co., Ltd. The remaining authors declare that the research was conducted in the absence of any commercial or financial relationships that could be construed as a potential conflict of interest. The Huai’an Hydraulic Surcey and Design Research Institute Co., Ltd. had no role in the design of the study; in the collection, analyses, or interpretation of data; in the writing of the manuscript, or in the decision to publish the results.

References

  1. Kim, Y.S.; Kim, B.T. Prediction of relative crest settlement of concrete-faced rockfill dams analyzed using an artificial neural network model. Comput. Geotech. 2008, 35, 313–322. [Google Scholar] [CrossRef]
  2. De Sortis, A.; Paoliani, P. Statistical analysis and structural identification in concrete dam monitoring. Eng. Struct. 2007, 29, 110–120. [Google Scholar] [CrossRef]
  3. Kao, C.Y.; Loh, C.H. Monitoring of long-term static deformation data of Fei-Tsui arch dam using artificial neural network-based approaches. Struct. Control Health Monit. 2013, 20, 282–303. [Google Scholar] [CrossRef]
  4. Dardanelli, G.; La Loggia, G.; Perfetti, N.; Capodici, F.; Puccio, L.; Maltese, A. Monitoring displacements of an earthen dam using GNSS and remote sensing. In Proceedings of the Remote Sensing for Agriculture, Ecosystems, and Hydrology XVI, Amsterdam, The Netherlands, 22–25 September 2014; Volume 9239, pp. 574–589. [Google Scholar]
  5. Wu, Z. Safety Monitoring Theory and Its Application of Hydraulic Structures; Higher Education: Beijing, China, 2003. [Google Scholar]
  6. Bukenya, P.; Moyo, P.; Beushausen, H.; Oosthuizen, C. Health monitoring of concrete dams: A literature review. J. Civ. Struct. Health Monit. 2014, 4, 235–244. [Google Scholar] [CrossRef]
  7. Leger, P.; Leclerc, M. Hydrostatic, temperature, time-displacement model for concrete dams. J. Eng. Mech. 2007, 133, 267–277. [Google Scholar] [CrossRef]
  8. Mata, J. Interpretation of concrete dam behaviour with artificial neural network and multiple linear regression models. Eng. Struct. 2011, 33, 903–910. [Google Scholar] [CrossRef]
  9. Hipni, A.; El-shafie, A.; Najah, A.; Karim, O.A.; Hussain, A.; Mukhlisin, M. Daily forecasting of dam water levels: Comparing a support vector machine (SVM) model with adaptive neuro fuzzy inference system (ANFIS). Water Resour. Manag. 2013, 27, 3803–3823. [Google Scholar] [CrossRef]
  10. Hariri-Ardebili, M.A.; Pourkamali-Anaraki, F. Support vector machine based reliability analysis of concrete dams. Soil Dyn. Earthq. Eng. 2018, 104, 276–295. [Google Scholar] [CrossRef]
  11. Kang, F.; Liu, J.; Li, J.; Li, S. Concrete dam deformation prediction model for health monitoring based on extreme learning machine. Struct. Control Health Monit. 2017, 24, e1997. [Google Scholar] [CrossRef]
  12. Avendano-Valencia, L.D.; Fassois, S.D. Gaussian mixture random coefficient model based framework for shm in structures with time–dependent dynamics under uncertainty. Mech. Syst. Signal Process. 2017, 97, 59–83. [Google Scholar] [CrossRef]
  13. Alimohammadi, H.; Chen, S.N. Performance evaluation of outlier detection techniques in production timeseries: A systematic review and meta-analysis. Expert Syst. Appl. 2022, 191, 116371. [Google Scholar] [CrossRef]
  14. Samara, M.A.; Bennis, I.; Abouaissa, A.; Lorenz, P. A survey of outlier detection techniques in IoT: Review and classification. J. Sens. Actuator Netw. 2022, 11, 4. [Google Scholar] [CrossRef]
  15. Chen, L.; Gu, C.; Zheng, S.; Wang, Y. A Method for Identifying Gross Errors in Dam Monitoring Data. Water 2024, 16, 978. [Google Scholar] [CrossRef]
  16. Bourquin, J.; Schmidli, H.; van Hoogevest, P.; Leuenberger, H. Pitfalls of artificial neural networks (ANN) modelling technique for data sets containing outlier measurements using a study on mixture properties of a direct compressed dosage form. Eur. J. Pharm. Sci. 1998, 7, 17–28. [Google Scholar] [CrossRef]
  17. Chakravarty, S.; Demirhan, H.; Baser, F. Fuzzy regression functions with a noise cluster and the impact of outliers on mainstream machine learning methods in the regression setting. Appl. Soft Comput. 2020, 96, 106535. [Google Scholar] [CrossRef]
  18. Zhao, L.; Akoglu, L. On using classification datasets to evaluate graph outlier detection: Peculiar observations and new insights. Big Data 2023, 11, 151–180. [Google Scholar] [CrossRef]
  19. Chen, H.; Huang, S.; Xu, Y.P.; Teegavarapu, R.S.; Guo, Y.; Nie, H.; Xie, H. Using baseflow ensembles for hydrologic hysteresis characterization in humid basins of Southeastern China. Water Resour. Res. 2024, 60, e2023WR036195. [Google Scholar] [CrossRef]
  20. Bao, Y.; Tang, Z.; Li, H.; Zhang, Y. Computer vision and deep learning–based data anomaly detection method for structural health monitoring. Struct. Health Monit. 2019, 18, 401–421. [Google Scholar] [CrossRef]
  21. Domingues, R.; Filippone, M.; Michiardi, P.; Zouaoui, J. A comparative evaluation of outlier detection algorithms: Experiments and analyses. Pattern Recognit. 2018, 74, 406–421. [Google Scholar] [CrossRef]
  22. Miao, Y.; Su, H.; Xu, O.; Chu, J. Support vector regression approach for simultaneous data reconciliation and gross error or outlier detection. Ind. Eng. Chem. Res. 2009, 48, 10903–10911. [Google Scholar] [CrossRef]
  23. Malhotra, P.; Ramakrishnan, A.; Anand, G.; Vig, L.; Agarwal, P.; Shroff, G. LSTM-based encoder-decoder for multi-sensor anomaly detection. arXiv 2016, arXiv:1607.00148. [Google Scholar]
  24. Rico, J.; Barateiro, J.; Mata, J.; Antunes, A.; Cardoso, E. Applying advanced data analytics and machine learning to enhance the safety control of dams. In Machine Learning Paradigms: Applications of Learning and Analytics in Intelligent Systems; Springer: Cham, Switzerland, 2019; pp. 315–350. [Google Scholar]
  25. Mishra, G.; Kumar, R. An individual fairness based outlier detection ensemble. Pattern Recognit. Lett. 2023, 171, 76–83. [Google Scholar] [CrossRef]
  26. Zhao, Z.; Chen, K.; Zhang, H.; Li, Y.; Wu, Z. The method of gross error identification of dam monitoring data based on robust estimation. J. Water Resour. Power 2018, 36, 68–71. [Google Scholar]
  27. Song, J.; Zhang, S.; Tong, F.; Yang, J.; Zeng, Z.; Yuan, S. Outlier detection based on multivariable panel data and K-means clustering for dam deformation monitoring data. Adv. Civ. Eng. 2021, 2021, 3739551. [Google Scholar] [CrossRef]
  28. Zhang, P.; Li, T.; Wang, G.; Wang, D.; Lai, P.; Zhang, F. A multi-source information fusion model for outlier detection. Inf. Fusion 2023, 93, 192–208. [Google Scholar] [CrossRef]
  29. Li, M.; Li, M.; Ren, Q.; Li, H.; Song, L. DRLSTM: A dual-stage deep learning approach driven by raw monitoring data for dam displacement prediction. Adv. Eng. Inform. 2022, 51, 101510. [Google Scholar] [CrossRef]
  30. Petrou, M.M.; Petrou, C. Image Processing: The Fundamentals; John Wiley & Sons: Hoboken, NJ, USA, 2010. [Google Scholar]
  31. Flusser, J.; Farokhi, S.; Höschl, C.; Suk, T.; Zitova, B.; Pedone, M. Recognition of images degraded by Gaussian blur. IEEE Trans. Image Process. 2015, 25, 790–806. [Google Scholar] [CrossRef]
  32. Waltz, F.M.; Miller, J.W. Efficient algorithm for gaussian blur using finite-state machines. In Proceedings of the Machine Vision Systems for Inspection and Metrology VII, Boston, MA, USA, 4–5 November 1998; Volume 3521, pp. 334–341. [Google Scholar]
  33. Russ, J.C. The Image Processing Handbook; CRC Press: Boca Raton, FL, USA, 2006. [Google Scholar]
  34. Mareli, M.; Twala, B. An adaptive Cuckoo search algorithm for optimisation. Appl. Comput. Inform. 2018, 14, 107–115. [Google Scholar] [CrossRef]
Figure 1. The flowchart of the proposed method.
Mathematics 12 01345 g001
Figure 2. Plots of a data sequence: (a) linear plot, (b) scatter plot.
Mathematics 12 01345 g002
Figure 3. The flowchart of the Cuckoo Search algorithm.
Mathematics 12 01345 g003
Figure 4. The procedure of process line detection.
Mathematics 12 01345 g004
Figure 5. (a) Location of the Jinping-I hydroppower station; (b) Photo of the Jinping-I arch dam.
Mathematics 12 01345 g005
Figure 6. The distribution of monitoring points (red boxes denote the selected monitoring points).
Mathematics 12 01345 g006
Figure 7. Stack of patterns with different shapes: (a) square, (b) cross, and (c) isscross.
Mathematics 12 01345 g007
Figure 8. Gaussian blur and Ostu binarization of a plot using different shapes of scatters: (a) circle, (b) square, (c) cross, (d) isscross.
Mathematics 12 01345 g008
Figure 9. Gaussian blur and Ostu binarization processing scatter plots using a cross with different sizes: (a) 5 pixels, (b) 9 pixels, (c) 13 pixels, and (d) 17 pixels.
Mathematics 12 01345 g009
Figure 10. The error processing of the sample data sequence using the proposed method: (a) raw image, (b) Gaussian blur, (c) Ostu binarization, and (d) process line identification.
Mathematics 12 01345 g010
Figure 11. The results of outlier detection of the proposed method and 3 σ method of: (a) PL11-1, (b) PL11-3, (c) PL13-1, (d) PL13-3, (e) PL16-1, and (f) PL16-3.
Mathematics 12 01345 g011
Figure 12. The regression model developed using dataset processed by the 3- σ method and proposed method: (a) PL11-1, (b) PL11-3, (c) PL13-1, (d) PL13-3, (e) PL16-1, and (f) PL16-3.
Mathematics 12 01345 g012
Table 1. The total data number N t and number of outliers N o detected by the proposed method.
Monitoring PointsPL11-1PL11-3PL13-1PL13-3PL16-1PL16-3
N t 830788872820860860
N o 869175767089
Table 2. N d and r d of the 3- σ method and proposed method for each monitoring point.
Monitoring PointsThe Proposed Method3 σ Method
N d r d (%) N d r d (%)
PL11-17587.203136.04
PL11-38492.312426.37
PL13-17296.002938.66
PL13-37294.732836.84
PL16-170100.003651.42
PL16-38898.873134.83
Table 3. R 2 and RMSE of the regression models using the dataset processed by the 3- σ method and proposed method.
Monitoring Points R 2 RMSE
The Proposed Method3- σ Method The Proposed Method3- σ Method
PL11-10.9820.9540.9432.371
PL11-30.9830.9590.5382.228
PL13-10.9980.9410.2282.274
PL13-30.9930.9740.3932.213
PL16-10.9330.9621.2362.734
PL16-30.9920.9470.3042.561
Disclaimer/Publisher’s Note: The statements, opinions and data contained in all publications are solely those of the individual author(s) and contributor(s) and not of MDPI and/or the editor(s). MDPI and/or the editor(s) disclaim responsibility for any injury to people or property resulting from any ideas, methods, instructions or products referred to in the content.

