Abstract
Surface defect detection systems, which have advanced beyond conventional defect detection methods, lower the risk of accidents and increase working efficiency and productivity. Most fault detection techniques demand extra tools, such as ultrasonic sensors or lasers. With the advancements, these techniques can be examined without additional tools. We propose a morphological attention ensemble learning for surface defect detection called OASIS-Net, which can detect defects of three kinds (crack, efflorescence, and spalling) at the bounding box level. Based on the morphological analysis of each defect, OASIS-Net offers specialized loss functions for each defect that can be examined. Specifically, high-frequency image augmentation, connectivity attention, and penalty areas are used to detect cracks. It also compares the colors of the sensing objects and analyzes the image histogram peaks to improve the efflorescence-verification accuracy. Analyzing the ratio of the major and minor axes of the spalling through morphological comparison reveals that the spalling-detection accuracy improved. Defect images are challenging to obtain due to their properties. We labeled some data provided by AI hub and some concrete crack datasets and used them as custom datasets. Finally, an ensemble learning technique based on multi-task classification is suggested to learn and apply the specialized loss of each class to the model. For the custom dataset, the accuracy of the crack detection increased by 5%, the accuracy of the efflorescence detection increased by 4.4%, and the accuracy of the spalling detection increased by 6.6%. The experimental results reveal that the proposed network outperforms the previous state-of-the-art methods.
Keywords:
surface defect detection; morphological attention; ensemble learning; crack; efflorescence; spalling MSC:
68T45
1. Introduction
In most countries, maintenance is becoming a serious and complex problem as the number of aging structures grows. Existing structures are rapidly aging and developing flaws, raising concerns about public safety and the preservation of valuable assets. Defects in structures endanger the operator’s health and productivity, and structural deterioration can lead to various safety hazards, such as collapse and flooding. Thus, detecting structural defects is critical for assessing structural risks and ensuring safety.
Traditional defect detection methods primarily rely on visual inspection or manually captured images. Expensive work equipment may be required, and the results may include subjective worker criteria. This traditional manual fault detection method is inefficient and time-consuming, resulting in high costs, which are a significant burden for many businesses. Automatic fault detection methods reduce the risk of exposing people to a hazardous environment and result in increased fault analysis work speed and efficiency and lower costs. That is why developed countries with a long history of urbanization are very interested in automated defect detection.
Many researchers have been taking various approaches to automatically detecting defects in order to address the shortcomings of manual detection. Advances in computer vision have broadened the applicability of various fields and made automation processing possible.
Typical examples include image classification [1,2,3,4,5], detection [6,7,8,9,10,11], and mapping [12,13,14,15,16,17,18,19,20,21]. The image classification problem is a problem of classifying an input image into a label, which is one of the predetermined categories. It is one of the key problems in the field of computer vision with various potential uses. The object detection problem is a problem of finding an instance of an object in an image. Not only can the object be identified in the image, but the location is also identified. Image mapping is a problem of converting from one coordinate system to another. Because of these methods, computer vision could replace a person’s manual inspection and progress the development of automation. A defect image of crack efflorescence and spalling is illustrated in Figure 1. A common flaw in concrete, asphalt, and structures is cracking, as shown in Figure 1a. In general, most cracks do not impair the stability or durability of the building, although they damage the structure’s surface, causing moisture intrusion and rebar corrosion. Efflorescence in Figure 1b refers to the white salt deposit that forms on the surface of stone or concrete. Most of the time, efflorescence does not directly harm the structure but can result in additional flaws due to water infiltration through the structure surface. The area where fractures have developed on the surface of the structure and have peeled off the substrate is designated as spalling (Figure 1c), which is caused by stress from the corrosion of the built-in reinforcement and expansion of up to 10 times the original volume. The spalling can cause foreign substances to fall and cause casualties. It also has an unstable structure and a propensity to spread.
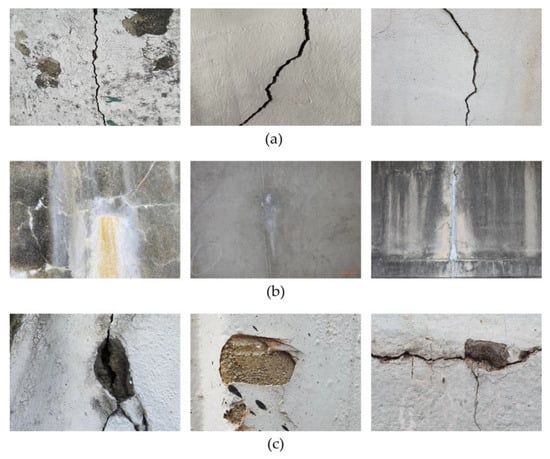
Figure 1.
Example images of various defect classes of (a) cracks, (b) efflorescence, and (c) spalling.
These three defects are common types of defects that can be visually identified. They can also result in future safety incidents and are a warning sign for the structures before they are seriously damaged [22,23,24]. Therefore, this paper concentrates on efflorescence, spalling, and cracks among the many defect types and proposes the deep learning-based morphological attention ensemble learning for surface defect detection called OASIS-Net, which can identify defects in a single image. In addition, OASIS-Net uses three loss types to analyze and give attention to the morphological characteristics of each defect. Additionally, ensemble learning based on multi-task classification is used to learn loss accurately. Because YOLO v5s [6] offers fast speed and high accuracy in object detection research, it is used as the foundation of OASIS-Net.
The main contributions of this study can be summarized as follows:
- We propose a specialized loss for each defect: cracks, efflorescence, and spalling. New morphological attention loss types are applied to demonstrate improved defect-recognition accuracy.
- We use the deformable convolutional network (DCN) [25] layer feature and incorporate it into the network to adaptively extract defect features according to the feature shapes.
- We exploit multi-task ensemble learning techniques to apply the loss of each defect. The inability of each model to selectively learn each loss is overcome using an overall learning approach.
2. Related Work
2.1. Detection Methods Using Equipment or Sensors
Min-Koo et al. [26] proposed a technology to localize and quantify spalling defects on concrete surfaces using terrestrial laser scanners. Vangui et al. [27] proposed the surface defect noncontact of a metal plate through gas-coupled laser acoustic detection. In addition, González-Jorge et al. [28] proposed the process of detecting efflorescence using geometric and radiological measurement information from lidar data. Zhou et al. [29] proposed an integrated approach based on laser strength and depth characteristics for the automatic detection and quantification of concrete spalling. Furthermore, Hu et al. [30] proposed an optical rail surface algorithm based on visual projections that detect spalling based on defect images taken with line scan cameras. Beckman et al. [31] proposed a faster region-based convolutional neural network (Faster R-CNN) concrete spalling detection method, using depth sensors to quantify multiple simultaneous spalling defects on the same side, individually, and to consider various sides of structural elements. Moreover, Zhang et al. [32] proposed a new computational approach to detect and measure reinforced concrete spalling damage. The proposed framework consists of a three-step calculation that detects spalling semi-automatically in the reinforced concrete column of the point cloud data and quantifies the key properties.
These methods demonstrate higher accuracy than past visual and manual inspections and enable accurate defect detection. However, traditional measurement methods (e.g., [22,23,24,25,26,27,28]) require special or expensive equipment, such as laser, lidar, depth, and ultrasonic sensors. In addition, using these types of equipment has a more complex procedure than a single-image detection method. Currently, deep learning technology is advanced enough to replace these measuring devices, and defect detection is sufficient in a single image. Detecting defects in a structure from a single image is more efficient, with lower costs and faster speeds.
2.2. Detection Methods Using a Detection Model
Kim et al. [33] proposed a technique for automatically detecting concrete damage using the Mask R-CNN, a deep learning framework developed for instance segmentation. It detects cracks, efflorescence, rebar exposure, and spalling and successfully executes instance segmentation. In addition, Shim et al. [34] proposed a method for detecting delamination through deep learning-based image processing and through improving performance with improved loss functions and data augmentation techniques. Huyan et al. [35] proposed a network that detects cracks pixel-wise using deep convolution, pooling, convolution, and connection operations.
Additionally, Ni et al. [36] proposed a CNN-based framework that automates tasks through convolutional function fusion and pixel-level classification. Zhou et al. [37] proposed a mixed pooling module for fusion and attention mechanisms and crack detection and a replacement for traditional spatial pooling. To improve the performance of concrete crack detection, Wu et al. [38] introduced a multiscale patch generation method for deep pixel distribution learning. Furthermore, Feng et al. [39] proposed crack detection methods using deep convolutional networks to implement pixel-level crack detection. Bai et al. [40] proposed an end-to-end deep learning approach that automatically detects cracks and collapses in buildings and bridges. Fang et al. [41] proposed a novel hybrid approach using fast R-CNN for crack patch detection, a DCNN for crack direction recognition, and the Bayesian algorithm for integration.
Furthermore, Fang et al. proposed a novel framework combining deep learning models and Bayesian analyses to solve challenging vision problems in which deep learning approaches using simple end-to-end learning strategies may not succeed. Ren et al. [42] proposed a deep learning-based fully convolutional network segmentation method for concrete cracks in tunnels. In addition, Chen et al. [43] proposed an encoder–decoder architecture model using a pavement and bridge crack segmentation network, referred to as SegNet [44], which accepts arbitrary-sized images as input data, training them on a pixel-by-pixel basis.
Li et al. [45] proposed SSENets consisting of the skip squeeze excitation module and atrous spatial pyramid pooling modules. The SSE module uses a skip connection strategy to improve the slope correlation between shallow and deep networks and to mitigate the slope extinction due to network deepening. The ASPP module extracts multiscale context information for images and reduces the complexity of separable convolutions by depth.
Dušan Isailović et al. [46] proposed an approach to integrating damage components into building information modeling through the point cloud-based detection of spalling damage and the semantic enhancement of the Industry Foundation Classes model. Additionally, Chun et al. [47] proposed a system for inspecting concrete structures using infrared thermal imaging. The system develops equipment that investigates whether an object is at the appropriate temperature for proper photographing, and it uses a machine learning-based method that automatically detects temperature irregularities due to floating and spalling.
Li et al. [48] proposed coordinate attention and a self-interaction-based lightweight network incorporating channel domains, spatial information, and self-interaction modules to automatically identify six types of hot-rolled steel strip surface defects to improve the efficiency and accuracy of surface defect detection. Furthermore, a self-interaction module was proposed to improve classification accuracy by interactively fusing extracted feature information.
Ju et al. [49] proposed a new method called the transformer-based multiscale fusion model using an encoder module, a decoder module, and a fusion module for crack detection. The convolutional block and Swin transformer block are combined in the encoder module to model the long-distance dependencies of various components of a crack image from local and global perspectives. The encoder and decoder modules are intended to be symmetrical. The encoder and decoder module outputs from each layer, each of which has a different scale, and can be combined into convolutional forms using the fusion module, improving the correlation between the pertinent contexts to reduce background noise and enhance crack detection. Finally, to achieve the goal of crack detection, the output of each layer of the fusion module is connected.
However, the proposed [29,30,31,32,33,34,35,36,37,38,39,40,41,42,43,44,45] defect detection methods do not address the unique morphological characteristics of each defect. Pixel-level detection models are unsuitable for real-time defect detection because they have many parameters and low processing speed. In addition, pixel-level defect detection-based models consume considerable human resources for data classification and labeling tasks. For these reasons, we used box-level object detection. We included DCN in the crack detection model to increase the performance of the crack detection model. We analyze and use the unique morphological characteristic information of each defect. Morphological attention loss analyzes the morphological features of each defect with different characteristics and implements loss using various features. Ensemble learning based on multi-task classification is used to learn and apply each of these. As a result, our proposed model showed higher accuracy than the base model.
3. Proposed Method
3.1. Overall Architecture of OASIS-Net
This section describes the structure of the proposed overall architecture and the methods for each block. OASIS-Net has three necks and three head modules. Each neck module, such as crack, efflorescence, and spalling, is independently trained with its own dataset and losses. After that, the three pre-trained necks are combined to detect the three defections with three heads. When inferencing the model, each neck predicts each output. The voting methods are applied to the outputs. Thus, the highest confidence score output is utilized as the final output. Figure 2 depicts the proposed overall architecture of OASIS-Net. The head, neck, and backbone modules of OASIS-Net are its three components, and it uses the backbone module of the object detection model [6]. In addition, CNNs, or the “backbone”, aggregate and create image features at various granularities. When the defect image is inputted into the backbone module, the focus layer converts the defect image from the spatial domain into the depth domain. The convolution, batch normalization, and leaky rectified linear unit (CBL) layer receive the transformed defect image as input. This CBL layer increases the training speed by removing covariate shifts that slow the training. The cross-stage partial layer improves detection performance while dividing the gradient flow to reduce the number of inference computations. The spatial pyramid pooling (SPP) layer gathers the input features, producing a fixed-length output. Fixed-sized input images are not required owing to this SPP layer. The input feature map contains twice as many arrays after being upsampled. In addition, B is the result of passing through the backbone module, which enters the neck module.
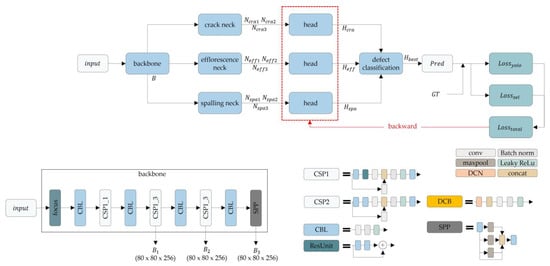
Figure 2.
Overall architecture of OASIS-Net.
Figure 3 and Figure 4 present the proposed neck module of OASIS-Net, which has three neck modules, one for each class, to learn different loss types depending on the results. The neck module is a component of an object detection model that builds features using the fundamental structure of CNNs. The neck module receives , , and from the backbone as input data, combines and mixes image functions, creates a feature pyramid, and sends it to the head. The crack neck module is added with additional blocks to enhance the high-frequency characteristics lost during the upsampling process. The resulting values, , , and , that pass the neck module become the input values of the head module. The value of the class is the same class as each neck.
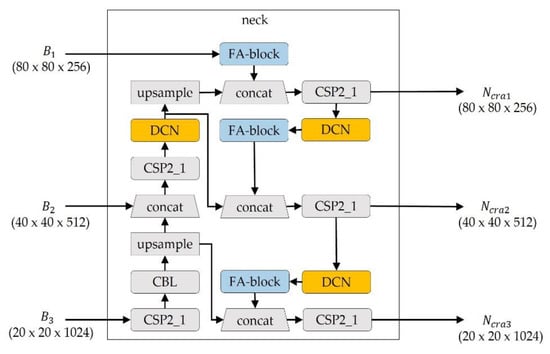
Figure 3.
Neck module for cracks.
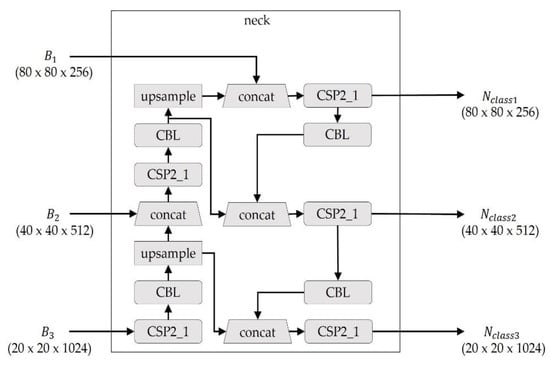
Figure 4.
Neck module for efflorescence and spalling.
Figure 5 presents the head module of OASIS-Net, which is the last step of object detection. The predictions are made in an object detector. The head module of the object detector performs the class and box prediction steps using the , , and input from the neck module. Then, each prediction result is calculated. The confidence comparison block compares the confidence of the predictions. Finally, the results of using , , and are compared in a defect classification block, and the resulting value with the highest confidence is predicted as the result. The prediction value with the highest confidence is determined as Pred. The Pred includes the bounding box of the defect and the type of defect.
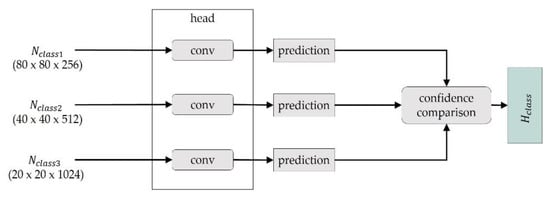
Figure 5.
Head module of OASIS-Net.
3.2. OASIS-Net Crack Detection
Detecting cracks is challenging because they exhibit irregular line structures and shapes. We improved AugmoCrack [50] in previous work, which was previously proposed as a crack detection method. AugmoCrack increased the high frequency of cracks by preserving the edges advantageous for recognition, detecting cracks using the morphological characteristics of the area and connectivity. In this paper, “morphological” includes the traditional image processing techniques and features of defects defined in the paper.
Cracks are irregular and have extensive morphological features; therefore, we added the DCN to the AugmoCrack networks. Figure 6 presents a DCN. Due to the fixed geometry of the building modules, CNNs [51] are restricted to modeling geometric transformations. We employ deformable convolution to improve the CNN’s capacity for deformation modeling. The regular modules of a conventional CNN can be easily replaced, and a DCN can be easily trained end-to-end with conventional backpropagation. This process led to an improvement in crack detection precision.
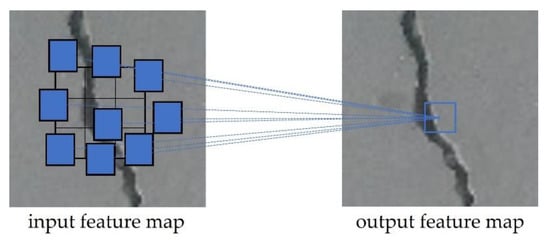
Figure 6.
Description image of the deformable convolutional network.
The frequency augmentation block (FA block) in Figure 3 is a block for enhancing the high-frequency components of a defect. The processing process for the FA block is presented in Figure 7. The discrete cosine transform (DCT) operation transforms the input image into the spectral domain when the feature map is inputted into the FA block. The high-frequency components are concentrated in the lower-right area of the feature map during this process, whereas the low-frequency components are concentrated in the upper-left area. The FA block reverses the DCT to produce a feature map with a high-frequency extraction. Finally, the input feature map of the FA block is added to the feature map with a high-frequency extraction. The edges, lines, and boundaries in the high-frequency spectral domain, which are the critical indicators for precise crack detection, are enhanced by the FA block using this operation. The FA block method makes it more advantageous in detecting cracks.
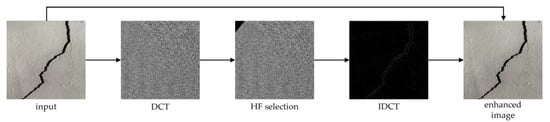
Figure 7.
Processing example images of high-frequency augmentation.
Figure 8 and Figure 9 reveal the connectivity attention loss and the penalty-aware loss . denotes a segmentation image obtained from the input image by using the segmentation method [52]. The segmentation method uses the classifier to create a rough crack localization map by using its class activation maps and a patch-based classification approach and fuses these with a thresholding-based approach to segment the mostly darker crack pixels. In addition, the localization map is created by GradCam [53], a technique for producing “visual explanations” for decisions from a large class of CNN-based models, making them more transparent. is generated by multiplying the original image by the binarized image obtained using multi-Otsu and the localization map. In addition, is converted into an equivalence table that contains details about the neighboring pixels, and it is inputted into the morphological attention loss calculation block. Specifically, the attention mechanism means that the network should focus more on the small but essential parts of the data. In this paper, it is our contribution to the weighing of the morphological features of defects for calculating specialized loss. We calculate the loss by attention to morphological features such as the image segmentation mask . Using an equivalent table to determine the pixels that are close, iterative searching is used to check the connectivity of each adjacent pixel. Afterwards, the surrounding pixels are searched for in the image. The purpose of is to ensure only one crack in each detected box by preventing erroneous duplicate detections. In addition, is intended to prevent the model from picking up small outliers, which cannot be regarded as genuine defects. The crack detection model performance is increased by , which forces it to detect cracks with the proper bounding box size. The formulas for are as follows:
where denotes the predicted number of connected components in the predicted bounding box by the cv2.connectedComponents function [54,55,56]. represents the number of bounding box labels corresponding to the ground truth. As shown in Equation (1), the and are computed as a subtraction to compare the number of associated objects in order to match the number of correct answers. In addition, prevents the model from picking up extremely small outliers that cannot be taken seriously as defects, and its value is defined with the following threshold:
where h and w denote the height and width of , respectively, and represents the area of the connected components. In this situation, forces the crack detection model to find cracks with an appropriate bounding box size, enhancing the crack detection performance.
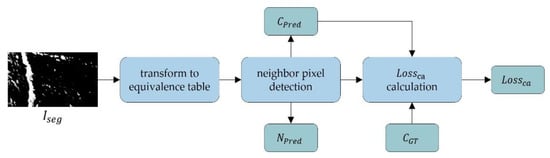
Figure 8.
Structure of the connectivity attention loss computation.
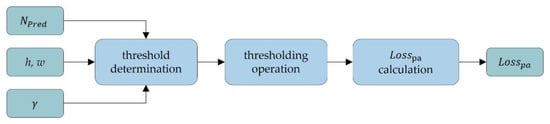
Figure 9.
Structure of penalty area loss computation.
Figure 10 depicts the process of calculating the loss of the crack image as an image. It converts a defect image into a binary image and checks the connectivity. Adjacent pixels with connectivity are displayed in the same color. Next, the pixels with a connection area that is too small are considered noise and are removed. The loss is calculated by comparing the area and number of remaining connected objects. Finally, the is defined as follows:
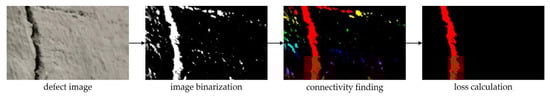
Figure 10.
Processing example images of connectivity finding.
3.3. OASIS-Net Efflorescence Detection
Efflorescence is a defect that has a sizable morphological area and is white. When analyzed from a histogram perspective, the image is divided into a white part and a nonwhite part, resulting in two histogram peaks. It is also possible to use the characteristic that the white part has a brighter color than the background. In addition, analyzes the histogram of the defect image and uses the brightness of the image as follows:
Part of the efflorescence is brighter than the background, having a greater average brightness value. In the image, means the brightness average of the widely cropped part of the background, and means the brightness average of the part where only the efflorescence part is cropped. Therefore, if < , loss is determined by the difference between the brightness values. Other cases are normal; so, no loss is granted. In addition, analyzes the histogram of the defect image and uses the number of peaks as follows:
The number of histogram peaks obtained by analyzing the histogram of the defect image is . As most histogram peaks in the defect have two or three peaks, a loss value is not assigned. In other cases, the value according to the Gaussian distribution map is obtained to consider the error in the number of histogram peaks. In Gaussian, x is the input value, and x is the standard deviation. We used σ for 1.0. Figure 11 illustrates the histogram peak analysis images of the efflorescence defect images.
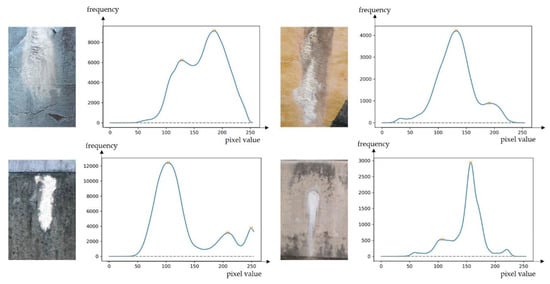
Figure 11.
Efflorescence images and their histograms.
Analyzing the number of histogram peaks in most defective images results in two or three peaks. Moreover, refers to the final form of loss used in learning, as follows:
Figure 12 describes the proposed efflorescence detection loss function. We used the defect image and the prediction coordinate to crop the defect prediction area of the image. In this case, represents a cropped image with a background wider than the target, and represents an image with a tight crop of the target part. We analyzed the brightness histogram of the and images by cropping to calculate the brightness mean and . The loss calculation block was used to calculate as in Equation (4). We used the cut image to perform the histogram analysis. We found the number of peaks and calculated using a Gaussian distribution plot. Finally, we added and to output .
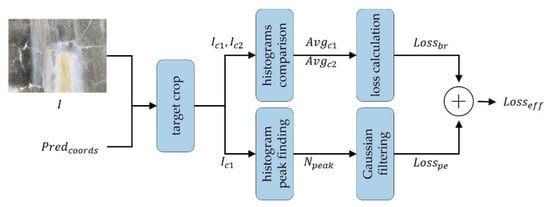
Figure 12.
Structure of the computation.
3.4. OASIS-Net Spalling Detection
Spalling has a morphologically closed figure with an oval shape. The proposed loss produces an ellipse close to the defect. We calculated the ratio of the length of the major and the minor axes of the ellipse and compared it with the length ratio of the GT major and minor axes to calculate the loss. These functions can distinguish differences from other fault classes. Additional information can improve learning accuracy. The is calculated as follows:
where denotes the major axis of the ellipse, and denotes the minor axis of the ellipse. In addition, can be calculated by dividing by . We calculated and compared the ratio of the major axis and minor axis of the . The mean squared error is used for the comparison.
Figure 13 presents the structure of . We used the input image and prediction coordinate to crop the defect prediction portion of the image and used the K-means algorithm [57] to cluster the pixels of the cropped image to k = 2. We converted the clustered images to binary images using the multi-Otsu threshold [58], as follows:
where represents the input image, (x, y) represents the x and y coordinates of , and T1 and T2 denote two hyperparameters of multiple thresholds that can be adjusted. This method detects the contours of the binarized image through cv2.findContours [59] and extracts a convex shape that fits the detected contour. We calculated the ellipse that fits the convex using cv2.fitEllipse [60] and calculated the loss using the ratio of the major axis to the minor axis of the ellipse. In this paper, we utilized contour detection to weight the morphological features for spalling detection. Figure 14 illustrates the processing example image for .
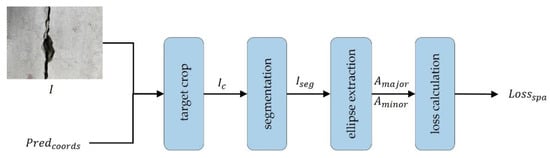
Figure 13.
Structure of the computation.
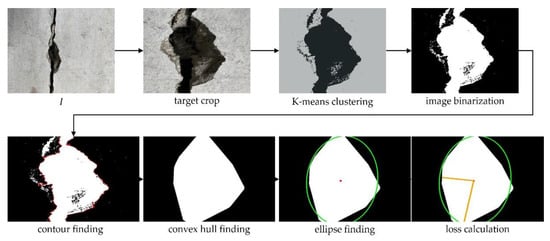
Figure 14.
Processing example images of .
3.5. Ensemble Learning
Ensemble learning is a technique that produces multiple classifiers and combines their predictions to produce more accurate predictions. Instead of using a single model, this model combines several models to help make more accurate predictions. According to [61,62], ensemble learning based on multi-tasking can be utilized with a multi-task structure of different models for one input. As in [61,62], the proposed model uses multi-task ensemble learning for surface defect detection. We used voting methods among several ensemble learning methods. Ensemble learning is used by modules with different structures to learn their own independent losses (Figure 2). The results of , from each head module are calculated in a voting manner according to the confidence value. We refer to the value class and select the loss to be calculated among , , and . The calculated loss is combined with to become . The is calculated as follows:
The value of [6] comprises the box loss for precise bounding box detection; the object loss to determine whether an object is present in the detected box; and the classification loss for the classification of the detected object. The is calculated as follows:
where is the final loss backpropagated to the model, and is the loss selected by in , , and . When performing backpropagation, the neck module, such as , learns the weights. Moreover, other neck modules are frozen; so, the weight is not changed.
4. Experiments and Analysis
4.1. Experimental Setup
Dataset
This study used a custom dataset for validation. Our OASIS-Net detects the three defections: crack, efflorescence, and spalling. For crack detection, we utilized the concrete crack dataset [63], which consists of 791 images with 227 × 227 pixels. We split 591 images for validation and 200 for training datasets. In addition, the concrete crack dataset is a dataset with labels consisting of segmentation maps. As a preprocessing step, we just converted the segmentation map into a bounding box for box-level object detection. For efflorescence and spalling detection, we utilized the AI Hub dataset. The AI Hub dataset [64] consists of 300 images for efflorescence and 300 for spalling detection with 2560 × 1440 pixels. We split the efflorescence dataset into 200 images for training and 100 images for verification. The spalling dataset was split into 145 images for training and 96 images for verification.
4.2. Experimental Results
Yolov5 has shown strong performance with high accuracy and fast speed among the state-of-the-art object detection methods. Faster R-CNN [9] object detection networks depend on region algorithms to hypothesize object locations. EfficientDet [11] is an object detection model that utilizes several optimizations and backbone tweaks, such as using a BiFPN. We analyzed the visual results of how the proposed methods work. Moreover, we compared the proposed model with various models of Yolov5 and other object detection models using mean average precision (mAP). The mAP is a metric used to evaluate object detection models [65,66,67] commonly. The area under the above precision-recall curve is where the average precision (AP) is generally defined. The AP is averaged to calculate mAP. The mAP value is calculated for call values from 0 to 1. We also conducted an ablation study to demonstrate the effectiveness of the proposed methods. Additionally, we compared the inference times of the box-level detection-based and pixel-level segmentation-based methods.
4.2.1. Crack Detection Results
The results in Table 1 prove that the OASIS-Net crack detection method provides superior performance compared to other methods. The proposed model has higher accuracy in crack detection than the basic model by 5% for mAP0.5 and 7% for mAP0.5:0.95. In addition, we demonstrate how well the proposed module, frequency increase, and morphological attention loss function. Figure 15 presents a visual comparison of the results obtained when detecting the cracks in the image. Because of the proposed OASIS-Net to prevent false outlier detection, the bounding box region is detected more precisely than previously possible with the baseline model YOLOv5. This result demonstrates that the proposed was effective. Training using places a strong emphasis on connectivity, leading to this result. The proposed DCN has increased effects, as displayed in the first and second rows of Figure 15. While the baseline model incorrectly detects duplicate bounding boxes in the third and fourth rows of Figure 15, the proposed OASIS-Net does not have this problem. The baseline model inaccurately detects bounding boxes for wide cracks, but the proposed model accurately detects these features. As shown in the third row of Figure 15, we note that the proposed method also detects multiple cracks appropriately.

Table 1.
Comparison of the mean average precision (mAP) for crack detection.
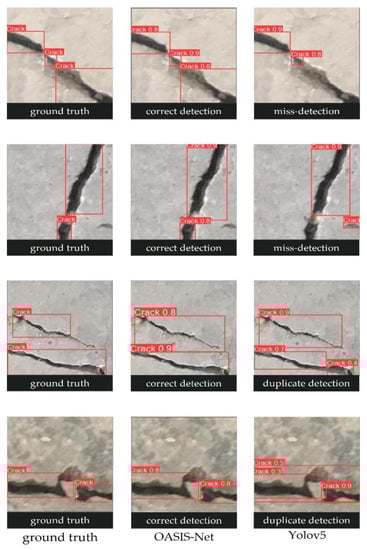
Figure 15.
Visual comparison of crack detection results.
4.2.2. Efflorescence Detection Results
Efflorescence is a defect that is difficult to detect due to unclear edges and irregular shapes. However, the proposed loss function minimizes detection errors and improves the accuracy compared to the base model. The research results in Table 2 demonstrate that the OASIS-Net efflorescence detection method offers higher performance when contrasted with other approaches. Compared to the basic model, the proposed model demonstrates a performance increase of 4.4% for mAP0.5 and 2.7% for mAP0.5:0.95. Through the histogram analysis, brightness comparison, and histogram peak counts, we also demonstrate how effectively the proposed morphological attention loss function operates. Figure 16 presents a visual comparison of the results obtained from detecting efflorescence in the image. In the first row, the bounding box accuracy is compared to that of the basic model by analyzing the features that are lighter than the background, demonstrating the effectiveness of .
Table 2.
Comparison of the mean average precision (mAP) for efflorescence detection.
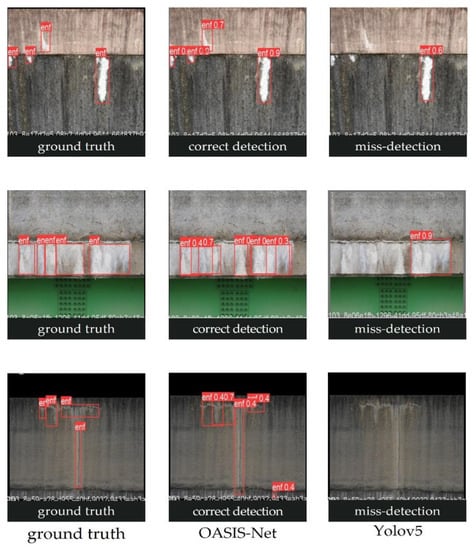
Figure 16.
Visual comparison of efflorescence detection results.
In the second and third rows, there is an indistinct efflorescence with a shape and color similar to the background. It is also challenging to detect due to its weak edges and patterns which are similar to the surrounding background. In the image of the second row, the proposed model detected a smaller box than the ground truth box area located in the center. In the third row of images, the proposed model incorrectly detected a slight trace in the lower right as an efflorescence. However, the proposed model minimized the error compared to the base model.
4.2.3. Spalling Detection Results
The research results in Table 3 demonstrate that the OASIS-Net method for detecting spalling offers a degree of accuracy that is superior to that offered by other methods. The proposed model demonstrates a performance improvement of 6.6% for mAP0.5 and 5.7% for mAP0.5:0.95 compared to the model that serves as the basis. We demonstrate the efficiency of the contour detection method and long- and short-axis comparison loss function of the ellipse with their respective methods. Figure 17 provides a visual comparison of the findings obtained by identifying spalling in the image. In the first row, the existing model identifies cracks incorrectly as spalling, whereas the proposed model does not make this error. In the second row, the existing model inaccurately detects the bounding box, whereas the proposed model accurately detects it. These findings result from the proposed elliptic shape having a loss ratio greater on the major axis than on the minor axis.
Table 3.
Comparison of the mean average precision (mAP) of the spalling detection.
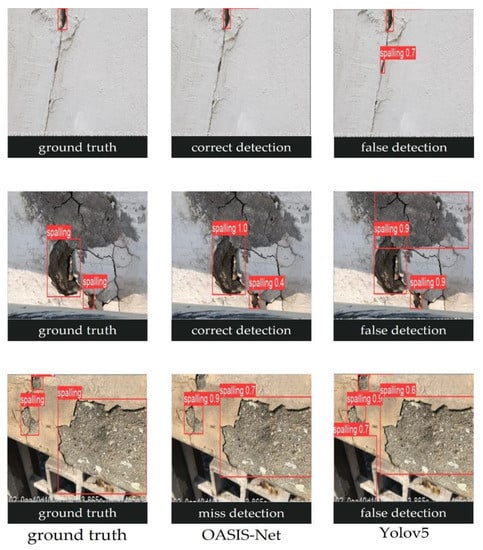
Figure 17.
Visual comparison of spalling detection results.
4.2.4. Comparison of Inference Time
We used an Intel I7-10700K CPU and an Nvidia GeForce RTX3080 GPU. Table 4 details the mean inference times at which each method was conducted. The time unit uses milliseconds (ms). The comparisons of the results include the basic and proposed models and other box-level object detection models. The proposed model is more sluggish than the model that serves as its foundation, but it is quicker or similar to other object detection models. This outcome demonstrates that the suggested model can be processed in real time. Additionally, Table 5 shows a comparison of several segmentation-based models [68,69,70,71]. The values were taken from the previous review paper [72]. As shown in Table 4 and Table 5, the proposed model demonstrates inference speeds significantly higher than those of the other segmentation-based models, demonstrating that the box-level detection-based method is superior to the pixel-level segmentation-based method for real-time processing.
Table 4.
Comparison of inference time of box-level detection-based methods.
Table 5.
Comparison of inference time of pixel-level detection-based methods.
4.2.5. Ablation Study
We conducted an ablation study to find out the effect of the proposed methods on the overall model performance. This study presented low accuracy when the proposed methods were eliminated from the complete model. Table 6 shows the results of an ablation study of OASIS-Net for crack detection. In the crack detection section, the proposed , , and DCN were eliminated one by one. When was eliminated, mAP0.5 was 0.13 higher than the base model. When was eliminated, mAP0.5 was 0.22 higher than the base model, and when DCN was eliminated, mAP0.5 was 0.45 higher than the base model. As a result, the biggest factor of accuracy increase was confirmed by . increases crack-detection accuracy by attention to crack connections. The treats objects that are too small as noise and removes them. DCN is effective in analyzing the crack characteristics of irregular shapes. For this reason, the proposed model is more accurate than other models.
Table 6.
Ablation study results of OASIS-Net for crack detection.
Table 7 shows the results of an ablation study of OASIS-Net for efflorescence detection. In the efflorescence detection section, the proposed and were eliminated one by one. When was eliminated, mAP0.5 was 0.024 higher than the base model. When was eliminated, mAP0.5 was 0.015 higher than the base model. When fully used, mAP0.5 was 0.044 higher than the base model. The proposed methods had a higher accuracy increase effect when used together than when used separately. is advantageous in detecting efflorescence by comparing the brightness of the efflorescence with the brightness of the surrounding background. The effectively detects efflorescence using the characteristics of the color separating them from the background. For these reasons, the proposed model is more accurate than the other models.
Table 7.
Ablation study results of OASIS-Net for efflorescence detection.
Table 8 shows the results of an ablation study of OASIS-Net for spalling detection. In the spalling detection section, the proposed was eliminated. When the was eliminated, mAP0.5 was 0.656 and was similar to the base model. With , mAP0.5 was 0.066 higher than the base model. As a result, it was confirmed that had a definite effect on spalling detection. The uses the morphological features of the spalling to effectively detect the spalling. Therefore, the proposed model is more accurate than other models.
Table 8.
Ablation study results of OASIS-Net for spalling detection.
5. Conclusions
This work proposes the OASIS-Net, which performs a defect detection function based on an object detection model. The OASIS-Net is a model that learns important features through morphological analysis, such as crack, efflorescence, and spalling. In addition, OASIS-Net learns high-frequency augmentation, connectivity, and area as loss values to detect cracks. It also uses a DCN to perform more accurate detection. To detect whiteness, this method compares the brightness of the defect against the background and learns the number of peaks calculated in a histogram analysis as loss values. To detect delamination, we calculated the ellipse of the defect to learn the ratio of the major axis to the minor axis as a loss value. Our OASIS-Net utilized the loss function, which consists of typical object detection loss and the custom losses proposed for each defect network. For this reason, even if the traditional image processing methods produce some errors, our OASIS-Net can provide acceptable defect detection performance. We conducted ensemble learning based on multi-task classification to learn these loss values in parallel. The proposed method demonstrates a performance improvement in defect detection. The research contribution of this paper improves the model in the field of existing defect detection and presents new loss values. These capabilities can be useful in many industries, such as construction, maintenance, and manufacturing.
Regarding the limitations of this study, it is difficult to detect defects other than cracks, efflorescence, and spalling because they use customized characteristics. Future work could detect defects in more diverse fields in the field of defect detection. In addition, it is expected that various defects can be detected with higher accuracy by analyzing the characteristics of these defects and suggesting new losses by analyzing the customized characteristics.
Author Contributions
Conceptualization, S.B.Y.; methodology, Y.H. and S.B.Y.; software, Y.H.; validation, Y.H.; formal analysis, Y.H. and S.B.Y.; investigation, Y.H. and S.B.Y.; resources, Y.H. and S.B.Y.; data curation, Y.H. and S.B.Y.; writing—original draft preparation, Y.H. and S.B.Y.; writing—review and editing, S.B.Y.; visualization, S.B.Y.; supervision, S.B.Y.; project administration, S.B.Y.; funding acquisition, S.B.Y. All authors have read and agreed to the published version of the manuscript.
Funding
This work was supported by an Institute of Information & communications Technology Planning & Evaluation (IITP) grant funded by the Korean government (MSIT) (No.2021-0-02068, Artificial Intelligence Innovation Hub) and by the National Research Foundation of Korea (NRF) grant funded by the Korean government (MSIT) (NRF-2020R1A4A1019191). This work was also supported by the Industrial Fundamental Technology Development Program (No. 20018699) funded by the Ministry of Trade, Industry & Energy (MOTIE) of Korea.
Data Availability Statement
Not applicable.
Conflicts of Interest
The authors declare no conflict of interest.
References
- Mei, S.; Chen, X.; Zhang, Y.; Li, J.; Plaza, A. Accelerating Convolutional Neural Network-Based Hyperspectral Image Classification by Step Activation Quantization. IEEE Trans. Geosci. Remote Sens. 2022, 60, 1–12. [Google Scholar] [CrossRef]
- Nanni, L.; de Luca, E.; Facin, M.L.; Maguolo, G. Deep Learning and Handcrafted Features for Virus Image Classification. J. Imaging 2020, 6, 143. [Google Scholar] [CrossRef] [PubMed]
- Wang, W.; Liang, D.; Chen, Q.; Iwamoto, Y.; Han, X.-H.; Zhang, Q.; Hu, H.; Lin, L.; Chen, Y.-W. Medical Image Classification Using Deep Learning. In Deep Learning in Healthcare; Springer: Berlin/Heidelberg, Germany, 2020; pp. 33–51. [Google Scholar]
- Luo, Q.; Fang, X.; Su, J.; Zhou, J.; Zhou, B.; Yang, C.; Liu, L.; Gui, W.; Tian, L. Automated Visual Defect Classification for Flat Steel Surface: A Survey. IEEE Trans. Instrum. Meas. 2020, 69, 9329–9349. [Google Scholar] [CrossRef]
- Yang, Z.; Zhang, M.; Li, C.; Meng, Z.; Li, Y.; Chen, Y.; Liu, L. Image Classification for Automobile Pipe Joints Surface Defect Detection Using Wavelet Decomposition and Convolutional Neural Network. IEEE Access 2022, 10, 77191–77204. [Google Scholar] [CrossRef]
- YOLOv5. Available online: Https://Github.Com/Ultralytics/Yolov5 (accessed on 15 January 2022).
- Girshick, R. Fast R-CNN. In Proceedings of the 2015 IEEE International Conference on Computer Vision (ICCV), Santiago, Chile, 7–13 December 2015; pp. 1440–1448. [Google Scholar]
- Lin, Y.; Cai, R.; Lin, P.; Cheng, S. A Detection Approach for Bundled Log Ends Using K-Median Clustering and Improved YOLOv4-Tiny Network. Comput. Electron. Agric. 2022, 194, 106700. [Google Scholar] [CrossRef]
- Ghosh, R. A Faster R-CNN and Recurrent Neural Network Based Approach of Gait Recognition with and without Carried Objects. Expert Syst. Appl. 2022, 205, 117730. [Google Scholar] [CrossRef]
- Qiu, H.; Ma, Y.; Li, Z.; Liu, S.; Sun, J. BorderDet: Border Feature for Dense Object Detection. In Lecture Notes in Computer Science; Springer: Berlin/Heidelberg, Germany, 2020; pp. 549–564. [Google Scholar]
- Tan, M.; Pang, R.; Le, Q.v. EfficientDet: Scalable and Efficient Object Detection. In Proceedings of the 2020 IEEE/CVF Conference on Computer Vision and Pattern Recognition (CVPR), Seattle, WA, USA, 13–19 June 2020; pp. 10778–10787. [Google Scholar]
- Wang, P.; Wang, L.; Leung, H.; Zhang, G. Super-Resolution Mapping Based on Spatial–Spectral Correlation for Spectral Imagery. IEEE Trans. Geosci. Remote Sens. 2021, 59, 2256–2268. [Google Scholar] [CrossRef]
- Zhen, Z.; Liu, J.; Zhang, Z.; Wang, F.; Chai, H.; Yu, Y.; Lu, X.; Wang, T.; Lin, Y. Deep Learning Based Surface Irradiance Mapping Model for Solar PV Power Forecasting Using Sky Image. IEEE Trans. Ind. Appl. 2020, 56, 3385–3396. [Google Scholar] [CrossRef]
- Turkoglu, M.O.; D’Aronco, S.; Perich, G.; Liebisch, F.; Streit, C.; Schindler, K.; Wegner, J.D. Crop Mapping from Image Time Series: Deep Learning with Multi-Scale Label Hierarchies. Remote Sens. Environ. 2021, 264, 112603. [Google Scholar] [CrossRef]
- Onishi, M.; Ise, T. Explainable Identification and Mapping of Trees Using UAV RGB Image and Deep Learning. Sci. Rep. 2021, 11, 903. [Google Scholar] [CrossRef]
- Lee, I.; Yun, J.-S.; Kim, H.H.; Na, Y.; Yoo, S.B. LatentGaze: Cross-Domain Gaze Estimation through Gaze-Aware Analytic Latent Code Manipulation. arXiv 2022, arXiv:2209.10171. [Google Scholar]
- Yun, J.-S.; Na, Y.; Kim, H.H.; Kim, H.-I.; Yoo, S.B. HAZE-Net: High-Frequency Attentive Super-Resolved Gaze Estimation in Low-Resolution Face Images. arXiv 2022, arXiv:2209.10167. [Google Scholar]
- Yun, J.-S.; Yoo, S.-B. Single Image Super-Resolution with Arbitrary Magnification Based on High-Frequency Attention Network. Mathematics 2022, 10, 275. [Google Scholar] [CrossRef]
- Lee, S.; Yun, J.S.; Yoo, S.B. Alternative Collaborative Learning for Character Recognition in Low-Resolution Images. IEEE Access 2022, 10, 22003–22017. [Google Scholar] [CrossRef]
- Lee, S.-J.; Yun, J.-S.; Lee, E.J.; Yoo, S.B. HIFA-LPR: High-Frequency Augmented License Plate Recognition in Low-Quality Legacy Conditions via Gradual End-to-End Learning. Mathematics 2022, 10, 1569. [Google Scholar] [CrossRef]
- Lee, S.-J.; Yoo, S.B. Super-Resolved Recognition of License Plate Characters. Mathematics 2021, 9, 2494. [Google Scholar] [CrossRef]
- Qazweeni, J.A.; Daoud, O.K. Concrete Deterioration in a 20-Year-Old Structure in Kuwait. Cem. Concr. Res. 1991, 21, 1155–1164. [Google Scholar] [CrossRef]
- Costa, A.; Appleton, J. Case Studies of Concrete Deterioration in a Marine Environment in Portugal. Cem. Concr. Compos. 2002, 24, 169–179. [Google Scholar] [CrossRef]
- Hobbs, D.W. Concrete Deterioration: Causes, Diagnosis, and Minimising Risk. Int. Mater. Rev. 2001, 46, 117–144. [Google Scholar] [CrossRef]
- Dai, J.; Qi, H.; Xiong, Y.; Li, Y.; Zhang, G.; Hu, H.; Wei, Y. Deformable Convolutional Networks. In Proceedings of the 2017 IEEE International Conference on Computer Vision (ICCV), Venice, Italy, 22–29 October 2017; pp. 764–773. [Google Scholar]
- Kim, M.-K.; Sohn, H.; Chang, C.-C. Localization and Quantification of Concrete Spalling Defects Using Terrestrial Laser Scanning. J. Comput. Civ. Eng. 2015, 29, 04014086. [Google Scholar] [CrossRef]
- Vangi, D.; Bruzzi, M.; Caron, J.N.; Gulino, M.-S. Crack Detection with Gas-Coupled Laser Acoustic Detection Technique. Meas. Sci. Technol. 2021, 32, 095202. [Google Scholar] [CrossRef]
- González-Jorge, H.; Puente, I.; Riveiro, B.; Martínez-Sánchez, J.; Arias, P. Automatic Segmentation of Road Overpasses and Detection of Mortar Efflorescence Using Mobile LiDAR Data. Opt. Laser Technol. 2013, 54, 353–361. [Google Scholar] [CrossRef]
- Zhou, M.; Cheng, W.; Huang, H.; Chen, J. A Novel Approach to Automated 3D Spalling Defects Inspection in Railway Tunnel Linings Using Laser Intensity and Depth Information. Sensors 2021, 21, 5725. [Google Scholar] [CrossRef] [PubMed]
- Hu, Z.; Zhu, H.; Hu, M.; Ma, Y. Rail Surface Spalling Detection Based on Visual Saliency. IEEJ Trans. Electr. Electron. Eng. 2018, 13, 505–509. [Google Scholar] [CrossRef]
- Beckman, G.H.; Polyzois, D.; Cha, Y.-J. Deep Learning-Based Automatic Volumetric Damage Quantification Using Depth Camera. Autom. Constr. 2019, 99, 114–124. [Google Scholar] [CrossRef]
- Zhang, H.; Zou, Y.; del Rey Castillo, E.; Yang, X. Detection of RC Spalling Damage and Quantification of Its Key Properties from 3D Point Cloud. KSCE J. Civ. Eng. 2022, 26, 2023–2035. [Google Scholar] [CrossRef]
- Kim, B.; Cho, S. Automated Multiple Concrete Damage Detection Using Instance Segmentation Deep Learning Model. Appl. Sci. 2020, 10, 8008. [Google Scholar] [CrossRef]
- Shim, S.; Choi, S.-I.; Kong, S.-M.; Lee, S.-W. Deep Learning Algorithm of Concrete Spalling Detection Using Focal Loss and Data Augmentation. J. Korean Tunn. Undergr. Space Assoc. 2021, 23, 253–263. [Google Scholar]
- Huyan, J.; Li, W.; Tighe, S.; Xu, Z.; Zhai, J. CrackU-net: A Novel Deep Convolutional Neural Network for Pixelwise Pavement Crack Detection. Struct. Control Health Monit. 2020, 27, e2551. [Google Scholar] [CrossRef]
- Ni, F.; Zhang, J.; Chen, Z. Pixel-Level Crack Delineation in Images with Convolutional Feature Fusion. Struct. Control Health Monit. 2019, 26, e2286. [Google Scholar] [CrossRef]
- Zhou, Q.; Qu, Z.; Cao, C. Mixed Pooling and Richer Attention Feature Fusion for Crack Detection. Pattern Recognit. Lett. 2021, 145, 96–102. [Google Scholar] [CrossRef]
- Wu, X.; Ma, J.; Sun, Y.; Zhao, C.; Basu, A. Multi-Scale Deep Pixel Distribution Learning for Concrete Crack Detection. In Proceedings of the 2020 25th International Conference on Pattern Recognition (ICPR), Milan, Italy, 10–15 January 2021; pp. 6577–6583. [Google Scholar]
- Feng, C.; Zhang, H.; Wang, H.; Wang, S.; Li, Y. Automatic Pixel-Level Crack Detection on Dam Surface Using Deep Convolutional Network. Sensors 2020, 20, 2069. [Google Scholar] [CrossRef] [PubMed]
- Bai, Y.; Sezen, H.; Yilmaz, A. Detecting Cracks and Spalling Automatically in Extreme Events by End-to-End Deep Learning Frameworks. ISPRS Ann. Photogramm. Remote Sens. Spat. Inf. Sci. 2021, V-2–2021, 161–168. [Google Scholar] [CrossRef]
- Fang, F.; Li, L.; Gu, Y.; Zhu, H.; Lim, J.-H. A Novel Hybrid Approach for Crack Detection. Pattern Recognit. 2020, 107, 107474. [Google Scholar] [CrossRef]
- Ren, Y.; Huang, J.; Hong, Z.; Lu, W.; Yin, J.; Zou, L.; Shen, X. Image-Based Concrete Crack Detection in Tunnels Using Deep Fully Convolutional Networks. Constr. Build. Mater. 2020, 234, 117367. [Google Scholar] [CrossRef]
- Chen, T.; Cai, Z.; Zhao, X.; Chen, C.; Liang, X.; Zou, T.; Wang, P. Pavement Crack Detection and Recognition Using the Architecture of SegNet. J. Ind. Inf. Integr. 2020, 18, 100144. [Google Scholar] [CrossRef]
- Badrinarayanan, V.; Kendall, A.; Cipolla, R. SegNet: A Deep Convolutional Encoder-Decoder Architecture for Image Segmentation. IEEE Trans. Pattern Anal. Mach. Intell. 2017, 39, 2481–2495. [Google Scholar] [CrossRef]
- Li, H.; Xu, H.; Tian, X.; Wang, Y.; Cai, H.; Cui, K.; Chen, X. Bridge Crack Detection Based on SSENets. Appl. Sci. 2020, 10, 4230. [Google Scholar] [CrossRef]
- Isailović, D.; Stojanovic, V.; Trapp, M.; Richter, R.; Hajdin, R.; Döllner, J. Bridge Damage: Detection, IFC-Based Semantic Enrichment and Visualization. Autom. Constr. 2020, 112, 103088. [Google Scholar] [CrossRef]
- Chun, P.; Hayashi, S. Development of a Concrete Floating and Delamination Detection System Using Infrared Thermography. IEEE/ASME Trans. Mechatron. 2021, 26, 2835–2844. [Google Scholar] [CrossRef]
- Li, Z.; Wu, C.; Han, Q.; Hou, M.; Chen, G.; Weng, T. CASI-Net: A Novel and Effect Steel Surface Defect Classification Method Based on Coordinate Attention and Self-Interaction Mechanism. Mathematics 2022, 10, 963. [Google Scholar] [CrossRef]
- Ju, X.; Zhao, X.; Qian, S. TransMF: Transformer-Based Multi-Scale Fusion Model for Crack Detection. Mathematics 2022, 10, 2354. [Google Scholar] [CrossRef]
- Hong, Y.; Lee, S.; Yoo, S.B. AugMoCrack: Augmented Morphological Attention Network for Weakly Supervised Crack Detection. Electron. Lett. 2022, 58, 651–653. [Google Scholar] [CrossRef]
- LeCun, Y.; Boser, B.; Denker, J.S.; Henderson, D.; Howard, R.E.; Hubbard, W.; Jackel, L.D. Backpropagation Applied to Handwritten Zip Code Recognition. Neural Comput. 1989, 1, 541–551. [Google Scholar] [CrossRef]
- König, J.; Jenkins, M.; Mannion, M.; Barrie, P.; Morison, G. Weakly-Supervised Surface Crack Segmentation by Generating Pseudo-Labels Using Localization with a Classifier and Thresholding. arXiv 2021, arXiv:2109.0045. [Google Scholar] [CrossRef]
- Selvaraju, R.R.; Cogswell, M.; Das, A.; Vedantam, R.; Parikh, D.; Batra, D. Grad-CAM: Visual Explanations from Deep Networks via Gradient-Based Localization. Int. J. Comput. Vis. 2020, 128, 336–359. [Google Scholar] [CrossRef]
- Wu, K.; Otoo, E.; Suzuki, K. Optimizing Two-Pass Connected-Component Labeling Algorithms. Pattern Anal. Appl. 2009, 12, 117–135. [Google Scholar] [CrossRef]
- Grana, C.; Borghesani, D.; Cucchiara, R. Optimized Block-Based Connected Components Labeling with Decision Trees. IEEE Trans. Image Process. 2010, 19, 1596–1609. [Google Scholar] [CrossRef]
- Bolelli, F.; Allegretti, S.; Baraldi, L.; Grana, C. Spaghetti Labeling: Directed Acyclic Graphs for Block-Based Connected Components Labeling. IEEE Trans. Image Process. 2020, 29, 1999–2012. [Google Scholar] [CrossRef]
- Kanungo, T.; Mount, D.M.; Netanyahu, N.S.; Piatko, C.D.; Silverman, R.; Wu, A.Y. An Efficient K-Means Clustering Algorithm: Analysis and Implementation. IEEE Trans. Pattern Anal. Mach. Intell. 2002, 24, 881–892. [Google Scholar] [CrossRef]
- Otsu, N. A Threshold Selection Method from Gray-Level Histograms. IEEE Trans. Syst. Man. Cybern. 1979, 9, 62–66. [Google Scholar] [CrossRef]
- Suzuki, S.; Abe, K. Topological Structural Analysis of Digitized Binary Images by Border Following. Comput. Vis. Graph Image Process 1985, 29, 396. [Google Scholar] [CrossRef]
- Fitzgibbon, A.; Fisher, R. A Buyer’s Guide to Conic Fitting. In Proceedings of the British Machine Vision Conference 1995, Birmingham, UK, 24–26 September 1995; pp. 51.1–51.10. [Google Scholar]
- Gjoreski, M.; Lustrek, M.; Gams, M. Multi-Task Ensemble Learning for Affect Recognition. In Proceedings of the 2018 ACM International Joint Conference and 2018 International Symposium on Pervasive and Ubiquitous Computing and Wearable Computers, Singapre, 8–12 October 2018; ACM: New York, NY, USA, 2018; pp. 553–558. [Google Scholar]
- Wang, Q.; Zhang, L. Ensemble Learning Based on Multi-Task Class Labels. In Lecture Notes in Computer Science; Springer: Berlin/Heidelberg, Germany, 2010; pp. 464–475. [Google Scholar]
- Özgenel, Ç.F.; Sorguç, A.G. Performance Comparison of Pretrained Convolutional Neural Networks on Crack Detection in Buildings. In Proceedings of the 35th International Symposium on Automation and Robotics in Construction, Berlin, Germany, 22–25 July 2018. [Google Scholar]
- AIhub. Available online: https://aihub.or.kr/ (accessed on 15 January 2022).
- Russakovsky, O.; Deng, J.; Su, H.; Krause, J.; Satheesh, S.; Ma, S.; Huang, Z.; Karpathy, A.; Khosla, A.; Bernstein, M.; et al. ImageNet Large Scale Visual Recognition Challenge. Int. J. Comput. Vis. 2015, 115, 211–252. [Google Scholar] [CrossRef]
- Everingham, M.; Eslami, S.M.A.; van Gool, L.; Williams, C.K.I.; Winn, J.; Zisserman, A. The Pascal Visual Object Classes Challenge: A Retrospective. Int. J. Comput. Vis. 2015, 111, 98–136. [Google Scholar] [CrossRef]
- Everingham, M.; van Gool, L.; Williams, C.K.I.; Winn, J.; Zisserman, A. The Pascal Visual Object Classes (VOC) Challenge. Int. J. Comput. Vis. 2010, 88, 303–338. [Google Scholar] [CrossRef]
- Chen, X.; Girshick, R.; He, K.; Dollár, P. TensorMask: A Foundation for Dense Object Segmentation. In Proceedings of the 2019 IEEE/CVF International Conference Computer Vision (ICCV), Seoul, Korea, 27–28 October 2019; pp. 2061–2069. [Google Scholar] [CrossRef]
- Pinheiro, P.O.; Lin, T.-Y.; Collobert, R.; Dollàr, P. Learning to Refine Object Segments. In Lecture Notes in Computer Science; Springer: Berlin/Heidelberg, Germany, 2016; pp. 75–91. [Google Scholar]
- He, K.; Gkioxari, G.; Dollar, P.; Girshick, R. Mask R-CNN. In Proceedings of the 2017 IEEE International Conference on Computer Vision (ICCV), Venice, Italy, 22–29 October 2017; pp. 2980–2988. [Google Scholar]
- Lee, Y.; Park, J. CenterMask: Real-Time Anchor-Free Instance Segmentation. In Proceedings of the 2020 IEEE/CVF Conference on Computer Vision and Pattern Recognition (CVPR), Seattle, WA, USA, 14–19 June 2020; pp. 13906–13915. [Google Scholar] [CrossRef]
- Minaee, S.; Boykov, Y.Y.; Porikli, F.; Plaza, A.J.; Kehtarnavaz, N.; Terzopoulos, D. Image Segmentation Using Deep Learning: A Survey. IEEE Trans. Pattern Anal. Mach. Intell. 2021, 44, 3523–3542. [Google Scholar] [CrossRef]


Publisher’s Note: MDPI stays neutral with regard to jurisdictional claims in published maps and institutional affiliations. |
© 2022 by the authors. Licensee MDPI, Basel, Switzerland. This article is an open access article distributed under the terms and conditions of the Creative Commons Attribution (CC BY) license (https://creativecommons.org/licenses/by/4.0/).