Abstract
In view of the problems that the dragonfly algorithm has, such as that it easily falls into the local optimal solution and the optimization accuracy is low, an improved Dragonfly Algorithm (IDA) is proposed and applied to Otsu multi-threshold image segmentation. Firstly, an elite-opposition-based learning optimization is utilized to enhance the diversity of the initial population of dragonflies, laying the foundation for subsequent algorithm iterations. Secondly, an enhanced sine cosine strategy is introduced to prevent the algorithm from falling into local optima, thereby improving its ability to escape from local optima. Then, an adaptive t-distribution strategy is incorporated to enhance the balance between global exploration and local search, thereby improving the convergence speed of the algorithm. To evaluate the performance of this algorithm, we use eight international benchmark functions to test the performance of the IDA algorithm and compare it with the sparrow search algorithm (SSA), sine cosine algorithm (SCA) and dragonfly algorithm (DA). The experiments show that the algorithm performs better in terms of convergence speed and accuracy. At the same time, the Otsu method is employed to determine the optimal threshold, a series of experiments are carried out on six images provided by Berkeley University, and the results are compared with the other three algorithms. From the experimental results, the peak signal-to-noise ratio index (PSNR) and structural similarity index (SSIM) based on the IDA algorithm method are better than other optimization algorithms. The experimental results indicate that the application of Otsu multi-threshold segmentation based on the IDA algorithm is potential and meaningful.
Keywords:
dragonfly algorithm; Otsu algorithm; image segmentation; elite-opposition-based learning; sine and cosine strategy; adaptive t-distribution MSC:
68T20
1. Introduction
Image segmentation is one of the key tasks of computer vision technology and pattern recognition. It is the preprocessing step of many image processing tasks, and it is also the basis of related recognition operations and understanding of visual images such as target detection, feature extraction and target recognition [1]. Image segmentation is to divide the pixels in the image into several small areas according to the characteristics of each part, and find the targeted one [2]. At present, the commonly used image segmentation methods mainly include the threshold-based segmentation method, region-based segmentation method, edge-based segmentation method, clustering-based image segmentation method, and so on [3]. Among them, threshold segmentation is an image segmentation method with a simple calculation, easy understanding, strong practicability and without any complicated mathematical model or training process.
With the increase in iteration times, the computational complexity of the threshold segmentation method shows an exponential growth trend, while the traditional threshold segmentation method has low efficiency and poor segmentation effects, which can no longer meet the requirements of real-time performance. To address this issue, many scholars have proposed methods that combine swarm intelligence optimization algorithms to improve the segmentation effects of algorithms. The swarm intelligence algorithm is an optimization algorithm that simulates swarm behavior in nature. It mainly simulates the cooperation and coordination among group members to find the optimal solution to the problem. In recent years, many swarm intelligence algorithms have been applied to image segmentation. For example, particle swarm optimization (PSO) [4], ant colony optimization (ACO) [5], Sparrow Search Algorithm (SSA) [6], Gravity Search Algorithm (GSA) [7], firefly algorithm (FA) [8], cuckoo search (CS) [9], grey wolf optimizer (GWO) [10], whale optimization algorithm (WOA) [11], sine cosine algorithm (SCA) [12] fruit fly optimization algorithm (FOA) [13], and so on, which can greatly improve the efficiency and accuracy of image segmentation, so it has been widely used in various fields, such as agriculture, medicine, aerospace, and so on.
The dragonfly algorithm (DA) is a new intelligent optimization algorithm proposed by Seyedali Mirjalili in 2016 [14], which is inspired by the flight behavior of dragonflies. It enables us to conduct a global search in the entire search space, which helps to discover the global optimal solution. Its individuals can exchange information, which can improve the efficiency of algorithm search. It has a certain adaptability and can dynamically adjust the behavior of individuals during the search process. The dragonfly algorithm has good global search ability and fast convergence speed. It is suitable for solving various optimization problems, especially for continuous optimization problems. The dragonfly algorithm is a very effective swarm intelligence optimization algorithm, but it still has some problems, such as slow convergence speed, poor algorithm accuracy and its ease of falling into the local optimal solution. Therefore, many scholars have made further improvements and research on the algorithm. Bao, X. et al. [15] proposed a dragonfly algorithm based on opposition-based learning for multi-level color image segmentation. Xu, L. et al. [16] introduced a differential evolution strategy to the dragonfly algorithm and applied it to color image segmentation. Song, P. et al. [17] introduced a logistic chaotic mapping strategy and opposition-based learning strategy to the dragonfly algorithm, which improved the target positioning accuracy of sky-wave over-the-horizon radar. Zhang, L.Z.J. et al. [18]. proposed a hybrid multi-objective dragonfly algorithm to study the mixed-model U-shaped robotic assembly line balancing and sequencing problem. Sree, R. et al. [19] proposed a hybrid dragonfly algorithm with memory operators, which was combined with the PSO algorithm to enhance the local development ability, and experiments proved that the algorithm has certain advantages.
In order to solve the problem of the poor effect of traditional threshold and improve the shortcomings of the dragonfly algorithm, which easily falls into local solution and has slow convergence, this paper provides a multi-threshold image segmentation method based on the improved dragonfly algorithm. In this paper, elite-opposition-based learning is used to optimize the initial population and improve the diversity and quality of the population. Secondly, an improved sine cosine strategy is added to avoid the algorithm falling into the local optimal solution and improve the ability of the algorithm to jump out of the local optimal solution. Then, the adaptive t-distribution strategy is introduced to improve the ability to balance global development and local search and improve the convergence speed of the algorithm. The improved dragonfly algorithm (IDA) is compared with the sparrow search algorithm (SSA), sine and cosine optimization algorithm (SCA) and dragonfly optimization algorithm (DA) through eight basic functions, and the superiority of this algorithm is verified. Then the improved dragonfly algorithm is applied to the field of complex image segmentation. In this paper, the Otsu method is used to determine the optimal threshold, a series of experiments are carried out on six images provided by Berkeley University, and the results are compared with those of three other advanced meta-heuristic algorithms through peak signal-to-noise ratio index (PSNR) and structural similarity index (SSIM). The effectiveness of image segmentation based on the IDA algorithm is verified by PSNR and SSIM.
The rest of this paper is organized as follows: Section 2 introduces the Otsu threshold segmentation method; Section 3 introduces the standard dragonfly algorithm, and then describes the strategies used to improve the dragonfly algorithm, including elite-opposition-based learning strategy, improved sine and cosine strategy and adaptive t-distribution. Then the implementation steps of the improved dragonfly algorithm are introduced. Finally, the algorithm is tested and compared with other algorithms. Section 4 introduces the multi-threshold segmentation based on the improved dragonfly algorithm (IDA). Section 5 presents the comparison and analysis of experimental results between this algorithm and other algorithms. Finally, Section 6 provides the conclusion.
2. Threshold Segmentation Method
This section mainly introduces—Otsu threshold segmentation method.
2.1. Otsu Threshold Segmentation Method
The Otsu threshold segmentation method, known as the maximum between-class variance method, is an unsupervised, automatic, and non-parametric method proposed by the Japanese scholar Otsu in 1979 [20]. It is a classic algorithm in the field of image segmentation. According to the gray characteristics of the image, the image is divided into two parts: background and target. Its principle is to divide a digital image with the size of pixels into different gray levels. Each gray level has multiple pixel points; indicates that the image has L gray levels, and indicates the number of pixels with a gray level of i. Then the total number of pixels in the image is . The probability that a pixel will have a gray level of i is shown in Equation (1):
where ,, .
Select a threshold , and the target image is divided into foreground and background , where , . , are, respectively, expressed as the probability that a pixel is classified into , , and are, respectively, expressed as:
and are the average gray values of foreground and background , respectively, and is the average gray values of pixels with gray levels from 0 to . is the average gray value of the whole image, and the formulas of , , and are as follows.
In which two types of pixels meet any threshold :
The inter-class variance of each pixel value is selected as the evaluation index for evaluating the segmentation, results are as follows:
The expression of maximum between-class variance is
2.2. Multi-Threshold Otsu Image Segmentation
The multi-threshold of an image is an extension of the single threshold. The basic idea of the single-threshold Otsu algorithm is to divide the image into two categories according to the threshold: target and background. The multi-threshold Otsu algorithm divides the image into multiple categories, and each category can represent different targets or regions in the image. If the target image is to be divided into k layers, the variance after image segmentation is :
The maximum between-class variance of image multi-threshold is expressed as:
3. Optimization of Dragonfly Algorithm
This section mainly introduces the standard dragonfly algorithm and the improved dragonfly algorithm (IDA) using the elite-opposition-based learning strategy, improved sine and cosine strategy and adaptive t-distribution strategy; then, the performance of the IDA algorithm is briefly demonstrated by the test function.
3.1. Standard Dragonfly Algorithm
The main idea of the dragonfly optimization algorithm is to simulate the behavior of a dragonfly looking for prey in nature. In nature, dragonfly populations have two kinds of gregarious behaviors: hunting and migration [21]. The former is called the static (feeding) group, and the dragonfly group is divided into several small groups to fly back and forth in a small range to find prey, which indicates the process of optimizing development; the latter is called dynamic (migration) group, and a large number of dragonflies will gather in groups and make long-distance migration mistakes in one direction to look for better and more prey, which is the stage of optimization exploration. Their life trajectory and learning habits mainly depend on five behaviors: separation, alignment, gathering, foraging and avoiding natural enemies.
- Separation behavior:
It represents the behavior of a single dragonfly leaving the dragonfly population, and the indicates the separation of the ith dragonfly individual, which are as follows:
where X is the position of the current individual, indicates the position of the jth adjacent individual and N is the number of adjacent individuals.
- Alignment behavior:
It denotes the behavior of each dragonfly individual flying with its neighbors in the same path as it flies, and the alignment of the ith dragonfly individual is represented by as:
where is the speed of the jth neighboring dragonfly, and indicates the speed consistency of the group.
- Aggregation behavior:
It indicates the behavior of dragonfly individuals approaching the dragonfly population, and the represents the cohesion of the ith dragonfly individual as:
where X is the position of the current individual, denotes the position of the jth adjacent individual and N is the number of adjacent individuals.
- Foraging behavior:
It indicates the behavior of dragonflies flying towards food, and indicates that the attraction provided by food sources to dragonflies:
where is the position of food.
- Avoid predators:
It means that the individual dragonfly is alert enough to avoid natural enemies, and is used to indicate the degree of alertness:
where is the position of natural enemies.
The group behavior of dragonflies revolves around these five behaviors, but in order to calculate the position information of dragonflies more accurately, the algorithm adds two concepts: step vector and position vector X. The step vector shows the movement direction of dragonflies and is defined as:
where s is the separation weight, a is the alignment weight, c is the aggregation weight, f is the foraging weight, e is the enemy avoidance weight, is the inertia weight, and t is the current iteration number.
In order to improve the performance of the algorithm, the dragonfly algorithm sets two location update modes, and judges whether the dragonfly has adjacent individuals through the search radius r. When the Euclidean distance is less than r, it means that there are adjacent individuals around the individuals, and the position information is updated by Equation (16); when the Euclidean distance is greater than r, it means that there are no adjacent individuals around the individual, and the dragonfly updates its position information by means of Levy flight in Equation (17). The search radius r is defined as:
where a and b are the upper and lower limits of the search range, and t is the current iteration number. T is the maximum number of iterations.
where t is the current iteration number.
where , and are random numbers in the range and is constant.
3.2. Improved Dragonfly Algorithm
3.2.1. Population Initialization Based on Elite-Opposition-Based Learning Strategy
The standard dragonfly algorithm initializes the population in a random way, so the generated population will have the problem of uneven distribution, which will affect the convergence speed of the algorithm. In order to improve the diversity of the initial dragonfly population without affecting the results, and lay a good foundation for the latter global search and iteration of the algorithm in the later stage [22], in this paper, elite-opposition-based learning strategy is introduced in the initialization population [23]. The main idea of elite-opposition-based learning strategy is to find a feasible solution to the problem and its opposite solution and then choose the better solution from the two as the next generation of individuals to improve population diversity. The formula for the opposite solution is as follows:
where m is the random number in , is the current solution of the ith dragonfly in the population in the jth dimension, is the opposite solution of the ith dragonfly in the population in the jth dimension, and is the interval of the elite population.
3.2.2. Improved Sine Cosine Strategy
Due to the addition of the elite-opposition-based learning strategy, the population of the dragonfly algorithm is the elite population. Although the iterative convergence speed is improved, the individuals of the population will gather together quickly during the iterative process, and the diversity of the population will decline rapidly, resulting in the best individuals obtained by iteration many times remaining unchanged, and the probability of falling into the local optimal solution will increase. Therefore, in order to improve the performance of the dragonfly algorithm, this paper introduces an improved sine cosine strategy [24] to control the movement area of the individual population in the foraging stage of the dragonfly so as to avoid falling into the local optimal solution and improve the ability of the algorithm to jump to the local optimal solution. If the best individual obtained five times in a row does not change during the iterative process of the algorithm, it may fall into the local optimal solution, and then the improved sine cosine strategy of Formula (21) is executed to update the position information to jump out of the local optimal solution; otherwise, the position information is updated by Equation (16).
where , t is the current iteration number, and T is maximum iteration times. is an adaptive variable inertia weight coefficient for sine and cosine strategy to update position information. As the number of iterations increases, the value of will be adjusted automatically. , where , t is the current iteration number, and T is the maximum number of iterations. is a nonlinear decreasing function. It can control the transformation of the algorithm from global search to local development, and its value will gradually decrease with the increase in iteration times; when is large, the global search ability of the algorithm can be improved, but when is small, it is beneficial to the local development of the algorithm. , determines the distance to move to the optimal solution. , and when the is greater than 1, more attention will be paid to the overall optimal position; otherwise, there will be no obvious effect. is a random parameter from 0 to 1. , and when , the sine strategy is used to update the position information, and when , the cosine strategy is used to update the position information. is the optimal individual at the tth iteration.
3.2.3. Adaptive t-Distribution Strategy
Cauchy mutation and Gaussian distribution are two common methods in the swarm intelligence algorithm that can effectively improve the performance of the algorithm. Cauchy mutation can enhance the individual’s search ability in the solution space and enrich the population diversity, while Gaussian mutation can enhance the individual’s search ability near the optimal solution and speed up the convergence of the algorithm [25]. The Cauchy distribution and Gaussian distribution are two special boundary distributions of t-distribution [26]. With the increase in iteration times and degree of freedom parameters t, the t-distribution curve gradually approaches the Gaussian distribution from the Cauchy distribution at first. In this paper, the adaptive t-distribution strategy is used to disturb the position of dragonflies when they avoid natural enemies, which makes the algorithm have a good global development ability in the early stage of iteration and good local search ability in the late iteration, and improves the convergence speed of the algorithm.
where represents the t-distribution with the degree of freedom parameter f, where , t is the current number of iterations, and T is the maximum number of iterations. The parameters of adaptive t-distribution are self-adaptive, the parameters of freedom can be dynamically adjusted according to the characteristics of data, so as to adapt to the distribution of different data sets, and the complexity and variability of data can be accurately captured without making assumptions about data distribution in advance, thus improving the generalization performance of the model. Randomly generate a parameter , and when , a new solution generated by the adaptive t-distribution mutation perturbation of Equation (22) is adopted; when , the optimal solution is selected by Equation (16).
3.3. Implementation Steps of Improved Dragonfly Algorithm
In this paper, the basic dragonfly algorithm is improved. The improved dragonfly algorithm (IDA) uses elite reverse learning to initialize the population and uses an improved sine and cosine strategy and adaptive t-distribution strategy to improve the position vector. The flow chart of the algorithm is shown in Figure 1:
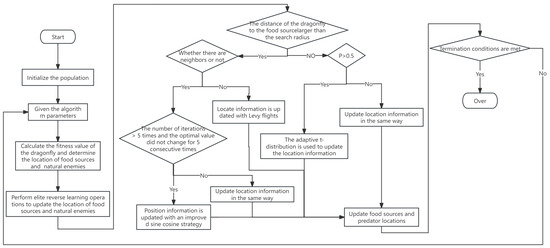
Figure 1.
Algorithm flowchart.
The basic steps of the improved dragonfly algorithm IDA are as follows:
Step 1: An initial population NP is randomly generated.
Step 2: Based on the algorithm parameters, including search radius r, inertia weight , separation weight s, alignment weight a, aggregation weight c, foraging weight f and enemy avoidance weight e, calculate the fitness value for each dragonfly; the best individual is selected as the position of the food and the worst individual is selected as the position of the natural enemy.
Step 3: Perform elite-opposition-based learning operation, select excellent individuals from the current population and the reverse population as a new population, recalculate the new fitness value update the positions of food sources and natural enemies.
Step 4: If the distance from the dragonfly to the food source is longer than the search radius r, there are adjacent individuals, there are more than 5 iterations and the optimal value has not changed for five consecutive iterations, the sine cosine strategy is executed to update the position information according to Equation (21). If the distance from the dragonfly to the food source is longer than the search radius r and the dragonfly has no adjacent individuals, then Levy flight is performed to update the position information according to Equation (17). If the distance from the dragonfly to the food source is not longer than the search radius r and , the adaptive t-distribution is performed to update the position information according to Equation (22); otherwise, update the position information according to Equation (16).
Step 5: Update the positions of food sources and natural enemies.
Step 6: Judge whether the termination condition is met. If so, exit the loop; otherwise, go back to Step 2, update the algorithm parameters and continue the loop.
3.4. Algorithm Testing and Analysis
3.4.1. Benchmark Test Function
In order to verify the overall performance of the proposed IDA algorithm, this experiment adopts the Windows 11 64-bit operating system with an Intel Core i7-12700H 2.30 GHz CPU and 16 G RAM (Lenovo Beijing Co., Ltd., Bejing, China), and the compilation environment is MATLAB R2021a. Eight test functions are selected for simulation experiments on MATLAB R2021a. These test functions are standard benchmark functions widely used in the field of computational intelligence to verify the performance of various optimization algorithms [27]. The test function information is shown in Table 1. It includes four unimodal test functions to evaluate the development ability of the algorithm, and four multimodal test functions to evaluate the search ability of the algorithm. The three-dimensional diagram of the test function is shown in Figure 2.

Table 1.
Eight standard test functions.
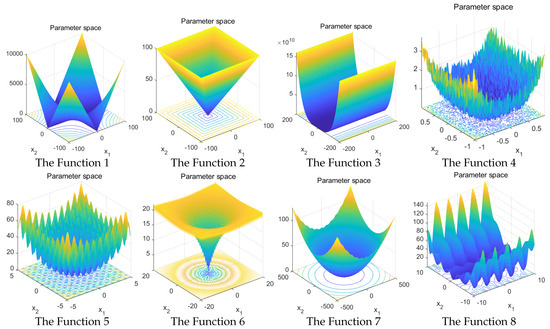
Figure 2.
Three-dimensional diagram of the test function.
3.4.2. Experimental Results and Analysis
In this paper, the standard DA algorithm, SSA algorithm, SCA algorithm and IDA algorithm are used to carry out simulation experiments on eight selected benchmark functions. In order to ensure the fairness of the experiment, the population size is set to 30, the maximum number of iterations is 100, the experiments independently run for 30 times, and the mean, standard deviation and best value of the DA algorithm, SSA algorithm and SCA algorithm in 30 dimensions are calculated. The statistics of test results of different algorithms are shown in Table 2. The best data of their mean standard deviation and best value are underlined for the four algorithms.
Table 2.
Statistics of test results of different algorithms.
The comparison results of test functions in Table 2 can directly reflect the optimization effect and convergence speed of the algorithm, and the IDA algorithm has the best optimization performance on different test functions. When solving unimodal functions , the mean and standard deviation of IDA algorithm are the closest to 0. In and , the optimal values of SSA algorithm and SCA algorithm are the best, but in , the difference between the optimal values of IDA algorithm and SSA algorithm is the smallest, and in , the difference between the optimal values of IDA algorithm and SCA algorithm is the smallest. This shows that the IDA algorithm easily falls into the local optimal solution among the two test functions of and , but it is also improved in the DA algorithm. When solving multimodal functions , the average and optimal solutions of IDA algorithm are optimal compared with other algorithms, among which the optimal solutions of and reach 0. Although all four algorithms can reach the vicinity of the optimal solution, the convergence accuracy of the DA algorithm, SSA algorithm and SCA algorithm are relatively poor.
As can be seen from Figure 3, for the test functions and , although the four algorithms do not reach the optimal solution after 100 iterations, the convergence speed of the IDA algorithm with elite-opposition-based learning, improved sine cosine strategy and adaptive t-distribution are far ahead of the other algorithms. Moreover, after 100 iterations, the accuracy of IDA algorithm on the test function is improved by orders of magnitude compared with other algorithms, and the accuracy of the IDA algorithm on the test function is orders of magnitude higher than that of other algorithms. For the test functions and , although the convergence speed of IDA is relatively slow in the early stage of algorithm iteration, in the later stage, its convergence speed accelerates and achieves higher optimization accuracy first. For the test functions , although the optimal accuracy is not achieved, the convergence speed of the IDA algorithm is much faster. For the test function , the IDA algorithm not only shows excellent convergence speed, but also shows accurate optimization ability.
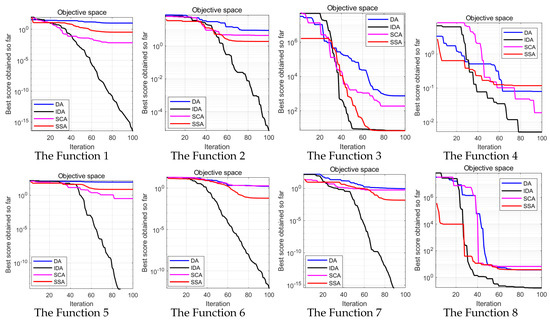
Figure 3.
Convergence curves of different algorithms.
To sum up, in light of the above eight benchmark functions, the convergence speed and accuracy of the IDA algorithm are better than those of the DA algorithm, SSA algorithm and SCA algorithm. Experiments fully prove that the introduction of elite reverse learning, the improved sine and cosine strategy and the adaptive t-distribution strategy can effectively improve the convergence speed and accuracy of the DA algorithm.
4. Multi-Threshold Image Segmentation Based on IDA
The principle of the Otsu algorithm is to find a suitable threshold to segment the image, and the variance between classes of foreground and background obtained through threshold segmentation is the largest [28]. This principle needs to be iterated continuously to find the maximum threshold of inter-class variance, which will lead to the problems of a complicated calculation and low efficiency in the Otsu algorithm. In order to solve this problem, the swarm intelligence algorithm is added to transform the threshold image segmentation problem into the optimization problem of the swarm intelligence algorithm to solve the optimal solution of the target fitness function. In this paper, the IDA algorithm takes the maximum between-class variance function of the image as the fitness function to solve the optimal segmentation threshold of the image. The function expression is shown in Equation (23):
The flow chart of obtaining the optimal threshold by IDA-optimized multi-threshold image segmentation algorithm (Figure 4):
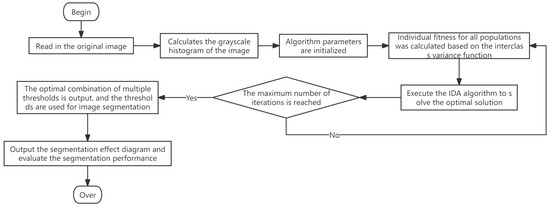
Figure 4.
Flow chart of multi-threshold algorithm for IDA optimization.
Steps of IDA-optimized multi-threshold image segmentation algorithm:
Step 1: Read the image to be segmented, perform gray processing on the image, and set corresponding parameters such as threshold number, initial population size, maximum number of iterations, optimization dimension, upper and lower bounds of search space, etc.
Step 2: The maximum between-class variance function is used as the fitness function to calculate the individual fitness.
Step 3: Execute the IDA algorithm to find the optimal solution.
Step 4: Increase the number of iterations, judge whether the algorithm reaches the termination condition, and if so, input the optimal solution. Otherwise, return to step 2.
Step 5: Input the optimal multi-threshold combination and perform image segmentation by using the multi-threshold combination.
Step 6: Output the segmentation effect diagram and evaluate the segmentation performance.
5. Experimental Simulation and Result Analysis
This section mainly focuses on the experiment of the improved IDA algorithm in image segmentation and explains the setting of the experiment in detail as well as the analysis of evaluation indicators and experimental results.
5.1. Experimental Setup
In order to verify the effectiveness of the algorithm for image segmentation, this paper selects six RGB images with the size of Image (from the data set BSDS500 provided by Berkeley University [29]) as the segmentation object. The experimental segmentation test charts(image(a),image(b),image(c),image(d),image(e),image(f)) and their corresponding gray histogram are shown in Figure 5. The population size of the algorithm is set to , the maximum number of iterations is , and the upper and lower bounds of the search space are . Then, the DA-Otsu algorithm, SSA-Otsu algorithm, SCA-Otsu algorithm and IDA-Otsu algorithm are used to compare the image segmentation experiments.
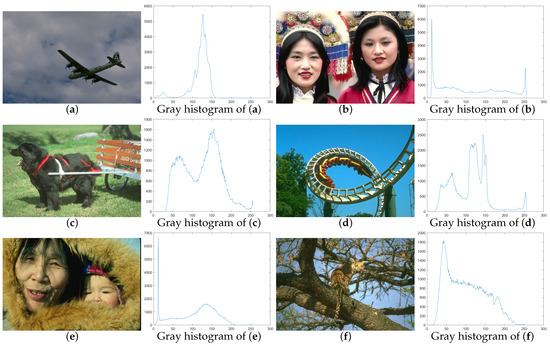
Figure 5.
Experimental segmentation test charts and the corresponding gray histograms.
5.2. Evaluation Index of Image Segmentation Quality
In order to evaluate the advantages and disadvantages of image segmentation algorithms, this paper selects two indicators, namely peak signal-to-noise ratio (PSNR) and structural similarity index (SSIM), to evaluate the performance differences in the DA-Otsu algorithm, SSA-Otsu algorithm, SCA-Otsu algorithm and IDA-Otsu algorithm.
- Peak signal-to-noise ratio:
Peak signal-to-noise ratio (PSNR) is an index to measure the degree of image distortion based on the error between corresponding pixels. The higher the PSNR value, the lesser the degree of image distortion is [30]. It is defined as follows:
where MSE represents the mean square error of the original image and the segmented image is indicated. indicates the size of the image.
- Structural similarity:
Structural similarity (SSIM) is an index used to evaluate the similarity between the original image and the segmented image. The higher the SSIM value, the better the structural similarity [31]. The calculation formula of SSIM structural similarity measurement is as follows:
where and are the average gray level of the original image and the segmented image, respectively; and are the squares of the original image and the segmented image, respectively; is the covariance of the original image and the segmented image; ,.
5.3. Experimental Numerical Results and Analysis
Table 3 shows the experimental results of the DA-Otsu algorithm, SSA-Otsu algorithm, SCA-Otsu algorithm and IDA-Otsu algorithm, in which the PSNR value and SSIM value of the four algorithms are shown, and the best data are underlined among the four algorithms.
Table 3.
Comparison chart of experimental results.
As can be seen from Table 3, when the maximum between-class variance function is taken as the objective function, the PSNR value and SSIM value obtained by using IDA-Otsu algorithm for image multi-threshold segmentation are far better than those obtained by the other three algorithms. When the PSNR value is used as the evaluation index, the IDA-Otsu algorithm performs best in both the double threshold and the triple threshold of Figure 5d,f. The IDA-Otsu algorithm has the highest PSNR value in the double thresholds in Figure 5a, and increases the PSNR value by on the basis of the original DA algorithm, although the PSNR value of the three thresholds in Figure 5a is not the highest, but the PSNR value of the IDA-Otsu algorithm is higher than that of the SCA-Otsu algorithm and the DA-Otsu algorithm. The PSNR values of the IDA-Otsu algorithm in Figure 5b,c,e are the best in the three thresholds, in which the PSNR values obtained by the IDA-Otsu algorithm in Figure 5b,c are slightly inferior to the PSNR values of the SCA-Otsu algorithm in the two thresholds, while the PSNR values obtained by the IDA-Otsu algorithm in Figure 5e are slightly inferior to the PSNR values of the SSA-Otsu algorithm in the two thresholds.
When the SSIM value is taken as the evaluation standard of image quality, the IDA-Otsu algorithm performs best in both the double threshold and the triple threshold of Figure 5a,f, but worse in the double threshold and the triple threshold of Figure 5c. The IDA-Otsu algorithm has the best SSIM value in the three thresholds of Figure 5b,e, but the SSIM value is only less than that of the SCA-Otsu algorithm in the double threshold of Figure 5b, and the SSIM value is only less than that of the SSA-Otsu algorithm in the double threshold of Figure 5e. The SSIM value of IDA-Otsu algorithm is the best in the two thresholds in Figure 5d, and it is only less than that of SCA-Otsu algorithm in the three thresholds in Figure 5d.
Figure 6 and Figure 7 are the result of image segmentation. Through Table 3 and Figure 6 and Figure 7, it can be found that the effect of image segmentation with three thresholds is better than that with two thresholds. When the threshold number is 3, the PSNR value and SSIM value are greatly improved than those when the threshold number is 2, that is, the degree of image distortion is reduced and the quality of the segmented image is more similar to that of the original image.
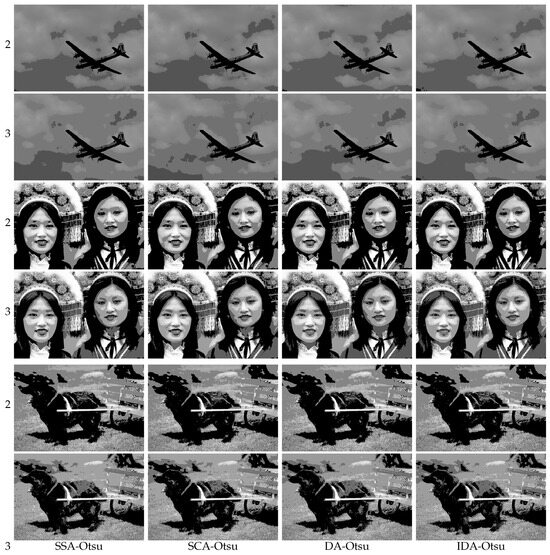
Figure 6.
Image segmentation results of multi-threshold and triple threshold in Figure 5a–c.
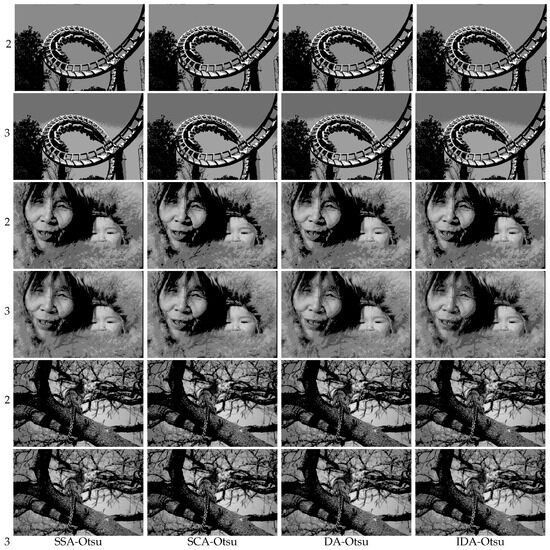
Figure 7.
Image segmentation results of multi-threshold and triple threshold in Figure 5d–f.
6. Concluding Remarks
Aiming at the problem of the dragonfly algorithm and multi-threshold segmentation, a multi-threshold image segmentation method based on the IDA algorithm is proposed. In this paper, firstly, the elite-opposition-based learning strategy is added to initialize the population, which is used to solve the problem of uneven distribution of the population and improve the quality and diversity of the population. Secondly, the improved sine cosine strategy is introduced, which is helpful for the algorithm to jump out of local optimization and improve the optimization accuracy of the algorithm. Then an adaptive t-distribution strategy is added to improve the convergence speed of the algorithm. The IDA algorithm is simulated and compared with the SSA algorithm, SCA algorithm and DA algorithm through eight classic test functions, and then the Otsu algorithm is taken as the objective function to determine the optimal threshold. The experiment is based on six images provided by Berkeley University, and the performance of the IDA algorithm is compared with other algorithms by PSNR and SSIM. According to the experimental comparison of test functions, the IDA algorithm shows excellent convergence speed and accurate optimization ability. Among , , , and , three test indexes of IDA algorithm are the closest to the optimal value, and the accuracy of and is greatly improved compared with other algorithms, at least by and , respectively. The experiment of Otsu multi-threshold image segmentation shows that when the threshold is increased from 2 to 3, the corresponding PSNR and SSIM values of the image are greatly improved, the distortion of the image is reduced and the similarity between the segmented image and the original image is improved. Moreover, the two indexes of Otsu multi-threshold image segmentation based on IDA algorithm are improved in the two indexes of Otsu multi-threshold image segmentation based on DA algorithm, and most of them are better than the SSA algorithm and SCA algorithm. This shows that the IDA algorithm can be effectively applied to the Otsu method, and it shows good performance in static images, human images and animal images. Therefore, this method can effectively complete the complex image segmentation tasks in life and provide an effective technology for image segmentation.
In the future, we will use more improvement strategies to improve the accuracy and convergence efficiency of the DA algorithm, and we will also study how to make the proposed method enhance the performance of image segmentation.
Author Contributions
Y.D., M.L. and M.Z. contributed to the idea of this paper; Y.D. performed the experiments; Y.D. wrote the paper; Y.D., M.L. and M.Z. contributed to the revision of this paper. All authors have read and agreed to the published version of the manuscript.
Funding
This research was funded by the National Natural Science Foundation of China and the Scientific Research plan of Educational Commission of Hubei Province of China. The grant numbers are 62173049 and D20211302, respectively.
Data Availability Statement
Publicly available datasets were analyzed in this study. This data can be found here: https://www.datafountain.cn/datasets/4821.
Conflicts of Interest
The authors declare no conflicts of interest.
References
- Horng, M.H. Multilevel thresholding selection based on the artificial bee colony algorithm for image segmentation. Expert Syst. Appl. 2011, 38, 13785–13791. [Google Scholar] [CrossRef]
- Peng, W.U. Image segmentation method based on firefly algorithm and maximum entropy method. Comput. Eng. Appl. 2014, 50, 115–119. [Google Scholar]
- Lin, K.Y.; Wu, J.H.; Xu, L.H. A survey on color image segmentation techniques. J. Image Graph. 2005, 10, 1–10. [Google Scholar]
- Nie, F.; Gao, C.; Guo, Y. Infrared Human Image Segmentation Using Fuzzy Havrda-Charvat Entropy and Chaos PSO Algorithm. Jisuanji Fuzhu Sheji Tuxingxue Xuebao J. Comput. Aided Des. Comput. Graph. 2010, 22, 129–135. [Google Scholar]
- Wang, D.; Li, R.; Wang, B. An Adaptive Evolution ACO Algorithm for Image Segmentation. In Proceedings of the International Conference on Signal Processing Systems 2010, Dalian, China, 5–7 October 2010. [Google Scholar]
- Geng, J.; Sun, X.; Wang, H.; Bu, X.; Liu, D.; Li, F.; Zhao, Z. A modified adaptive sparrow search algorithm based on chaotic reverse learning and spiral search for global optimization. Neural Comput. Appl. 2023, 35, 24603–24620. [Google Scholar] [CrossRef]
- Han, X.H.; Xiong, X.; Duan, F. A new method for image segmentation based on BP neural network and gravitational search algorithm enhanced by cat chaotic mapping. Appl. Intell. 2015, 43, 855–873. [Google Scholar] [CrossRef]
- He, L.; Huang, S. Modified firefly algorithm based multilevel thresholding for color image segmentation. Neurocomputing 2017, 204, 152–174. [Google Scholar] [CrossRef]
- Bhandari, A.K.; Singh, V.K.; Kumar, A.; Singh, G.K. Cuckoo search algorithm and wind driven optimization based study of satellite image segmentation for multilevel thresholding using Kapur’s entropy. Expert Syst. Appl. 2014, 41, 3538–3560. [Google Scholar] [CrossRef]
- Yu, H.; Song, J.; Chen, C.; Heidari, A.A.; Liu, J.; Chen, H.; Zaguia, A.; Mafarja, M. Image segmentation of Leaf Spot Diseases on Maize using multi-stage Cauchy-enabled grey wolf algorithm. Eng. Appl. Artif. Intell. 2022, 109, 104653. [Google Scholar] [CrossRef]
- Elaziz, M.A.; Lu, S.; He, S. A Multi-leader Whale Optimization Algorithm for Global Optimization and Image Segmentation. Expert Syst. Appl. 2021, 175, 114841. [Google Scholar] [CrossRef]
- Mishra, S.; Gelmecha, D.J.; Singh, R.S.; Rathee, D.S.; Gopikrishna, T. Hybrid WCA–SCA and modified FRFCM technique for enhancement and segmentation of brain tumor from magnetic resonance images. Biomed. Eng. Appl. Basis Commun. 2021, 33, 2150017. [Google Scholar] [CrossRef]
- Peng, Q.W.; Luo, W.; Feng, M.; Hao, X.L.; Hou, L.; Ju, X.M. Novel method for image segmentation based on improved two-dimensional Otsu and fruit fly algorithm. J. Comput. Appl. 2017, 37, 193–197. [Google Scholar]
- Mirjalili, S. Dragonfly algorithm: A new meta-heuristic optimization technique for solving single-objective, discrete, and multi-objective problems. Neural Comput. Appl. 2016, 27, 1053–1073. [Google Scholar] [CrossRef]
- Bao, X.; Jia, H.; Lang, C. Dragonfly Algorithm with Opposition-Based Learning for Multilevel Thresholding Color Image Segmentation. Symmetry 2019, 11, 716. [Google Scholar] [CrossRef]
- Xu, L.; Jia, H.; Lang, C.; Peng, X.; Sun, K. A Novel Method for Multilevel Color Image Segmentation Based on Dragonfly Algorithm and Differential Evolution. IEEE Access 2019, 7, 19502–19538. [Google Scholar] [CrossRef]
- Ping, S.; Yian, L. Multi-Static Sky-Wave Over-the-Horizon Radar Location Model Based on Improved Dragonfly Algorithm. ILaser Optoelectron. Prog. 2018, 55, 112001. [Google Scholar] [CrossRef]
- Zhang, L.Z.J. Balancing and sequencing problem of mixed-model U-shaped robotic assembly line: Mathematical model and dragonfly algorithm based approach. Appl. Soft Comput. 2021, 98, 106739. [Google Scholar] [CrossRef]
- Sree Ranjini, K.S.S. Memory based Hybrid Dragonfly Algorithm for numerical optimization problems. Expert Syst. Appl. 2017, 83, 63–78. [Google Scholar] [CrossRef]
- Otsu, N. A threshold selection method from gray-level histograms. IEEE Trans. Syst. Man Cybern. 1979, 9, 62–66. [Google Scholar] [CrossRef]
- Hammouri, A.I.; Mafarja, M.; Al-Betar, M.A.; Awadallah, M.A.; Abu-Doush, I. An improved Dragonfly Algorithm for feature selection. Knowl.-Based Syst. 2020, 203, 106131. [Google Scholar] [CrossRef]
- Saisai, J.; Yongcun, C.; Yong, L. An improved artificial bee colony algorithm with opposition-based learning. IET Image Process. 2020, 14, 3639–3650. [Google Scholar]
- Elgamal, Z.M.; Yasin, N.M.; Sabri, A.Q.M.; Sihwail, R.; Tubishat, M.; Jarrah, H. Improved Equilibrium Optimization Algorithm Using Elite Opposition-Based Learning and New Local Search Strategy for Feature Selection in Medical Datasets. Computation 2021, 9, 68. [Google Scholar] [CrossRef]
- Abd Elaziz, M.; Oliva, D.; Xiong, S. An Improved Opposition-Based Sine Cosine Algorithm for Global Optimization. Expert Syst. Appl. 2017, 90, 484–500. [Google Scholar] [CrossRef]
- Li, S.; Li, J. Chaotic dung beetle optimization algorithm based on adaptive t-Distribution. In Proceedings of the 2023 IEEE 3rd International Conference on Information Technology–Big Data and Artificial Intelligence (ICIBA), Chongqing, China, 26–28 May 2023. [Google Scholar]
- Xiaoxin, D.U.; Jianfei, Z.; Ming, S. Artificial glowworm swarm optimization algorithm based on adaptive t distribution mixed mutation. J. Comput. Appl. 2013, 33, 1922–1925. [Google Scholar]
- Jamil, M.; Yang, X.-S. A literature survey of benchmark functions for global optimization problems. Int. J. Math. Model. Numer. Optim. 2013, 4, 150–1940. [Google Scholar]
- Qu, Z.; Zhang, L. Research on Image Segmentation Based on the Improved Otsu Algorithm. In Proceedings of the 2010 2nd International Conference on Intelligent Human–Machine Systems and Cybernetics, Nanjing, China, 26–28 August 2010; IEEE: Piscataway, NJ, USA, 2010. [Google Scholar]
- Martin, D.; Fowlkes, C.; Tal, D.; Malik, J. A database of human segmented natural images and its application to evaluating segmentation algorithms and measuring ecological statistics. In Proceedings of the 8th IEEE International Conference on Computer Vision, Vancouver, BC, Canada, 7–14 July 2001; IEEE: Piscataway, NJ, USA, 2001. [Google Scholar]
- Huynh-Thu, Q.; Ghanbari, M. Scope of validity of PSNR in image/video quality assessment. Electron. Lett. 2008, 44, 800–801. [Google Scholar] [CrossRef]
- Alain, H.; Ziou, D. Image quality metrics: PSNR vs. SSIM. In Proceedings of the 20th International Conference on Pattern Recognition, Istanbul, Turkey, 23–26 August 2010. [Google Scholar]
Disclaimer/Publisher’s Note: The statements, opinions and data contained in all publications are solely those of the individual author(s) and contributor(s) and not of MDPI and/or the editor(s). MDPI and/or the editor(s) disclaim responsibility for any injury to people or property resulting from any ideas, methods, instructions or products referred to in the content. |
© 2024 by the authors. Licensee MDPI, Basel, Switzerland. This article is an open access article distributed under the terms and conditions of the Creative Commons Attribution (CC BY) license (https://creativecommons.org/licenses/by/4.0/).