Article

Sustainable Road Infrastructure Decision-Making: Custom NSGA-II with Repair Operators for Multi-Objective Optimization

1
Institute of Concrete Science and Technology (ICITECH), Universitat Politècnica de València, 46022 València, Spain
2
Escuela de Ingeniería de Construcción y Transporte, Pontificia Universidad Católica de Valparaíso, Valparaíso 2362804, Chile
*
Author to whom correspondence should be addressed.
Mathematics 2024, 12(5), 730; https://doi.org/10.3390/math12050730
Submission received: 8 February 2024 / Revised: 24 February 2024 / Accepted: 26 February 2024 / Published: 29 February 2024
(This article belongs to the Special Issue Combinatorial Optimization: Trends and Applications)

Abstract

:
The integration of sustainability principles into the structural design and decision-making processes for transportation infrastructure, particularly concerning reinforced concrete precast modular frames (RCPMF), is recognized as crucial for ensuring outcomes that are environmentally responsible, economically feasible, and socially beneficial. In this study, this challenge is addressed, with the significance of sustainable development in modern engineering practices being underscored. A novel approach, which is a combination of multi-objective optimization (MOO) with multi-criteria decision-making (MCDM) techniques, is proposed, tailored specifically for the design and selection of RCPMF. The effectiveness of three repair operators—statistical-based, random, and proximity-based—in optimizing economic, environmental, and social objectives is evaluated. Precise evaluation of objective functions is facilitated by a customized Non-dominated Sorting Genetic Algorithm II (NSGA-II) algorithm, complemented by a detailed life cycle analysis (LCA). The utilization of simple additive weighting (SAW) and fair un choix adéquat (FUCA) methods for the scoring and ranking of the MOO solutions has revealed that notable excellence in meeting the RCPMF design requirements is exhibited by the statistical-based repair operator, which offers solutions with lower impacts across all dimensions and demonstrates minimal variability. MCDM techniques produced similar rankings, with slight score variations and a significant correlation of 0.9816, showcasing their consistent evaluation capacity despite distinct operational methodologies.

1. Introduction

Transport infrastructure plays a pivotal role in enhancing the quality of life and propelling global economic and social advancement. This importance is evidenced by the allocation of over 20% of the World Bank’s loans to transportation infrastructure in recent years [1]. The construction industry, accounting for 9% of Europe’s GDP, is on track to expand into a USD 14 trillion global industry by 2025 [2]. In light of this growth, fostering sustainable development in transportation infrastructure becomes imperative. This challenge requires integrating the three key pillars of sustainability—economic, environmental, and social–into transport infrastructure’s design and operational strategies [3,4,5].
In contemporary structural engineering, it is critical to extend beyond adhering to technical standards by incorporating sustainability principles from the design stage. This holistic approach demands integrating complex criteria into the decision-making process of structural design [6,7,8]. Researchers have increasingly employed multi-objective optimization (MOO) techniques for concurrently considering multiple criteria, thus yielding balanced and optimal solutions in civil engineering [9].
Previous research focused on applying single-objective optimization (SOO) strategies to minimize the economic cost and embodied energy in transportation infrastructure solutions [10]. Recently, there has been a shift towards employing MOO in the design of various structural typologies, from reinforced concrete buildings to wind turbine foundations [11,12]. Adopting MOO strategies marks a significant progression in harmonizing technical compliance with sustainability objectives within structural engineering [13].
Aligning MOO in structural design with contemporary industry trends, particularly the emphasis on integrating sustainability principles from the outset, significantly enhances the effectiveness of the multi-criteria decision-making (MCDM) process. Furthermore, it highlights its escalating relevance in modern structural engineering practices [14].
The intersection of secondary routes with primary roads presents a frequent challenge in transportation networks. Reinforced concrete road frames are a versatile solution to manage this issue. These road frames in transportation infrastructure have been predominantly constructed on-site as reinforced concrete cast-in-place frames (RCCPF). However, recent research exploring the reduction in economic costs through SOO of reinforced concrete precast modular frames (RCPMF) has identified precasting as a viable alternative for road networks [15]. Furthermore, environmental assessments focusing on factors such as CO2 emissions and embodied energy indicated that RCPMF presents environmental benefits compared to RCCPF [16]. Conceiving a systematic method based on objective analysis for enhanced structural decision-making is a relevant research avenue [17]. This study introduces a MOO strategy utilizing the Non-dominated Sorting Genetic Algorithm II (NSGA-II) for the optimal design of RCPMF [18]. The NSGA-II algorithm is specifically adapted to minimize the final cost, environmental life cycle analysis (ELCA), and social life cycle analysis (SLCA) endpoint results [19]. Customized crossover and mutation operators are implemented into the NSGA-II algorithm to adapt the specific nature of NSGA-II to the mixed-integer programming (MIP) nature of the RCPMF problem. Furthermore, the study develops, implements, and evaluates the performance of three distinct repair operators. The optimal designs derived from the MOO process are subsequently examined and evaluated through two MCDM techniques: single additive weighting (SAW) and fair un choix adéquat (FUCA) [20]. Both methods employ an entropy theory-based criteria weighting computation for an objective and data-informed weighting process [21].
Integrating MCDM techniques with MOO methodologies capitalizes on the inherent strengths of both approaches. MOO enables the generation of optimal solution sets that consider the economic, environmental, and social dimensions of the RCPMF life cycle in a balanced manner. MCDM methodologies add a further dimension by providing a systematic framework for evaluating, scoring, and ranking these optimal solutions. As a result, the novel approach presented in this study effectively balances and evaluates economic feasibility with environmental and social impacts throughout the entire life cycle of the structure.
Merging MOO with MCDM presents unique challenges, especially when applied to complex engineering contexts, as detailed in this study. This integration requires a thorough understanding of the optimization objectives and the decision-making criteria. In this analysis, the MOO objectives are crafted carefully considering life cycle sustainability, derived from an exhaustive analysis of critical factors that influence sustainable infrastructure development, ensuring an unbiased representation of economic, environmental, and social factors. Moreover, the objectives are aligned with MCDM criteria to reflect stakeholder priorities accurately throughout the structure’s life cycle. Harmonizing and weighting these criteria demands meticulous consideration of the diverse priorities underpinning sustainable development.
This research outlines a clear and methodical strategy to effectively facilitate the integration of MOO and MCDM, formulating a coherent framework for practical implementation. Three novel repair operators are introduced within the NSGA-II algorithm, designed to optimize the RCPMF while addressing the MIP challenges. These operators play a crucial role in refining solutions to ensure they meet constraints and enhance feasibility. Adjustments are made randomly by the first operator, facilitating exploration of new solution spaces. Modifications guided by proximity concepts are employed by the second operator, steering towards previously successful solutions. The third operator utilizes statistical methods, drawing on data patterns for solution improvements. The efficient exploration of the solution space is enabled and adherence to constraints is ensured, significantly enhancing the quality of the solutions and contributing to the sustainable and cost-effective design of infrastructure.
Section 2.2 of this paper elaborates on the customized version of the NSGA-II algorithm integrating tailored crossover and mutation operators. Section 2.3 and Section 3.1 focus on introducing and evaluating the effectiveness of three distinct repair operators, emphasizing their performance in generating optimal solutions. The application of MOO to the RCPMF problem, detailed in Section 2.1, aims to broaden the existing knowledge and understanding of RCPMF design. The MCDM strategy, described in Section 2.4, allows for a better-informed decision-making process, yielding the results evaluated in Section 3. The approach is designed to effectively balance economic feasibility with the environmental and social impacts throughout the entire structure life cycle.

2. Methods

This section provides a comprehensive overview of the RCPMF problem and delineates the NSGA-II algorithm as the selected MOO strategy. Furthermore, it delves into the entropy theory-based weighting method and the MCDM approaches, specifically delineating the SAW and FUCA techniques employed to assess the optimal solutions derived from the MOO process.

2.1. Optimization Problem Overview

MOO involves identifying a vector X , comprising n variables, that minimizes k objective functions while adhering to m constraints. Equations (1) through (3) delineate the foundational structure for a generic MOO problem.
X = x 1 , x 2 , , x n
m i n ( f i ( X ) ) = m i n ( f 1 ( X ) , f 2 ( X ) , , f k ( X ) )
g m ( X ) 0
The optimization problem of this research consists of the design of a RCPMF. The specified structure extends 10 m horizontally, has a height of 5 m, and is buried to a depth of 5 m. Section 2.1.1 and Section 2.1.2 detail the variables, parameters, and constraints integral to the RCPMF problem. Adopting a comprehensive MOO approach, this study integrates the three pillars of sustainability: the economic cost of the structure, the ELCA endpoint single score, and the SLCA endpoint score. These elements, elaborated on in Section 2.1.3, are the objective functions earmarked for minimization.

2.1.1. Variables and Parameters

The RCPMF problem, illustrated in Figure 1, encompasses 41 design variables, broadening the scope beyond previous studies focused on the final cost minimization via SOO [16]. Among these variables, three relate to the geometry of the lateral walls and the upper and lower slabs ( w d , u s d , l s d ). Multiple variables are allocated to the configurations of passive reinforcement in all structural sections. This comprehensive set includes corner reinforcement ( u c ϕ , b , h , v , l c ϕ , b , h , v ) and bending reinforcement in the central sections of the top and bottom slabs ( u r ϕ , b , l , l r ϕ , b , l ). The remaining variables are critical in defining the positioning and configuration of shear reinforcement and determining structural concrete and steel material grades ( c g , s g ).
The MIP nature of the problem requires establishing upper and lower bounds for three distinct categories of variables: choice (discrete), integer, and real (continuous).
Each category undergoes unique processing during the optimization phase via custom-developed repair operators. These operators are designed explicitly for mutation, crossover, and repair functions within the NSGA-II optimization algorithm. Table 1 comprehensively details the set of optimization variables, categorizing them by type and specifying their respective upper and lower bounds.
In addition to the optimization variables, the structural design problem encompasses a comprehensive set of parameters that remain constant throughout the optimization process. In conjunction with the previously delineated optimization variables, these parameters enable the complete characterization of the RCPMF design. The problem incorporates parameters relevant to the structure’s geometry and those necessary for calculating structural loads. Moreover, it includes several parameters necessary for evaluating the objective functions. These encompass the economic cost of materials and the environmental and social impacts, which are assessed over the structure’s life cycle. Table 2 summarizes the main optimization parameters of the problem along with their specific values.

2.1.2. Constraints

The constraints of the RCPMF problem ensure the representativeness of the mathematical model. Structural solutions generated during the optimization process are required to conform to the ultimate limit states (ULS) and service limit states (SLS) as stipulated in the applicable regulations [22,23]. Furthermore, the designs adhere to specific guidelines and recommendations for buried structures [24,25].
The ULS ensure the structural integrity of all sections under diverse loading scenarios. Compliance with ULS involves a multi-step verification process [15]. Initially, it requires verifying sectional shear stress resistance [26], followed by assessing normal stresses via N-M interaction diagrams. This procedure includes accounting for the increase in bending moments due to shear interaction. Subsequent steps include confirming the fatigue resistance of the structure and evaluating additional geometrical and reinforcement design characteristics, which are closely linked to sectional properties.
The SLS criteria focus on maintaining the structure’s aesthetic integrity by preventing the generation and propagation of cracks. Additionally, SLS involves the restriction of deformations. Thus, global structure deflections in the upper slab central sections are assessed to remain within predefined allowable limits [24].
Structural calculation and compliance verification are conducted using a mathematical model developed in Python 3 [27]. This approach incorporates global models for calculating sectional internal forces, utilizing a finite element analysis (FEA) methodology [28]. Additionally, local models for each structural section are computed and thoroughly evaluated to confirm compliance with the specified constraints [22,23]. The NSGA-II optimization algorithm from the pymoo library is modified and utilized to solve the MOO [29]. During this process, the mathematical model generates a constraint vector adapted to its functional requirements for each solution.

2.1.3. Objective Functions

Three objective functions are established for an integrated approach to enhancing RCPMF sustainability performance. Equations (4), (6), and (7), evaluate the economic cost, the ELCA endpoint, and the SLCA endpoint of the structure life cycle, respectively. The Python numerical model integrates all necessary calculations for evaluating these objective functions and generates a vector representing specific values for each solution throughout the optimization process.
The final cost of the structure is determined by summing the products of the material unit costs, c i , and the specific quantities of materials used, m i . The unit values in this study, detailed in Table 3, were sourced from the BEDEC database [30].
C ( X ) = c i · m i ( X )
The life cycle of the RCPMF encompasses all processes from raw material extraction to the post-service life disposal of the structure’s remains, while treating the life cycle assessment (LCA) calculation as a “black box” executed externally by OpenLCA 2.1 software is a feasible method [31], this study opts to develop a numerical model that utilizes the precomputed individual impacts of each process.
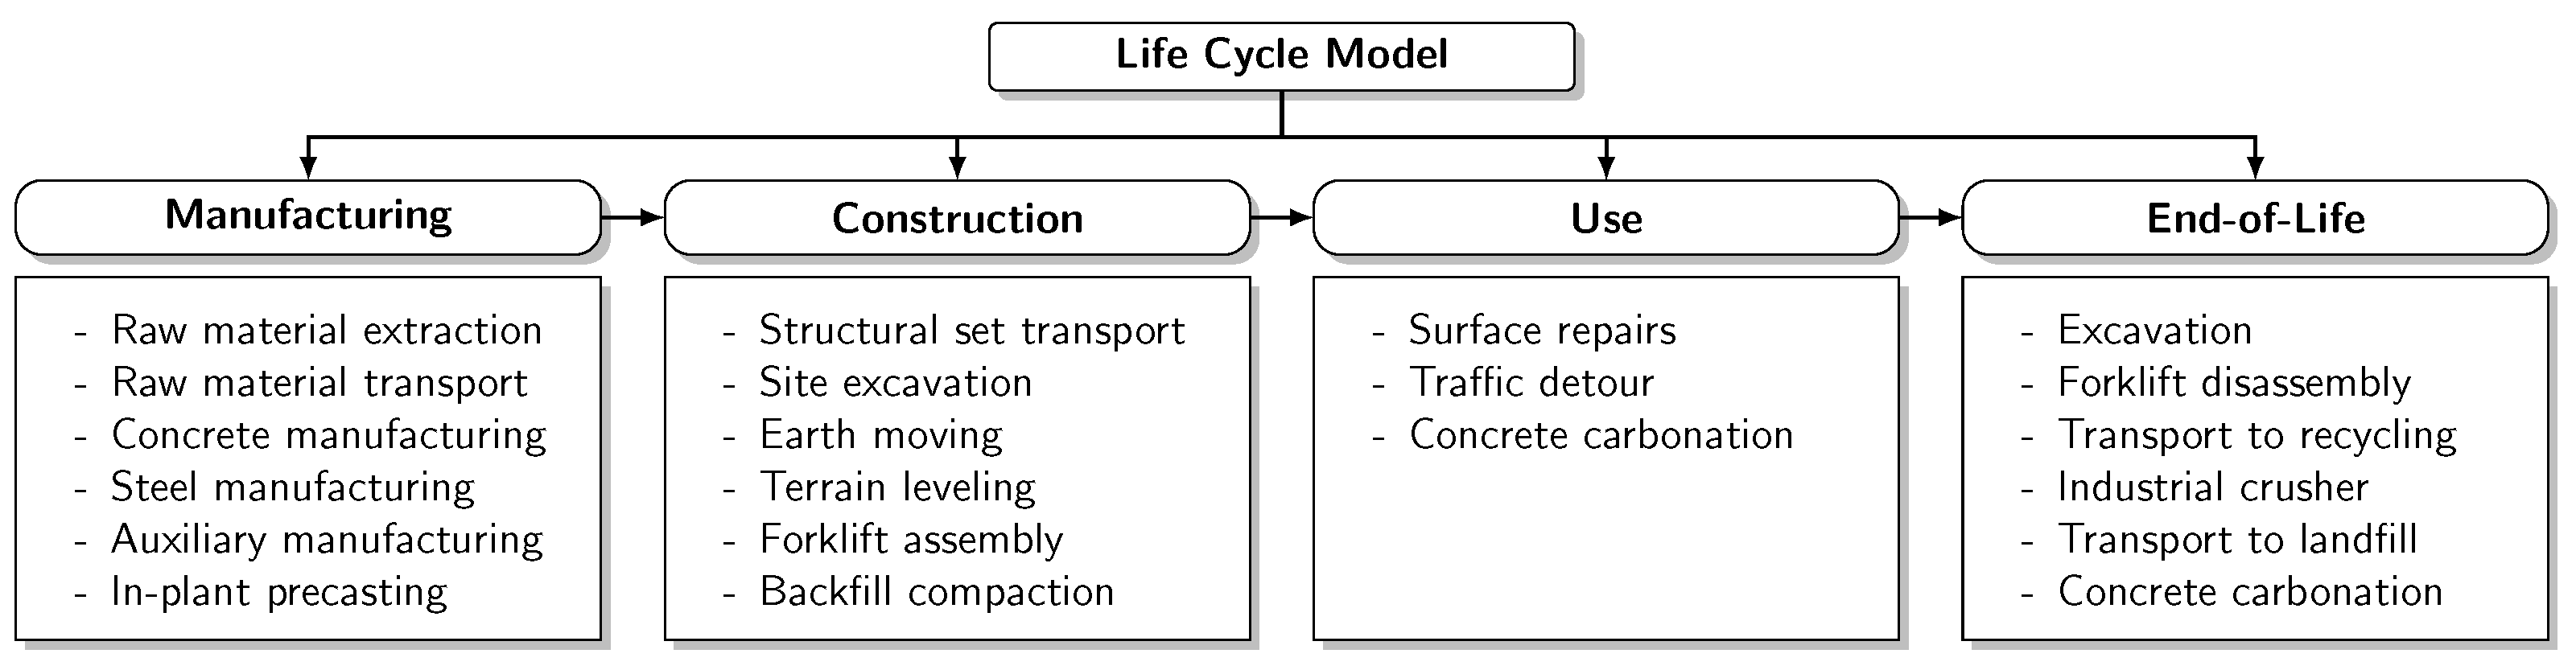
The life cycle model, depicted in Figure 2, adheres to the ISO 14040:2006 standard, including four stages: manufacture, construction, use, and end-of-life [19]. Table 4 details each process’s unit environmental and social impacts. The data is sourced from the ecoinvent 3.7.1 and soca v2 databases [32,33,34] and evaluated employing the ReCiPe 2008 and SWIM life cycle impact assessment (LCIA) methods for environmental and social impacts, respectively, [35].
The manufacturing stage covers all processes, from the extraction of raw materials to the delivery of ready-to-use materials to the construction site. The construction phase includes site preparation, earth moving, transportation, assembling the structural components, covering the structure, and installing auxiliary systems. The use phase models routine minor repairs to the internal surface of the structure and the associated impact of traffic diversions due to these activities. Lastly, the end-of-life stage encompasses unearthing, dismantling the structure and transporting materials to recycling facilities and landfills.
Concrete acts as a carbon-sequestering component. The carbon dioxide captured through the carbonation process during the structure’s use and end-of-life stages is estimated using Fick’s law, detailed in Equation (5). Here, t represents the 100-year service life of the structure, k the carbonation coefficient, A the area affected by carbonation, C the amount of cement, and K the clinker content. The optimization problem incorporates parameters such as the carbonation coefficients for the interior and exterior walls, the quantity of cement, and the clinker content. The area affected by carbonation is calculated by integrating the geometric optimization variables of the RCPMF.
C O 2 ( kg ) = 0.383 · k mm year · t ( year ) 1000 · A ( m 2 ) · C kg m 3 · K ( % )
By integrating all the considerations above, the endpoint results for the ELCA and SLCA are computed as the cumulative sum of the products of the environmental impact factors, e l c a i , or social impact factors, s l c a i , and the quantity of the process m i required throughout the j stages of the structure’s life cycle.
E L C A ( X ) = i = 1 n j = 1 4 e l c a i , j · m i , j ( X )
S L C A ( X ) = i = 1 n j = 1 4 s l c a i , j · m i , j ( X )

2.2. Optimization Algorithm

This section aims to delineate the NSGA-II, [18], the MOO algorithm employed for optimizing the RCPMF structure. Initially, a comprehensive elucidation of the standard NSGA-II algorithm will be presented. Subsequently, the next section will introduce specialized repair operators tailored for addressing the unique challenges posed by the mixed-integer optimization problem, which amalgamates discrete, integer, and continuous variables. This dual-phase approach facilitates a profound understanding of the algorithm’s core mechanics before delving into the customized modifications necessary for the specific optimization task at hand. Figure 3 presents a flowchart that encapsulates the algorithm’s proposed framework, illustrating the integrated process introduced in our study.
NSGA-II is a methodical, iterative process leveraging a population-based approach. It draws upon the principles of natural selection and genetics to evolve solutions towards an optimal set of trade-offs, known as the Pareto front. Central to NSGA-II is its non-dominated sorting mechanism, which stratifies the population into various levels of Pareto fronts based on dominance criteria. A solution is deemed to dominate another if it is equally competent in all objectives and superior in at least one. The foremost front comprises solutions not dominated by any others in the population, with subsequent fronts determined in a similar fashion.
Another critical element of NSGA-II is the crowding distance assignment. This metric gauges solution density within the objective space, ensuring diversity among solutions and averting premature convergence to localized Pareto front regions. It aids in maintaining a comprehensive spread of solutions across the entire range of trade-offs. Genetic operators in NSGA-II, namely selection, crossover, and mutation, play pivotal roles. Selection processes prefer solutions from lower Pareto fronts and those with greater crowding distances, promoting the caliber and diversity of solutions. Crossover and mutation introduce novel variations and traits into the population, encouraging a thorough exploration of the solution space.
The iterative nature of NSGA-II involves cultivating a new population (offspring) from the existing one via these genetic operators. The amalgamated population of parents and offspring is then subjected to non-dominated sorting and crowding distance evaluation. The top-tier solutions are cherry-picked to constitute the next generation, preserving a constant population size. The efficacy of NSGA-II is manifest in its adeptness at unearthing a diverse array of high-caliber trade-off solutions, rendering it apt for complex multi-objective quandaries. Its utility spans diverse domains, ranging from engineering design to resource management, where decisions necessitate juggling conflicting objectives.
In this particular study, additional configurations were implemented for crossover, mutation, and repair operators, which will be explicated in the following section.

2.3. Solution Crossover, Mutation, and Repair Algorithms

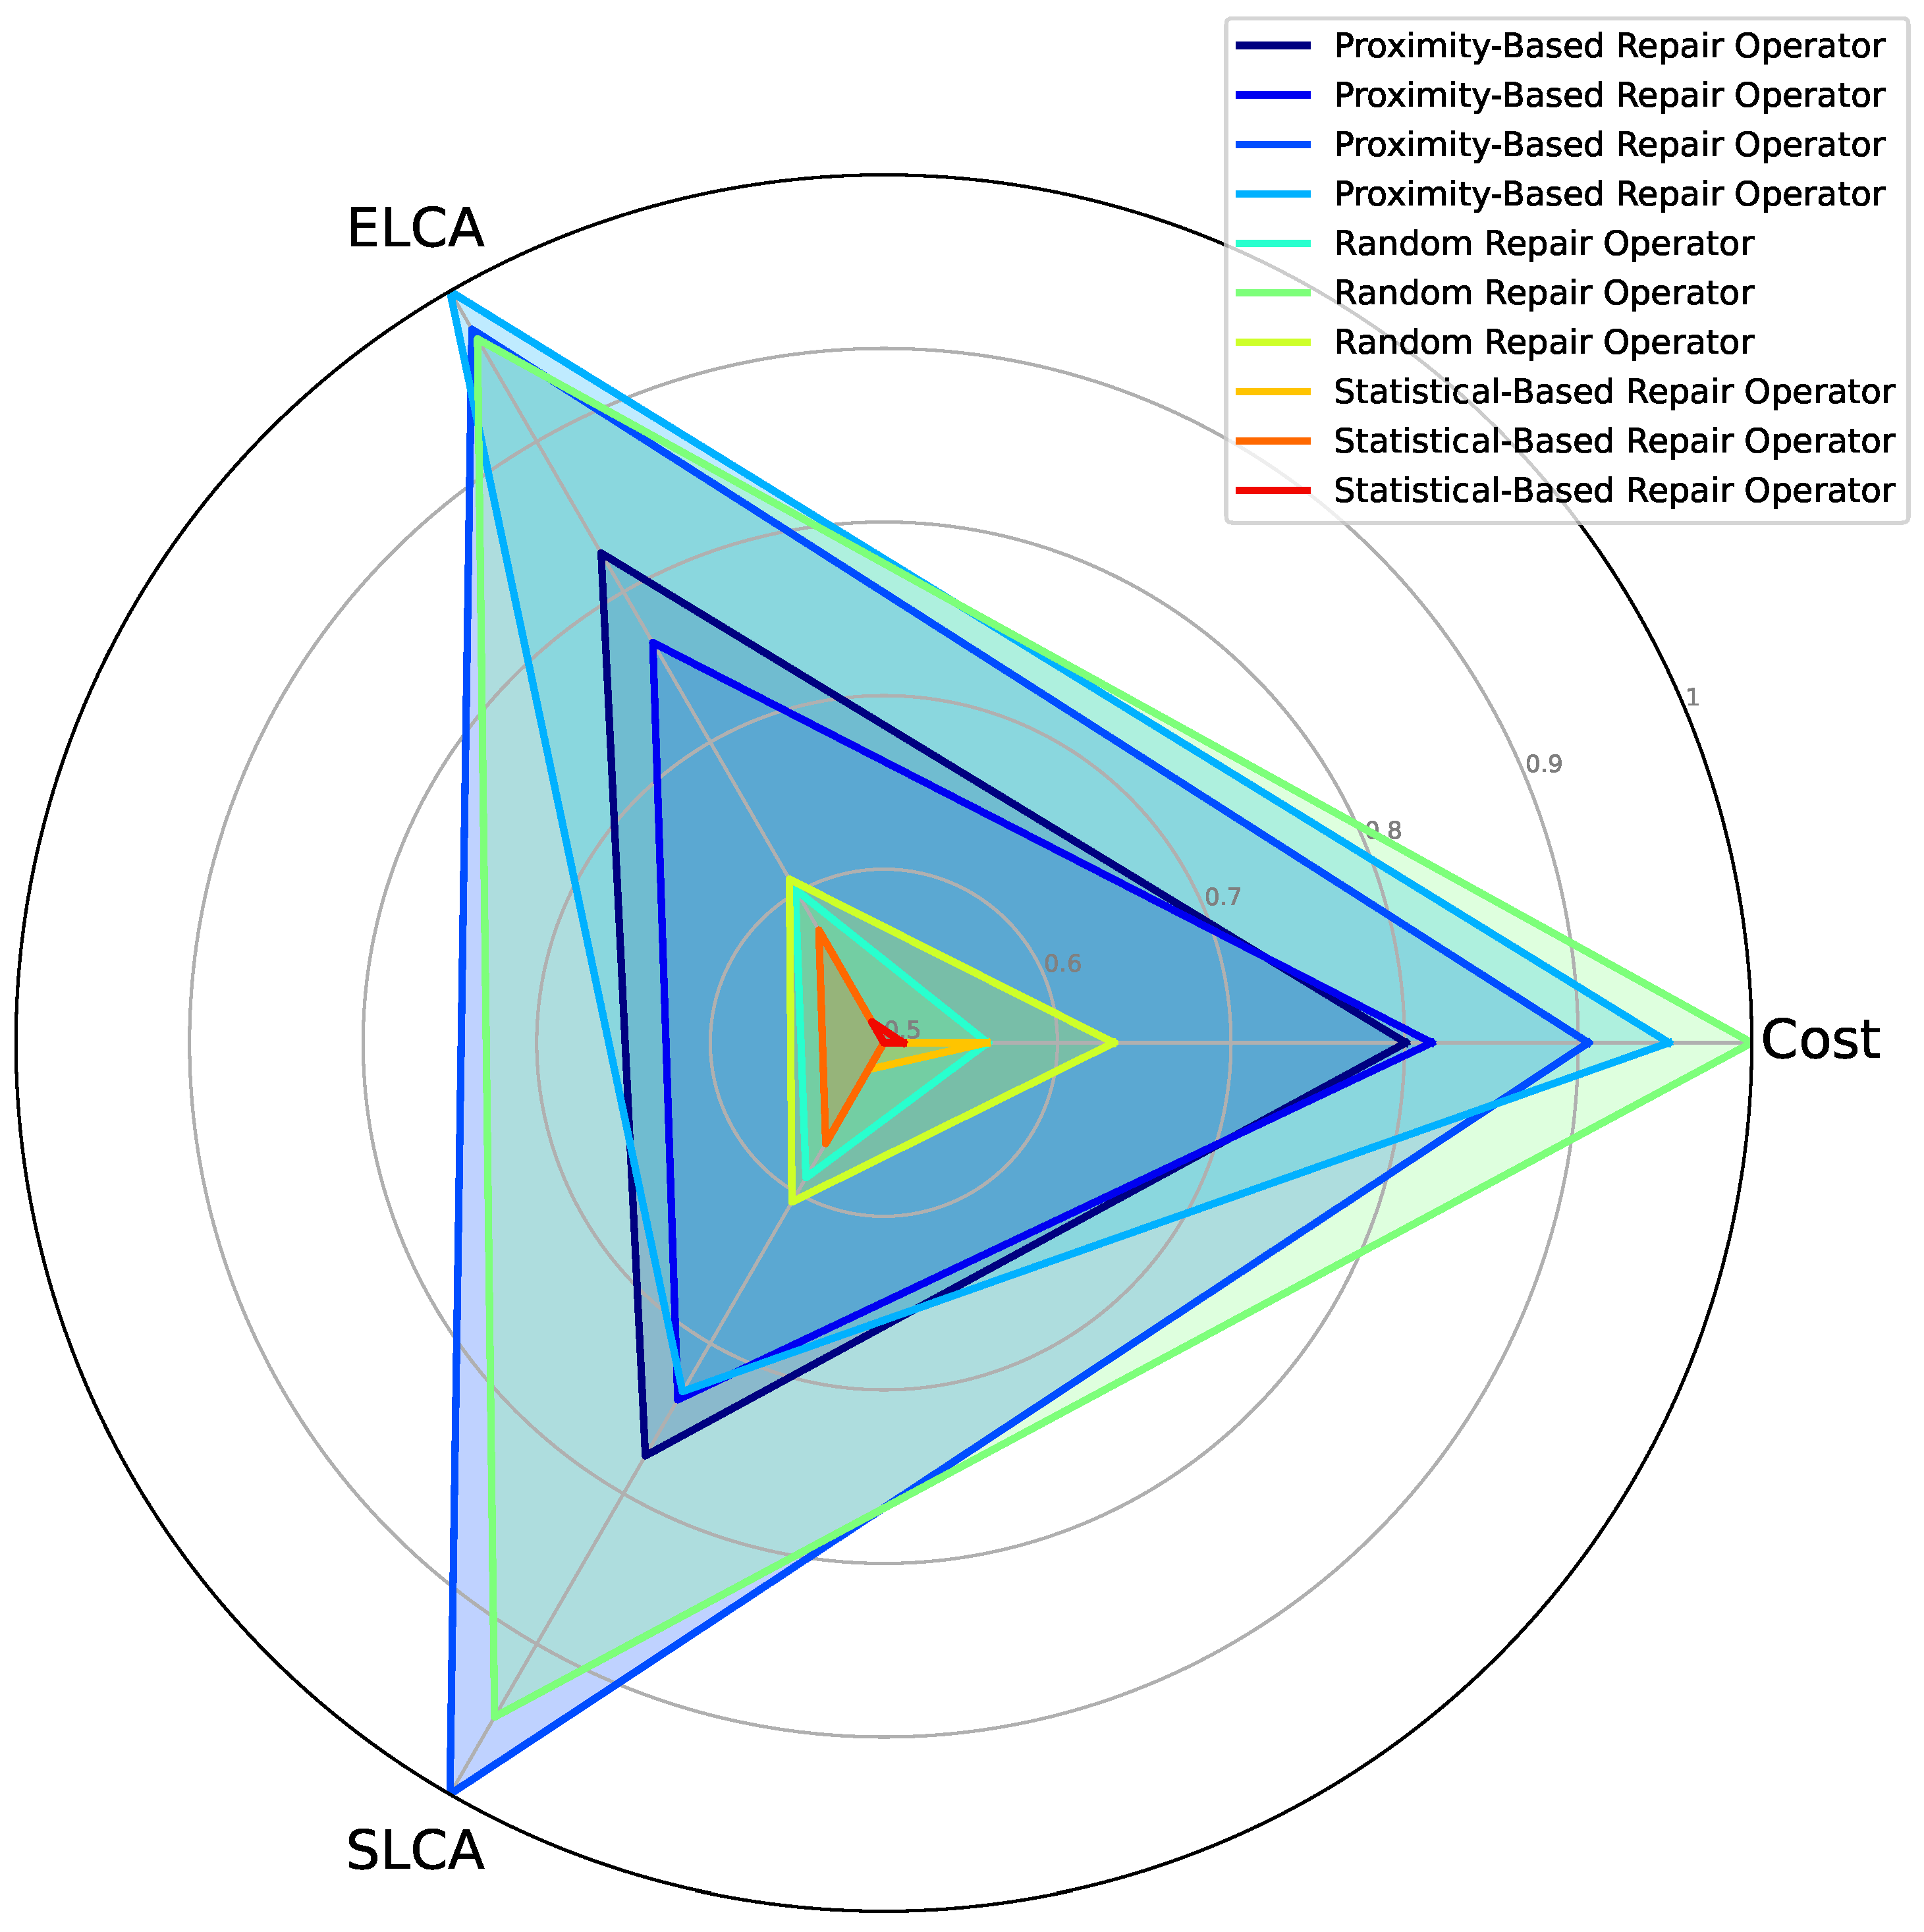
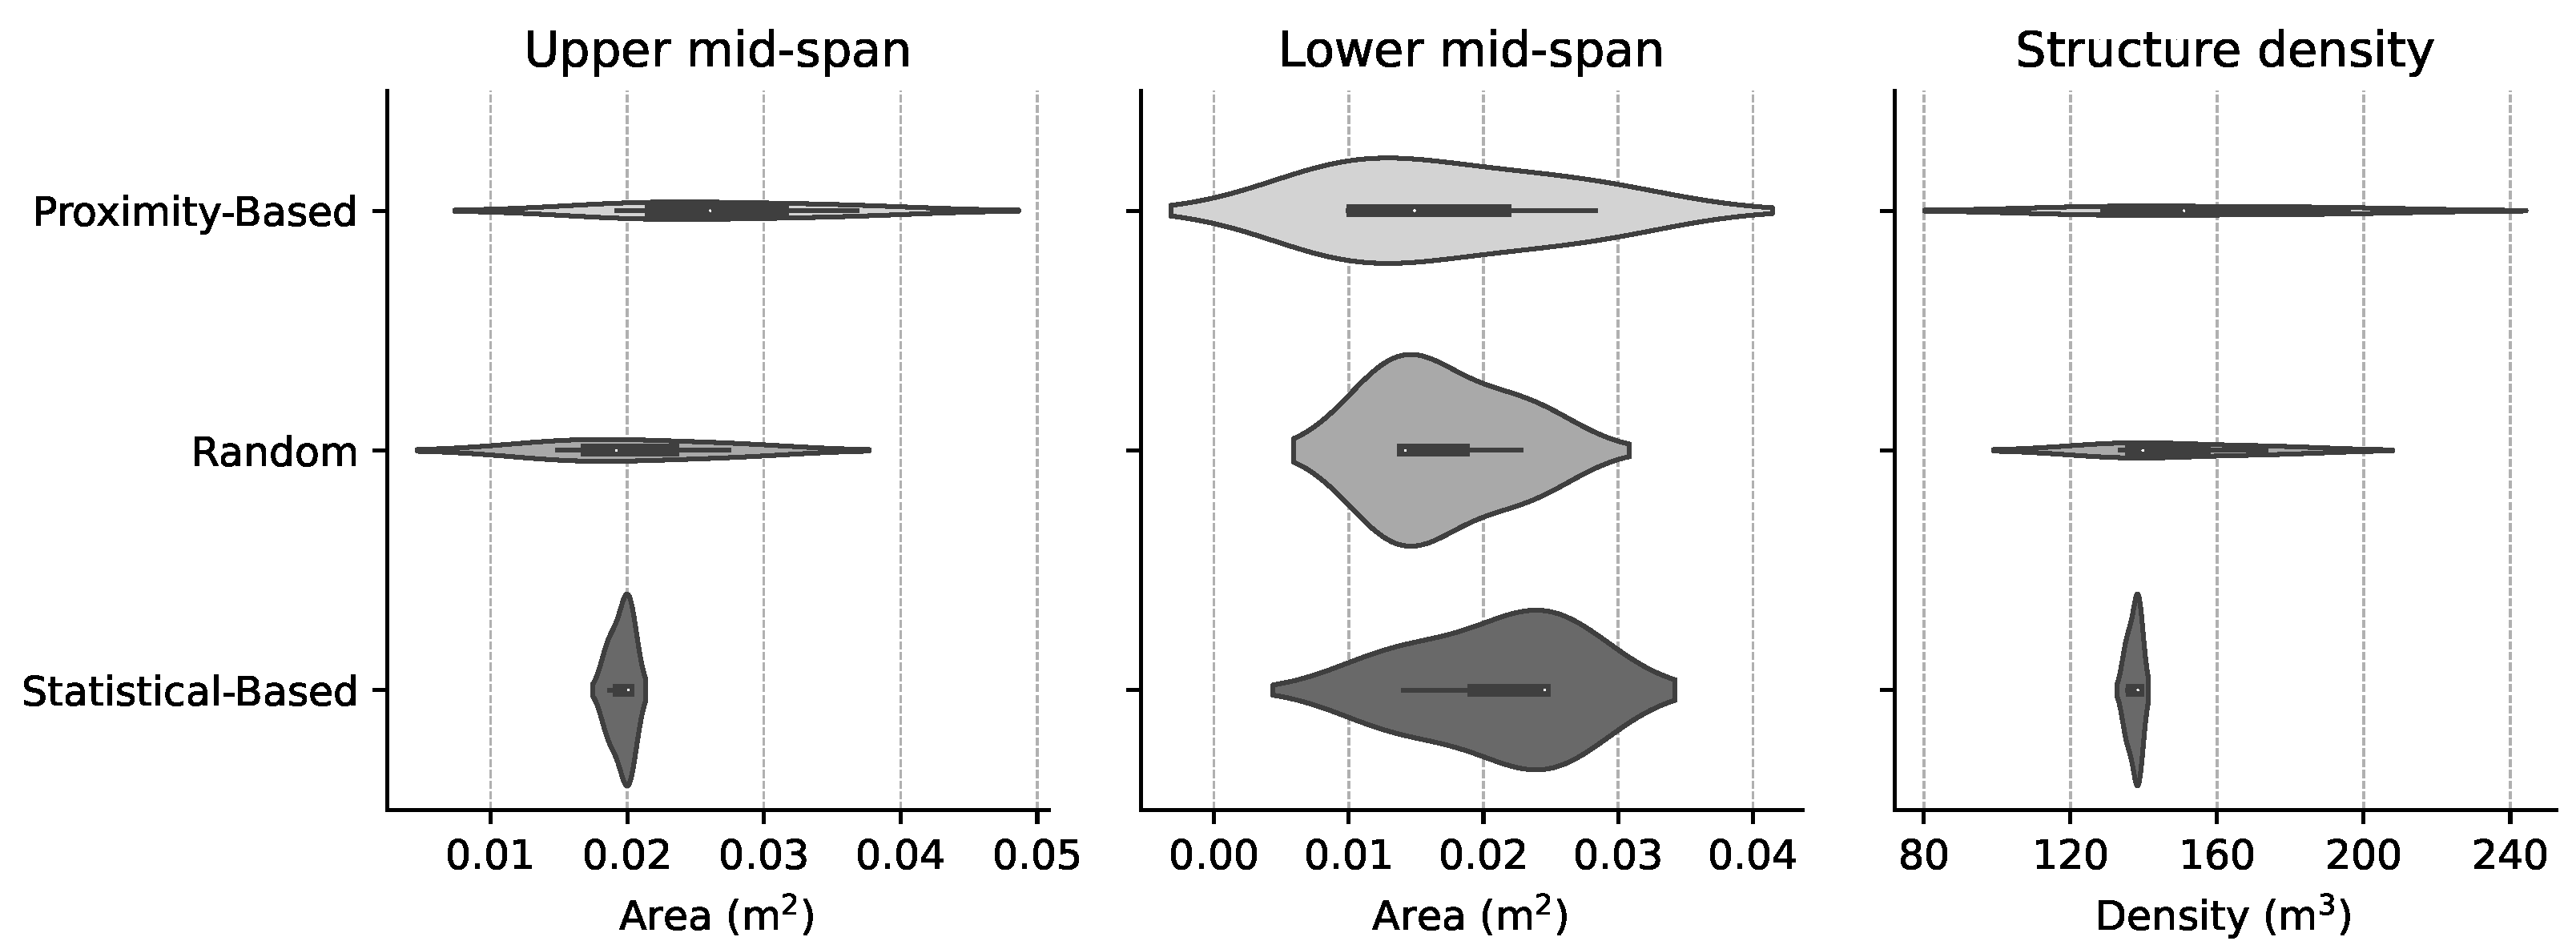
In this study, the crossover operation was implemented using a Simulated Binary Crossover (SBX) operator, while mutations were introduced via a Polynomial Mutation (PM) operator. Additionally, three distinct repair operators were integrated: one based on proximity, another employing random modifications, and a third leveraging statistical concepts of mean and median for solution adjustments.
Simulated binary crossover (SBX): The SBX operator, a nuanced crossover technique, emulates the single-point crossover observed in binary strings, but is adapted for real-coded genetic algorithms. It excels in generating offspring solutions proximate to their parent solutions, thereby enabling a detailed search in the immediate solution space. The offspring distribution’s breadth is modulated by a distribution index parameter, which determines the offspring’s spread relative to their parents. A lower index promotes exploration by creating offspring further from the parent solutions, while a higher index encourages exploitation by generating offspring closer to the parent solutions.
Polynomial mutation (PM): The PM operator, designed for real-valued representations, introduces variability by subtly modifying a solution’s variable values. Governed by a distribution index, this mutation process mirrors the bit-wise mutation in binary-coded genetic algorithms, yet it is specifically tailored for continuous variable contexts. PM plays a vital role in maintaining diversity within the population and averting premature convergence, particularly in scenarios involving continuous or real-valued parameters.
Proximity-based repair operator: The proximity-based repair operator is an approach designed to rectify solutions that do not adhere to the constraints of an optimization problem, Algorithm 1. This operator is particularly effective in contexts where solutions involve a mix of discrete, integer, and continuous variables. The core principle of this operator lies in its ability to adjust each variable of a solution by selecting values that are closest to the original, yet still within the permissible range defined by the problem’s constraints.
Algorithm 1 Proximity-Based Repair Operator
1:
Function Repair(X)
2:
Input: X
3:
Output:  r e p a i r e d _ X
4:
r e p a i r e d _ X copy of X
5:
for each solution x in r e p a i r e d _ X  do
6:
   for each variable index j in x do
7:
      v a r variable type at index j
8:
     if  v a r is Choice then
9:
         x [ j ] value closest to x [ j ] in v a r . o p t i o n s
10:
     else if  v a r is Integer then
11:
         x [ j ] round x [ j ] to nearest integer within v a r . b o u n d s  
12:
     else if  v a r is Real then
13:
         x [ j ] clip x [ j ] within v a r . b o u n d s
14:
     end if
15:
   end for
16:
end for
17:
return  r e p a i r e d _ X
For each variable in a solution, the operator evaluates its type–whether it is a choice (discrete), integer, or real (continuous). Based on the type, the operator performs the following actions:
  • Choice variables: The operator selects the option from the predefined set that is closest to the current value of the variable.
  • Integer variables: The operator rounds the variable to the nearest integer that falls within the defined bounds, ensuring that the solution remains feasible.
  • Real variables: The operator clips the variable’s value to ensure it lies within the allowable continuous range.
Statistical-based repair operator: The statistical-based repair operator, Algorithm 2, ingeniously integrates statistical measures–mean and median–with a probabilistic approach to refine solutions in an optimization algorithm. This operator, in each iteration, processes every solution and employs a probability parameter α to determine the repair strategy. If the random number generated is less than α , the operator uses median for discrete variables (Choice and Integer) and mean for continuous (Real) variables. The median is particularly beneficial for discrete variables, offering robustness against outliers and reflecting the most common values in the population. Conversely, the mean provides an average value for continuous variables, encapsulating the central tendency of the population.
Algorithm 2 Statistical-Based Repair Operator
1:
Function StatisticalRepair(X, α )
2:
Input: X, α
3:
Output:  r e p a i r e d _ X
4:
r e p a i r e d _ X copy of X
5:
m e a n s mean of X along axis 0
6:
m e d i a n s median of X along axis 0
7:
for each solution x in r e p a i r e d _ X  do
8:
   for each variable index j in x do
9:
        v a r variable type at index j
10:
     if  random number < α  then
11:
        if  v a r is Choice or Integer then
12:
           c h o i c e medians[j]
13:
          if  v a r is Choice then
14:
              x [ j ] closest value to c h o i c e in v a r . o p t i o n s
15:
          else
16:
              x [ j ] round c h o i c e to nearest integer within v a r . b o u n d s
17:
          end if
18:
        end if  v a r is Real then
19:
           x [ j ] clip means[j] within v a r . b o u n d s
20:
        end if
21:
     else
22:
        Apply standard repair based on variable type and bounds
23:
     end if
24:
   end for
25:
end for
26:
return  r e p a i r e d _ X
Random repair operator: The random repair operator, Algorithm 3, is designed to introduce randomness into the solution repair process, which is essential for enhancing diversity in the solution space. It operates by iterating over each solution in the population and randomly assigning new values to the variables based on their type. For choice variables, a random option is selected from the available choices. Integer variables are assigned a random integer within their bounds, and real variables receive a random value within their defined range. This randomness helps in exploring uncharted areas of the solution space, thereby preventing the algorithm from stagnating at local optima and encouraging a more thorough exploration.
Algorithm 3 Random Repair Operator
1:
Function RandomRepair(X)
2:
Input: X
3:
Output:  r e p a i r e d _ X
4:
r e p a i r e d _ X copy of X
5:
for each solution x in r e p a i r e d _ X  do
6:
   for each variable index j in x do
7:
      v a r variable type at index j
8:
     if  v a r is Choice then
9:
         x [ j ] random choice from v a r . o p t i o n s  
10:
     else if  v a r is Integer then
11:
         x [ j ] random integer within v a r . b o u n d s  
12:
     else if  v a r is Real then
13:
         x [ j ] random real number within v a r . b o u n d s
14:
     end if
15:
   end for
16:
end for
17:
return  r e p a i r e d _ X

2.4. Evaluation and Decision-Making Methods

The result of the MOO conducted in this study is a set of RCPMFs that balance the minimization of the objective functions. These solutions are evaluated by aggregating and comparing the influence of relevant structural characteristics on the economic cost, ELCA and SLCA scores for each repair operator. This analysis aims to identify common trends in the optimal solution set and derive directly applicable, improvement-oriented design approaches.
Decision-making within transportation infrastructure projects is fundamentally intricate. Influences outside the purview of this research, including local regulations and specific project mandates, frequently affect the identification of optimal solutions in civil engineering. This study provides a framework for integrating sustainability’s multifaceted dimensions into the optimal structural design, aiming for a more informed decision-making process. This approach aligns well-defined MOO objectives with relevant criteria for MCDM. Despite the inherent complexity, integrating these aspects into a well-informed decision-making framework is essential for fostering the construction industry’s long-term sustainability.
Utilizing MCDM techniques introduces several advantageous elements to complex engineering decision-making processes. Sustainable construction requires the equilibrium of intricate economic, environmental, and social criteria. The diverse stakeholders involved in the life cycle of an infrastructure project often have different criteria with conflicting and competing natures. Within this framework, harmonizing the criteria of the MCDM problem with the objectives of the MOO problem, as delineated in this study, offers a pathway to enhance the decision-making process in sustainable construction.
This research addresses a MCDM problem, represented by a decision matrix X = r i j consisting of m alternatives and n criteria, denoted as A i = { A 1 , A 2 , . . . , A m } . The element r i j of the decision matrix X provides insight into the performance of the alternative i concerning criterion j. Weighting the multiple criteria is a crucial step in resolving the MCDM problem. The research employs an entropy-based method to calculate the W j criteria weights, [21].
The entropy-based weighting approach utilized in this research objectively calculates the weight of each criterion according to its variability among the alternatives. This methodology leverages the intrinsic uncertainty or randomness linked with entropy to eliminate subjectivity in the weighting process, with criteria deemed to offer more information to the decision-making process receiving higher weighting. Moreover, it fosters transparent and inclusive decision-making when applied to sustainability criteria.
The criteria weights are computed through a four-step process. The first step involves normalizing the decision matrix, as described in Equation (8), resulting in X , the normalized decision matrix.
X = r i j i = 1 m r i j 1
In the second step, the entropy of each criterion E j is calculated using Equation (9). A higher entropy value indicates greater variability across the i alternatives for criterion j. In this step is assumed that, if r i j = 0 , then the corresponding natural logarithm is null.
E j = 1 ln m i = 1 m r i j · ln r i j
The third step is dedicated to assessing the variation of each criterion through Equation (10). This evaluation yields the degree of divergence D j for each criterion j.
D j = 1 E j
Finally, the fourth step involves normalizing the D j , as delineated in Equation (11), resulting in the final criteria weights W j .
W j = D j j = 1 n D j
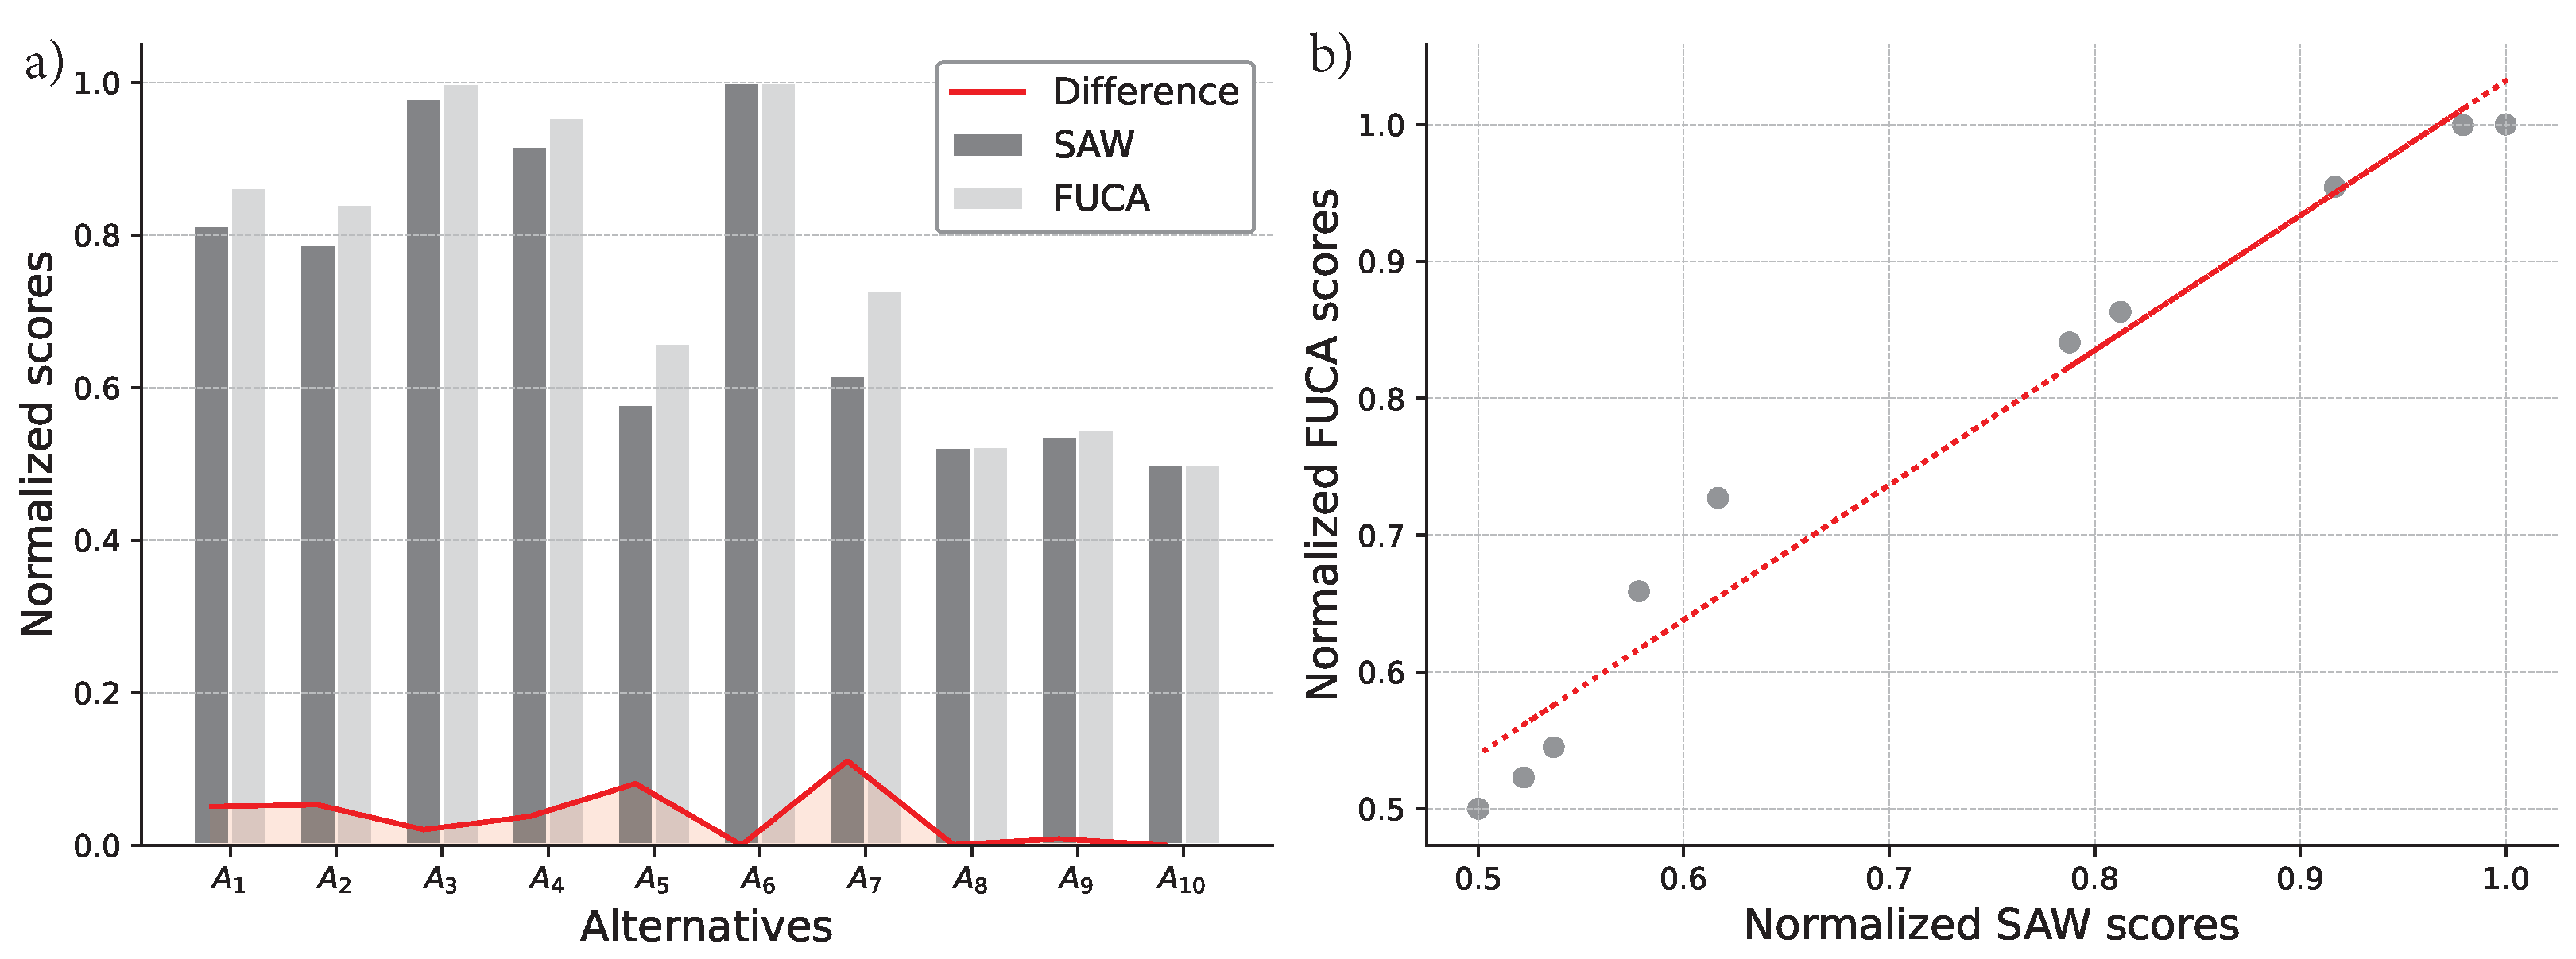
The subsequent phase in the decision-making process involves applying an algorithm to address the MCDM problem. The research employed the SAW and FUCA algorithms to resolve the optimum selection problem.
Numerous researchers in the construction sector employ SAW for decision-making involving structural sustainability [36]. This approach, rooted in complexity-based classification, facilitates the evaluation of solutions through a well-established objective and transparent method. Implementing the SAW algorithm within this study involves three distinct steps. The process begins by calculating the normalized decision matrix X .
The second step calculates the S i scores for each alternative, employing Equation (12). The scores result from aggregating the weighted normalized performance of each alternative across all criteria.
S i = j = 1 n W j r i j i = 1 m r i j 1
In the third and concluding step, the S i values determine the ranking of the alternatives, providing a systematic framework for identifying the most sustainable options.
The second decision-making algorithm chosen to address the MCDM problem is the FUCA [20], while having an approach and algorithmic structure similar to the SAW, this technique has operational differences that could lead to differing outcomes. A significant challenge in solving engineering MCDM problems lies in selecting suitable and effective techniques, which can evolve into a complex decision-making problem. The study conducts a comparative analysis within this framework between the established SAW method and the FUCA approach. This comparison aims to evaluate the feasibility and applicability of the FUCA technique in construction engineering decision-making, highlighting its potential advantages and differences in outcomes.
The FUCA algorithm is executed in three stages. In the first step, the solutions are ranked according to each criterion. The second step involves calculating the scores of the alternatives through Equation (13), where R i j denotes the rank of m solutions across n criteria.
S i = j = 1 n W j · R i j
The third and final step of the FUCA algorithm employed in this research is ranking the alternatives according to previously computed S i values.
The criteria weighting procedure and the MCDM techniques outlined in this section provide a methodical strategy for managing complex engineering decision-making problems. This structured approach provides decision-makers with a framework for informed and transparent choices.

3. Results

In this section, the findings from a comprehensive quantitative analysis of different repair operators applied within a multi-objective optimization framework are presented. The performance evaluation of each repair operator, detailed in Section 3.1, highlights their impact on key objectives: economic cost, environmental life cycle analysis, and social life cycle analysis. Subsequently, Figure 4 utilizes violin charts for visualizing these operators’ efficacy in minimizing the MOO objectives, where the statistical-based repair operator is shown to deliver the most consistent and effective performance across all metrics. These outcomes are further examined through normalized radar plots in Section 3.1.1, offering a visual comparison of the operators’ effectiveness in achieving optimization goals. The subsequent subsections delve into multi-criteria decision analysis for structural design optimization, utilizing both tabulated results and graphical representations to elucidate the comparative performance of the repair operators and the optimization variables involved. This analytical approach facilitates a nuanced understanding of each operator’s strengths and limitations in optimizing structural design parameters, setting the stage for informed decision-making in engineering applications.

3.1. Quantitative Analysis of Repair Operators

The tuning process for the crossover and mutation operators within the NSGA-II algorithm was conducted methodically in two phases, with the hypervolume metric serving as the primary evaluation criterion. In the initial exploratory phase, a range of η values—0.2, 0.5, and 0.9—were examined to assess their impact on offspring distribution relative to their parent solutions, applied to both the SBX and PM operators. Furthermore, the probabilities for these operators were explored across a spectrum of values—0.01, 0.1, 0.2, 0.3—to identify a broad scope of potential settings aimed at enhancing the optimization efforts. This stage sought to identify a preliminary configuration that could facilitate a balanced exploration and exploitation within the multi-objective optimization landscape.
Advancing to the second phase, a more focused exploitation strategy was employed, evaluating a tighter range of η values—0.45, 0.5, 0.55—to refine the distribution tightness of solutions. In parallel, the operator probabilities were adjusted to finer values—0.1, 0.08, 0.06, 0.04, 0.02—to optimize the frequency of generating new solutions. This phase was instrumental in determining the precise parameter settings that maximize the hypervolume metric, ensuring an optimal balance between Pareto front convergence and diversity maintenance within the solution population.
Throughout the tuning process, a proximity-based operator was utilized to systematically navigate the parameter space, enabling a comprehensive evaluation of the effectiveness of each parameter combination. This meticulous approach led to the identification of the optimal settings for the crossover and mutation operators: SBX with a probability of 0.1 and an η value of 0.5, and PM with a probability of 0.02 and an η value of 0.5. These configurations were deemed most effective in achieving an ideal balance between convergence to the Pareto front and sustaining diversity within the pool of solutions, as evidenced by the maximized hypervolume metric.
Table 5 presents a detailed quantitative analysis of the solutions generated by different repair operators in a multi-objective optimization problem context. The table elucidates each repair operator’s performance across three key objectives: economic cost, ELCA, and SLCA.
Figure 4 presents the data from Table 5 using violin charts to visualize the performance of three distinct repair operators in minimizing the MOO objectives. The statistical-based repair operator demonstrates the most consistent performance, averaging EUR 5788.40, 1664.92 points, and 9.095 × 10 6 mrh, and exhibits minimal variability in all metrics. In contrast, the proximity-based repair operator displays the highest average values across all metrics, with slightly more significant variability. It underperforms the statistical-based repair operator by 23.03% in economic cost, 16.41% in ELCA, and 14.10% in SLCA. The random repair operator occupies a middle position, with moderate median scores but higher variability, peaking at 11.30% for economic cost.
The findings indicate that the statistical-based repair operator is more effective in minimizing the objectives of the MOO problem in this study. Exhibiting lower average values for all metrics and significantly less variability compared to the proximity-based repair operator and the random repair operator, the statistical-based repair operator emerges as the most fitting algorithm for the specific features of the MOO problem at hand.
These results have been normalized for the direct comparison in Section 3.1.1. The proximity-based, random, and statistical-based repair operators are compared, providing insights into their respective effectiveness in minimizing each of the objectives.

3.1.1. Data Visualization Using Normalized Radar Plots

In this research, we employed radar plots to visualize and compare the solutions proposed by various algorithms in a multi-objective minimization problem. The effectiveness of the algorithms is assessed based on three criteria: economic cost, ELCA, and SLCA. As these objectives possess varying units and scales, a normalization process was implemented to enable a fair and effective comparison between the solutions.
For normalization, we utilized a modified approach of the Min-Max technique, scaling the values for each objective such that the minimum value is not reduced to zero but to a higher predefined threshold (e.g., 0.5), and the maximum value to 1. This adjusted normalization technique ensures that differences between solutions are less drastic, particularly for extreme values, and reflects the variations in each solution’s performance more equitably.
In the resulting radar plots, each axis represents one of the objectives, and each solution is depicted as a polygon whose vertices extend towards these axes. It is crucial to note that the most effective solutions in this minimization context are those with a smaller polygon area. This is because a smaller area on the plot indicates lower values in the objectives, which is desirable in our minimization problem.
In Figure 5, the results of the MOO, are presented through normalized radar plots. Given that the problem at hand is one of minimization, it can be observed that solutions with a smaller area indicate better performance than those with larger areas. From this perspective, the statistical-based repair operator generally yields superior outcomes compared to the other two operators. Notably, the proximity-based repair operator appears to be the least effective, exhibiting the largest area in the radar plot, which signifies suboptimal results across the evaluated objectives.

3.2. Multi-Criteria Decision Analysis for Structural Design Optimization

Table 6 displays the non-dominated optimal solutions derived from the MOO for each of the different repair operators used. It includes the actual area, A r e , for each longitudinal reinforcement and the area per linear meter for shear reinforcement. The areas are determined by factoring in the rebar area, the number of bars, and the branch separation for each result.
Figure 6 illustrates the results for the geometry variables associated with each repair operator. A notable advantage of applying MOO techniques to the structural design problem is avoiding preconditioning. In this sense, the designs produced by the proximity-based and random repair operators exhibit sections with variable depths. The lateral walls and upper slab depths are consistently larger than those found in designs generated by the statistical-based repair operator.
Figure 7 displays the outcomes for the reinforcement design variables, specifically concentrating on the middle-span area of the upper and lower slabs and the overall reinforcement density RCPMF. Notably, the statistical-based algorithm identified two distinct solutions exhibiting very similar characteristics, which differ in their selection of concrete grades. Regarding the grades of structural materials, the analysis reveals a varied distribution: four solutions employ concrete with a strength of 25 MPa, three utilize 30 MPa concrete, and the remaining three opt for 35 MPa. In terms of steel reinforcement, the majority of the designs favor the higher grade steel, with approximately 40% of them choosing 400 MPa steel.
Selecting the most suitable option in structural design scenarios is inherently complex. Table 7 displays the decision matrix for the MCDM problem formulated in this research within this framework. Additionally, it presents the entropy weight assigned to each criterion, along with the scores and rankings derived from addressing the MCDM problem through the SAW and FUCA techniques.
The SAW and FUCA methodologies yield the same ranking order for the alternatives, yet they assign different scores to each. Figure 8 compares the set of scores from each method and illustrates the correlation between them, which is notably high at 0.9816. The normalization of scores from both methods is achieved using the modified Min-Max technique detailed in Section 3.1.1. This technique scales the values for each objective so that the minimum value is set to a predefined threshold higher than zero (e.g., 0.5). In contrast, the maximum value is adjusted to 1.
Alternative A10, when evaluated using the SAW and FUCA methodologies, consistently achieved the highest scores. This consistency leads to the conclusion that, according to the MOO criteria defined in this study, the most efficient alternative is the last solution produced by NSGA-II in conjunction with the statistical-based repair operator. Moreover, the statistical-based repair operator demonstrates superior performance compared to the proximity-based and random repair operators. All solutions generated by the statistical-based repair operator are among the top-ranked alternatives in the MCDM problem as solved by both methods. The random repair operator, on the other hand, presents a wide range of outcomes, securing both the fourth highest and the lowest scores, which reflects the inherent variability of this algorithm.

4. Conclusions

This paper introduces a novel method to enhance decision-making in transportation infrastructure. The research integrates MOO techniques with MCDM methodologies for designing and selecting modular structures, aiming for high economic, social, and environmental efficiency. Specifically, it addresses the design problem of a RCPMF, encompassing three objective functions that represent the pillars of structural life cycle sustainability: economic cost, ELCA, and SLCA.
The MOO problem in this research is formulated through a Python-developed mathematical model and resolved using a tailored NSGA-II algorithm. This customized version of the algorithm is designed to manage the different nature of the variables in the MOO problem: choice (discrete), integer, and real (continuous). Additional configurations are introduced for the crossover and mutation operations, along with three distinct repair operators. Subsequently, the MCDM problem, which comprises the non-dominated solutions derived from the MOO, is addressed using the SAW and FUCA methodologies. The criteria weights in the MCDM problem are calculated based on entropy theory.
The primary geometric and reinforcement design characteristics of the MOO results are addressed, revealing designs featuring variable thicknesses and significantly dense reinforcement. The proximity-based and random repair operators yield varied results in terms of geometry, assembly layout, and the employment of structural materials. Conversely, the statistical-based repair operator discerns two closely related solutions, primarily differentiated using 30 MPa and 35 MPa concrete. The optimal solution is identified using 35 MPa concrete, characterized by slender sections complemented by a densely reinforced design utilizing B500S steel.
The solution to the MCDM problem employing the SAW and FUCA techniques reveals that both methodologies rank the alternatives similarly. However, a detailed examination of the scores for each methodology, normalized using the modified Min-Max technique, uncovers minor differences along with a notable correlation of 0.9816. The findings suggest that, despite the operational differences between the two algorithms, they converge on very similar outcomes. This convergence highlights the solution generated by the statistical-based repair operator as the most efficient in the case study.
The outcomes of this study hold significant implications for the field of structural engineering in transportation infrastructure. The case study exemplifies the development, implementation, and evaluation of innovative methodologies that incorporate full life cycle sustainability into the design and selection of RCPMF. The customization of the NSGA-II algorithm, coupled with the subsequent assessment of the developed repair operators, provides a clear picture of how the statistical-based repair operator algorithm is optimally suited for the MOO problem. Moreover, applying the SAW and FUCA techniques facilitates the identification of designs attained through said repair operator that exhibit superior efficiency under the predefined criteria.
While this study presents a detailed framework for enhancing sustainable transportation infrastructure, it operates within certain constraints, including limitations to specific geographical areas, climatic conditions, and project sizes. Recognizing these limitations provides valuable directions for future research. Future work could broaden the scope of our methodology to encompass a wider range of geographical environments, climate issues, and project dimensions. Such expansion aims to test our optimization and decision-making framework’s resilience and flexibility and increase its applicability across a wider range of structural engineering challenges. By incorporating designs that represent diverse real-world situations, future research could make our findings more universally applicable. This strategy aims to significantly improve the practicality and impact of our contributions to sustainable development in transportation infrastructure, ensuring our work continues to address the complex issues in this essential sector effectively.

Author Contributions

Conceptualization, A.R.-V. and J.G.; methodology, A.R.-V., J.G., J.A. and V.Y.; software, A.R.-V. and J.G.; validation, A.R.-V., J.A. and V.Y.; formal analysis, A.R.-V.; investigation, A.R.-V. and J.G.; resources, A.R.-V., J.A. and V.Y.; data curation, A.R.-V.; writing—original draft preparation, A.R.-V.; writing—review and editing, J.G., J.A. and V.Y.; visualization, A.R.-V.; supervision, J.A. and V.Y.; project administration, V.Y.; funding acquisition, V.Y. All authors have read and agreed to the published version of the manuscript.

Funding

Grant PID2020-117056RB-I00 funded by MCIN/AEI/10.13039/501100011033 and by “ERDF A way of making Europe”.

Data Availability Statement

All the data used in the research can be found in the article.

Conflicts of Interest

The authors declare no conflicts of interest.

Abbreviations

The following abbreviations are used in this manuscript:
MOOMulti-objective optimization
SOOSingle-objective optimization
MCDMMulti-criteria decision-making
RCCPFReinforced concrete cast in place frame
RCPMFReinforced concrete precast modular frame
NSGA-IINon-dominated sorting genetic algorithm II
ELCAEnvironmental life cycle analysis
SLCASocial life cycle analysis
MIPMixed-integer problem
SAWSimple additive weighting
FUCAFair un choix adéquat
ULSUltimate limit state
SLSService limit state
FEAFinite element analysis
LCALife cycle analysis
LCIALife cycle impact assessment
SBXSimulated binary crossover
PMPolynomial mutation

References

  1. Kyriacou, A.P.; Muinelo-Gallo, L.; Roca-Sagalés, O. The efficiency of transport infrastructure investment and the role of government quality: An empirical analysis. Transp. Policy 2019, 74, 93–102. [Google Scholar] [CrossRef]
  2. Favier, A.; De Wolf, C.; Scrivener, K.; Habert, G. A Sustainable Future for the European Cement and Concrete Industry: Technology Assessment for Full Decarbonisation of the Industry by 2050; Technical Report; ETH Zurich: Zürich, Switzerland, 2018. [Google Scholar]
  3. Spangenberg, J.H.; Fuad-Luke, A.; Blincoe, K. Design for Sustainability (DfS): The interface of sustainable production and consumption. J. Clean. Prod. 2010, 18, 1485–1493. [Google Scholar] [CrossRef]
  4. WCED. Our Common Future; World Commission on Environment and Development: Oxford, UK, 1987. [Google Scholar]
  5. Yepes, V.; Medina, J. Economic heuristic optimization for heterogeneous fleet VRPHESTW. J. Transp. Eng. 2006, 132, 303–311. [Google Scholar] [CrossRef]
  6. Navarro, I.J.; Yepes, V.; Martí, J.V. Social life cycle assessment of concrete bridge decks exposed to aggressive environments. Environ. Impact Assess. Rev. 2018, 72, 50–63. [Google Scholar] [CrossRef]
  7. Santoro, J.F.; Kripka, M. Evaluation of CO2 emissions in RC structures considering local and global databases. Innov. Infrastruct. Solut. 2024, 9, 33. [Google Scholar] [CrossRef]
  8. Ahmad, T.; Thaheem, M.J. Developing a residential building-related social sustainability assessment framework and its implications for BIM. Sustain. Cities Soc. 2017, 28, 1–15. [Google Scholar] [CrossRef]
  9. El Kounni, A.; Outzourhit, A.; Mastouri, H.; Radoine, H. Building energy model automated calibration using Pymoo. Energy Build. 2023, 298, 113524. [Google Scholar] [CrossRef]
  10. Zhang, Z.; Cheng, X.; Xing, Z.; Gui, X. Pareto multi-objective optimization of metro train energy-saving operation using improved NSGA-II algorithms. Chaos Solitons Fractals 2023, 176, 114183. [Google Scholar] [CrossRef]
  11. Tanhadoust, A.; Madhkhan, M.; Nehdi, M.L. Two-stage multi-objective optimization of reinforced concrete buildings based on non-dominated sorting genetic algorithm (NSGA-III). J. Build. Eng. 2023, 75, 107022. [Google Scholar] [CrossRef]
  12. Lahmar, S.; Maalmi, M.; Idchabani, R. Multiobjective building design optimization using an efficient adaptive Kriging metamodel. SIMULATION 2023. [Google Scholar] [CrossRef]
  13. Rastegaran, M.; Beheshti Aval, S.; Sangalaki, E. Multi-objective reliability-based seismic performance design optimization of SMRFs considering various sources of uncertainty. Eng. Struct. 2022, 261, 114219. [Google Scholar] [CrossRef]
  14. Arora, K.; Kumar, A.; Kamboj, V.K.; Prashar, D.; Shrestha, B.; Joshi, G.P. Impact of Renewable Energy Sources into Multi Area Multi-Source Load Frequency Control of Interrelated Power System. Mathematics 2021, 9, 186. [Google Scholar] [CrossRef]
  15. Ruiz-Vélez, A.; Alcalá, J.; Yepes, V. Optimal design of sustainable reinforced concrete precast hinged frames. Materials 2023, 16, 204. [Google Scholar] [CrossRef]
  16. Ruiz-Vélez, A.; Alcalá, J.; Yepes, V. A parametric study of optimum road modular hinged frames by hybrid metaheuristics. Materials 2023, 16, 931. [Google Scholar] [CrossRef]
  17. Muñoz-Medina, B.; Ordóñez, J.; Romana, M.G.; Lara-Galera, A. Typology Selection of Retaining Walls Based on Multicriteria Decision-Making Methods. Appl. Sci. 2021, 11, 1457. [Google Scholar] [CrossRef]
  18. Deb, K.; Pratap, A.; Agarwal, S.; Meyarivan, T. A fast and elitist multiobjective genetic algorithm: NSGA-II. IEEE Trans. Evol. Comput. 2002, 6, 182–197. [Google Scholar] [CrossRef]
  19. ISO 14040:2006; Environmental Management, Life Cycle Assessment Principles and Framework. International Organization for Standardization: Geneva, Switzerland, 2006.
  20. Zakeri, S.; Chatterjee, P.; Konstantas, D.; Ecer, F. A comparative analysis of simple ranking process and faire un Choix Adéquat method. Decis. Anal. J. 2024, 10, 100380. [Google Scholar] [CrossRef]
  21. Zeleny, M. Multiple Criteria Decision Making; McGraw-Hill: New York, NY, USA, 1982. [Google Scholar]
  22. CEN. Eurocode 2: Design of Concrete Structures; European Comittee for Standarization: Brussels, Belgium, 2013. [Google Scholar]
  23. CEN. Eurocode 1: Actions on Structures; European Comittee for Standarization: Brussels, Belgium, 2009. [Google Scholar]
  24. MFOM. IAP-11: Code on the Actions for the Design of Road Bridges; Ministerio de Fomento: Madrid, Spain, 2011. [Google Scholar]
  25. MFOM. Guía de Cimentaciones en Obra de Carretera; Ministerio de Fomento: Madrid, Spain, 2009. [Google Scholar]
  26. Ni, X.; Duan, K. Machine Learning-Based Models for Shear Strength Prediction of UHPFRC Beams. Mathematics 2022, 10, 2918. [Google Scholar] [CrossRef]
  27. Van Rossum, G.; Drake, F.L. Python 3 Reference Manual; CreateSpace: Scotts Valley, CA, USA, 2009. [Google Scholar]
  28. Otsuki, Y.; Li, D.; Dey, S.S.; Kurata, M.; Wang, Y. Finite element model updating of an 18-story structure using branch-and-bound algorithm with epsilon-constraint. J. Civ. Struct. Health Monit. 2021, 11, 575–592. [Google Scholar] [CrossRef]
  29. Blank, J.; Deb, K. Pymoo: Multi-Objective Optimization in Python. IEEE Access 2020, 8, 89497–89509. [Google Scholar] [CrossRef]
  30. BEDEC; Catalonia Institute of Construction Technology. BEDEC ITEC Materials Database. Available online: https://metabase.itec.cat/vide/es/bedec (accessed on 8 December 2023).
  31. Ciroth, A. ICT for environment in life cycle applications openLCA—A new open source software for Life Cycle Assessment. Int. J. Life Cycle Assess. 2007, 12, 209. [Google Scholar] [CrossRef]
  32. Frischknecht, R.; Rebitzer, G. The ecoinvent database system: A comprehensive web-based LCA database. J. Clean. Prod. 2005, 13, 1337–1343. [Google Scholar] [CrossRef]
  33. GreenDelta GmbH. Soca v.2 Add-On: Adding Social Impact Information to Ecoinvent; Description of Methodology to Map Social Impact Information from PSILCA v3 to Ecoinvent v. 3.7.1; GreenDelta GmbH: Berlin, Germany, 2021. [Google Scholar]
  34. Ciroth, A.; Eisfeldt, F. PSILCA—A Product Social Impact Life Cycle Assessment Database; Database Version. 2016. Available online: https://www.openlca.org/wp-content/uploads/2016/08/PSILCA_documentation_v1.1.pdf (accessed on 1 February 2024).
  35. Goedkoop, M.; Heijungs, R.; Huijbregts, M.; De Schryver, A.; Struijs, J.; Van Zelm, R. ReCiPe 2008. Report I: Characterisation; Ministry of Housing, Spatial Planning and Environment (VROM): Barendrecht, The Netherlands, 2009; pp. 1–44. [Google Scholar]
  36. Passos Neto, G.d.M.; Alencar, L.H.; Valdes-Vasquez, R. Multiple-Criteria Methods for Assessing Social Sustainability in the Built Environment: A Systematic Review. Sustainability 2023, 15, 16231. [Google Scholar] [CrossRef]
Figure 1. RCPMF optimization variables.
Mathematics 12 00730 g001
Figure 2. RCPMF life cycle model stages and processes.
Mathematics 12 00730 g002
Figure 3. Flowchart of the proposed algorithm. This diagram illustrates the step-by-step process of the algorithm.
Mathematics 12 00730 g003
Figure 4. Multi-objective optimization results for each objective function and repair operator.
Mathematics 12 00730 g004
Figure 5. Normalized radar plot comparison of repair operators. Smaller areas indicate superior performance in this minimization problem.
Mathematics 12 00730 g005
Figure 6. Multi-objective optimization results main geometry characteristics for each repair operator.
Mathematics 12 00730 g006
Figure 7. Multi-objective optimization results main reinforcement characteristics for each repair operator.
Mathematics 12 00730 g007
Figure 8. Multi-criteria decision-making results obtained through SAW and FUCA where: (a) sets of normalized scores comparison; (b) correlation between the two sets of scores.
Mathematics 12 00730 g008
Table 1. Optimization problem variables and boundaries.
VariableUnitLower LimitUpper LimitType
Section geometry
u s d m0.601.60continuous
l s d m0.401.40continuous
w d m0.301.20continuous
Base reinforcement
u t ϕ mm8, 10, 12, 16, 20, 25, 32discrete
u t b bars420integer
u b ϕ mm8, 10, 12, 16, 20, 25, 32discrete
u b b bars420integer
l t ϕ mm8, 10, 12, 16, 20, 25, 32discrete
l t b bars420integer
l b ϕ mm8, 10, 12, 16, 20, 25, 32discrete
l b b bars420integer
w u i ϕ mm8, 10, 12, 16, 20, 25, 32discrete
w u i b bars420integer
w u e ϕ mm8, 10, 12, 16, 20, 25, 32discrete
w u e b bars420integer
w l i ϕ mm8, 10, 12, 16, 20, 25, 32discrete
w l i b bars420integer
w l e ϕ mm8, 10, 12, 16, 20, 25, 32discrete
w l e b bars420integer
Corner and central reinforcement
u c ϕ mm8, 10, 12, 16, 20, 25, 32discrete
u c b bars420integer
u c h m15continuous
u c v m0.701.80continuous
l c ϕ mm8, 10, 12, 16, 20, 25, 32discrete
l c b bars420integer
l c h m15continuous
l c v m0.702.80continuous
u r ϕ mm8, 10, 12, 16, 20, 25, 32discrete
u r b bars420integer
u r l m59.50continuous
l r ϕ mm8, 10, 12, 16, 20, 25, 32discrete
l r b bars420integer
l r l m38continuous
Shear reinforcement
u v ϕ mm10, 12, 16, 20, 25, 32discrete
u v s m0.10.4continuous
u v l m1.504.80continuous
l v ϕ mm10, 12, 16, 20, 25, 32discrete
l v s m0.10.4continuous
l v l m1.504.80continuous
Material grade
c g MPa25, 30, 35, 30discrete
s g MPa400, 500discrete
Table 2. Optimization problem parameters and specific values.
ParameterUnitValue
Structure geometry
Vertical heightm5
Horizontal spanm10
Hinge heightm3
Embankment depthm5
Section depthm1
Structural loads
Terrain densitykN/m320
Concrete densitykN/m324
Steel densitykN/m378.5
Terrain internal friction angle30
Active earth pressure0.33
Resting earth pressure0.50
Heavy vehicle loadkN150
Heavy vehicle lengthm1.20
Uniform overloadkN/m210
Ballast coefficientMN/m310
Sustainability metrics
Economic costsEURTable 3
Environmental impactpointTable 4
Social impactmrhTable 4
Verification parameters
Standard regulationsCEN [22,23]/MFOM [24]
Applicable codesMFOM [25]
Table 3. Unit cost values for each RCPMF material [30].
MaterialUnitCost (EUR)
C25/30 concretem3112.85
C30/37 concretem3126.16
C35/45 concretem3129.32
C40/50 concretem3133.13
B400S steelkg1.79
B500S steelkg1.84
Table 4. LCA processes and environmental and social unit impact values [32,33,34].
ProcessUnit elca i (Point) slca i (mrh)
concrete production 25 MPam32.037 × 1011.254 × 105
concrete production 30 MPam32.631 × 1011.668 × 105
concrete production 35 MPam32.478 × 1011.554 × 105
concrete production 40 MPam32.585 × 1011.623 × 105
steel production B400Skg2.417 × 10−11.941 × 10³
steel production B500Skg2.538 × 10−12.067 × 10³
clay productionkg1.062 × 10−38.475 × 100
gravel productionkg1.196 × 10−32.617 × 100
sand productionkg1.718 × 10−33.543 × 100
transport, freight, lorry 16–32 tont·km2.502 × 10−24.116 × 101
transport, freight, lorry 3.5–7.5 tont·km7.755 × 10−21.655 × 10²
transport, passenger, carkm2.760 × 10−41.417 × 10⁻¹
digger, operationmin7.876 × 10−28.825 × 10²
skid plate, operationmin7.651 × 10−28.657 × 10²
diesel, burned in building machineMJ1.361 × 10−28.764 × 100
carbon dioxidekg4.369 × 10−20.000 × 100
mortar productionkg3.084 × 10−21.415 × 10²
epoxy productionkg8.399 × 10−14.107 × 10³
rock crushingkg7.223 × 10−58.304 × 10⁻¹
Table 5. Multi-objective optimization results for each repair operator.
AlgorithmCost (EUR)ELCA (point)SLCA (mrh)
Proximity-Based Repair Operator6859.121888.4710,213,316.60
Proximity-Based Repair Operator6916.661843.5310,044,173.90
Proximity-Based Repair Operator7265.142000.7910,034,435.19
Proximity-Based Repair Operator7444.462019.9410,019,198.00
Random Repair Operator5928.401719.599,374,328.45
Random Repair Operator7628.831995.9510,001,144.50
Random Repair Operator6209.171724.689,042,720.41
Statistical-Based Repair Operator5926.731642.599,047,905.18
Statistical-Based Repair Operator5697.681699.129,271,219.62
Statistical-Based Repair Operator5740.801653.048,967,342.29
Table 6. Non-dominated solutions optimization variables for each repair operator.
Proximity-BasedRandomStatistical-Based
A 1 A 2 A 3 A 4 A 5 A 6 A 7 A 8 A 9 A 10
w d 0.7570.4800.5071.0960.3290.6470.6950.3890.3890.428
u s d 1.1890.8571.0891.5441.1430.9160.8890.8310.8311.020
l s d 1.0310.7490.8000.7830.6670.9550.8080.9250.9250.651
A w l i 5.03 × 10−39.82 × 10−36.91 × 10−36.28 × 10−32.41 × 10−31.13 × 10−26.43 × 10−34.40 × 10−34.40 × 10−33.22 × 10−3
A w l e 9.05 × 10−45.89 × 10−39.42 × 10−45.89 × 10−37.85 × 10−47.54 × 10−33.93 × 10−32.01 × 10−32.01 × 10−36.28 × 10−3
A w u i 3.77 × 10−31.58 × 10−38.04 × 10−34.02 × 10−33.22 × 10−39.82 × 10−33.14 × 10−32.26 × 10−32.26 × 10−32.81 × 10−3
A w u e 5.89 × 10−37.54 × 10−35.89 × 10−31.73 × 10−34.91 × 10−34.02 × 10−39.42 × 10−45.65 × 10−35.65 × 10−34.40 × 10−3
A u b 6.91 × 10−31.37 × 10−28.17 × 10−31.08 × 10−27.85 × 10−38.80 × 10−38.80 × 10−31.28 × 10−21.28 × 10−28.84 × 10−3
A u r 1.26 × 10−21.37 × 10−21.26 × 10−26.84 × 10−35.23 × 10−38.84 × 10−31.28 × 10−24.83 × 10−34.83 × 10−38.80 × 10−3
A u t 3.14 × 10−32.04 × 10−31.61 × 10−21.58 × 10−31.81 × 10−31.57 × 10−35.89 × 10−32.49 × 10−32.49 × 10−31.10 × 10−3
A l b 2.71 × 10−36.87 × 10−32.41 × 10−32.26 × 10−35.89 × 10−34.91 × 10−32.41 × 10−33.93 × 10−33.93 × 10−32.81 × 10−3
A l r 1.93 × 10−27.64 × 10−35.03 × 10−35.03 × 10−36.84 × 10−35.03 × 10−39.42 × 10−31.77 × 10−21.77 × 10−26.03 × 10−3
A l t 6.28 × 10−34.83 × 10−32.51 × 10−33.14 × 10−31.01 × 10−24.02 × 10−32.36 × 10−32.94 × 10−32.94 × 10−35.23 × 10−3
A l c 2.71 × 10−32.26 × 10−33.14 × 10−39.42 × 10−41.58 × 10−35.89 × 10−32.41 × 10−31.13 × 10−31.13 × 10−33.22 × 10−3
A u c 2.81 × 10−31.13 × 10−31.10 × 10−31.81 × 10−36.91 × 10−33.14 × 10−39.42 × 10−42.71 × 10−32.71 × 10−31.61 × 10−3
A u v 6.55 × 10−31.78 × 10−33.28 × 10−32.97 × 10−31.68 × 10−34.53 × 10−33.99 × 10−32.14 × 10−32.14 × 10−31.38 × 10−3
A l v 1.95 × 10−33.60 × 10−32.15 × 10−32.94 × 10−35.66 × 10−47.82 × 10−49.16 × 10−46.37 × 10−46.37 × 10−44.32 × 10−3
l c v 1.4592.0891.2122.9302.0622.4081.3192.7262.7261.291
l c h 3.9823.5104.8773.3844.5874.0814.3714.7124.7124.073
u c v 1.5941.4991.2371.1701.9881.5031.0401.0001.0001.236
u c h 3.3503.1812.5954.9854.3342.7911.6291.5161.5182.007
u v l 3.0843.8413.1464.9753.1943.0612.1493.1923.1923.629
l v l 2.3242.2591.1704.4971.7002.2861.2823.1402.8132.423
u r l 6.2767.2257.0507.6866.2095.9687.4369.5519.5515.290
l r l 7.3035.2335.2045.0455.6587.6805.5339.0619.1105.201
c g 25.0025.0030.0025.0030.0025.0035.0035.0030.0035.00
s g 500.00500.00500.00500.00400.00500.00400.00400.00400.00500.00
Table 7. Multi-criteria decision-making results.
CostELCASLCAScoresRanks
W j 0.335400.332430.33216 S i SAW S i FUCA R i SAW R i FUCA
A 1 6859.121888.471.02133 × 1070.914336.9967677
A 2 6916.661843.531.00441 × 1070.904466.6675666
A 3 7265.142000.791.00344 × 1070.980858.9967699
A 4 7444.462019.941.00191 × 1070.955968.3359588
A 5 5928.41719.590.93743 × 1070.820814.0030544
A 6 7628.831995.951.00011 × 1070.989159.002961010
A 7 6209.171724.680.90427 × 1070.836165.0014355
A 8 5926.731642.590.90479 × 1070.798412.0029622
A 9 5697.681699.120.92712 × 1070.804252.3291933
A 10 5740.801653.040.89673 × 1070.789571.6678311
Disclaimer/Publisher’s Note: The statements, opinions and data contained in all publications are solely those of the individual author(s) and contributor(s) and not of MDPI and/or the editor(s). MDPI and/or the editor(s) disclaim responsibility for any injury to people or property resulting from any ideas, methods, instructions or products referred to in the content.

