Abstract
The burgeoning domain of medical imaging has witnessed a paradigm shift with the integration of AI, particularly deep learning, enhancing diagnostic precision and expediting the analysis of Computed Tomography (CT) images. This study introduces an innovative Multilayer Perceptron-driven model, DiagnosticMLP, which sidesteps the computational intensity of attention-based mechanisms, favoring a no-attention architecture that leverages Fourier Transforms for global information capture and spatial gating units for local feature emphasis. This study’s methodology encompasses a sophisticated augmentation and patching strategy at the input level, followed by a series of MLP blocks designed to extract hierarchical features and spatial relationships, culminating in a global average pooling layer before classification. Evaluated against state-of-the-art MLP-based models including MLP-Mixer, FNet, gMLP, and ResMLP across diverse and extensive CT datasets, including abdominal, and chest scans, DiagnosticMLP demonstrated a remarkable ability to converge efficiently, with competitive accuracy, F1 scores, and AUC metrics. Notably, in datasets featuring kidney and abdomen disorders, the model showcased superior generalization capabilities, underpinned by its unique design that addresses the complexity inherent in CT imaging. The findings in terms of accuracy and precision-recall balance posit DiagnosticMLP as an exceptional outperforming alternative to attention-reliant models, paving the way for streamlined, efficient, and scalable AI tools in medical diagnostics, reinforcing the potential for AI-augmented precision medicine without the dependency on attention-based architectures.
Keywords:
computed tomography; deep learning; DiagnosticMLP; multilayer perceptron; MLP; no-attention architecture; medical image classification; Fourier Transforms; spatial gating MSC:
68T07; 68T30; 68T01; 68U10
1. Introduction
Computed Tomography (CT), also known as Computed Axial Tomography (CAT), is an advanced medical imaging technique that utilizes X-rays and computer processing to create detailed images of the body’s internal structures [1]. Unlike traditional X-rays that emit a single beam of radiation, a CT scanner emits multiple beams as it rotates around the patient, capturing images from various angles. These images are then processed by a computer to produce cross-sectional views. This process allows for the creation of detailed 3D images of organs, bones, and tissues, providing a more comprehensive view than standard X-rays. CT scans play a critical role in medical diagnosis and treatment. In cancer care, CT scans assist in identifying tumors, guiding biopsies, and planning radiation therapy. They are also instrumental in diagnosing cardiovascular diseases, such as blockages in the heart’s arteries, and are used in detecting infectious diseases, and musculoskeletal disorders. Furthermore, CT imaging is key in examining brain disorders, including strokes and head injuries.
In the realm of medical imaging, CT scans have emerged as a pivotal tool, particularly when integrated with Artificial Intelligence (AI) methods for enhanced image analysis and disease detection. This integration harnesses the high-resolution, cross-sectional imaging capabilities of CT scans, combined with the advanced pattern recognition and learning algorithms of AI, to offer significant advancements in diagnostic accuracy and efficiency [2,3]. CT images, typically in the form of cross-sectional slices, provide an excellent dataset for AI algorithms, which require large amounts of high-quality data to learn and make accurate predictions. AI methods, particularly those using deep learning like Convolutional Neural Networks (CNNs), are adept at analyzing these complex images [4,5]. By training on vast datasets of annotated CT images, these AI models learn to identify patterns and anomalies indicative of specific diseases, often with a level of precision that surpasses human capability [6].
The application of AI in analyzing CT scans has shown promising results in various areas of disease detection. For instance, in oncology, AI algorithms have been used to detect and classify tumors in organs such as the lung, liver, and brain, often at early stages where they might be missed by the human eye [5,7]. In neurology, AI-assisted CT image analysis has been instrumental in the rapid detection of stroke, enabling quicker intervention and potentially reducing the severity of outcomes. Similarly, in cardiovascular medicine, AI methods have been used to analyze CT angiography images to identify blockages and other abnormalities in blood vessels [5]. However, while the potential of AI in CT image analysis is immense, there are challenges and considerations reported by several researchers [8,9,10,11]. One major challenge is the need for large, diverse datasets to train the AI algorithms, ensuring they are robust and capable of generalizing across different populations. CT images can vary greatly due to differences in equipment, imaging protocols, and patient-specific factors. This variability can affect the performance of classification models. CT image classification, especially with deep learning methods, requires significant computational resources for both training and inference, which can be a limitation in some settings. Overfitting to training data is a common challenge. Additionally, there are concerns regarding the interpretability of AI decisions, which is critical for clinician trust and understanding. Ensuring the AI systems work in tandem with radiologists, rather than replacing them, is essential for integrating human expertise with AI efficiency.
Attention mechanisms were initially developed to improve the performance of neural networks by focusing on the most relevant parts of the input data. In image processing, this meant highlighting specific regions or features in an image. Gradually, attention mechanisms have become more sophisticated, with the development of models like Transformers, which use self-attention to weigh the importance of different parts of the input data [12,13,14,15,16]. While attention mechanisms have brought significant advancements in the field of CT image classification, they come with certain drawbacks, particularly related to computational complexity and interpretability [17,18]. Therefore, the incorporation of modern MLPs represents an effort to overcome these limitations while harnessing the benefits of deep learning for medical imaging analysis.
This paper proposes a deep learning MLP-driven model termed DiagnosticMLP which combines two words: “Diagnostic” with “MLP”, highlighting the Multilayer Perceptron network’s specialized use in image-based diagnostics. The overall architecture suggests a sophisticated approach, combining traditional techniques like MLPs with modern approaches like spatial gating and Fourier transformations tailored for the classification of Computed Tomography (CT) medical images. With its no-attention architecture, several key contributions of DiagnosticMLP are highlighted below:
- The DiagnosticMLP model applies Fourier transformations to the input patches. This contributes to capturing frequency domain features which can be particularly useful in medical image analysis for enhancing patterns that are not easily visible in the spatial domain. The Fourier layer applies a 2D Discrete Fourier Transform (DFT) across patches, enabling the model to capture global dependencies without the need for self-attention mechanisms.
- Another aspect of this model is the use of three MLP blocks, which likely consist of multiple MLP layers applied in a sequential way. While the MLP (1) block performs on channel-level, the MLP (2) block works on patch-level after transposing the output from MLP (1). Thence, the MLP (3) block is designed to process embeddings after the spatial gating unit.
- DiagnosticMLP employs a channel transpose mechanism suggesting that the model might be considering the inter-channel relationships of the features, which is not common in traditional MLPs.
- DiagnosticMLP utilizes a spatial gating unit responsible for controlling the flow of spatial information. The use of spatial gating suggests that the model can focus on specific regions of the image that are more relevant for the classification task, similar to attention mechanisms. This unit works by splitting the features along the channel dimension and applying a gating mechanism through element-wise multiplication.
- The design suggests an iterative process where the same DiagnosticMLP block is used multiple times, which might contribute to a more profound hierarchical feature extraction.
- The design is likely optimized to handle the high complexity of CT medical imaging data and extract meaningful patterns for accurate diagnosis, which could significantly contribute to the field of medical image analysis.
This paper is meticulously structured to provide a comprehensive examination of the DiagnosticMLP model, beginning with an Introduction (Section 1) that sets the stage for the importance of advanced medical imaging techniques and the integration of AI in enhancing diagnostic processes. The Related Work (Section 2) delves into the current landscape of MLP-based frameworks and their evolution, exploring new paradigms in spatial relationships, dense prediction, and image processing. Subsections extend the discussion to the nuanced approaches in hierarchical and axial feature integration, and context aggregation, culminating in identifying the existing gaps that DiagnosticMLP aims to address. The Methodology (Section 3) describes the innovative no-attention architecture of DiagnosticMLP, while the Experimental Setup (Section 4) outlines the datasets used, computing resources employed, and the evaluation metrics adopted. Following this, the Experimental Results (Section 5) provides a critical analysis of the model’s performance against modern MLP models and attention-based models. An ablation study (Section 6) was conducted to justify the model design choices. Highlights on the model and its challenges are shown (Section 7), leading to a Conclusion (Section 8) that not only synthesizes the findings but also proposes avenues for future work, suggesting the expansive potential of DiagnosticMLP in medical image analysis.
2. Related Work
Recent advancements in deep learning have sparked debates and investigations into the efficacy of various neural network architectures. This literature review critically analyzes key studies focusing on the role of Multilayer Perceptrons (MLPs) in advancing the field, examining their comparative effectiveness, potential for paradigm shifts, and implications for future research. The last decade, often referred to as the third spring of deep learning, has witnessed a flurry of activity in both theoretical and practical aspects of neural network architectures. The evolution from CPUs to GPUs as the primary computing hardware has catalyzed this growth, leading to a significant increase in network scale and complexity. Liu et al. [19] underscored the importance of this transition, suggesting that the future paradigm shift might hinge on new physical system-based computing hardware. Transformers, particularly their use of attention mechanisms, have been pivotal in advancing deep learning. However, Pan et al. [20] introduced a novel perspective, suggesting that reducing attention in early layers of transformers can be beneficial, especially in vision tasks. This idea is echoed in Melas-Kyriazi [21] and Tay et al. [22] which question the necessity of attention layers in vision transformers, indicating that other aspects, such as patch embedding, might be more critical to their success. The resurgence of interest in MLPs, primarily due to their simplicity and effectiveness, is a central theme in recent literature. Guo et al. [23] and Liu, Li, Tao, Liang, and Zheng [19] both highlighted the renewed focus on MLPs, especially in the context of vision tasks. These studies collectively pondered whether MLPs can match or surpass the performance of more established architectures like CNNs and transformers. Guo, Liu, Mu, Liang, Martin, and Hu [23] discussed the historical context of MLPs, their resurgence, and potential future directions.
2.1. Emergence of MLP-Based Architectures
The MLP-Mixer [24] was introduced as a seminal work that broke away from the convention by using MLPs for both channel and token mixing, paving the way for a new class of architectures. Their study was pivotal in demonstrating that neither convolutions nor attention mechanisms are necessary for effective image classification. The MLP-Mixer, with its unique design of applying MLPs both to individual image patches and across patches, showed competitive results on benchmarks when trained on large datasets, suggesting an alternative pathway to traditional CNNs and transformers. Zhang et al. [25] expanded on the MLP-Mixer concept by proposing the Multi-Scale MLP-Mixer (MSMLP). Their study addressed the computational challenges of the MLP-Mixer, especially when processing images of varying complexity. By employing MLP-Mixers of different scales and introducing a feature reuse mechanism, the MSMLP provided a more computationally efficient solution while maintaining accuracy. Tay, Bahri, Metzler, Juan, Zhao, and Zheng [22] introduced the Synthesizer model, challenging the indispensable role of dot product-based self-attention in transformers. Their study found that synthetic attention weights, without token–token interactions, could achieve competitive performance, suggesting a potential simplification of the transformer architecture.
As alternatives to self-attention, Liu et al. [26] proposed the gMLP, which demonstrated that MLPs with gating mechanisms could perform on par with transformers in language and vision tasks. This suggested that self-attention might not be critical for achieving high accuracy. Touvron et al. [27] presented ResMLP, a simple yet efficient MLP-based architecture for image classification. ResMLP’s design and data-efficient training strategy illustrated that MLPs could achieve good accuracy–complexity trade-offs, challenging the dominant role of CNNs and transformers. ConvMLP was proposed by Li et al. [28] for bridging the gap between convolutional and MLP architectures. Their model addressed the limitations of spatial MLPs in handling variable input dimensions and demonstrated the potential of MLP-based models in object detection and semantic segmentation, traditionally dominated by CNNs.
Further architectures have been proposed for enhancing the scalability of MLP-based models to larger datasets, improving computational efficiency, and expanding applications in more diverse and challenging vision tasks. For example, Ren et al. [29] proposed a novel framework for cross-view image translation using Cascaded Cross MLP-Mixer GANs. This two-stage approach first utilized the CrossMLP sub-network for latent transformation cue learning, followed by a refined pixel-level loss stage for better optimization and noise reduction. Their method significantly outperformed existing models, especially in handling drastically different views and severe deformation cases. Their study was pivotal in demonstrating the adaptability of MLP architectures in complex image translation tasks. Yu et al. [30] responded to the limitations of the MLP-mixer when trained on medium-scale datasets like ImageNet-1K. They introduced S2-MLP, a pure MLP architecture employing a spatial-shift operation to facilitate patch communication. This operation was local, spatial-agnostic, and parameter-free, enhancing computational efficiency. The S2-MLP model, devoid of token-mixing MLPs, achieved higher recognition accuracy than the MLP-mixer on ImageNet-1K and matched ViT’s performance, showcasing a simpler yet effective approach. Choe et al. [31] extended the application of MLP architectures to 3D point cloud understanding with PointMixer. Addressing the limitations posed by the inherent characteristics of point clouds, PointMixer replaced token-mixing MLPs with a Softmax function for effective information sharing among unstructured 3D point sets. Their approach demonstrated superior performance and efficiency in tasks like semantic segmentation and classification compared to transformer-based methods. Recently, Wang et al. [32] introduced X-MLP, an architecture that further detaches from traditional convolution and self-attention operations. Unique in its complete reliance on fully connected layers, X-MLP excelled in decoupling features and achieved remarkable performance across multiple benchmark datasets. Its ability to capture long-range dependencies without patch embedding represented a significant stride in vision MLP models.
2.2. Rethinking Spatial Relationships and Efficiency in MLPs
Efficiency through simplification was pointed by ShiftViT [33], which replaces attention layers with shift operations, and FNet [34], which uses Fourier Transforms for token mixing, emphasizing their operational efficiency. To elaborate, ShiftViT [33] is a paradigm shift replacing attention layers in vision transformers with shift operations. This zero-parameter approach challenged the conventional reliance on attention mechanisms, demonstrating comparable or improved performance in mainstream tasks. Similarly, FNet [34] utilized Fourier Transforms for token mixing, replacing self-attention sublayers. FNet achieved high accuracy with significantly faster training, showcasing the potential of simpler linear transformations in achieving high efficiency and speed. To operate efficiency in the frequency domain, Rao et al. [35] presented the Global Filter Network (GFNet), a model that operates in the frequency domain, learning long-term spatial dependencies with log-linear complexity. Replacing self-attention layers with a series of Fourier Transforms, GFNet offered an accuracy/complexity trade-off that competed with transformer-style models and CNNs, highlighting the efficiency of frequency domain processing in image classification. Yu et al. [36] re-examined the role of token-mixing MLPs in vision backbones. They proposed the Circulant Channel-Specific (CCS) token-mixing MLP, addressing the spatial translation sensitivity and channel-agnostic limitations of existing models. The spatial-invariant, channel-specific structure achieved higher classification accuracy on the ImageNet-1K benchmark with fewer parameters, indicating the potential for more efficient MLP-based vision backbones.
Hou et al. [37] proposed the Vision Permutator, an MLP-like architecture that separately encoded feature representations along height and width dimensions. Their model effectively captured long-range dependencies while preserving positional information, leading to substantial improvements in visual recognition tasks. The Permutator’s performance rivaled that of CNNs and vision transformers, demonstrating the efficacy of rethinking spatial encoding in MLP-like models. Lou et al. [38] explored the scaling of cross-token modules in transformers through Sparse-MLP, an all-MLP model employing sparsely activated MLPs for cross-token modeling. By enhancing computational efficiency and accuracy in image classification tasks, their study underscored the potential of MLP-based models in efficiently handling large-scale datasets. Song and Sun [39] ventured into model-based reinforcement learning with PC-MLP, demonstrating the adaptability of MLP models beyond vision tasks. Their approach, focusing on exploration efficiency in control tasks, highlighted the versatility of MLP architectures in diverse applications.
2.3. Rethinking Dense Prediction and Image Processing in MLPs
Different studies collectively illustrate a significant trend in computer vision: moving towards MLP-based architectures for image processing and dense prediction tasks. The architectural design of MAXIM by Tu et al. [40] focused on supporting high-resolution images and considering global properties. CycleMLP, developed by Chen et al. [41], was notable for its adaptability and efficiency. Meanwhile, RaftMLP, created by Tatsunami and Taki [42], was distinguished by its novel approach to integrating inductive biases, marking significant advancements in the field. More details about each architecture are given below. MAXIM is a multi-axis MLP architecture tailored for image processing tasks [40]. Addressing the challenges of high-resolution image support and local attention limitations in conventional models, MAXIM featured a UNet-shaped hierarchical structure with spatially gated MLPs. This design facilitated efficient spatial mixing of local and global visual cues, bolstering performance in tasks like denoising, deblurring, and enhancement. MAXIM’s distinctiveness was in its dual focus on global and fully convolutional properties, desirable in image processing, and its state-of-the-art results on numerous benchmarks with optimized parameters and computational efficiency. CycleMLP is an MLP-like architecture that stands out for its versatility in visual recognition and dense prediction tasks [41]. Unlike contemporary MLP models, CycleMLP operated various image sizes and achieved linear computational complexity relative to image size. This was a notable improvement over the quadratic computations of previous models. The architecture surpassed existing MLPs and even top transformer-based models, like the Swin Transformer, in efficiency and performance. Particularly in object detection, instance segmentation, and semantic segmentation, CycleMLP demonstrated competitive results, exemplifying its robustness and adaptability. Tatsunami and Taki [42] explored the potential of architectures without CNN and self-attention through RaftMLP. This model rethought the inductive biases inherent in MLP-Mixer by incorporating non-convolutional biases. The approach of dividing the token-mixing block and densifying spatial correlations among channels led to improved accuracy with reduced parameters and computational complexity. RaftMLP stood comparable to state-of-the-art global MLP-based models in efficiency. However, its performance in downstream tasks like object detection highlighted the need for MLP-specific architectures tailored for such applications.
2.4. Rethinking Hierarchical and Axial Feature Integration in MLPs
In the realm of image segmentation, especially in medical imaging, recent advancements have been marked by innovative applications of MLP-based architectures. For instance, Guo et al.’s Hire-MLP [43] revolutionized traditional MLP approaches by introducing hierarchical rearrangements, significantly enhancing the performance in various vision tasks. Building on this, Guo, Tang, Han, Chen, Wu, Xu, Xu, and Wang [43] proposed AS-MLP, which emphasized local feature interactions through axial shifts, marking a significant shift towards localizing MLP applications. This trend towards localized feature processing is further evident in the work of Cheng and Wang [44], who introduced a dynamic hierarchical multi-scale fusion network in medical image segmentation, emphasizing detailed lesion identification. Similarly, Schmidt-Mengin et al. [45] and An et al. [46] explored axial MLP architectures, focusing on specific medical conditions like multiple sclerosis and enhancing foreground segmentation in medical images, respectively. Valanarasu and Patel’s UNeXt [47] represented a culmination of these trends, combining convolutional features with tokenized MLP blocks, leading to a significant reduction in computational complexity and enhancing the practicality for point-of-care applications. Together, these studies illustrated a clear trajectory towards more specialized, efficient, and application-focused MLP-based architectures, indicating a maturing field poised for impactful real-world applications in medical imaging and beyond.
2.5. Context Aggregation in MLPs
In the realm of computer vision and neural network architectures, recent studies have presented innovative approaches that challenge traditional paradigms. Gao et al. [48] introduced the Container model, a novel context aggregation network that unified various architectural approaches like CNNs, transformers, and MLP-Mixers. Their model leveraged the long-range interaction capabilities of transformers while retaining the inductive bias of local convolution operations from CNNs, leading to faster convergence speeds. It demonstrated significant improvements in object detection and instance segmentation tasks, outperforming existing models like ResNet-50 in terms of detection. Similarly, Hu et al. [49], in their study on Graph-MLP, proposed an MLP-based framework for node classification in graphs, eliminating the need for traditional message-passing modules. Their approach, which utilized a neighboring contrastive loss, highlighted the potential of MLPs in handling large-scale graph data and corrupted adjacency information, achieving comparable or superior performance against state-of-the-art models in graph node classification tasks. Bouazizi et al. [50] further extended the utility of MLPs in their study, MotionMixer, for 3D human body pose forecasting. This model efficiently learned spatial–temporal dependencies of body poses using a sequential mixing of MLPs for spatial and temporal features. Their approach, which included the use of squeeze-and-excitation blocks, demonstrated state-of-the-art performance in pose forecasting on various datasets, while maintaining a smaller model size. These studies collectively underscore a significant shift in neural network design, showcasing the versatility and efficiency of MLP-based architectures across diverse applications, from image processing to graph data analysis and human pose forecasting.
2.6. The Gap
The reviewed studies collectively illuminate the burgeoning field of MLP-based architectures in vision and deep learning. Innovations like MLP-Mixer, gMLP, MSMLP, ResMLP, CrossMLP, S2-MLP, PointMixer, PC-MLP, MAXIM, CycleMLP, RaftMLP, Hire-MLP, X-MLP, AS-MLP, Container, Synthesizer, Graph-MLP, MotionMixer, ConvMLP, ShiftViT, FNet, and GFNet challenge traditional paradigms, offering simpler, more efficient alternatives to attention mechanisms and CNNs. The Vision Permutator and CCS token-mixing MLP represent strides in improving spatial encoding and model efficiency. Across these advancements, a common theme emerges: the quest for more efficient, scalable, and versatile architectures in machine vision and learning. This paradigm shift highlights a growing trend in neural network research, moving away from traditional CNN and transformer-based architectures towards more generalized, MLP-centric designs that promise improved performance and efficiency. There has been minimal exploration into the application of contemporary MLP architectures within the realm of medical image analysis and classification. Consequently, the amalgamation of cutting-edge MLP techniques with CT image examination constitutes a notable progression in the field of medical imaging. This advancement holds the promise for enhanced precision, efficiency, and the early identification of medical conditions. Thus, in this study, we introduce and assess a hybrid MLP-derived model, which we have termed DiagnosticMLP, through extensive testing on various CT image datasets.
3. Methodology
This study developed an MLP-derived model named DiagnosticMLP, geared towards improving computed tomography (CT) medical image classification by utilizing a no-attention architecture. The model incorporates mixing tokens with Fourier Transforms following the FNet model by Lee-Thorp, Ainslie, Eckstein, and Ontanon [34], employs three types of MLP models, and integrates a spatial gating unit akin to the gMLP model by Liu, Dai, David, and Quoc [26]. Given the detailed components and the innovative approach of leveraging no-attention mechanisms, which can potentially enhance computational efficiency and reduce the complexity inherent in attention-based models, DiagnosticMLP is claimed to be a significant contribution to medical imaging. Figure 1 shows the overall architecture of the proposed DiagnosticMLP model for CT medical image classification and a breakdown of the architecture components. The model starts with CT medical images as inputs, which are then subjected to an augmentation layer. The proposed DiagnosticMLP employs an augmentation layer to potentially transform the patches in a manner that is beneficial for the model’s training and generalization. Then, DiagnosticMLP model divides the augmented images into a set of non-overlapping patches. These patches allow the model to process local features independently. These patches are then flattened and linearly embedded to create a sequence of vectors (tokens) that can be processed by subsequent layers. For each patch, a fully connected layer is applied, which projects the patches into a higher-dimensional space. This is analogous to the token projection in transformers.
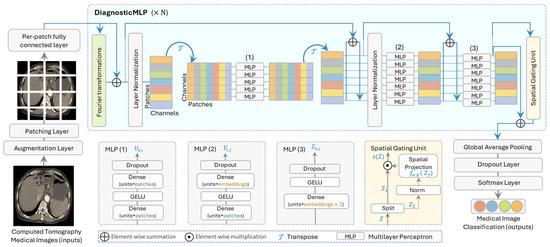
Figure 1.
The overall architecture of the proposed model (DiagnosticMLP) geared towards improving computed tomography (CT) image classification by utilizing tokens-mixing with Fourier transformations, three architectures of MLP, and spatial gating unit.
The distinguished architectural design of DiagnosticMLP, demonstrated in Figure 1, includes Fourier transformations [34], three MLP blocks where two of them are similar to MLP-Mixer [24], and the spatial gating unit [26], which will be explained in the following subsections.
3.1. Fourier Transformations Sublayer
Fourier transformations are mathematical tools that convert signals from the time domain to the frequency domain. In the context of DiagnosticMLP model, they are used to mix the tokens (i.e., image patches) in a way that captures global information efficiently. Fourier sublayer was used in our model to replace self-attention sublayer in transformers. This sublayer applies a 2D Fast Fourier Transform (2D FFT) to the sequence, leveraging the Fourier transform’s ability to mix tokens and provide access to all tokens. This involves two FFT operations. One FFT is applied along the sequence dimension, denoted as . Another FFT is applied along the hidden dimension, denoted as . The output of the Fourier sublayer is then described by the following equation:
where represents the real part of the complex output from the FFT, since subsequent layers of the network may not handle complex numbers. When applying the to image processing, we used a two-dimensional array of image pixel values. For a sequence of image patches, we applied the 2D FFT to each patch independently. Thus, the function in Equation (1) is further elucidated as follows:
where is the input image with size , is the value of the frequency domain at coordinates , is the intensity of the image at the pixel located at , is the base of the natural logarithm, and is the imaginary unit. The indices and run from to , and to , respectively, and they represent the frequencies along the and directions of the spatial domain. For a sequence of image patches, the 2D FFT was applied to each patch individually, as in the following formula:
where ranges from 1 to , representing each patch in the sequence. To efficiently compute this, most libraries and algorithms implement the FFT in a recursive or iterative manner that reduces the computational complexity from to , which is significantly faster for large , making the FFT a powerful tool in image processing and analysis. Then, DiagnosticMLP continues to perform element-wise summation (skip connection) between the image patches (inputs) and the resulting embedding from the Fourier sublayer. The Fourier transform effectively captures relationships between tokens in the sequence by converting the input into the frequency domain, where patterns and structures can be detected as frequencies. It is this transformation back and forth between the time and frequency domains that allows the model to “mix” the information across the sequence. The Fourier layer can process image patches in a computationally efficient manner compared with the self-attention mechanism in standard transformers. This results in an architecture that is simpler and can be faster than traditional attention-based models while still being able to capture the global dependencies between tokens. Later in this paper, further comparisons and benchmarking with attention-based models are provided.
3.2. MLP Blocks
These blocks are the core of the model, where each block consists of one or more MLPs. An MLP is a class of feedforward artificial neural network that consists of at least three layers of nodes: an input layer, a hidden layer, and an output layer. MLPs utilize a technique called backpropagation for training the network. DiagnosticMLP uses three MLP blocks with their specifics shown in the lower part of Figure 1:
- MLP (1): The first set of MLP blocks processes the data through several layers of dense units with dropout and GELU (Gaussian Error Linear Units) non-linearity. This allows for non-linear feature extraction at the patch level.
- MLP (2): After transposing the channels and patches, another set of MLP blocks is applied. These further process the features and help the model to learn more complex patterns.
- MLP (3): A final set of MLP blocks are applied, which includes the spatial embeddings which resulted from the spatial gating unit which we will explain shortly.
DiagnosticMLP operations involve layers that alternate between mixing the features of these patches at individual spatial locations and across the entire image. Mathematically, if represents the input image patches, and let X’ be the result of the per-patch fully connected layer applied to , let the Fourier transform layers apply F(X’) to obtain the globally mixed features, then, the sequence of MLP (1) block can be represented as the following:
where represents the series of MLP operations, and is the transpose operation. Similarly, the sequence of MLP (2) block can be represented as follows:
MLP (1) was specifically used for channel-mixing, MLP (2) for token-mixing, while MLP (3) for spatial-mixing as it comes after implementing spatial gating, as will be explained shortly. The channel-mixing operation for each feature in a location can be represented as follows:
where is the feature at location and channel , and and are weight matrices. Similarly, the token-mixing and spatial-mixing operations for each location can be denoted as follows:
where , , and are weight matrices, is the mixed feature after the channel-mixing step, is the mixed feature after the tone-mixing step, and is the resulting feature after the spatial-mixing step. These MLP blocks share weights across the spatial locations, which simplifies the architecture and reduces the number of parameters. Notably, the DiagnosticMLP model does not use position embeddings as in transformers, because the shared MLPs inherently provide some level of positional invariance. The simplicity of the model, without the need for attention mechanisms or convolution, represents a different approach to learning visual representations.
3.3. Spatial Gating Unit
This unit allows the model to learn spatial relationships between different parts of the image data [26]. It controls which parts of the data are emphasized and which are suppressed, which can be particularly useful in image data where spatial relationships are key. This architecture is designed to be both computationally efficient and effective in capturing complex spatial relationships in medical images, making it suitable for tasks such as CT image classification. Its specifics are shown in the bottom part of Figure 1. As can be seen, the input to this unit is first split into two parts along the channel dimension. This splitting is represented as . Each part is then processed differently. is passed directly as one part of the output, facilitating a residual connection that helps in preserving the original input information, and undergoes a transformation that involves a gating mechanism. The gating mechanism is defined by an element-wise multiplication with the output of a learnable linear projection, as shown in the following equation:
where , and is a weight matrix, is a bias term, and denotes element-wise multiplication. The weights are initialized close to zero, and biases close to one. This initialization ensures that the gating function starts close to an identity function, allowing the block to behave like a regular feedforward network at the beginning of training. This is particularly important for training stability as it ensures that the gating function introduces spatial information gradually. Over time, the gating mechanism becomes more sophisticated and begins to effectively control the flow of information through the network. This allows the DiagnosticMLP model to learn and control the interaction between different tokens in the input sequence, adapting to the spatial structure of the CT image in a way that is efficient and stable during training.
3.4. Towards Classification
The remaining structure of the DiagnosticMLP model is designed with an emphasis on simplicity and effectiveness for analyzing CT medical images. The model incorporates layer normalization post-Fourier transformation, a critical process that brings uniformity to the inputs and maintains feature distribution consistency. Another layer of normalization post-transpose operation is employed with the emphasis on enhancing the model’s training stability and overall performance. As the architecture progresses, it employs global average pooling to condense spatial information into a singular vector that encapsulates the average features from the maps, which aids in prediction while also curtailing overfitting by reducing the model’s parameters. Additionally, the inclusion of a dropout layer strategically deactivates random neurons during the training phase to diversify the neural dependency within the network, further preventing overfitting. Concluding the model is the softmax layer, which interprets the outputs from preceding layers as a probability distribution across designated classes, selecting the class with the highest probability as the final predictive outcome.
This architecture is designed to capture both local features through patching and MLP and global dependencies through Fourier Transforms and spatial gating, while mitigating the need for attention mechanisms. DiagnosticMLP, proposed in this study, can be a promising approach to handling the high-resolution nature of CT images and could potentially lead to more efficient and scalable models for medical image analysis.
4. Experimental Setup
4.1. Datasets and Baselines
The datasets provided in Table 1 were utilized to evaluate the proposed model, DiagnosticMLP, comprising a wide range of medical CT scans. DICOM images from various hospitals in Dhaka, Bangladesh, formed the kidney CT dataset [51], which included four classes of kidney conditions, featuring a notably large number of images for cysts and normal kidneys. The abdomen CT dataset [52] comprised nine classes showcasing diverse abdominal issues, with the distribution of images ranging broadly across conditions, offering both common and rare cases. The chest CT dataset [53] was rich in images, particularly for bacterial pneumonia, and included conditions such as COVID-19, contributing to a dataset significant for training models in infectious disease diagnosis. Additionally, the kidney and chest cancer CT datasets [54] provided binary classifications between normal and cancerous conditions, with a substantial number of images that were key for the model to learn to discern cancer presence accurately. This ensemble of datasets, with their varied and ample images, was instrumental for developing the DiagnosticMLP model with an aim to automate and enhance the accuracy of medical diagnoses across a spectrum of conditions. Figure 2 presents exemplar images from the dataset employed to classify kidney CT scans into categories such as cysts, stones, tumors, and normal conditions [51].

Table 1.
Details about the datasets used in this study.
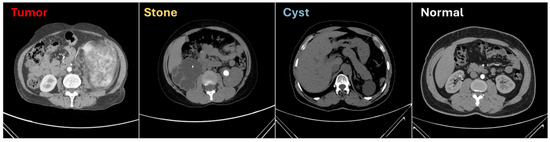
Figure 2.
Sample from the computed tomography (CT) used for kidney conditions classification [51].
This study utilized different baselines, focusing on modern MLP models, namely MLP-Mixer [24] which utilized MLPs both to individual image patches and across patches, FNet [34] which used Fourier Transforms for token mixing for emphasizing their operational efficiency, gMLP [26] which used MLPs with gating mechanisms in language and vision tasks, and ResMLP [27] which used residual networks with MLP to alternate patches and channels. Notably, as DiagnosticMLP promotes a no-attention architecture; we also used attention-based transformers for benchmarking including a traditional transformer encoder with typical self-attention [55] and a transformer with external attention mechanism [56]. Table 2 presents a detailed comparison of MLP-based and attention-based architectural designs. The number of parameters varies significantly across the models, with ResMLP having the highest count at over 5 million. The proposed DiagnosticMLP model has just over 1 million parameters, which could offer a good trade-off between performance and computational cost. All models share the same input size and a uniform dropout rate of 0.2, indicating a standard approach to input processing and regularization to prevent overfitting. All models utilize the same learning rate and weight decay, suggesting a standard approach to optimization during training. The embedding dimensions and number of blocks are consistent among the MLP-based architectures but are increased for the self-attention and external attention, to allow them to capture relationships in the data.
Table 2.
Configuration and hyperparameters summary for the proposed model, DiagnosticMLP, and the baseline models including modern MLP-based architectures and attention-based transformers.
4.2. Computing Resources
In this study, the evaluation of the proposed DiagnosticMLP model harnessed the formidable capabilities of the A100 GPU High-RAM available on Google Colab. This robust computational tool, underpinned by NVIDIA’s advanced Ampere architecture, was pivotal in accelerating the deep learning processes, facilitating complex computations. The A100’s high-bandwidth memory was particularly advantageous for our study’s demands, accommodating the intensive memory requirements with ease.
4.3. Evaluation
Below are the mathematical equations and explanations for the metrics used to evaluate DiagnosticMLP architecture: the loss function quantifies how well the model’s predictions match the true labels. Loss (Cross-Entropy Loss for classification tasks) is given by the following equation:
where represents the true labels, represents the predicted probabilities, and is the number of samples. The accuracy of the model is given by the following formula:
The score is the harmonic mean of precision and recall, providing a balance between the two metrics, especially in uneven class distributions.
where is the number of true positives, is the number of false negatives, and is the number of false positives. Finally, (Area Under the Receiver Operating Characteristic Curve) is calculated by plotting the true positive rate () against the false positive rate () at various threshold settings. The represents the likelihood that the model ranks a random positive example more highly than a random negative example. Mathematically, it is the integral of the ROC curve:
5. Experimental Results
5.1. Experimental Results of DiagnosticMLP Compared with Modern MLP Models
In the domain of CT medical image classification, the DiagnosticMLP model has emerged as a significant contender, as depicted in the comparative analysis of various state-of-the-art modern MLP models demonstrated in Table 3. For kidney disorders, DiagnosticMLP achieved a commendable balance between loss and accuracy, boasting a high F1 score of 0.9521 and an AUC of 0.8796, only slightly trailing behind ResMLP, which had perfect scores but may not generalize as well across diverse datasets. DiagnosticMLP’s efficiency is further exemplified by its consistent performance in abdomen disorders, with an F1 score of 0.948, which, despite not being the highest, still showcases the model’s robust capability in identifying a range of abdominal pathologies. The model’s prowess is similarly evident in chest disorders diagnosis, where it demonstrated substantial accuracy, with the respective AUC score of 0.7815. In the evaluation of kidney and chest cancer, DiagnosticMLP maintained a competitive stance, with AUCs of 0.9628 and 0.7095 respectively, reinforcing the model’s capacity to distinguish between normal and cancerous conditions effectively. The model’s performance across these datasets not only underlines its ability to process and analyze high-dimensional medical data efficiently but also its adaptability to various complexities presented in different types of CT scans. Such versatility and reliability advocate for DiagnosticMLP’s application in real-world diagnostic scenarios, presenting it as a valuable tool for medical practitioners. Future work may focus on enhancing the model’s precision where it lags and extending its applicability to a broader range of medical imaging tasks.
Table 3.
Experimental results from the proposed model (DiagnosticMLP) and benchmarking with modern MLP models for CT medical imaging classification.
Figure 3 illustrates the performance of the DiagnosticMLP model across various CT medical image datasets, highlighting both loss and accuracy metrics during the training and validation phases. For the kidney CT scan dataset, the model rapidly reduces training and validation loss within the first few epochs, indicating a swift learning rate and effective feature extraction. Correspondingly, the accuracy for both training and validation rises sharply, reaching a plateau that suggests the model achieves high consistency in predictions as training progresses. When analyzing the abdomen CT scan dataset, a similar rapid descent in loss is observed, with the validation loss closely mirroring the training loss, which is indicative of the model’s ability to generalize beyond the training data. The accuracy metrics demonstrate a steady increase, albeit with more pronounced variability between training and validation accuracy, suggesting that the model may benefit from further tuning to mitigate overfitting. In the chest disorders dataset, the training loss decreases significantly, yet the validation loss shows slight fluctuations, pointing to potential challenges in model generalization. Despite this, both the training and validation accuracy metrics improve over time, reflecting the model’s learning adaptability. For the kidney cancer and chest cancer datasets, the DiagnosticMLP model maintains a consistent reduction in loss over epochs, with the kidney cancer dataset displaying a smoother convergence compared to the chest cancer dataset. The accuracy for kidney cancer stabilizes at high levels for both training and validation, which is indicative of the model’s robustness in this classification task. However, the chest cancer dataset shows greater discrepancy between training and validation accuracy, which could suggest a need for further model optimization to bridge the gap between the model’s learning and its validation performance.
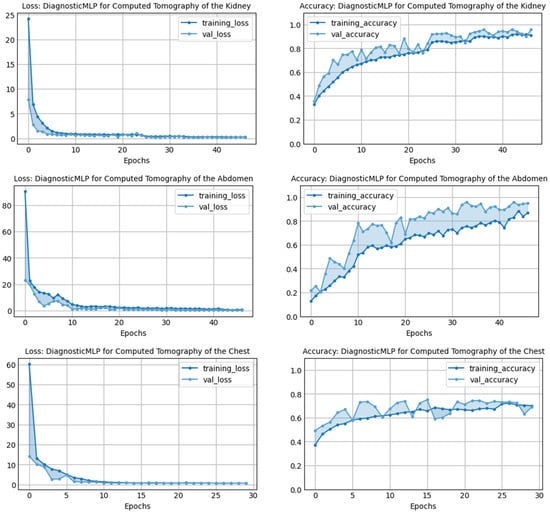

Figure 3.
Performance of the proposed model, DiagnosticMLP, in terms of loss and accuracy during training and validation using various CT medical image classifications.
A comprehensive view of the training and validation performance of various baseline models, namely MLP-Mixer, FNet, gMLP, and ResMLP, across different CT image classification tasks, is demonstrated in Figure 4. Across all datasets—kidney, abdomen, chest disorders, and kidney cancer—there is a clear trend of rapid initial loss reduction during the early epochs, which indicates a swift learning process. However, the validation loss shows varying degrees of volatility, suggesting differing levels of model generalization to unseen data. In terms of accuracy, most models exhibit an increasing trend, with training accuracy generally higher than validation accuracy, potentially indicating overfitting in certain cases. Notably, chest cancer classification presents a challenge for all models, with a more pronounced gap between training and validation accuracy, highlighting an area for future improvement.
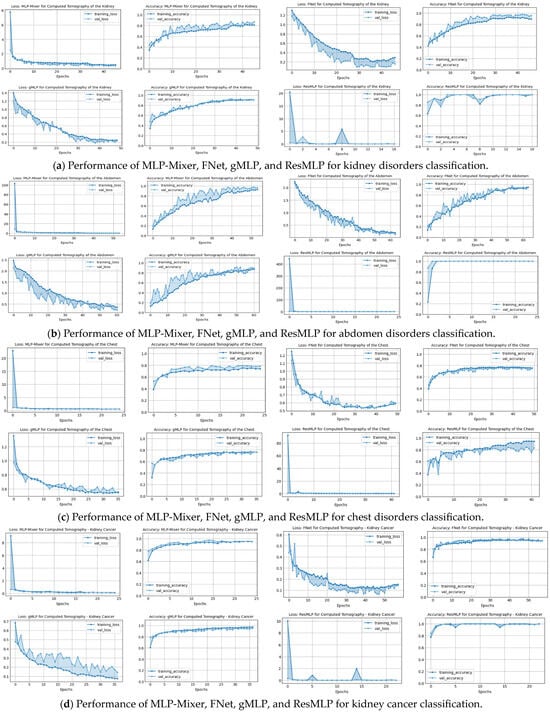
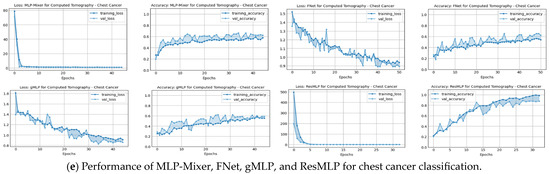
Figure 4.
Performance in terms of loss and accuracy during training and validation of different MLP-reliant architectures: MLP-Mixer, FNet, gMLP, and ResMLP models on chest, kidney, abdominal disorders, and cancer detection. These models were used as part of the benchmarking experiments with the proposed model, DiagnosticMLP, where its performance during training and validation is shown in the previous figure.
For further analysis, as outlined in Figure 5, the performance analysis of the DiagnosticMLP model demonstrates its efficacy in CT image classification tasks relative to other MLP-based architectures, evaluating both loss and accuracy metrics. For kidney disorder CTs, DiagnosticMLP shows a rapid improvement post-initial training epochs, achieving lower loss rates indicative of better data fitting, and eventually stabilizes to match the accuracy of models like FNet and gMLP. In abdominal CTs, it quickly surpasses other models in loss reduction, suggesting efficient error minimization, and maintains competitive accuracy, closely following the MLP-Mixer. The chest disorder CTs further confirm the model’s robustness, balancing low loss with high accuracy. For kidney and chest cancer CT datasets, DiagnosticMLP competes well initially, but later epochs reveal room for improvement, especially against the ResMLP model.
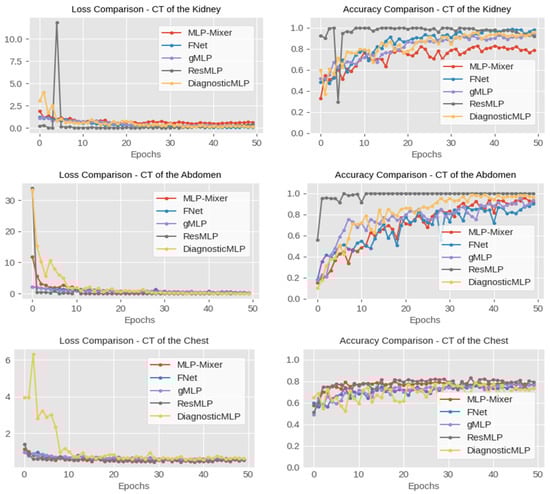

Figure 5.
Performance comparison, in terms of accuracy, of the proposed DiagnosticMLP model which employs Fourier Transforms, channel-mixing, token-mixing, and spatial-mixing through spatial gating unit, with the MLP-driven architectures, namely MLP-Mixer employing channel-mixing and token-mixing, FNet employing Fourier Transforms, gMLP employing spatial gating unit, and ResMLP employing residual connection.
5.2. Experimental Results of DiagnosticMLP Compared with Attention-Based Models
Table 4 presents a performance comparison of the proposed model, DiagnosticMLP, against attention-based benchmarking models applied to various medical diagnostic tasks. The first transformer is a standard encoder used with typical self-attention (SA) [55], while in the other transformer we implemented external attention (EA) [56] to enrich and justify our study. As can be seen, the DiagnosticMLP model markedly outperforms the transformer models with both self-attention and external attention in terms of accuracy and F1 score across all categories. Specifically, for kidney disorders, DiagnosticMLP achieves an accuracy of 95.82% and an F1 score of 95.21%, significantly higher than its counterparts. In abdomen disorders, the superiority of DiagnosticMLP is even more pronounced with accuracy and F1 scores near the 95% mark, while the transformers lag behind, not crossing the midway threshold of 50%. This suggests that DiagnosticMLP is particularly adept at capturing the relevant patterns for this category of disorders. For chest disorders, DiagnosticMLP again leads in accuracy and F1 score, but the transformers show competitive AUC scores, especially the transformer with external attention, suggesting that while DiagnosticMLP is more accurate, the transformers may be better at ranking the positive cases higher than the negative ones. In the more specific and serious conditions of kidney cancer and chest cancer, DiagnosticMLP’s performance remains superior in accuracy and F1 score. Notably, in kidney cancer, its AUC score also surpasses the other models, indicating its robustness in distinguishing between the positive and negative cases effectively. The details of performance during training and validation of both attention-reliant architectures are shown in Figure 6. These graphs provide insights into the models’ learning behaviors, with the EA transformer generally showing more stability and better generalization across the tasks than SA. However, both have less performance results than DiagnosticMLP presented earlier in Figure 3. The DiagnosticMLP model demonstrates exceptional performance in terms of accuracy upgrading and loss reduction across different CT medical imaging diagnostic tasks, suggesting that its architecture is particularly well suited for these applications.
Table 4.
Experimental results from the proposed model (DiagnosticMLP) and benchmarking with attention-based models for CT medical imaging classification.
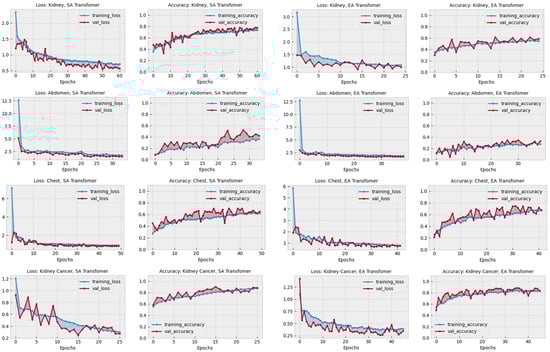
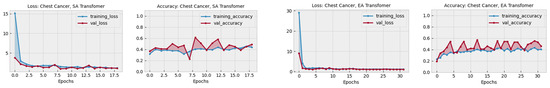
Figure 6.
Performance in terms of loss and accuracy during training and validation of different attention-reliant architectures: self-attention (SA) and external attention (EA) models on chest, kidney, abdominal disorders, and cancer detection. These models were used as part of the benchmarking experiments with the proposed model, DiagnosticMLP, where its performance during training and validation is shown in Figure 3.
To gain a clearer understanding and establish connections between the previously discussed outcomes, Figure 7 and Figure 8 provide a detailed comparative evaluation of the DiagnosticMLP model against the other benchmarking models: MLP-reliant models (Figure 7) and attention-reliant transformers (Figure 8) for various CT image classification tasks.
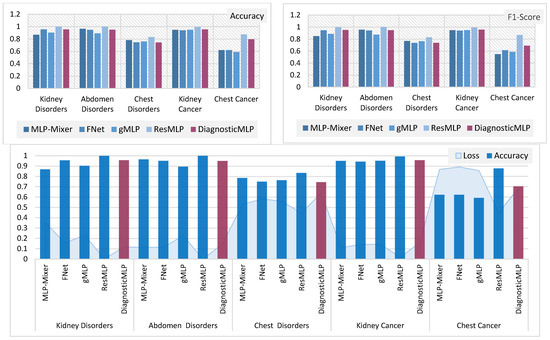
Figure 7.
Comparative analysis of MLP-reliant models with the proposed model, DiagnosticMLP, in CT image classification: evaluating accuracy, F1-score, and loss across different medical conditions.
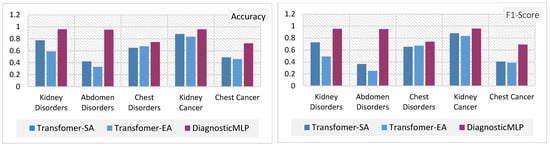

Figure 8.
Comparative analysis of attention-reliant models with the proposed model, DiagnosticMLP, in CT image classification: evaluating accuracy, F1-score, and loss across different medical conditions.
The DiagnosticMLP model excels in accuracy across all examined datasets, outperforming the MLP-Mixer, FNet, and gMLP models (Figure 7). While the DiagnosticMLP model does not surpass the ResMLP, it remains a strong competitor. With respect to loss metrics, the DiagnosticMLP model impresses with its lower loss figures in kidney and abdomen disorder classifications, indicating an effective fit to the data, potentially attributed to its use of Fourier Transforms and spatial gating techniques. Conversely, in the more challenging classifications of chest disorders and cancers, the DiagnosticMLP model exhibits higher loss values, suggesting areas where the model may require further refinement to accurately parse the complexities of these conditions. Furthermore, when examining DiagnosticMLP against attention-based models (Figure 8) using accuracy and F-score which assesses a model’s precision and recall, the DiagnosticMLP model demonstrates superior outcomes for all conditions in all datasets. The proposed model shows lower loss values than attention-reliant benchmarks in all datasets. Such performance indicates that the model not only predicts with high accuracy but also strikes an important balance in minimizing both false positives and false negatives, which is vital for medical diagnostic applications. In terms of loss versus accuracy, the DiagnosticMLP model exhibits notable superiority, showcasing its strong capability in this specialized area.
6. Ablation Study
The ablation study was carried out to assess the viability of different structural designs in DiagnosticMLP and to confirm the effectiveness of various methodical approaches. Table 5 presents the findings. This ablation study was conducted using images of chest cancer. The choice of a chest cancer image dataset was made to eliminate bias, given that it is among the most difficult datasets in this research. The initial phase of the ablation study examined the impact of employing class weighting as opposed to not using it on skewed CT datasets. We utilized the dataset comprising chest cancer images, which indicated enhanced model performance when training acknowledged class imbalances. The latter phase explored training results with and without dataset augmentation, comparing three different augmentation strategies as detailed in the accompanying table. Figure 9 illustrates that the most effective accuracy was achieved using a balanced augmentation approach (Aug3), which included flipping, zooming, contrasting, cropping, and brightening. Despite high accuracy with no augmentation, we opted against it to avoid overfitting. Crucially, our analysis of patch size variations (4 vs. 8) and differing numbers of MLP blocks (4, 6, and 8) revealed that the optimal architecture comprised a patch size of 8 and 4 MLP blocks, as shown in Figure 10. Consequently, all the experimental works and the results presented in this paper were carried out using class weighting, the Aug3 augmentation layer, and an architecture of 4 MLP blocks with 192 patches (8 × 8 × 3 channels).
Table 5.
Results from the ablation study using various design components of the DiagnosticMLP model and utilizing the computed tomography dataset of chest cancer.
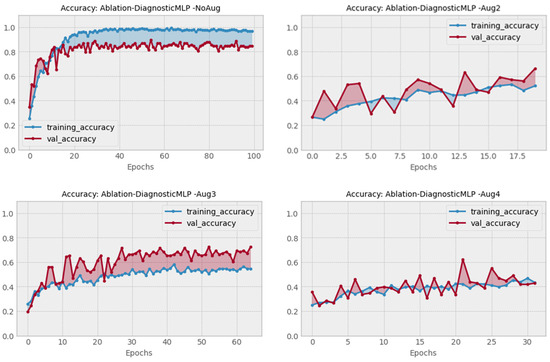
Figure 9.
Performance of DiagnosticMLP using none versus three augmentation schemes in the ablation study.
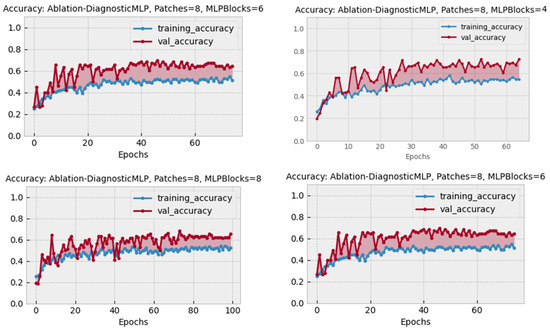
Figure 10.
Performance of DiagnosticMLP using different architectural designs in the ablation study.
7. Model Highlights and Challenges
After presenting the results obtained by DiagnosticMLP as a no-attention architecture compared with attention-reliant architectures, this section presents further highlights of the model.
- DiagnosticMLP utilizes an MLP-driven approach, which circumvents the computational demands of attention-based mechanisms. It incorporates Fourier Transforms for global information capture and spatial gating units for local feature emphasis.
- The model employs a sophisticated methodology and ablation study for augmentation and patching strategy at the input level and uses multiple MLP blocks for extracting hierarchical features and spatial relationships.
- DiagnosticMLP is shown to converge efficiently with competitive accuracy, F1 scores, and AUC metrics, especially in datasets featuring kidney and abdomen disorders. It demonstrates excellent generalization capabilities across various CT image datasets, outperforming several attention-based models in accuracy and loss metrics.
While DiagnosticMLP represents an advancement in the field of medical imaging, particularly in CT image analysis, it also faces several challenges as follows.
- DiagnosticMLP requires extensive training on diverse datasets to ensure robustness and generalizability.
- Differences in equipment, imaging protocols, and patient-specific factors in the datasets can affect the model’s performance, such as with a chest cancer dataset.
- DiagnosticMLP demands significant computational resources for training and inference.
- There are issues regarding the interpretability of the DiagnosticMLP model’s decisions, which is vital for clinician trust and understanding.
- The model shows higher loss values in more complex classifications like chest disorders and cancers, indicating the need for further refinement in these areas.
8. Conclusions and Future Work
The exploration of no-attention architectures in the realm of CT image classification, as detailed in this paper, underscores a significant shift in medical imaging analysis. The proposed DiagnosticMLP model demonstrated that it is possible to achieve high accuracy in medical diagnostics without the computational expense of attention mechanisms. Through rigorous comparisons across various datasets, DiagnosticMLP not only showcased competitive accuracy but also maintained consistently low loss rates. Its performance was particularly notable in the realms of kidney and abdomen disorders/tumor detection, where the model’s precision could have profound implications for early diagnosis and treatment planning. DiagnosticMLP seems to offer a strong balance between loss minimization and accuracy maximization, making it a competitive model among the MLP-driven architectures for CT analysis. It may not outperform all models in every metric, but it does show that it can reach a comparable level of performance, which is crucial for practical applications in medical diagnostics.
Future investigations could expand on the foundation laid by this study in several directions. First, further research can be conducted to improve the model’s performance in complex classifications, such as chest disorders and cancers, by refining the architecture or incorporating additional relevant features, and increasing the diversity and volume of datasets. Second, comparative studies of DiagnosticMLP with other imaging modalities like MRI or ultrasound are suggested to assess its versatility and adaptability across different types of medical imaging. Third, since interpretability remains a pivotal aspect of AI applications in medicine, future models could incorporate explainability frameworks to elucidate the decision-making process of the no-attention mechanisms. The potential for DiagnosticMLP to revolutionize medical imaging is immense, and continued innovation on this path could significantly advance the field of medical AI.
Funding
This research received no external funding.
Data Availability Statement
In the interest of fostering reproducibility and furthering research, the code for all models used in our study has been made available in an open-source GitHub repository for use by the broader research community: https://github.com/SalhaAlzahrani/DiagnosticMLP, accessed on 26 February 2024.
Acknowledgments
The researchers would like to acknowledge the Deanship of Graduate Studies and Scientific Research, Taif University, Saudi Arabia, for funding this work.
Conflicts of Interest
The authors declare no conflicts of interest.
References
- Buzug, T.M. Computed Tomography. In Springer Handbook of Medical Technology; Kramme, R., Hoffmann, K.-P., Pozos, R.S., Eds.; Springer: Berlin/Heidelberg, Germany, 2011; pp. 311–342. [Google Scholar]
- Hosny, A.; Parmar, C.; Quackenbush, J.; Schwartz, L.H.; Aerts, H. Artificial intelligence in radiology. Nat. Rev. Cancer 2018, 18, 500–510. [Google Scholar] [CrossRef]
- Seeram, E. Artificial Intelligence in Medical Imaging: An Overview. In X-Ray Imaging Systems for Biomedical Engineering Technology: An Essential Guide; Springer International Publishing: Cham, Switzerland, 2023; pp. 119–131. [Google Scholar]
- Yan, C.; Wang, L.; Lin, J.; Xu, J.; Zhang, T.; Qi, J.; Li, X.; Ni, W.; Wu, G.; Huang, J.; et al. A fully automatic artificial intelligence-based CT image analysis system for accurate detection, diagnosis, and quantitative severity evaluation of pulmonary tuberculosis. Eur. Radiol. 2022, 32, 2188–2199. [Google Scholar] [CrossRef]
- Liu, F.; Tang, J.; Ma, J.; Wang, C.; Ha, Q.; Yu, Y.; Zhou, Z. The application of artificial intelligence to chest medical image analysis. Intell. Med. 2021, 1, 104–117. [Google Scholar] [CrossRef]
- Ardila, D.; Kiraly, A.P.; Bharadwaj, S.; Choi, B.; Reicher, J.J.; Peng, L.; Tse, D.; Etemadi, M.; Ye, W.; Corrado, G.; et al. End-to-end lung cancer screening with three-dimensional deep learning on low-dose chest computed tomography. Nat. Med. 2019, 25, 954–961. [Google Scholar] [CrossRef]
- Amin, J.; Sharif, M.; Haldorai, A.; Yasmin, M.; Nayak, R.S. Brain tumor detection and classification using machine learning: A comprehensive survey. Complex Intell. Syst. 2022, 8, 3161–3183. [Google Scholar] [CrossRef]
- Kumar, Y.; Koul, A.; Singla, R.; Ijaz, M.F. Artificial intelligence in disease diagnosis: A systematic literature review, synthesizing framework and future research agenda. J. Ambient. Intell. Humaniz. Comput. 2022, 14, 8459–8486. [Google Scholar] [CrossRef] [PubMed]
- Ibrahim, A.; Mohamed, H.K.; Maher, A.; Zhang, B.C. A Survey on Human Cancer Categorization Based on Deep Learning. Front. Artif. Intell. 2022, 5, 884749. [Google Scholar] [CrossRef] [PubMed]
- Nawaz, M.; Uvaliyev, A.; Bibi, K.; Wei, H.; Abaxi, S.M.D.; Masood, A.; Shi, P.L.; Ho, H.P.; Yuan, W. Unraveling the complexity of Optical Coherence Tomography image segmentation using machine and deep learning techniques: A review. Comput. Med. Imaging Graph. 2023, 108, 102269. [Google Scholar] [CrossRef]
- Noronha, S.S.; Mehta, M.A.; Garg, D.; Kotecha, K.; Abraham, A. Deep Learning-Based Dermatological Condition Detection: A Systematic Review with Recent Methods, Datasets, Challenges, and Future Directions. IEEE Access 2023, 11, 140348–140381. [Google Scholar] [CrossRef]
- Bao, Q.W.; Han, H.; Huang, L.; Muzahid, A.A.M. A Convolutional Neural Network Based on Soft Attention Mechanism and Multi-Scale Fusion for Skin Cancer Classification. Int. J. Pattern Recognit. Artif. Intell. 2023, 37, 2356024. [Google Scholar] [CrossRef]
- Surati, S.; Trivedi, H.; Shrimali, B.; Bhatt, C.; Travieso-González, C.M. An Enhanced Diagnosis of Monkeypox Disease Using Deep Learning and a Novel Attention Model Senet on Diversified Dataset. Multimodal Technol. Interact. 2023, 7, 75. [Google Scholar] [CrossRef]
- Liang, S.; Tian, S.W.; Yu, L.; Kang, X.J. Improved U-Net based on contour attention for efficient segmentation of skin lesion. Multimed. Tools Appl. 2023, 1–21. [Google Scholar] [CrossRef]
- To, H.D.; Nguyen, H.G.; Le, H.T.T.; Le, H.M.; Quan, T.T. MetaAttention model: A new approach for skin lesion diagnosis using AB features and attention mechanism. Biomed. Phys. Eng. Express 2023, 9, 045008. [Google Scholar] [CrossRef] [PubMed]
- Omeroglu, A.N.; Mohammed, H.M.A.; Oral, E.A.; Aydin, S. A novel soft attention-based multi-modal deep learning framework for multi-label skin lesion classification. Eng. Appl. Artif. Intell. 2023, 120, 105897. [Google Scholar] [CrossRef]
- Damineni, D.H.; Sekharamantry, P.K.; Badugu, R. An Adaptable Model for Medical Image Classification Using the Streamlined Attention Mechanism. Int. J. Online Biomed. Eng. 2023, 19, 93–110. [Google Scholar] [CrossRef]
- Zhuang, J.X.; Cai, J.B.; Zhang, J.G.; Zheng, W.S.; Wang, R.X. Class attention to regions of lesion for imbalanced medical image recognition. Neurocomputing 2023, 555, 126577. [Google Scholar] [CrossRef]
- Liu, R.; Li, Y.; Tao, L.; Liang, D.; Zheng, H.-T. Are we ready for a new paradigm shift? A survey on visual deep MLP. Patterns 2022, 3, 100520. [Google Scholar] [CrossRef]
- Pan, Z.; Zhuang, B.; He, H.; Liu, J.; Cai, J. Less is More: Pay Less Attention in Vision Transformers. arXiv 2021, arXiv:2105.14217. [Google Scholar] [CrossRef]
- Melas-Kyriazi, L. Do You Even Need Attention? A Stack of Feed-Forward Layers Does Surprisingly Well on ImageNet. arXiv 2021, arXiv:2105.02723. [Google Scholar] [CrossRef]
- Tay, Y.; Bahri, D.; Metzler, D.; Juan, D.-C.; Zhao, Z.; Zheng, C. Synthesizer: Rethinking Self-Attention in Transformer Models. arXiv 2020, arXiv:2005.00743. [Google Scholar] [CrossRef]
- Guo, M.-H.; Liu, Z.-N.; Mu, T.-J.; Liang, D.; Martin, R.R.; Hu, S.-M. Can Attention Enable MLPs To Catch Up with CNNs? arXiv 2021, arXiv:2105.15078. [Google Scholar] [CrossRef]
- Tolstikhin, I.; Houlsby, N.; Kolesnikov, A.; Beyer, L.; Zhai, X.; Unterthiner, T.; Yung, J.; Steiner, A.; Keysers, D.; Uszkoreit, J.; et al. MLP-Mixer: An all-MLP Architecture for Vision. arXiv 2021, arXiv:2105.01601. [Google Scholar] [CrossRef]
- Zhang, H.; Dong, Z.; Li, B.; He, S. Multi-Scale MLP-Mixer for image classification. Knowl.-Based Syst. 2022, 258, 109792. [Google Scholar] [CrossRef]
- Liu, H.; Dai, Z.; So, D.; Le, Q.V. Pay Attention to MLPs. arXiv 2021, arXiv:2105.08050. [Google Scholar]
- Touvron, H.; Bojanowski, P.; Caron, M.; Cord, M.; El-Nouby, A.; Grave, E.; Izacard, G.; Joulin, A.; Synnaeve, G.; Verbeek, J.; et al. ResMLP: Feedforward Networks for Image Classification with Data-Efficient Training. IEEE Trans. Pattern Anal. Mach. Intell. 2023, 45, 5314–5321. [Google Scholar] [CrossRef] [PubMed]
- Li, J.; Hassani, A.; Walton, S.; Shi, H. ConvMLP: Hierarchical Convolutional MLPs for Vision. arXiv 2021, arXiv:2109.04454. [Google Scholar] [CrossRef]
- Ren, B.; Tang, H.; Sebe, N. Cascaded Cross MLP-Mixer GANs for Cross-View Image Translation. In Proceedings of the British Machine Vision Conference, Virtual, 22–25 November 2021. [Google Scholar]
- Yu, T.; Li, X.; Cai, Y.; Sun, M.; Li, P. S2-MLP: Spatial-Shift MLP Architecture for Vision. In Proceedings of the 2022 IEEE/CVF Winter Conference on Applications of Computer Vision (WACV), Tel Aviv, Israel, 3–8 January 2022; pp. 3615–3624. [Google Scholar]
- Choe, J.; Park, C.; Rameau, F.; Park, J.; Kweon, I.S. PointMixer: MLP-Mixer for Point Cloud Understanding. In Proceedings of the Computer Vision—ECCV 2022, Tel Aviv, Israel, 23–27 October 2022; pp. 620–640. [Google Scholar]
- Wang, X.; Cai, Z.; Peng, C. X-MLP: A Patch Embedding-Free MLP Architecture for Vision. arXiv 2023, arXiv:2307.00592. [Google Scholar] [CrossRef]
- Wang, G.; Zhao, Y.; Tang, C.; Luo, C.; Zeng, W. When Shift Operation Meets Vision Transformer: An Extremely Simple Alternative to Attention Mechanism. arXiv 2022. [Google Scholar] [CrossRef]
- Lee-Thorp, J.; Ainslie, J.; Eckstein, I.; Ontanon, S. FNet: Mixing Tokens with Fourier Transforms. arXiv 2021, arXiv:2105.03824. [Google Scholar]
- Rao, Y.; Zhao, W.; Zhu, Z.; Lu, J.; Zhou, J. Global Filter Networks for Image Classification. arXiv 2021, arXiv:2107.00645. [Google Scholar] [CrossRef]
- Yu, T.; Li, X.; Cai, Y.; Sun, M.; Li, P. Rethinking Token-Mixing MLP for MLP-based Vision Backbone. arXiv 2021, arXiv:2106.14882. [Google Scholar] [CrossRef]
- Hou, Q.; Jiang, Z.; Yuan, L.; Cheng, M.-M.; Yan, S.; Feng, J. Vision Permutator: A Permutable MLP-Like Architecture for Visual Recognition. arXiv 2021, arXiv:2106.12368. [Google Scholar] [CrossRef]
- Lou, Y.; Xue, F.; Zheng, Z.; You, Y. Cross-token Modeling with Conditional Computation. arXiv 2021, arXiv:2109.02008. [Google Scholar] [CrossRef]
- Song, Y.; Sun, W. PC-MLP: Model-based Reinforcement Learning with Policy Cover Guided Exploration. arXiv 2021, arXiv:2107.07410. [Google Scholar] [CrossRef]
- Tu, Z.; Talebi, H.; Zhang, H.; Yang, F.; Milanfar, P.; Bovik, A.; Li, Y. MAXIM: Multi-Axis MLP for Image Processing. arXiv 2022, arXiv:2201.02973. [Google Scholar] [CrossRef]
- Chen, S.; Xie, E.; Ge, C.; Chen, R.; Liang, D.; Luo, P. CycleMLP: A MLP-like Architecture for Dense Prediction. arXiv 2021, arXiv:2107.10224. [Google Scholar] [CrossRef]
- Tatsunami, Y.; Taki, M. RaftMLP: How Much Can Be Done Without Attention and with Less Spatial Locality? arXiv 2021, arXiv:2108.04384. [Google Scholar] [CrossRef]
- Guo, J.; Tang, Y.; Han, K.; Chen, X.; Wu, H.; Xu, C.; Xu, C.; Wang, Y. Hire-MLP: Vision MLP via Hierarchical Rearrangement. arXiv 2021, arXiv:2108.13341. [Google Scholar] [CrossRef]
- Cheng, Z.; Wang, L. Dynamic hierarchical multi-scale fusion network with axial MLP for medical image segmentation. Sci. Rep. 2023, 13, 6342. [Google Scholar] [CrossRef]
- Schmidt-Mengin, M.; Ricigliano, V.A.G.; Bodini, B.; Morena, E.; Colombi, A.; Hamzaoui, M.; Yazdan Panah, A.; Stankoff, B.; Colliot, O. Axial multi-layer perceptron architecture for automatic segmentation of choroid plexus in multiple sclerosis. In Proceedings of the Medical Imaging 2022: Image Processing, San Diego, CA, USA, 1 April 2022; p. 1203208. [Google Scholar]
- An, L.; Wang, L.; Li, Y. HEA-Net: Attention and MLP Hybrid Encoder Architecture for Medical Image Segmentation. Sensors 2022, 22, 7024. [Google Scholar] [CrossRef]
- Valanarasu, J.M.J.; Patel, V.M. UNeXt: MLP-based Rapid Medical Image Segmentation Network. arXiv 2022, arXiv:2203.04967. [Google Scholar] [CrossRef]
- Gao, P.; Lu, J.; Li, H.; Mottaghi, R.; Kembhavi, A. Container: Context Aggregation Network. arXiv 2021, arXiv:2106.01401. [Google Scholar] [CrossRef]
- Hu, Y.; You, H.; Wang, Z.; Wang, Z.; Zhou, E.; Gao, Y. Graph-MLP: Node Classification without Message Passing in Graph. arXiv 2021, arXiv:2106.04051. [Google Scholar] [CrossRef]
- Bouazizi, A.; Holzbock, A.; Kressel, U.; Dietmayer, K.; Belagiannis, V. MotionMixer: MLP-based 3D Human Body Pose Forecasting. arXiv 2022, arXiv:2207.00499. [Google Scholar] [CrossRef]
- Islam, M.N.; Hasan, M.; Hossain, M.K.; Alam, M.G.R.; Uddin, M.Z.; Soylu, A. Vision transformer and explainable transfer learning models for auto detection of kidney cyst, stone and tumor from CT-radiography. Sci. Rep. 2022, 12, 11440. [Google Scholar] [CrossRef] [PubMed]
- TrainingData.pro. Computed Tomography (CT) of the Abdomen. Available online: https://www.kaggle.com/datasets/trainingdatapro/computed-tomography-ct-of-the-abdomen (accessed on 10 November 2023).
- Sait, U.; Lal, K.G.; Prajapati, S.; Bhaumik, R.; Kumar, T.; Sanjana, S.; Bhalla, K. Curated Dataset for COVID-19 Posterior-Anterior Chest Radiography Images (X-Rays). Mendeley Data 2020, 1. [Google Scholar] [CrossRef]
- Basandrai, A. Medical Scan Classification Dataset. Available online: https://www.kaggle.com/datasets/arjunbasandrai/medical-scan-classification-dataset (accessed on 10 November 2023).
- Vaswani, A.; Shazeer, N.; Parmar, N.; Uszkoreit, J.; Jones, L.; Gomez, A.N.; Kaiser, L.; Polosukhin, I. Attention Is All You Need. arXiv 2017, arXiv:1706.03762. [Google Scholar] [CrossRef]
- Guo, M.H.; Liu, Z.N.; Mu, T.J.; Hu, S.M. Beyond Self-Attention: External Attention Using Two Linear Layers for Visual Tasks. IEEE Trans. Pattern Anal. Mach. Intell. 2023, 45, 5436–5447. [Google Scholar] [CrossRef]
Disclaimer/Publisher’s Note: The statements, opinions and data contained in all publications are solely those of the individual author(s) and contributor(s) and not of MDPI and/or the editor(s). MDPI and/or the editor(s) disclaim responsibility for any injury to people or property resulting from any ideas, methods, instructions or products referred to in the content. |
© 2024 by the author. Licensee MDPI, Basel, Switzerland. This article is an open access article distributed under the terms and conditions of the Creative Commons Attribution (CC BY) license (https://creativecommons.org/licenses/by/4.0/).