Article

Optimizing PV Sources and Shunt Capacitors for Energy Efficiency Improvement in Distribution Systems Using Subtraction-Average Algorithm

by
Idris H. Smaili
1,*,
Dhaifallah R. Almalawi
2,
Abdullah M. Shaheen
3,* and
Hany S. E. Mansour
4
1
Electrical Engineering Department, College of Engineering, Jazan University, Jazan 45142, Saudi Arabia
2
Department of Physics, College of Science, Taif University, Taif 21944, Saudi Arabia
3
Department of Electrical Engineering, Faculty of Engineering, Suez University, Suez 43533, Egypt
4
Electrical Engineering Department, Suez Canal University, Ismailia 41522, Egypt
*
Authors to whom correspondence should be addressed.
Mathematics 2024, 12(5), 625; https://doi.org/10.3390/math12050625
Submission received: 24 December 2023 / Revised: 5 February 2024 / Accepted: 18 February 2024 / Published: 20 February 2024

Abstract

:
This work presents an optimal methodology based on an augmented, improved, subtraction-average-based technique (ASABT) which is developed to minimize the energy-dissipated losses that occur during electrical power supply. It includes a way of collaborative learning that utilizes the most effective response with the goal of improving the ability to search. Two different scenarios are investigated. First, the suggested ASABT is used considering the shunt capacitors only to minimize the power losses. Second, simultaneous placement and sizing of both PV units and capacitors are handled. Applications of the suggested ASAB methodology are performed on two distribution systems. First, a practical Egyptian distribution system is considered. The results of the simulation show that the suggested ASABT has a significant 56.4% decrease in power losses over the original scenario using the capacitors only. By incorporating PV units in addition to the capacitors, the energy losses are reduced from 26,227.31 to 10,554 kW/day with a high reduction of 59.75% and 4.26% compared to the initial case and the SABT alone, respectively. Also, the emissions produced from the substation are greatly reduced from 110,823.88 kgCO2 to 79,189 kgCO2, with a reduction of 28.54% compared to the initial case. Second, the standard IEEE 69-node system is added to the application. Comparable results indicate that ASABT significantly reduces power losses (5.61%) as compared to SABT and enhances the minimum voltage (2.38%) with a substantial reduction in energy losses (64.07%) compared to the initial case. For both investigated systems, the proposed ASABT outcomes are compared with the Coati optimization algorithm, the Osprey optimization algorithm (OOA), the dragonfly algorithm (DA), and SABT methods; the proposed ASABT shows superior outcomes, especially in the standard deviation of the obtained losses.

1. Introduction

The integration of renewable energy sources, such as photovoltaic (PV) distributed generation, has gained significant attention in recent years due to its potential to reduce greenhouse gas emissions and enhance energy sustainability. In parallel, the optimization of power distribution systems has become crucial in maximizing energy efficiency and minimizing power losses. One effective approach to achieving these objectives is through the optimal placement and sizing of PV distributed generation and reactive power control within the power distribution system [1]. The introduction of efficient optimization algorithms plays a key role in addressing the challenges associated with PV distributed generation and shunt capacitors in power distribution systems. However, existing algorithms often face limitations in terms of accuracy, convergence speed, and robustness [2]. Therefore, there is a need to develop novel optimization techniques that can effectively address these challenges and provide reliable solutions.
PV units are inexpensive to maintain and simple to apply; they have been developed utilizing new materials and processes that opened access to this technology for a wide range of people [3,4]. PV is the most widely used technology for distributed generation because of its high efficiency, excellent cost–benefit ratio, and reduced carbon emissions [5,6]. In [7], an adapted reptile search algorithm is introduced, featuring a fitness–distance balance method and Levy flight motion. The primary focus is on optimizing the operation of distribution networks (DNs) by integrating wind turbines and PV units. The central objective revolves around cost reduction, which includes considerations such as electricity acquisition, costs of PV and wind turbines units, and annual energy losses. In [8], a modified analytical energy technique has been presented for locating PV and wind systems in power systems. Minimization of the power losses and voltage deviations in addition to the maximization of the loadability have been formulated in this study and solved by a particle swarm optimizer (PSO) and a genetic algorithm (GA). Moving to [9], a Gorilla troop’s optimizer (GTO) is employed to address the optimal allocation problem of PV–DGs equipped with distributed static compensators on a 94-bus distribution network. The optimization process encompasses three objective functions: total annual cost, system voltage deviations, and system stability. Additionally, [10] employs a PSO integrated with scenario-based reduction approaches and Monte Carlo simulations for PV and distributed static compensator units on the IEEE 33-bus test network. This study specifically considers various seasonal loadings in its optimization process.
Shunt capacitors are commonly used in power distribution networks to compensate for reactive power and mitigate issues such as voltage drops, power factor deterioration, and line losses [11]. Power flow must be efficiently controlled because of the rising global demand for electricity. The shunt capacitor placement problem in power distribution systems involves determining the optimal locations and sizes for placing shunt capacitors in order to improve system performance and efficiency. However, identifying the most effective locations and sizes for these capacitors is a complex optimization problem that requires the application of advanced optimization algorithms [12,13]. The system’s lagging current is opposed by the leading current that the capacitor injects into it. As a result, system power losses are reduced, and voltage profile, power factor, and system stability are all improved [14]. In reference to meta-heuristic optimization methods, a substantial body of literature examines the reduction in joule loss, voltages profile improvement, and the overall cost. Consequently, an approach known as multi-objective particle swarm optimization (MOPSO) is presented in [15]. Because it requires less computing time, the branch and bound technique is typically chosen for power losses minimization, employing a power-flow simulation. The JAYA optimization technique [16] is suggested for power factor adjustment in another study. In [17], the opposition Cuckoo optimization technique (OCOT) was applied to boost the voltage profile. It should be noted that a number of metaheuristic algorithms, including a genetic algorithm [18], a vortex search algorithm [19], the locust search algorithm [20], a whale optimization algorithm [21], a crow search algorithm [22], and a firefly algorithm [23], were employed in the authors’ earlier attempts to solve the shunt capacitor placement problem in power distribution systems.
Moreover, simultaneous allocations of PV units and shunt capacitors in distribution systems have been considered, where reactive power compensation provides the potential to cut down on energy losses. It offers benefits including increased system stability, increased voltage at distribution nodes, and power factor adjustment, all of which are subject to various operational restrictions [24]. In [25], the slim mold algorithm was utilized to develop an optimal allocation method for PV generators in distribution networks. The objective was to control the tap positions of the distribution voltage regulators (DVRs) and the injected reactive power of PV inverters. The aim was to reduce active and reactive power losses while enhancing voltage quality in the distribution network. The study also investigated the integration of cascaded DVRs with capacitor banks and PV units to regulate voltage levels in medium voltage distribution systems [26]. A quadratic programming algorithm was employed, utilizing a linearized distribution system model. Various PV units and load variation scenarios were considered. In another study [27], different DVR models were examined, incorporating continuous and discrete tapping stages. The network reconfiguration potential of branching switching conditions was considered. A chordal relaxation mixed-integer programming algorithm was employed to minimize power loss or manage bus voltages, considering the binary form of control variables and tap locations. Furthermore, in [28], an artificial rabbits’ optimization algorithm was applied to allocate PV–static synchronous compensators in distribution systems. The objective was either to provide ancillary services or to minimize both daily energy losses and the daily voltage profile under 24 h load variations.
In optimization problems, the ultimate goal is to find the optimal solution, known as the global optimum, which represents the best possible outcome for a given problem. However, it is important to acknowledge that the algorithms employed in the optimization processes may not always guarantee the discovery of the exact ideal solution. As a result, the output obtained from these algorithms is referred to as quasi-optimal, signifying an approximate or near-optimal solution. The term “quasi-optimal” recognizes that the solution may be close to the global optimum [29], but there is uncertainty about its exact equivalence. The inherent challenge lies in the complexity of many optimization problems, which can involve numerous variables, constraints, and intricate mathematical relationships. Algorithms employed for optimization are designed to navigate this complexity and converge towards solutions that minimize or maximize the objective function. However, due to the computational challenges and the vast solution space, achieving the global optimum is not always feasible within reasonable time frames.
The main concept of a recently introduced technique called SABT [30] is to modify population individuals’ positions in the area of search space by subtracting the average of the seeker agents. This method is advantageous since it is simple to use in applications of engineering and requires little adjustment to the parameters. The SABT outcomes were compared with a variety of current methods along with additional contemporary approaches using several benchmarking simulations. The way the traditional SABT operates is by deducting the means of the search results from the population’s distribution in the query region. The main contributions of this study can be summarized as follows:
  • Introduction of ASABT designed to optimize the placement and sizing of shunt capacitors and PV units in medium voltage distribution systems.
  • Application to a real-world Egyptian distribution system, providing practical insights into its effectiveness with validation on a standard IEEE 69-node system, demonstrating its versatility and applicability across different network configurations.
  • Comparison with other algorithms including the Coati optimization algorithm [31], the Osprey optimization algorithm (OOA) [32], and the dragonfly algorithm (DA) [33].
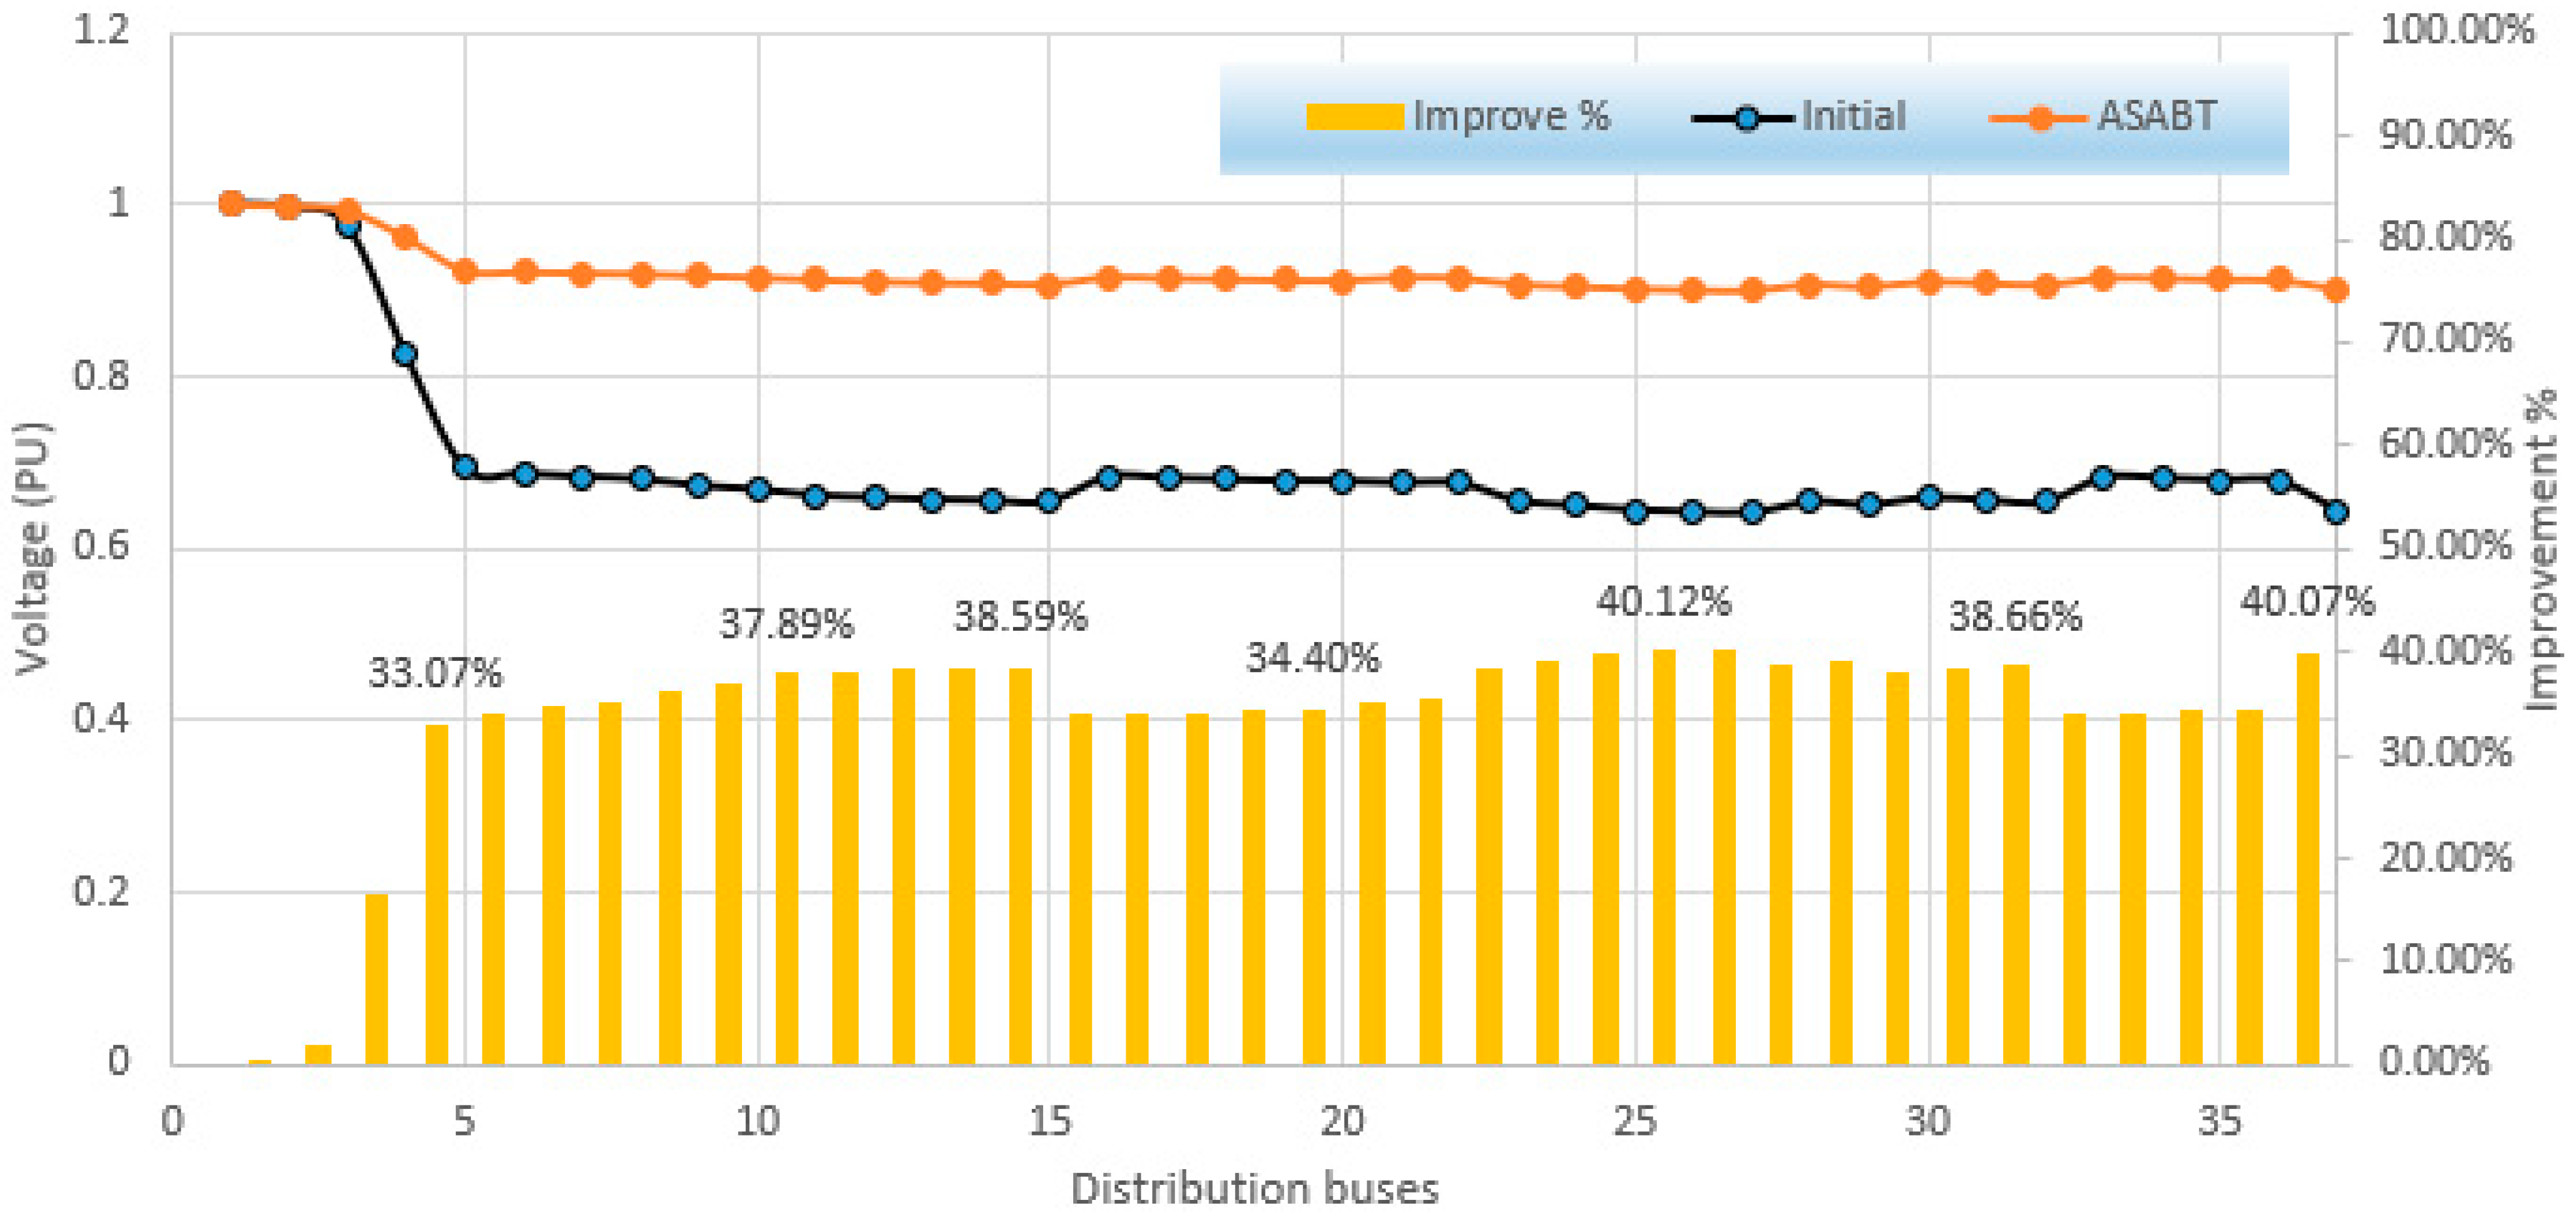
  • Performance enhancement in reducing distribution system losses, surpassing the performance of the original SABT. Additionally, the proposed algorithm leads to a notable increase in voltage levels across the distribution system.

2. Optimizing Model of PV Units and Shunt Capacitors in Distribution Feeders

2.1. Objective Function

The optimization of PV units and shunt capacitors in distribution feeders can minimize energy losses, as shown in Equation (1).
L O S S E n e r g y = H r = 1 N H R P L H R
P L H R = L i n e = 1 N L i n e I L i n e 2 × R L i n e
where LOSSEnergy represents the daily energy losses. HR indicates each hour, while NHR refers to the number of hours (NHR = 24 per day) and PLHR refers to the power losses in each hour. NLine indicates the total number of lines for distribution; ILine denotes the current flowing through each line (Line); RLine stands for each line’s resistance.

2.2. Constraints Regarding the Control Variables

2.2.1. PV Units

PV units can be connected to any bus in the system, and their rating is limited to a maximum value, which can be mathematically modeled in Equations (3) and (4), respectively.
2 < P V U j N b j = 1 : N P V U
0 < P P V U , j P P V U , m a x , j j = 1 : N P V U
where PVUj is the candidate terminal to connect PV units while NPVU is the maximum number of PV units to be considered. PPVU,j and PPVU,max are, respectively, the candidate and maximum sizing of the PV units installed at candidate terminals (PVj).

2.2.2. Shunt Capacitors

In similar way, the shunt capacitors units can be connected to any bus, and their rating is limited to a maximum value as modeled in Equations (5) and (6), respectively.
2 < C A P j N b j = 1 : N C A P
0 < Q C A P , j Q C A p , m a x , j j = 1 : N C A P
where CAPj is the candidate terminal to connect capacitors, while NCAP is the maximum number of candidate shunt capacitors. QCAP,j and QCAP,max are, respectively, the candidate and maximum sizing of the capacitors installed at candidate terminals (CAPj).

2.3. Constraints Regarding the Dependent Variables

Additionally, it is necessary to maintain the operational constraints regarding the dependent variables [34], such as the voltages at each distribution node (Equation (7)), the secure current flow (Equation (8)), and the power flow balance limitations (Equations (9) and 10)):
V k , m i n < V k V k , m a x k = 1 : N b
I L i n e I L i n e , m a x L i n e = 1 : N L i n e
i = 1 N b P d i + P L = P S u b + j = 1 N P V U P P V U , j
i = 1 N b Q d i + Q L = Q S u b + j = 1 N C A P Q C A P j
where Vk,min and Vk,max indicate the voltage nodes’ lowest and highest limits; ILine,max is the maximum thermal capability of a distribution line; PSub and QSub correspond to the total active and reactive power supplied from the substation, respectively; QCAPj is the reactive power injection by capacitors which is located at terminal (j); NCAP refers to the number of installed capacitive devices; Pdi and Qdi represent the real and reactive electricity demand at terminal (i), respectively; Real and reactive systemic losses are denoted by the terms PL and QL, respectfully.

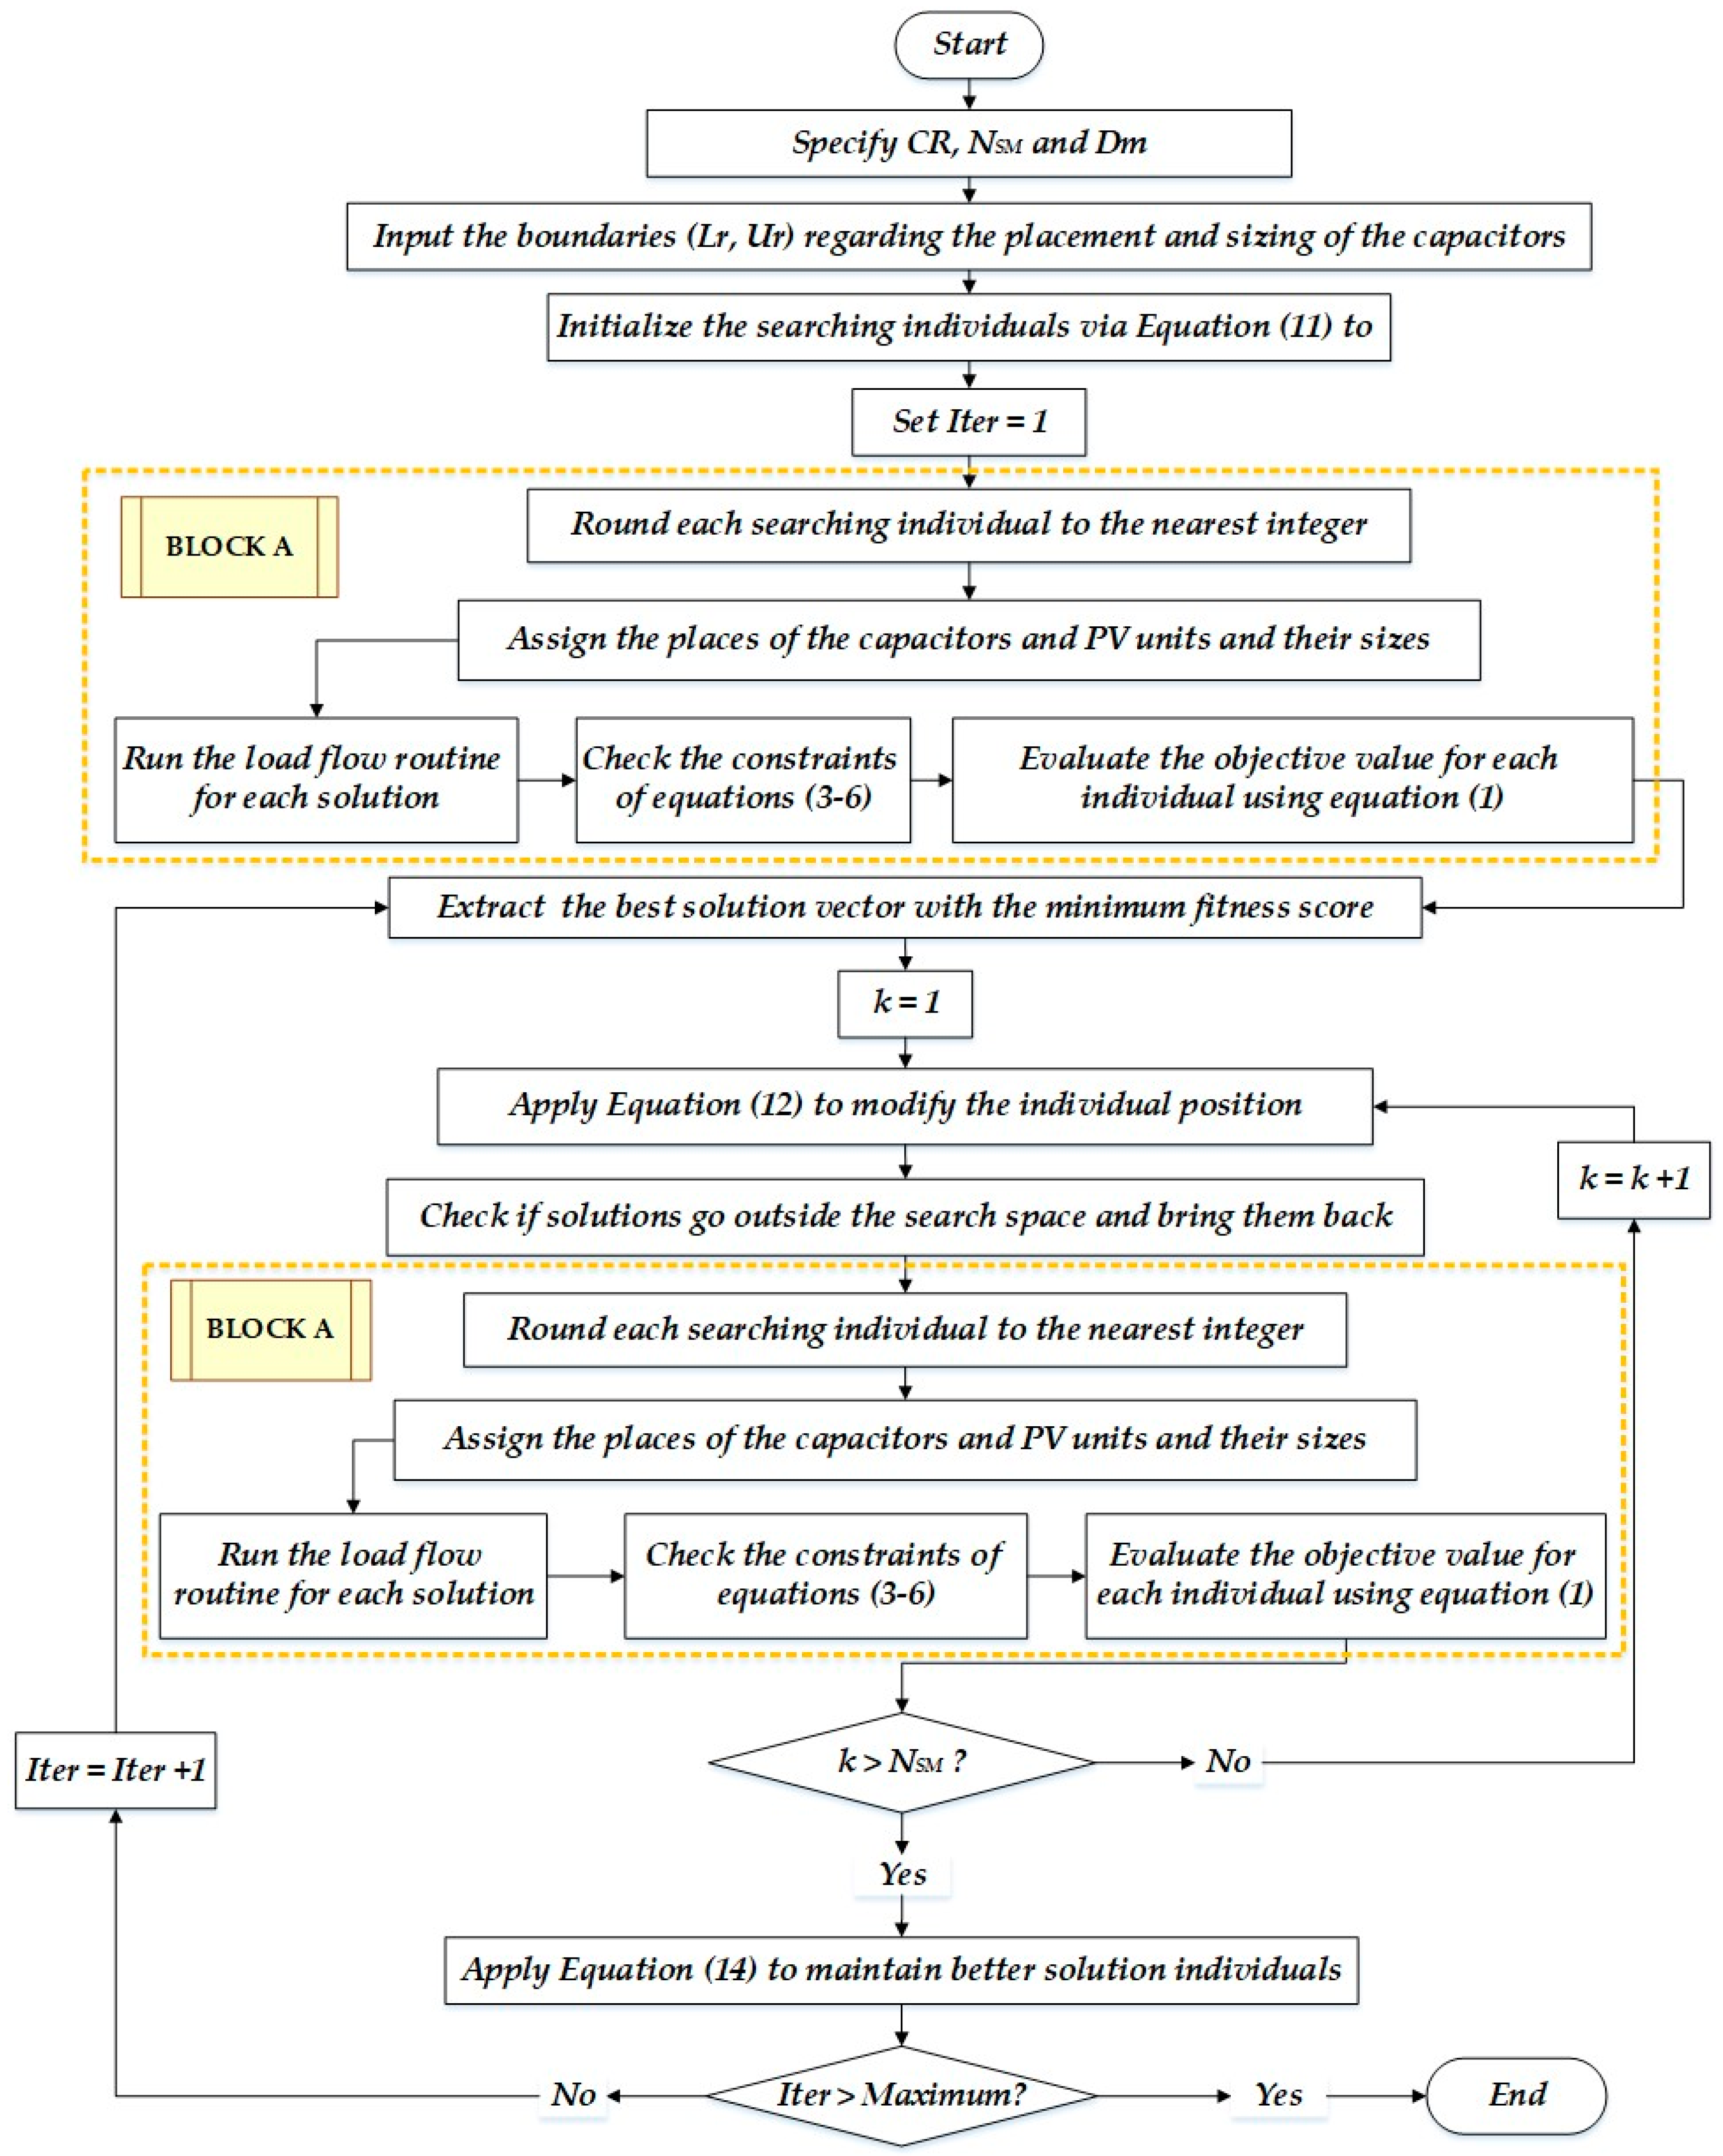
3. ASABT for Optimizing PV Units and Shunt Capacitors in Distribution Feeders

The usual SABT operates by deducting the average of the seeker members’ positions in the field of search space [30]. The location and size of the capacitors in distribution systems taken into account correlates to the dimension which matches the breadth of the region of the area being searched. They have been determined based on where the algorithm looks for solutions, as follows [35]:
S M k = L r k + ( U r k L r k ) × r a n d ( 1 , D m ) i = 1 : N S M , k = 1 : D m
where SMk denotes the seeker member’ position; Lrk and Urk are the boundaries of the location and size of the capacitors in distribution systems, respectively; Dm is the problem dimension which equals to two times of the number of capacitors (NCAP) dedicated for the installation in the system; NSM is the number of the seeker members’ positions in the population.
Each one of the examined options which regards to each seeker seems to provide a workable response to the assessed component. The greatest and least results obtained of the target function identify the most suitable and worst solutions, respectively. The SABT methodology was based on mathematical concepts, including average values, shifts in seeking indicative sites, and the direction of the variance between two objectively quantifiable quantities. The method used by the SABT to calculate the arithmetic average is wholly original because it relies on a certain functional called the “v-subtraction operator” [36]. Therefore, each vector-based response in the SABT group was altered to comply with the following equation.
S M k , n e w = S M k + z k × 1 N s k = 1 N s S M k υ S M i               i f r a n d 0,1 C R         S M B E S T + S M R 1 S M R 2 × w k                                               E l s e                                             ,   k = 1 : N S M
Additionally, Equation (13) depicts the computational formulation of the SABT neighborhood’s dual seeking alternatives’ (SMk and SMi) subtraction technique.
S M k υ S M i = s i g n F i t k ( S M k ) F i t i ( S M i ) S M k υ S M i
Once each choice vector has been upgraded, the related worth of the objective is determined and evaluated. The freshly produced alternative then takes the place of the previous solution if it receives a better objective assessment, in accordance with (14). Additionally, the outlined ASABT incorporates a participatory learning strategy based on the leader’s answer. In this way, the mean result of the v-subtraction operator defines the place of change of each seeking alternative (SMk) within the scope of the searching area. By using this layout, the exploratory aspects are strong and productive.
S M k = S M k , n e w S M k i f   F i t k , n e w ( S M k , n e w ) F i t k ( S M k ) E l s e
However, it is necessary to support the localized looking activity close to the greatest potential region in order to enhance the exploitation searching characteristics. To achieve this, as indicated in Equation (12), the suggested ASABT variation integrates a mechanism for partnership to contribute knowledge that can be learned from the best response vector. To achieve balance between the investigative qualities and the increased exploiting capabilities, as mentioned in Equation (12), a CR of 50% remains in place. The crucial stages of the suggested ASABT are shown in Figure 1. To illustrate how this algorithm works with capacitors and PV units, the proposed ASABT initially generated solutions using Equation (11). On the other side, the solutions are changed through the updating mechanism of the proposed ASABT using Equation (12). The modified solutions are checked regarding the permissible limits, and they are preserved. Both initial and modified solutions are then considered to enter Block A. As shown in this block, each variable in each generated solution is rounded to the nearest integer, where the places and sizes of both devices are represented in integer numbers. Then, each generated solution is assigned to the allocated devices. Therefore, the locations and sizes of the capacitors and PV units are simultaneously specified. These devices are inserted into the system, where the load flow is implemented, and the constraints are checked, and the objective function is estimated.

4. Results and Discussion

The proposed ASABT is tested with two distribution feeders using a practical Egyptian distribution system with 37 nodes and a standard IEEE distribution system with 69 nodes. For both systems, the maximum sizing of the capacitors to be installed is 3600 kVAr and the maximum number of them to be installed is set to be five. For each system, two scenarios are addressed.
  • Scenario 1: optimizing shunt capacitors only to minimize the power losses considering the peak loading condition.
  • Scenario 2: optimizing PV units and shunt capacitors to minimize the energy losses considering the variations in load and PV power productions.
Comparisons with several recent algorithms including Coati [31], OOA [32], and DA [33] are implemented in addition to the proposed ASABT and SABT methods. They are executed 20 different times. For all algorithms, the number of search agents is considered to be 30, while the maximum number of iterations is set to 100.

4.1. First Case of a Practical Egyptian Distribution Feeder

In this section, the proposed methodology is applied for a real Egyptian distribution feeder regarding Minoufia governorate which is called Tala radial distribution system. It has 36 lines for distribution and 37 nodes. A connected one-line diagram using a standard voltage of 11 kV is shown in Figure 2. For the nominal load condition, the sum of the real (kW) and reactive (kVAr) are 4801.9 kW and 2975.9 kVAr, respectively. The permissible range of the operating voltages is [0.9–1.1] PU.

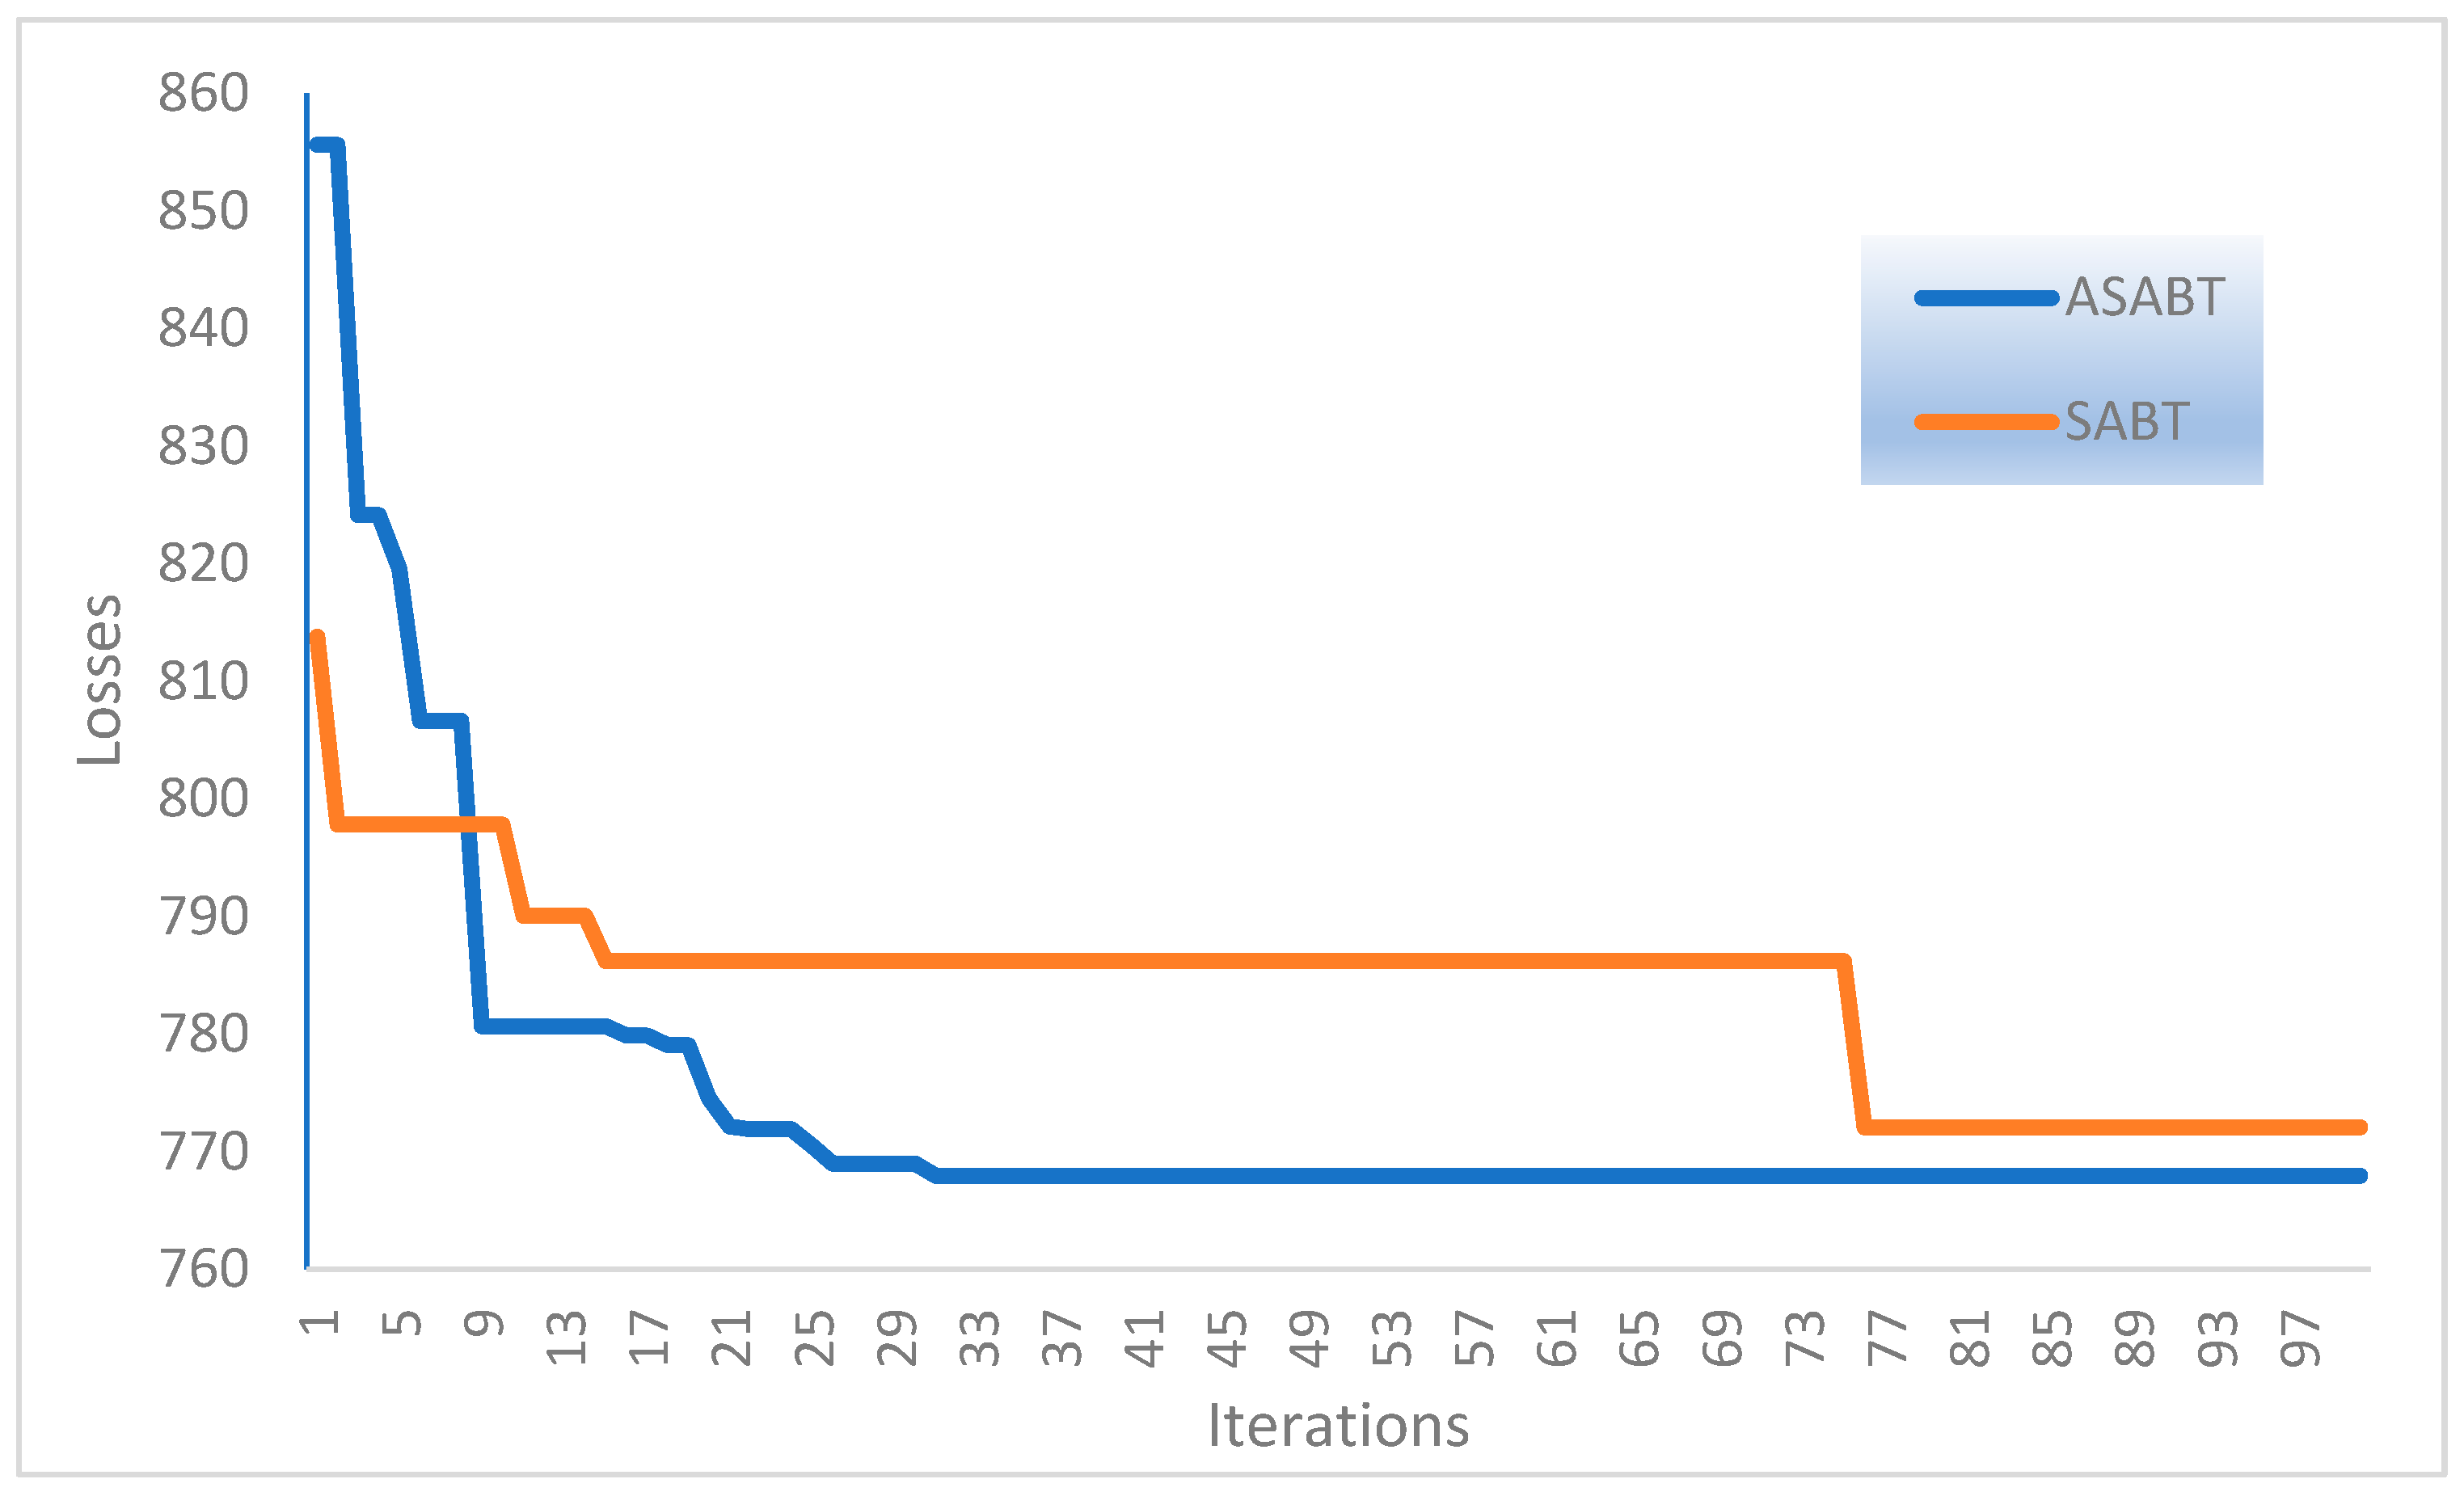
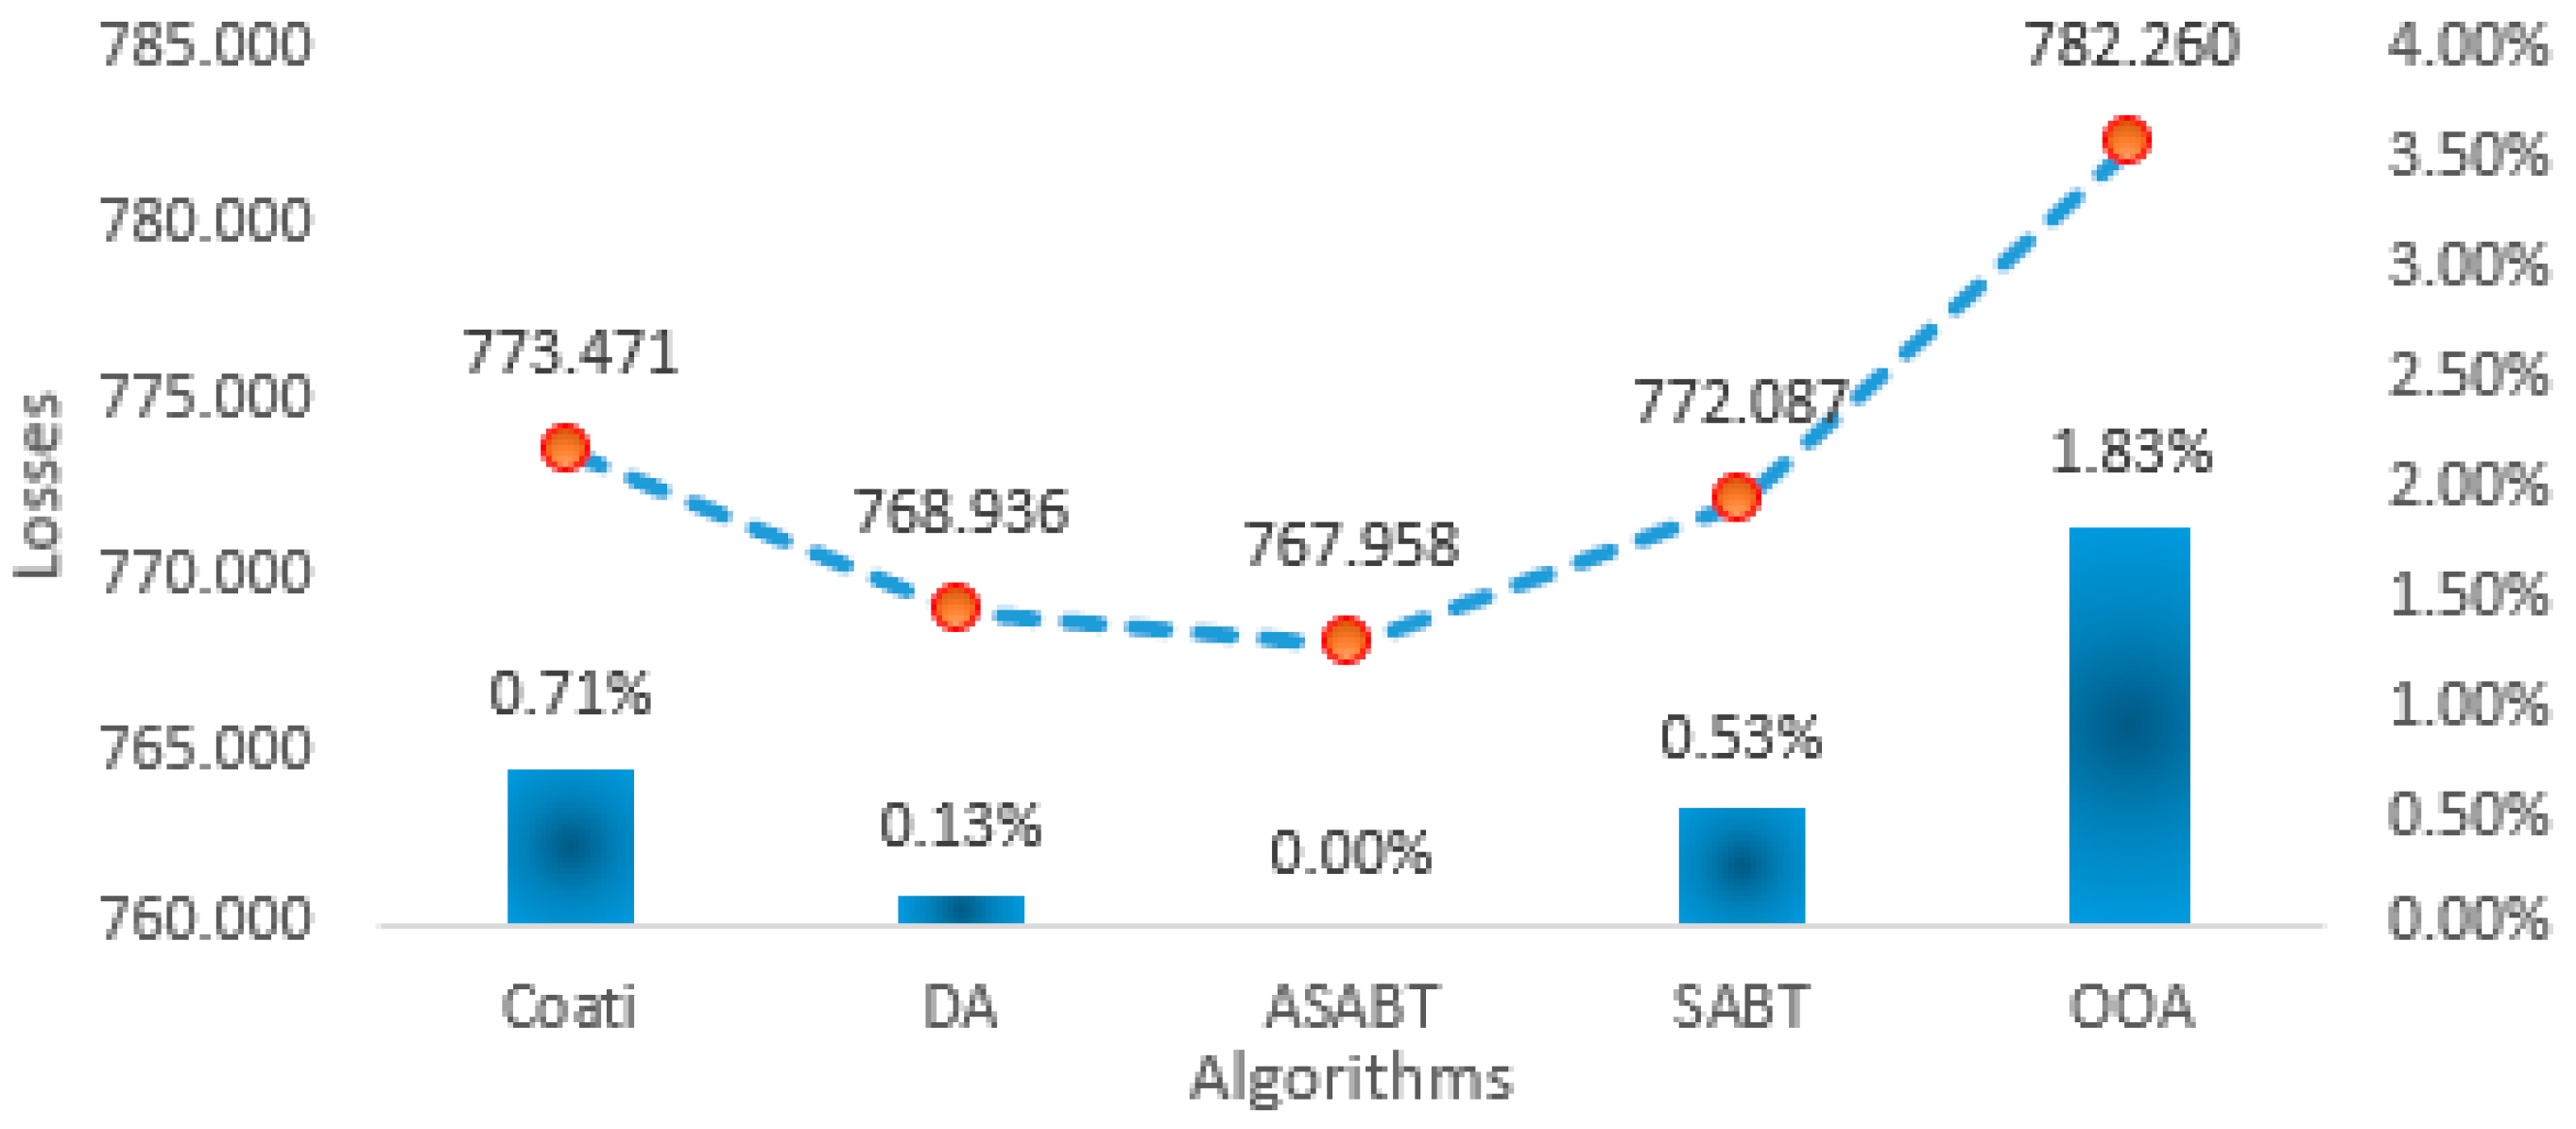
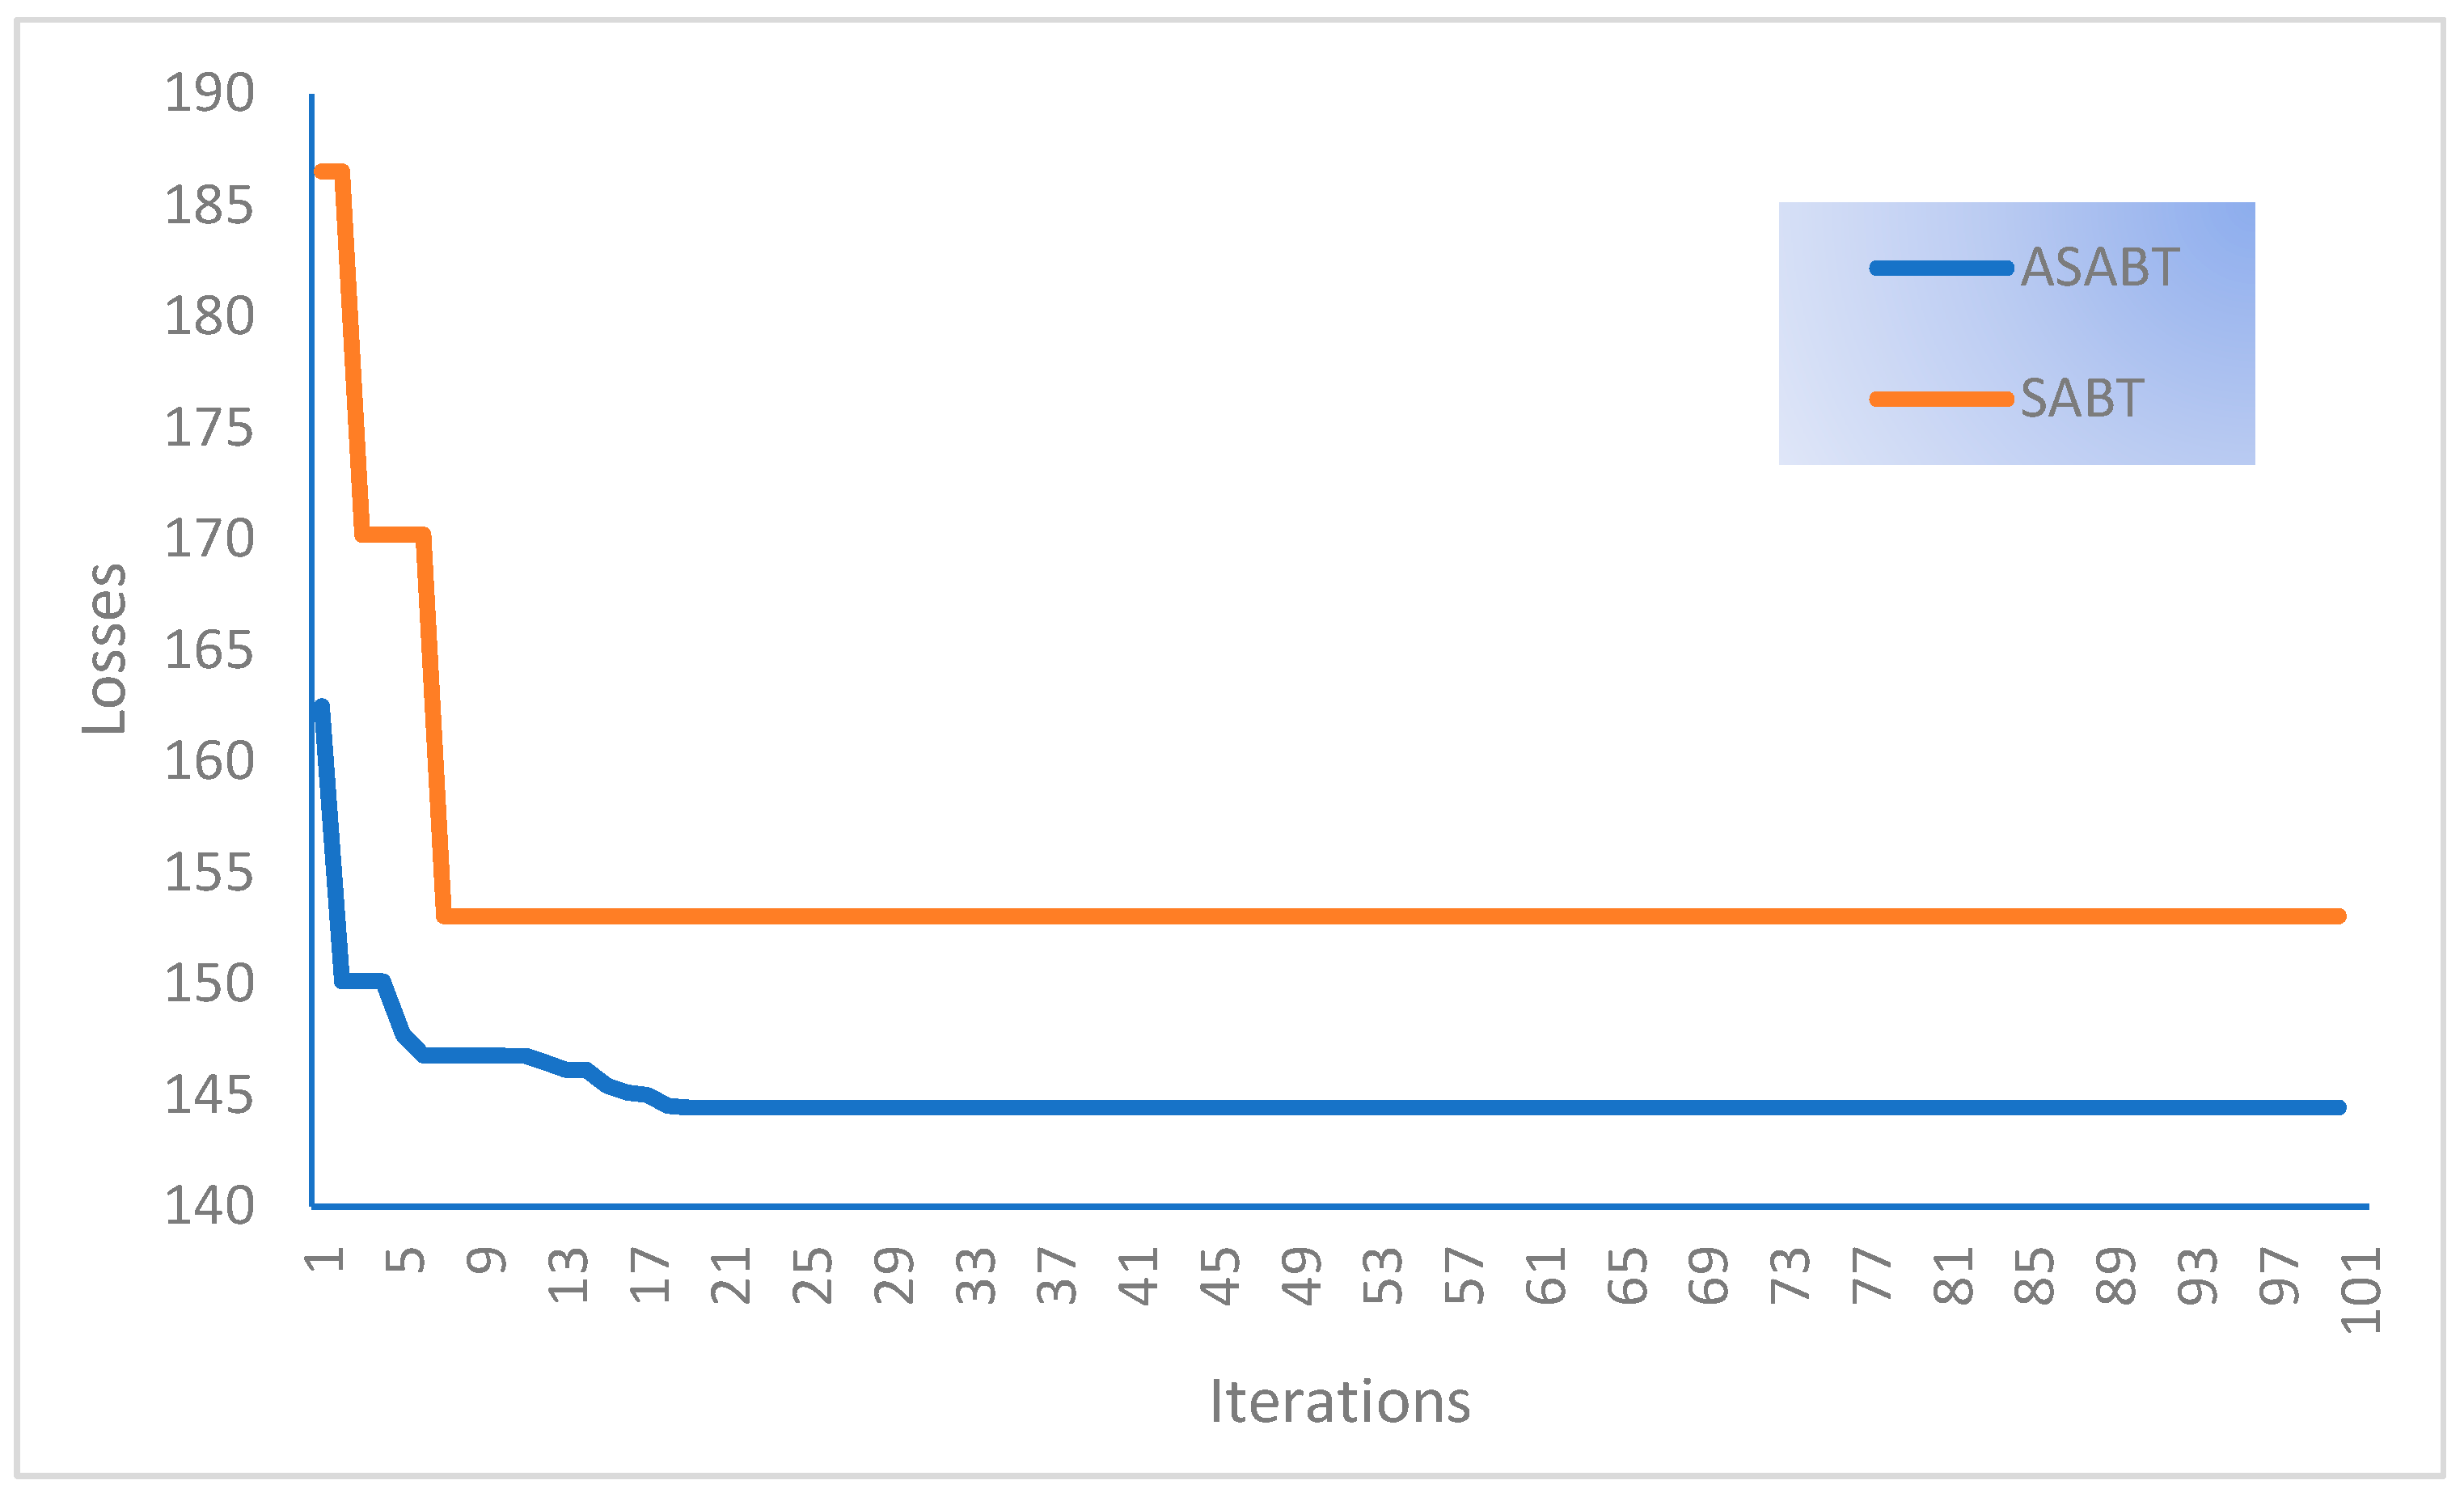
4.1.1. First Scenario

For the capacitor allocation on the first inspected feeder, the suggested ASABT is employed as opposed to the conventional SABT in order to cut down on power losses. The results of the ASABT and SABT for capacitor allocation are shown in Table 1. This table shows the capacitor allocations with installed buses of 4, 5, 6, 11, and 25 gained by the suggested ASABT, and corresponding sizes of 1350, 600, 1200, 1650, and 600 kVAr, respectively. The SABT method, on the other hand, installs sizes of 1200, 1350, 750, 1200, and 750 kVAr for five buses at 4, 9, 12, 17, and 26, respectively. Figure 3 displays the convergence properties of both the ASABT and SABT for solving this case. According to this figure, the suggested ASABT outperforms the SABT in minimizing power losses where the SABT method reduces power losses to 772.08 kW, whereas the suggested ASABT reduces them to 767.957 kW. The power losses in the system without inserting capacitors were 1766.2 kW. Compared to the initial case, the suggested ASABT exhibits a considerable 56.4% reduction in the power losses.
To depict the voltage profile across the system, Figure 4 displays the voltage magnitudes with and without the capacitors installed on all buses. As can be seen, the magnitudes of the voltages have improved across the system, with the minimum voltage at bus 27 rising from 0.642 PU to 0.9008 PU, giving an improvement of 40.22%.
To extend the study by comparisons with several other recent algorithms, Coati [31], OOA [32], and DA [33] are implemented in addition to the proposed ASABT and SABT methods. Figure 5, Figure 6 and Figure 7 display the best, mean, and worst losses obtained by Coati, DA, ASABT, SABT, and OOA for scenario 1 and the improving percentage compared to ASABT; Figure 8 depicts their standard deviation. As shown, the proposed ASABT shows superior outcomes compared to the others in finding the least four metrics. On the level of the standard deviation of the obtained losses, the proposed ASABT shows an improvement of 29.18% compared to Coati, 49.58% compared to DA, 14.58% compared to SABT, and 48.02% compared to OOA.

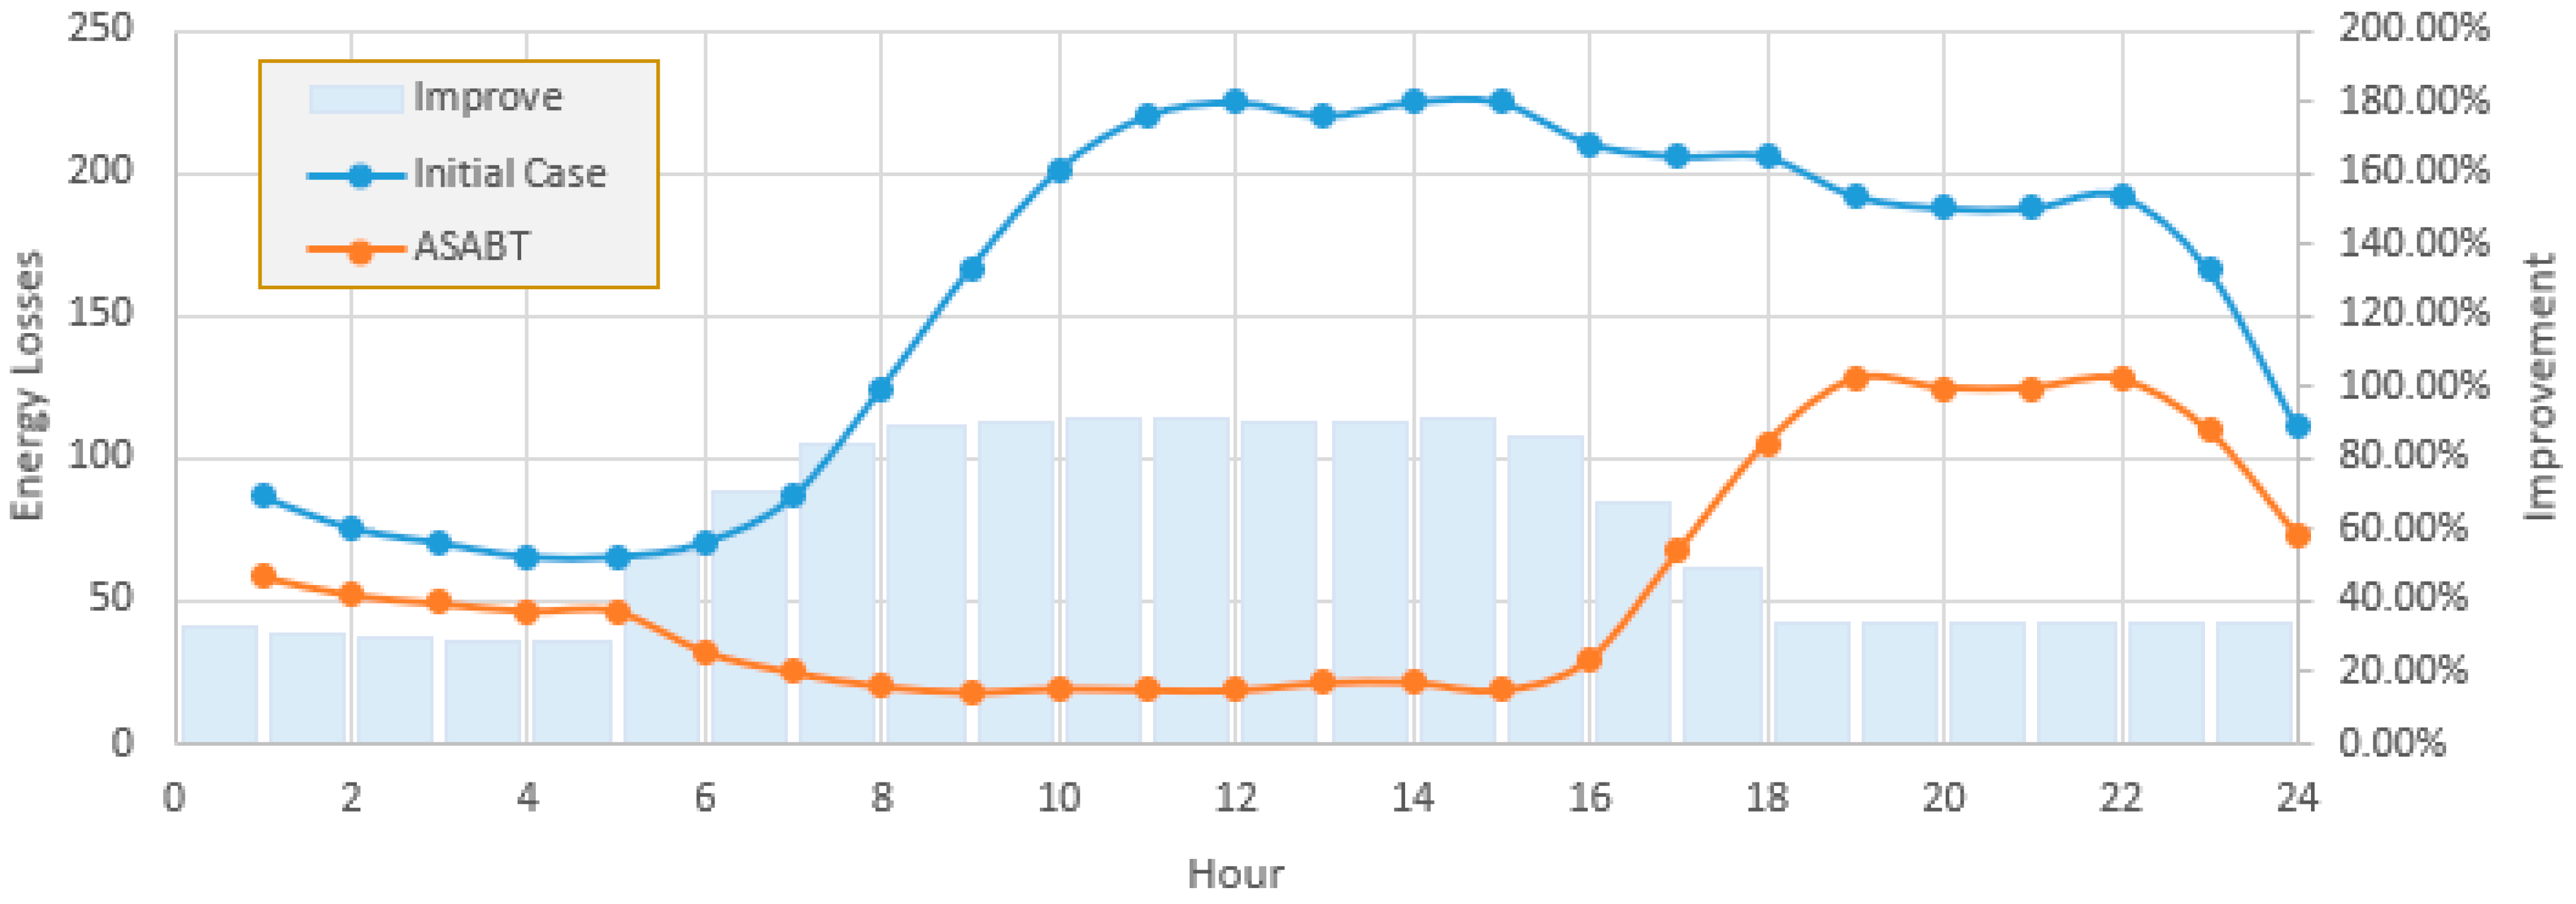
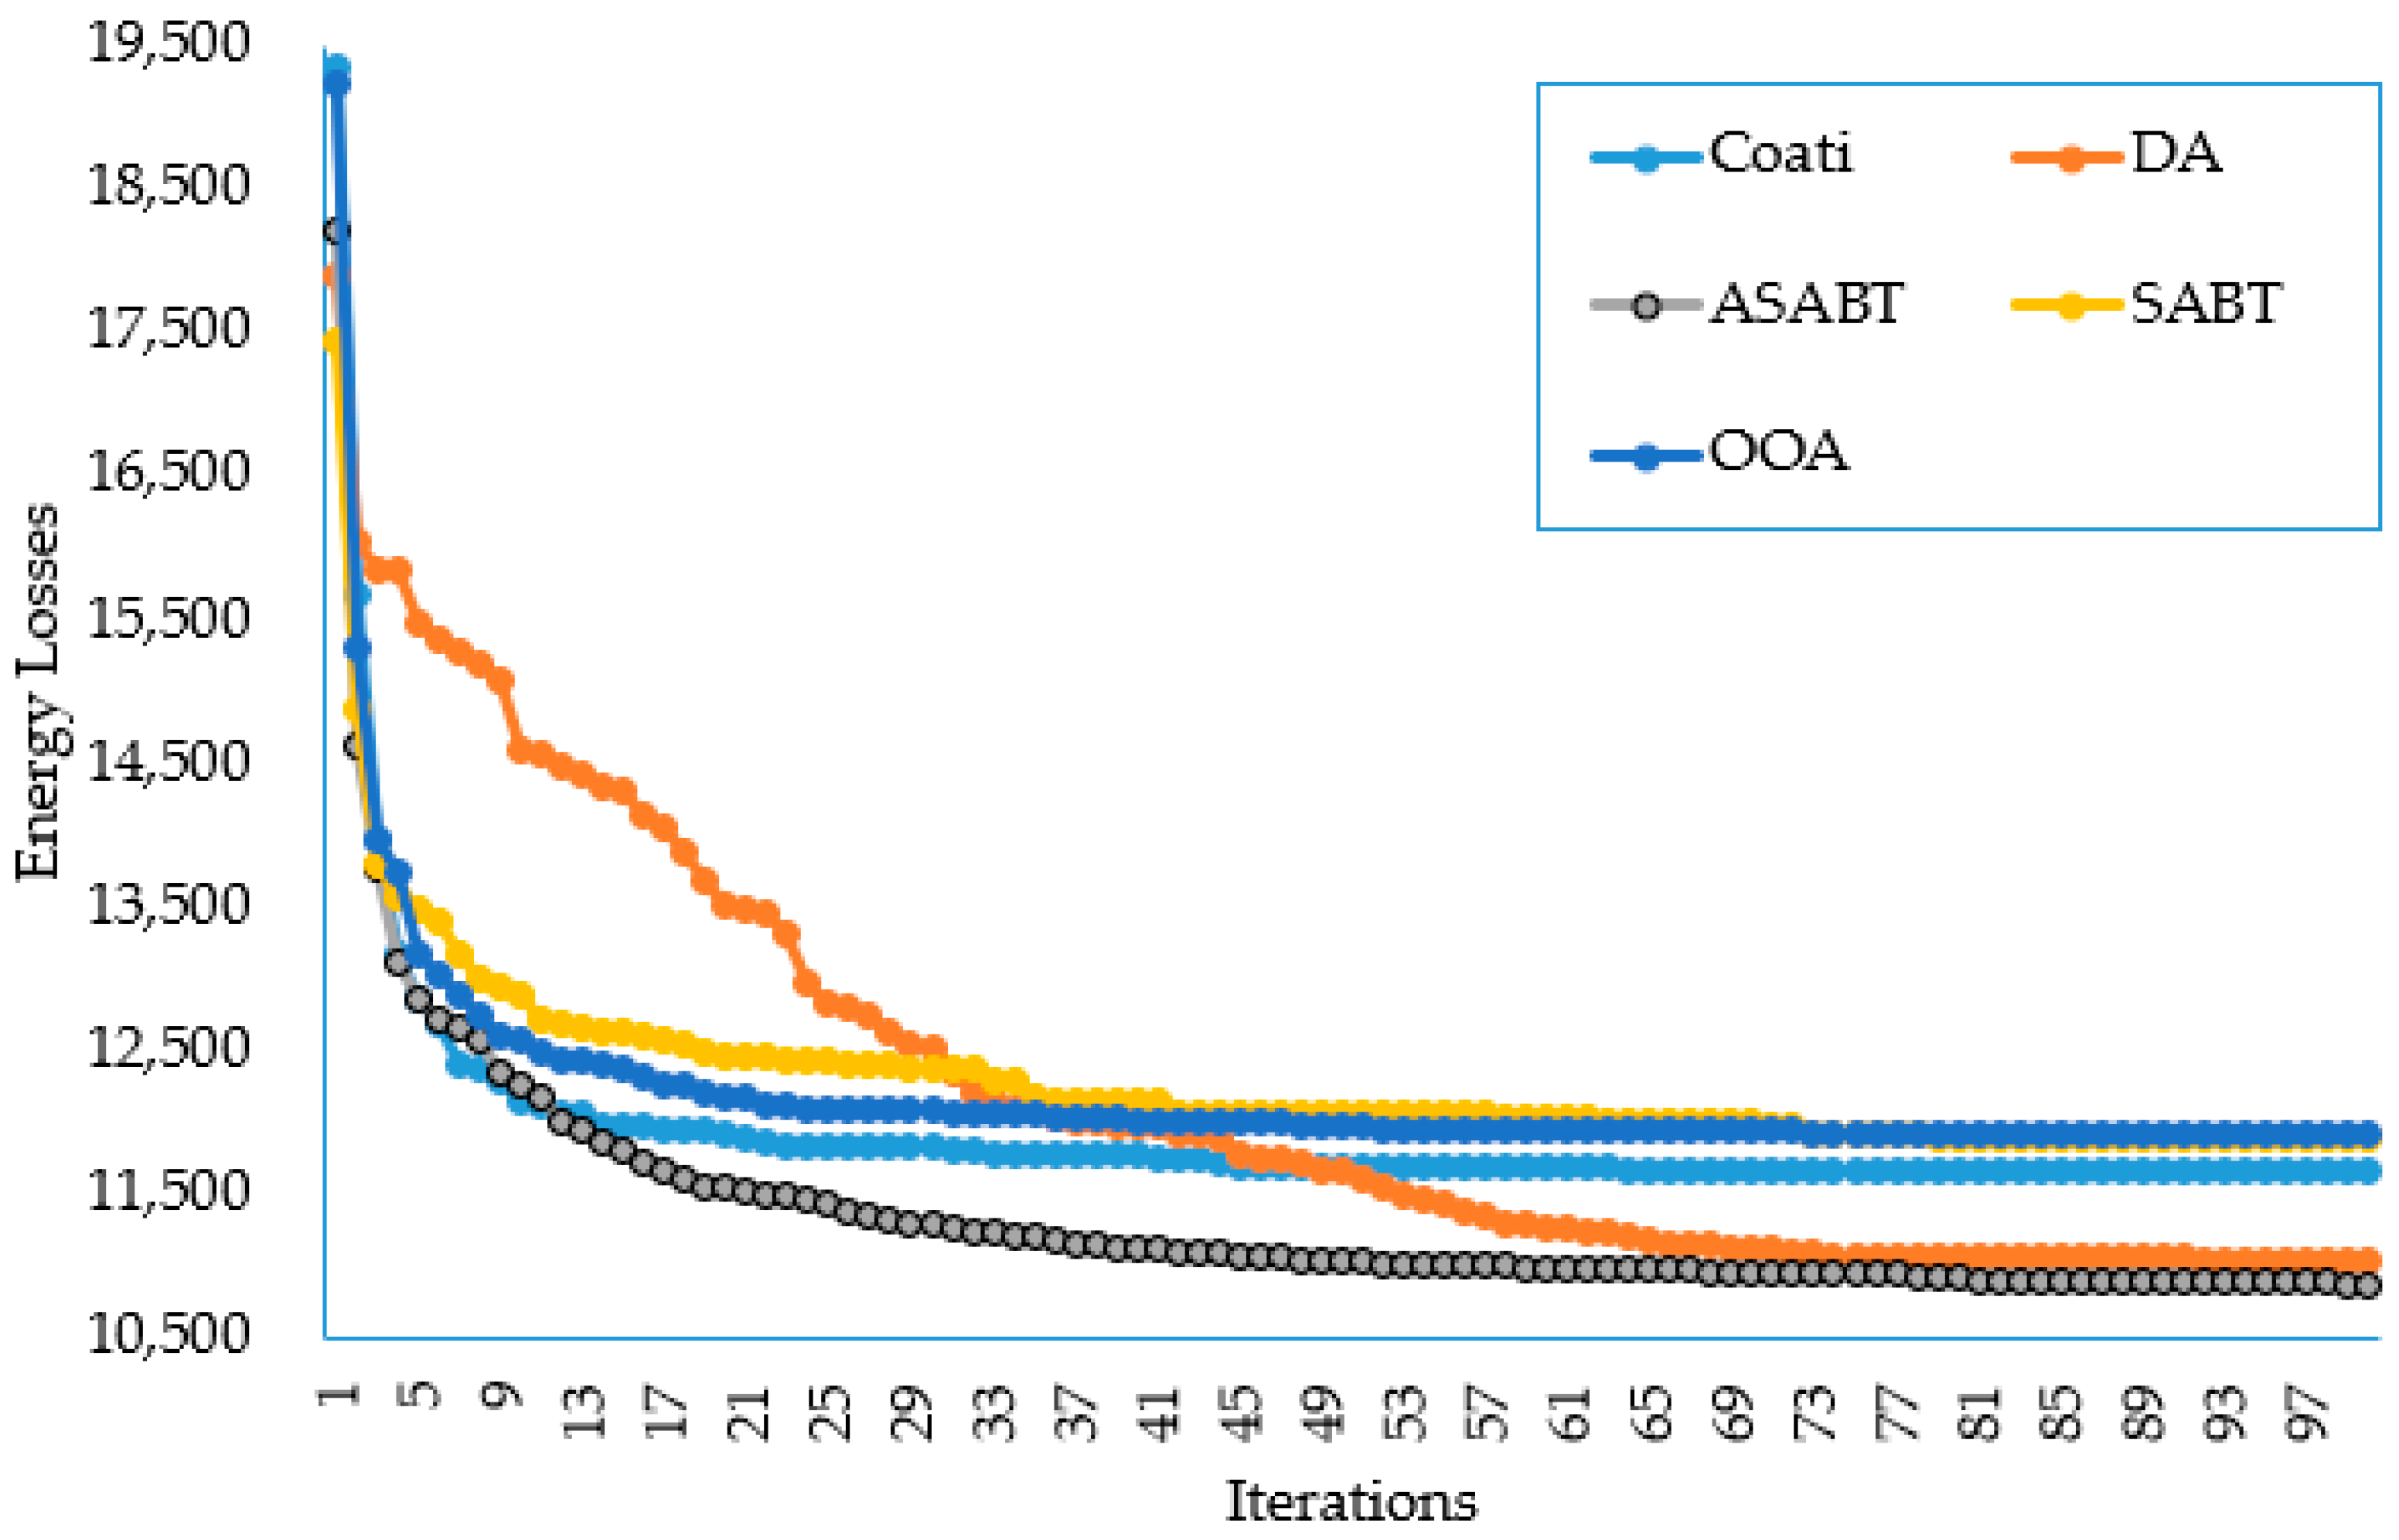
4.1.2. Second Scenario

In this scenario, the suggested ASABT is employed as opposed to the conventional SABT for optimizing PV units and shunt capacitors to minimize the energy losses during the day. Thus, the hourly variations in loading as a percentage of the peak loading condition are considered, as displayed in Figure 9.
The proposed ASABT and the conventional SABT are applied for this scenario and the optimal placement and sizes of both the PV units and the capacitors are shown in Table 2. The proposed ASABT selects five buses at 6, 10, 21, 25, and 29 to install PV units with sizes of 974, 559, 445, 726, and 497 kW, respectively. At the same time, it selects five buses at 7, 8, 14, 16, and 25 to install capacitors with sizes of 1363, 219, 1077, 1469, and 897 kVAr, respectively. In this regard, Figure 10 displays the hourly PV generation variation at the selected buses using the proposed ASABT. Based on the obtained results using the ASABT, the energy losses are reduced from 26,227.31 to 10,554 kW/day, with a high reduction of 59.75% compared to the initial case. In comparison to the standard SABT, the proposed ASABT achieves a reduction of 4.26%, where the SABT acquires energy losses of 11,024.55 kW/day. Also, based on the PV units and the capacitors selected via the proposed ASABT, the daily supplied energy is greatly reduced from 121.785 MW to 84.66 MW, with a reduction of 30.48% compared to the initial case. In this regard, based on an emission coefficient of 910 kgCO2 for each MW production [37], the emissions produced from the substation are greatly reduced from 110,823.886 kgCO2 to 79,189 kgCO2 with a reduction of 28.54% compared to the initial case.
Additionally, Figure 11 depicts the obtained hourly losses based on the PV units and capacitors allocated by the SABT and the proposed ASABT and the regarding improvement percentage. As displayed in Figure 11, based on the PV units and the capacitors selected via the proposed ASABT, substantial improvement in the power losses is attained in each hour compared to the SABT. The improvement is more than 10% reduction from hour 8 to hour 16.
In this scenario, Coati [31], OOA [32], and DA [33] are implemented in addition to the proposed ASABT and SABT methods. Figure 12 displays their average converging properties, while their statistical metrics are tabulated in Table 3. As shown, the proposed ASABT shows superior outcomes compared to the others in finding the least four metrics.
Compared to Coati, the proposed ASABT derives great improvement of 1.51%, 6.66%, 8.57%, and 47.84%, respectively. Compared to DA, the proposed ASABT derives great improvement of 0.93%, 1.55%, 4.78%, and 19.26%, respectively. Compared to SABT, the proposed ASABT derives great improvement of 7.17%, 8.43%, 8.33%, and 8.65%, respectively. Compared to OOA, the proposed ASABT derives great improvement of 3.74%, 8.65%, 10.79%, and 32.33%, respectively.

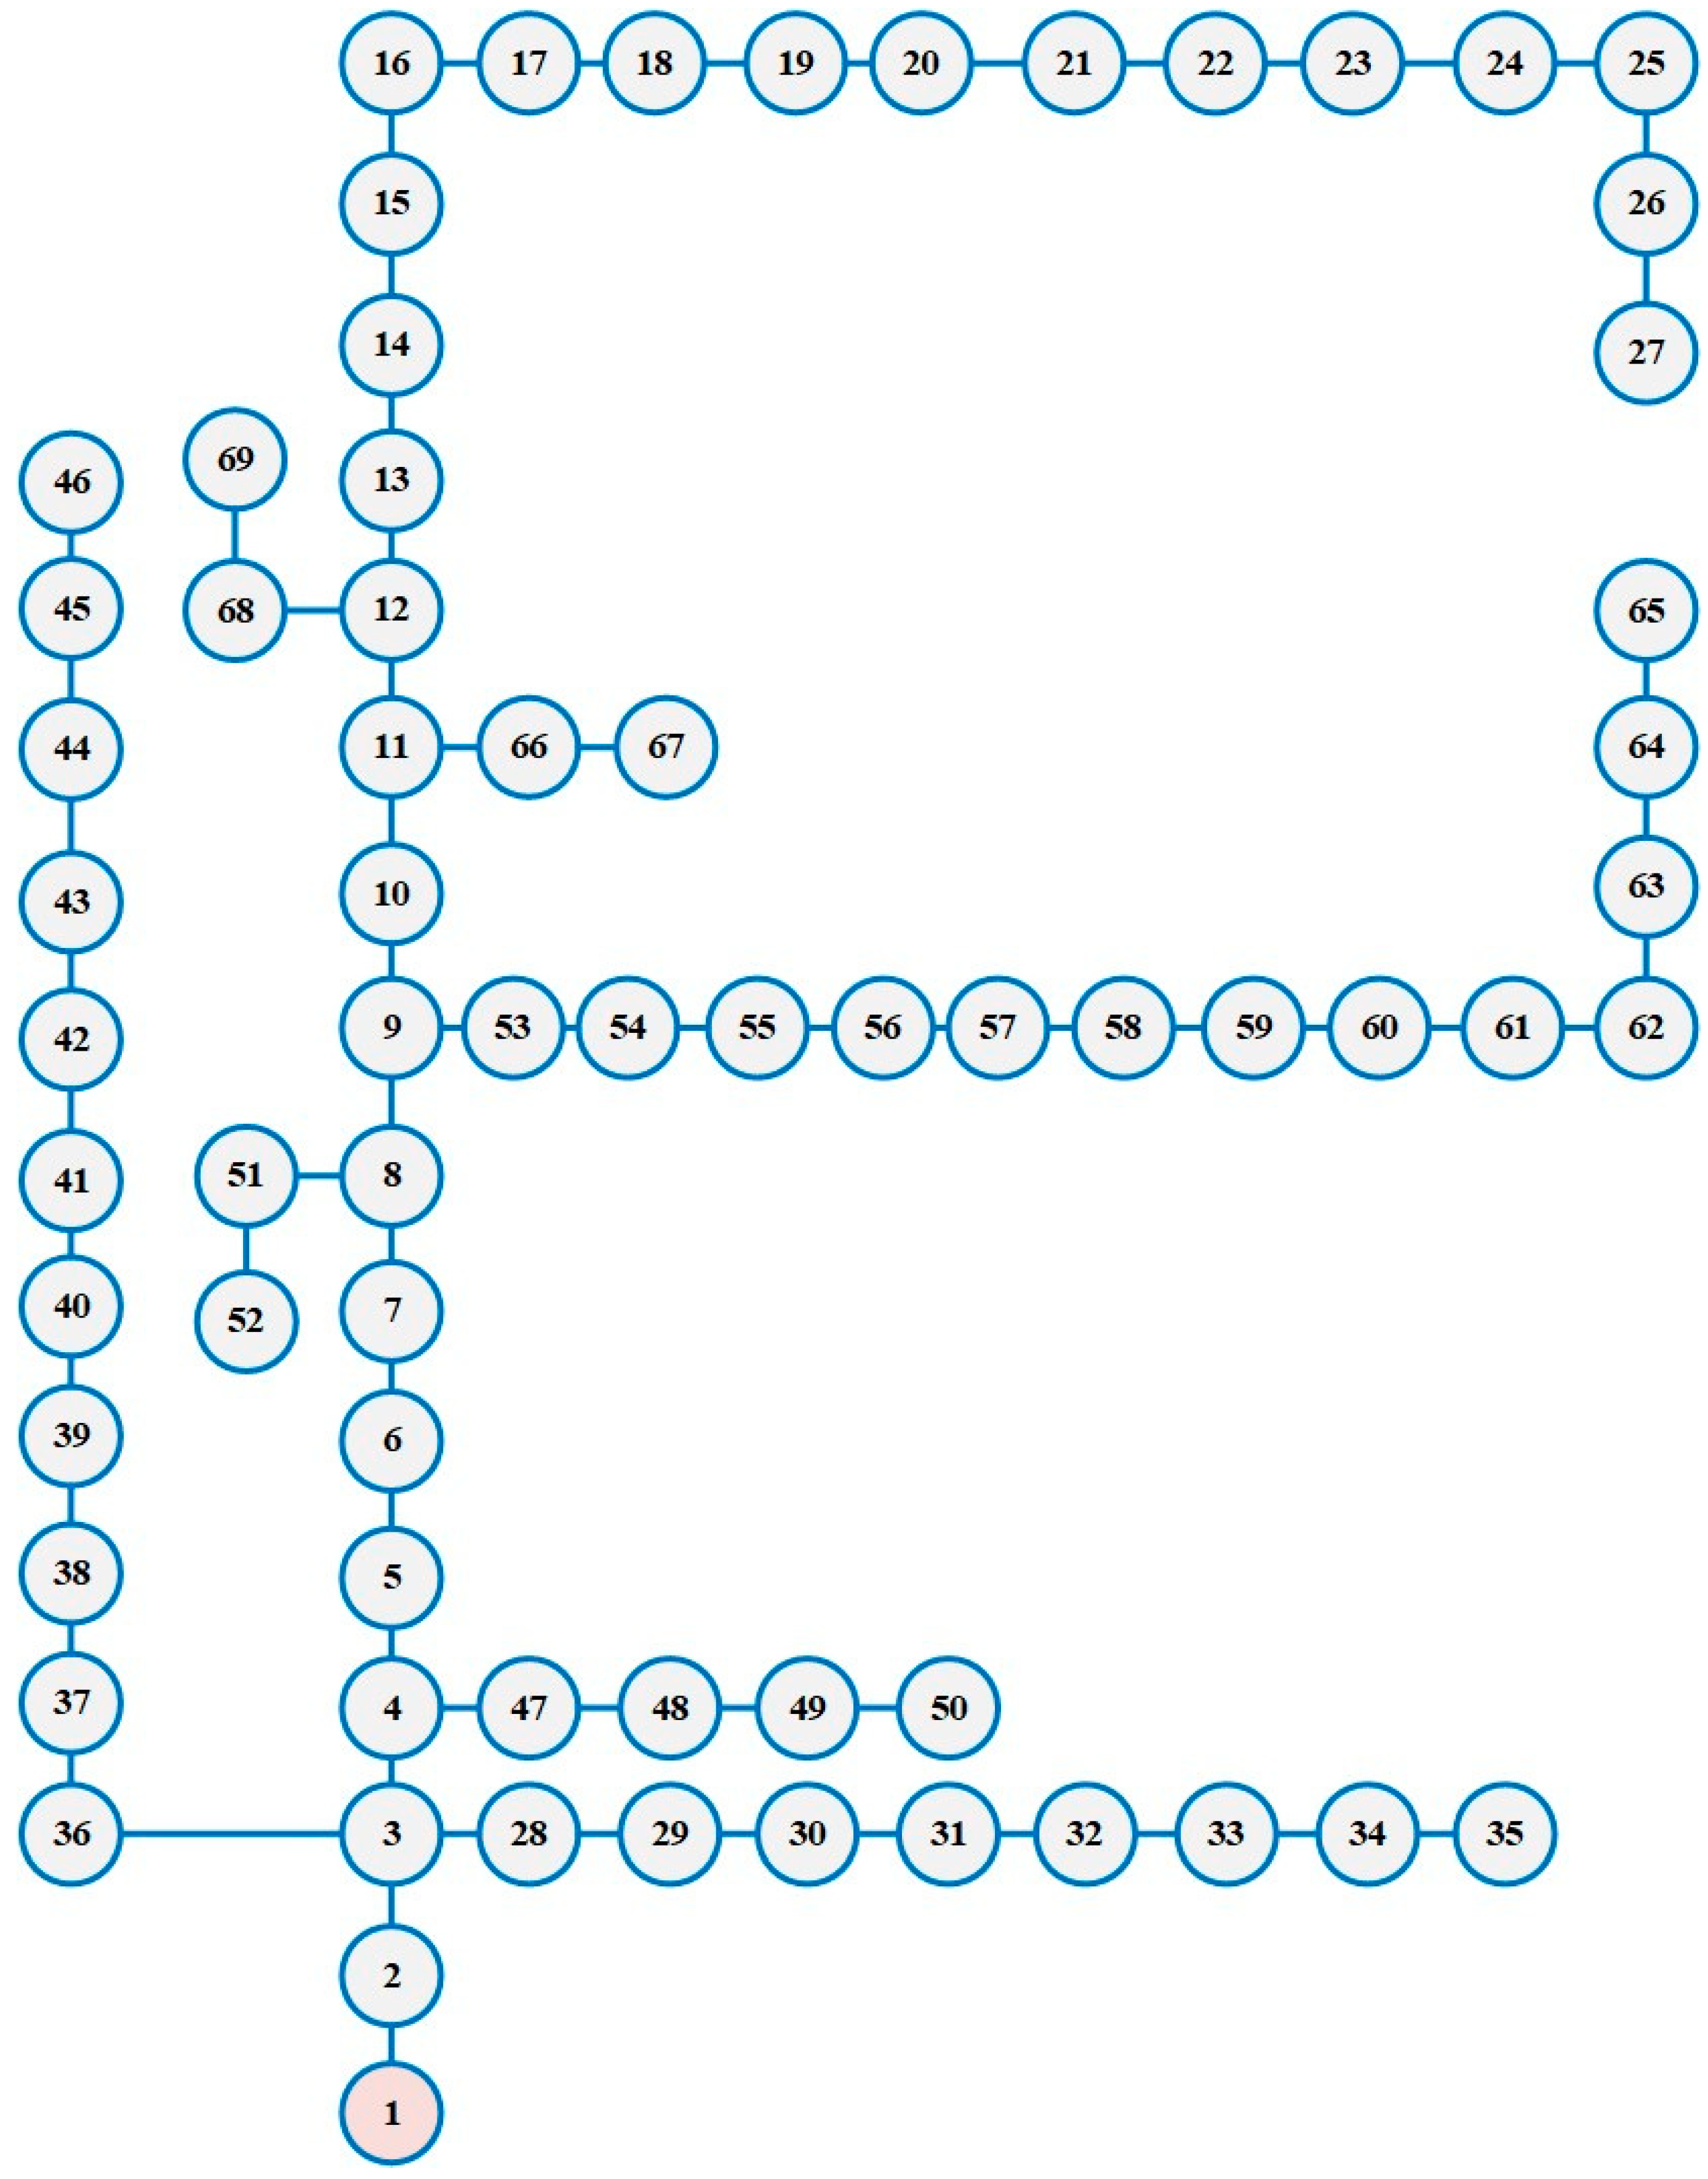
4.2. Second Case of the IEEE 69-Distribution Feeder

The second system has 68 lines for distribution and 69 nodes. A connected one-line diagram using a standard voltage of 12.66 kV is shown in Figure 13. For the nominal load condition, the sums of the real (kW) and reactive (kVAr) are 3802 kW and 2694 kVAr, respectively [38].

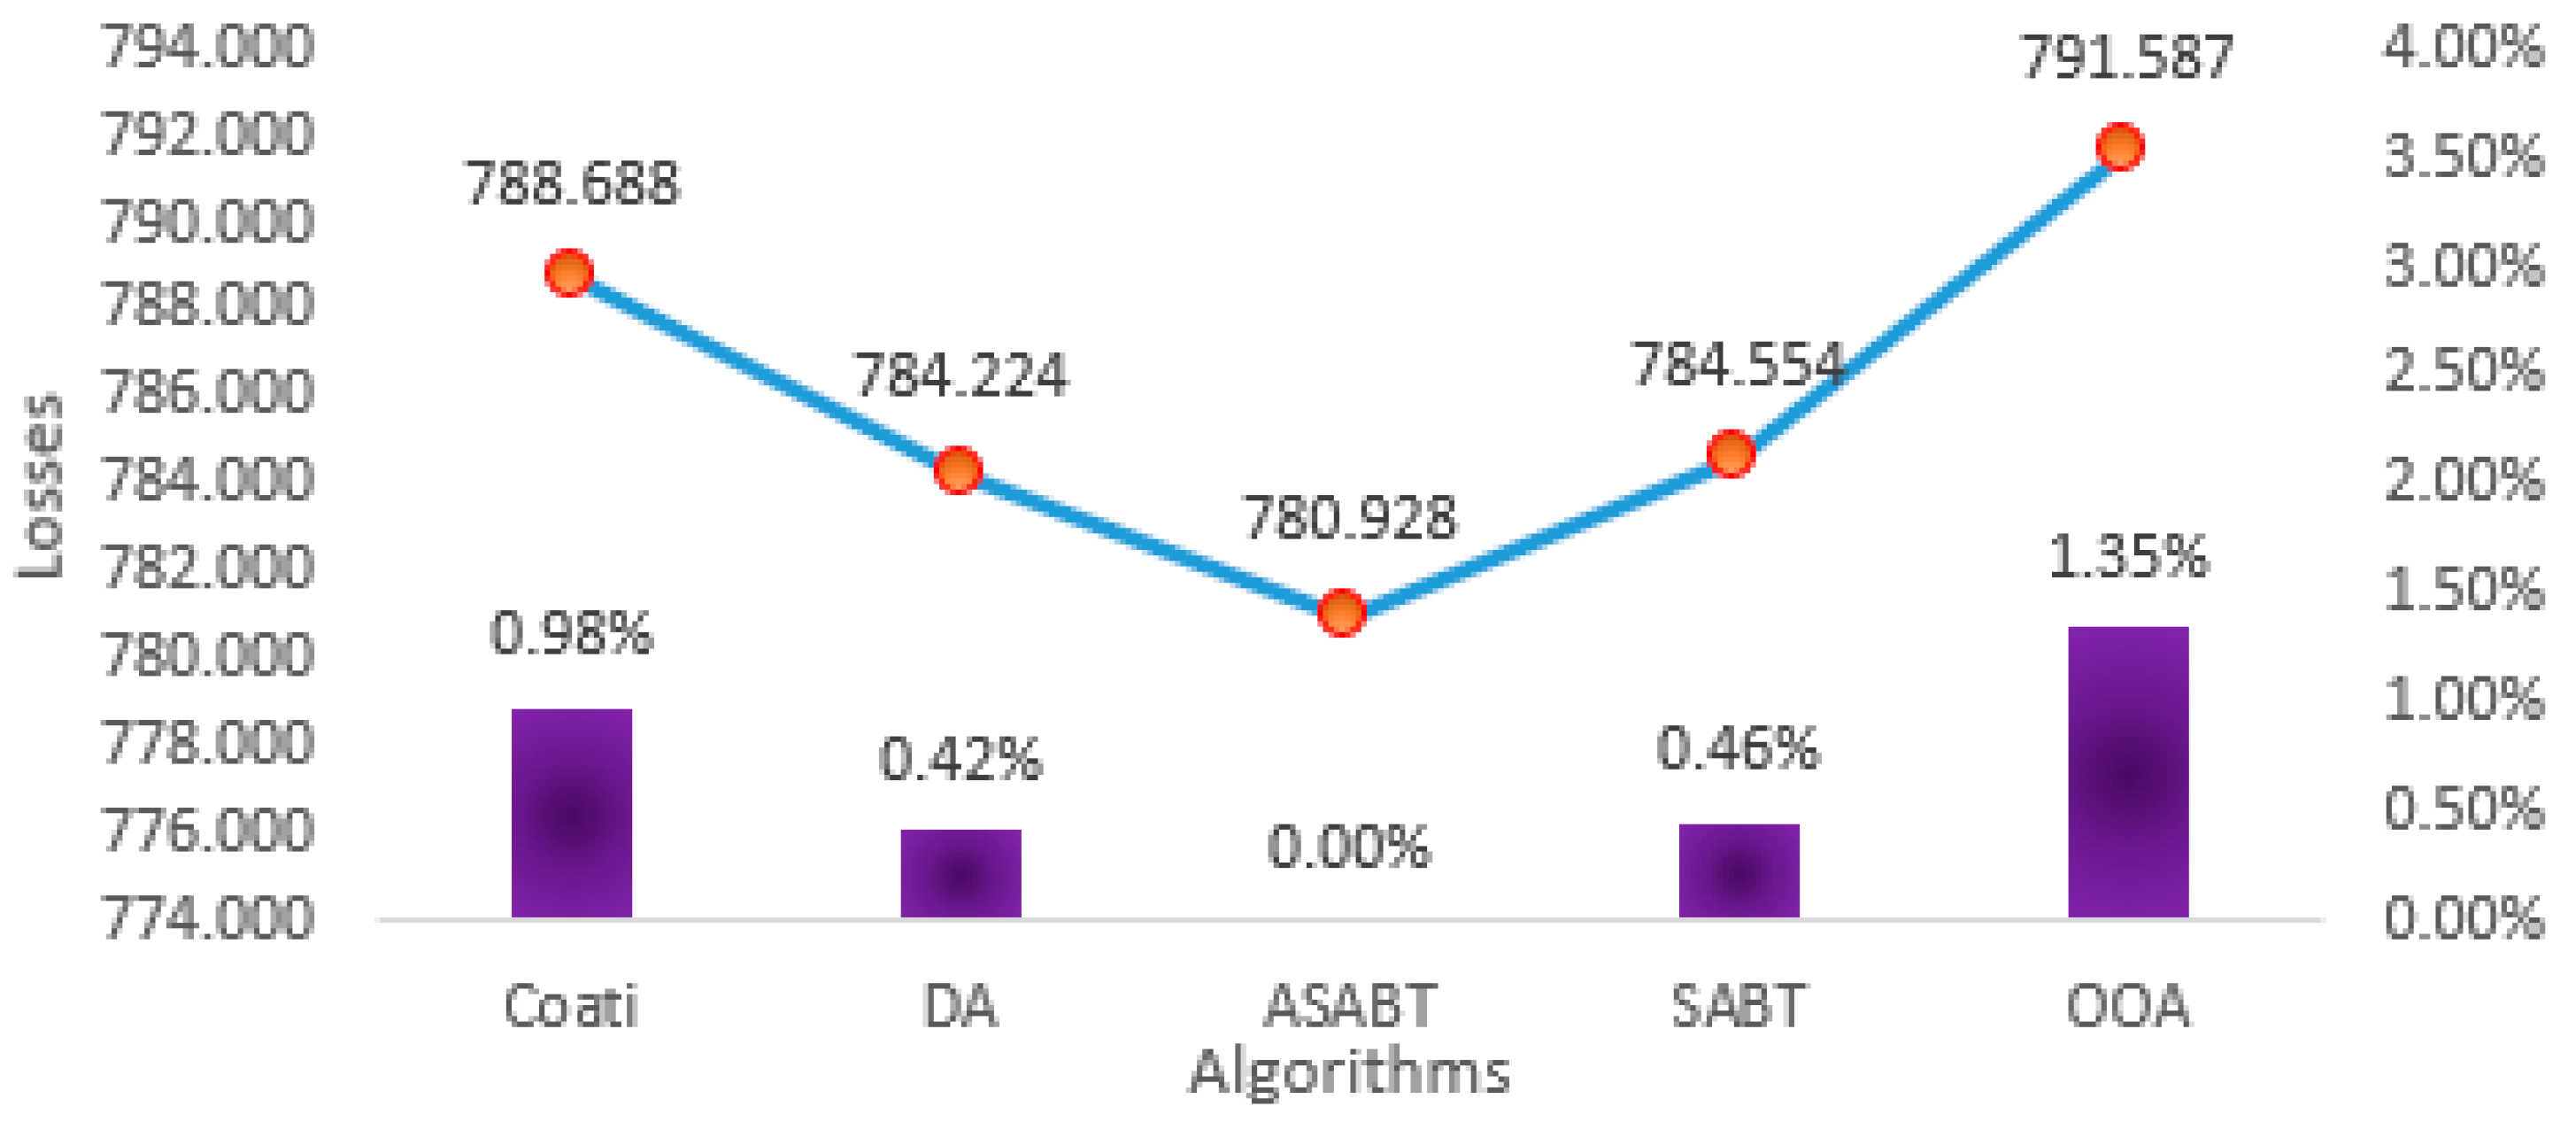
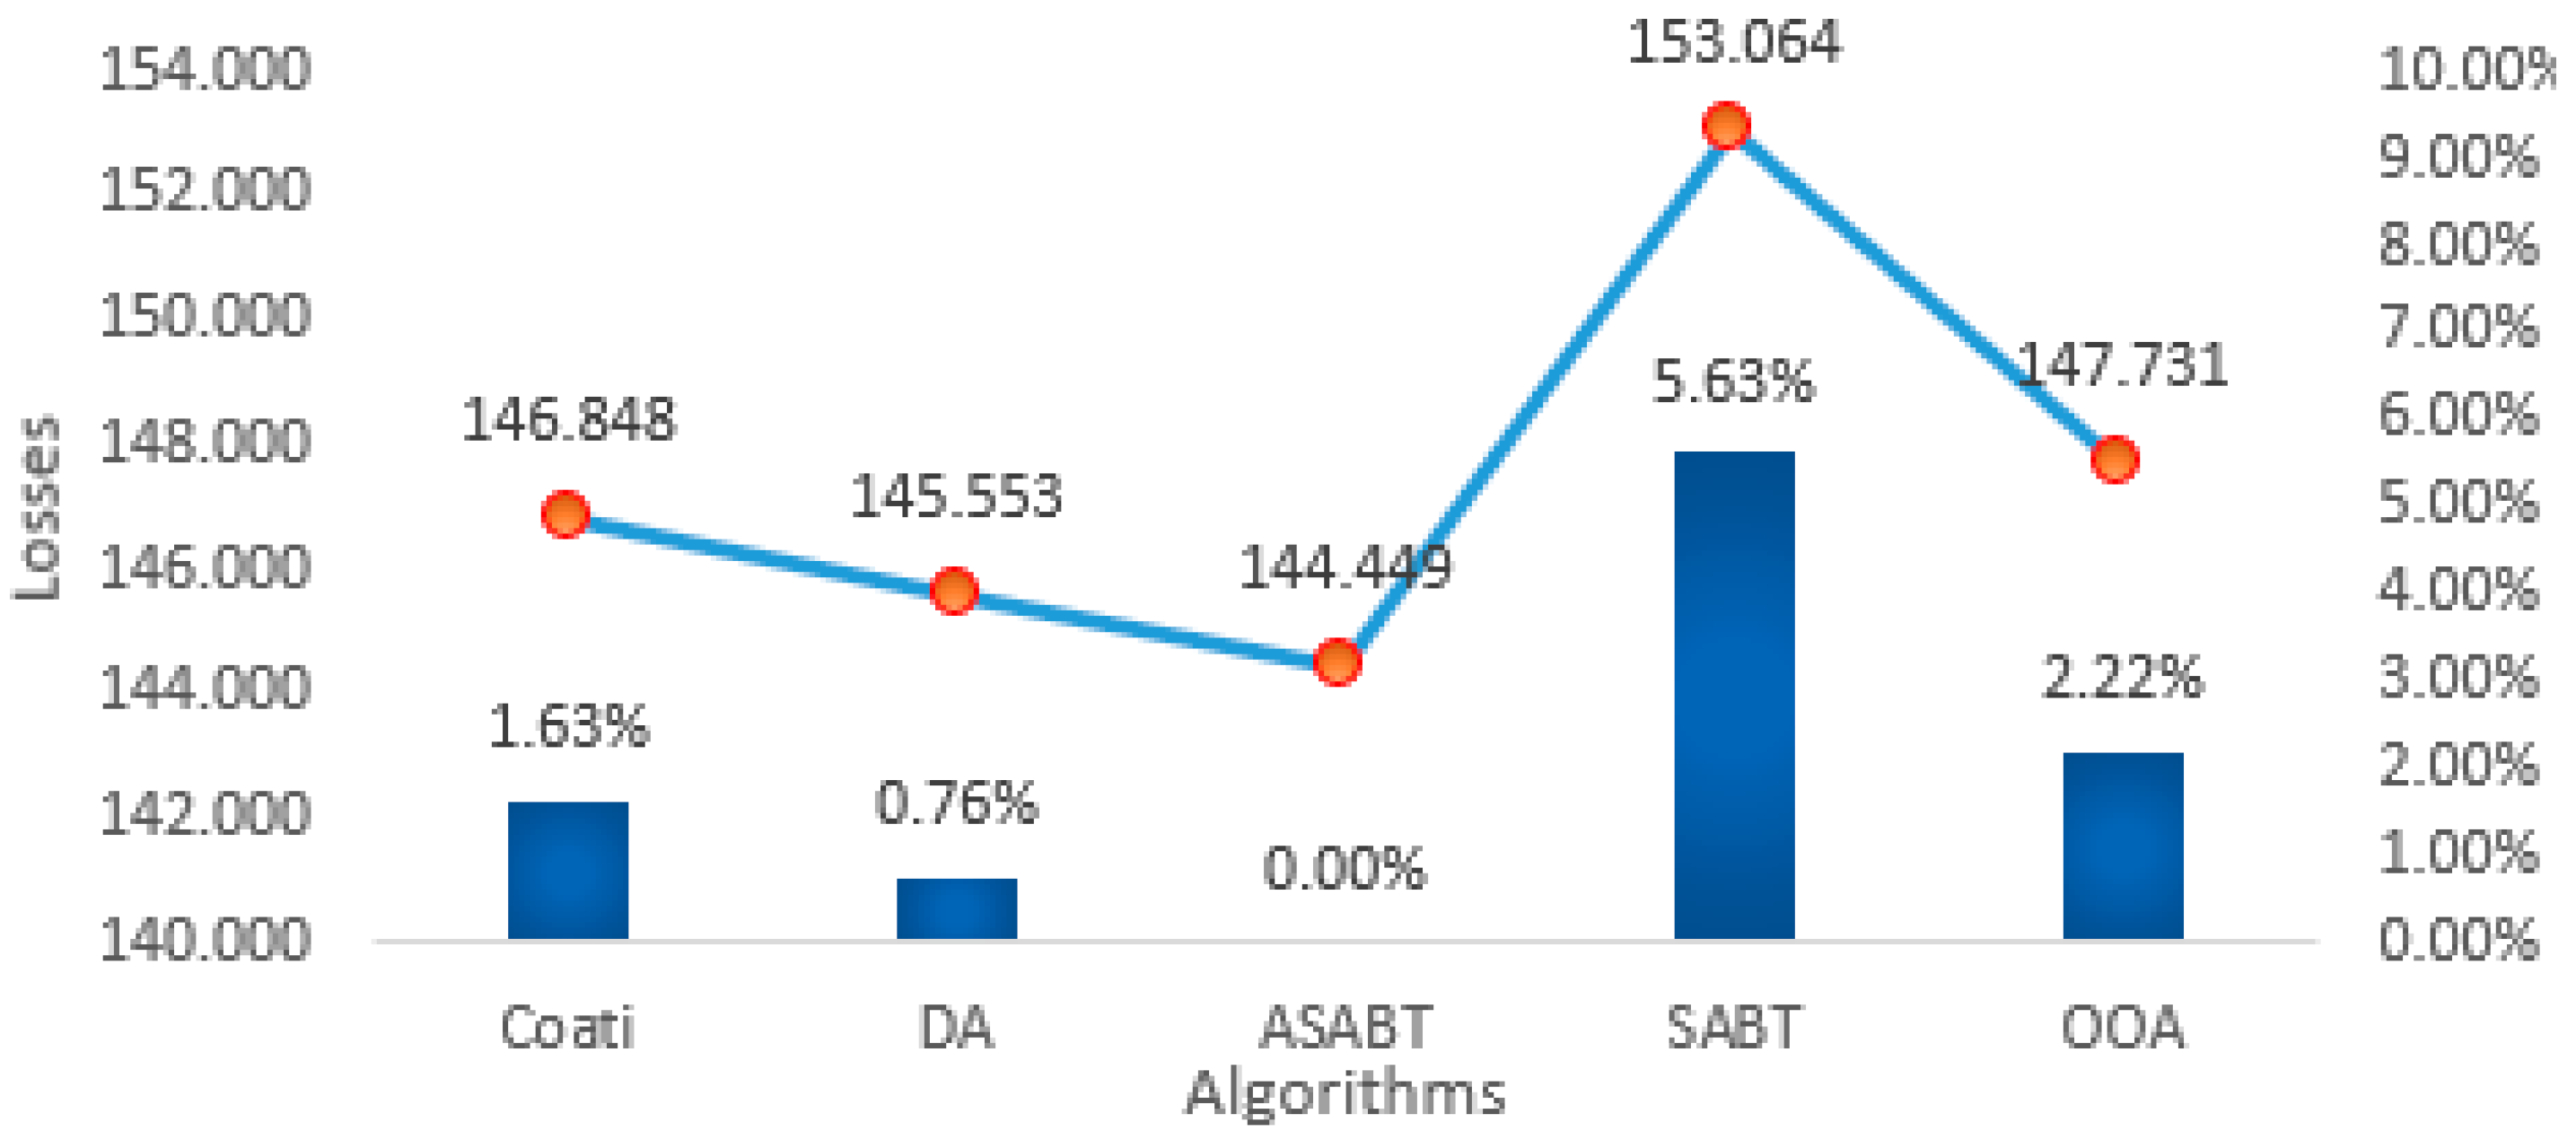
4.2.1. First Scenario

For the capacitor allocation on the second inspected feeder, the suggested ASABT is employed as opposed to the conventional SABT in order to cut down on power losses. The results of the ASABT and SABT for capacitor allocation are shown in Table 4. This table shows the capacitor allocations with installed buses of 11, 18, 49, and 61 gained by the suggested ASABT, with corresponding sizes of 300, 300, 600, and 1200 kVAr, respectively. The SABT method, on the other hand, installs sizes of 450, 1650, 300, 900, and 600 kVAr for five buses at 19, 28, 46, 57, and 62, respectively. Figure 14 displays the convergence properties of both the ASABT and SABT for solving this scenario. The power losses in the system without inserting capacitors were 224.94 kW. According to this figure, the SABT method reduces power losses to 153.06 kW, whereas the suggested ASABT reduces them to 144.5 kW. As a result, the suggested ASABT outperforms the SABT in minimizing power losses by 5.61%. Additionally, from Table 1, the suggested ASABT defines 2400 kVAr based on the total installed capacity of the capacitors, but the SABT approach allocates a higher capacity of 3900 kVAr. In comparison to the SABT, the proposed ASABT exhibits a considerable 38.46% drop in device capacity.
To display the voltage profile over the system, Figure 15 shows the voltage magnitudes with and without installing the capacitors at all the buses. As shown, the voltage magnitudes are improved all over the system where the minimum voltage at bus 65 with 0.9029 PU is increased to 0.9308 PU, with improvement of 2.38%.
Along with the suggested ASABT and SABT approaches, Coati [31], OOA [32], and DA [33] are applied to broaden the study through comparisons with a number of other contemporary algorithms. They are carried out 20 times in total. Coati, DA, ASABT, SABT, and OOA’s best, mean, and worst losses for scenario 3 are shown in Figure 16, Figure 17 and Figure 18, along with the percentage improvement above ASABT, and their standard deviation is shown in Figure 19. As can be shown, the proposed ASABT outperforms the others in discovering the fewest number of metrics. The proposed ASABT exhibits an improvement of 87.9% compared to Coati, 63.55% compared to DA, 83.64% compared to SABT, and 91.87% compared to OOA on the level of the standard deviation of the acquired losses.

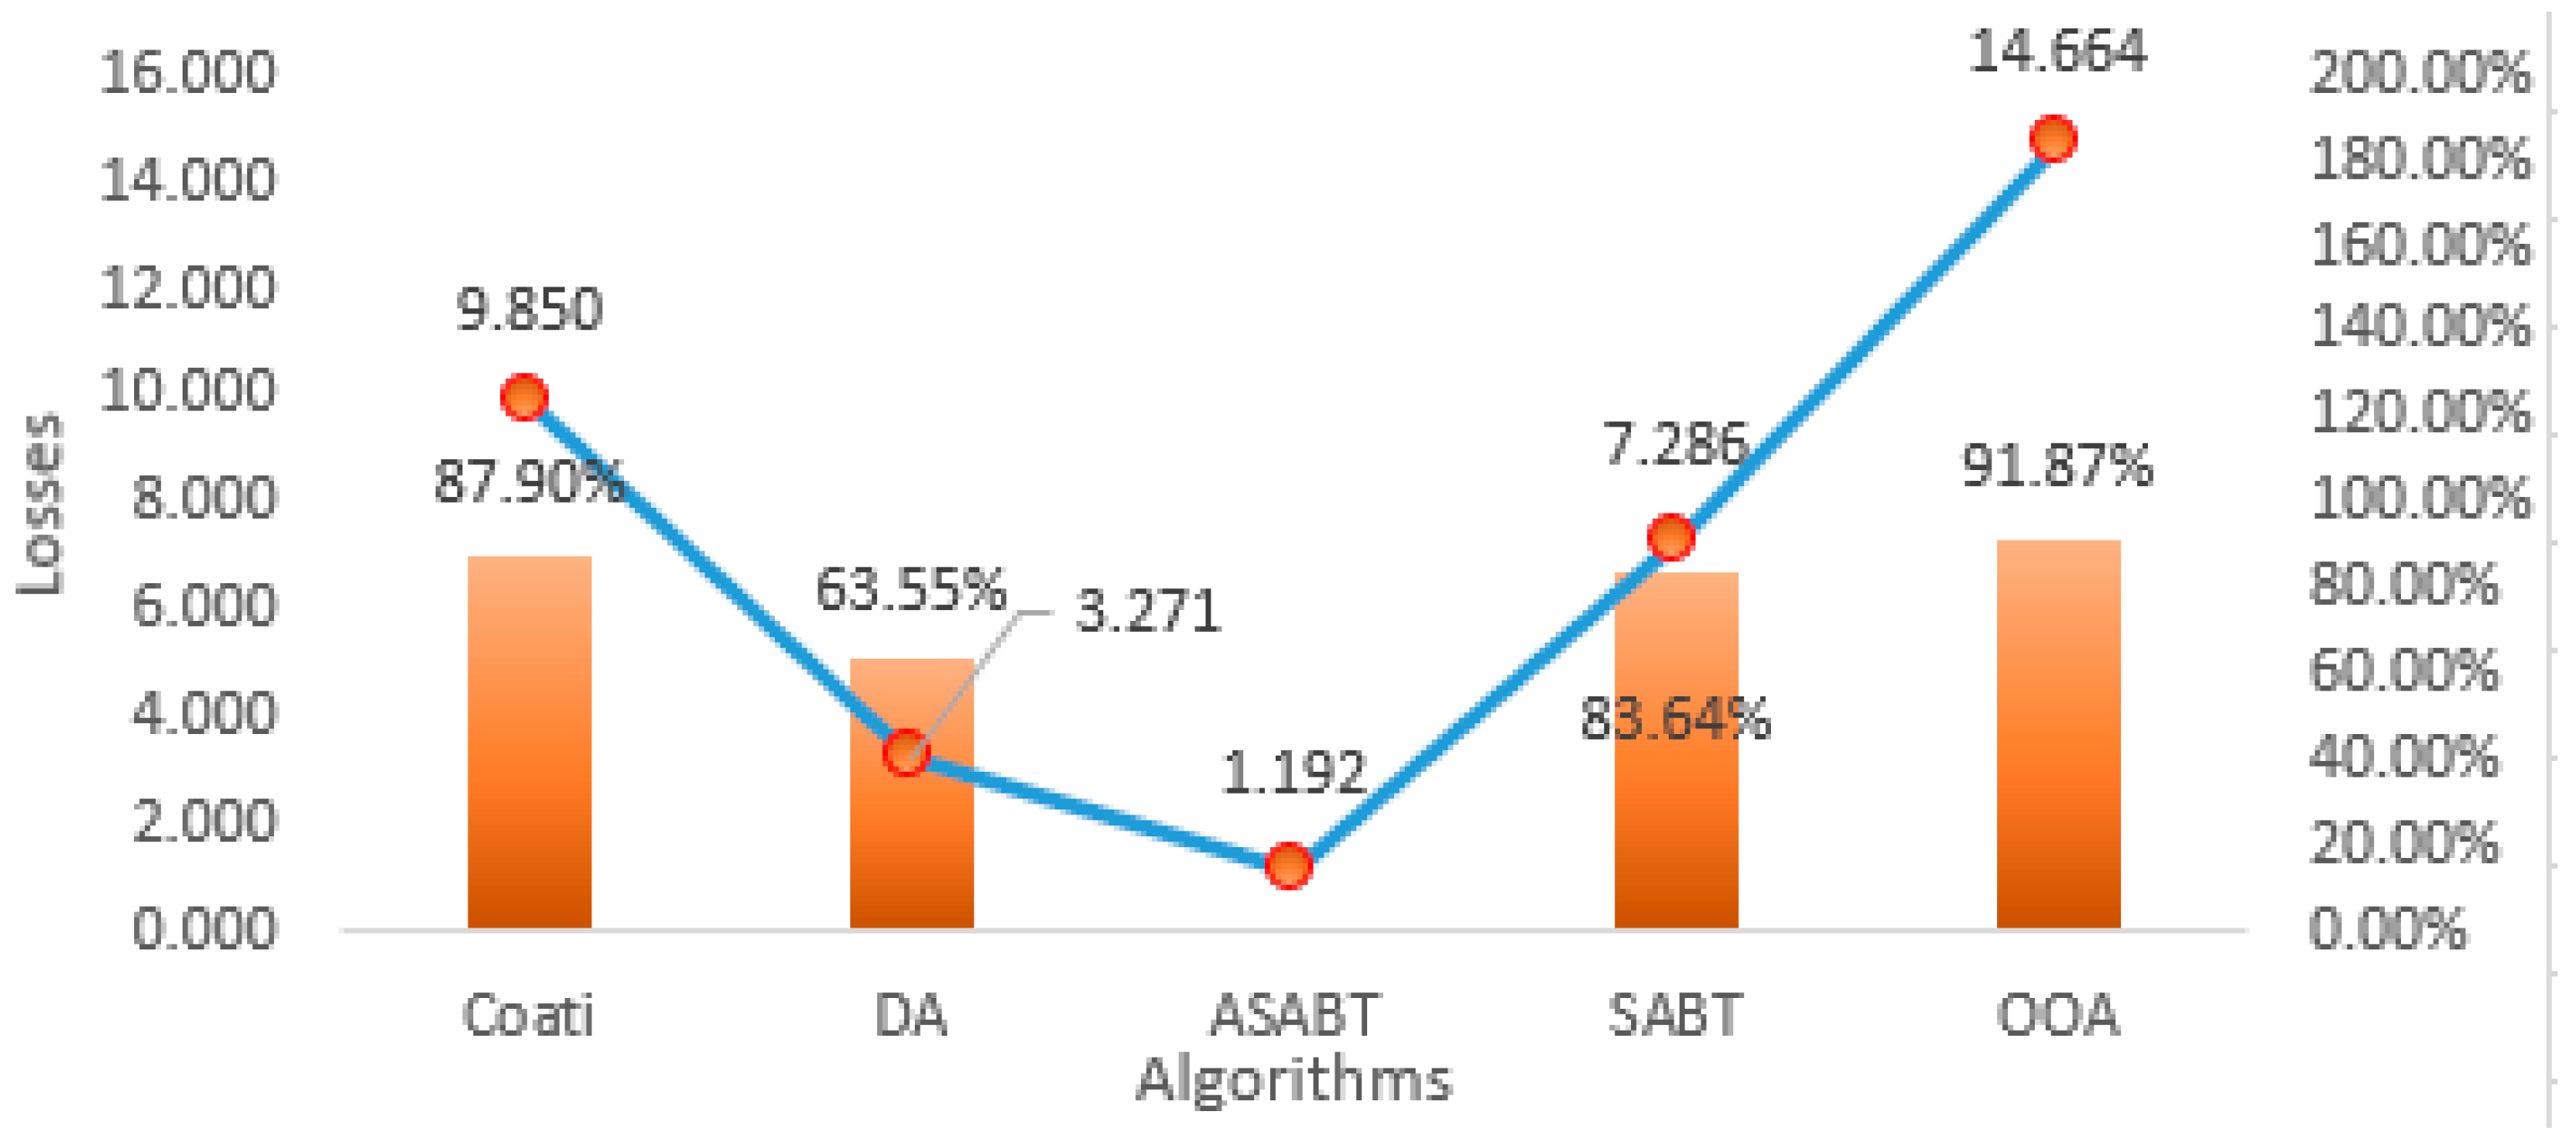
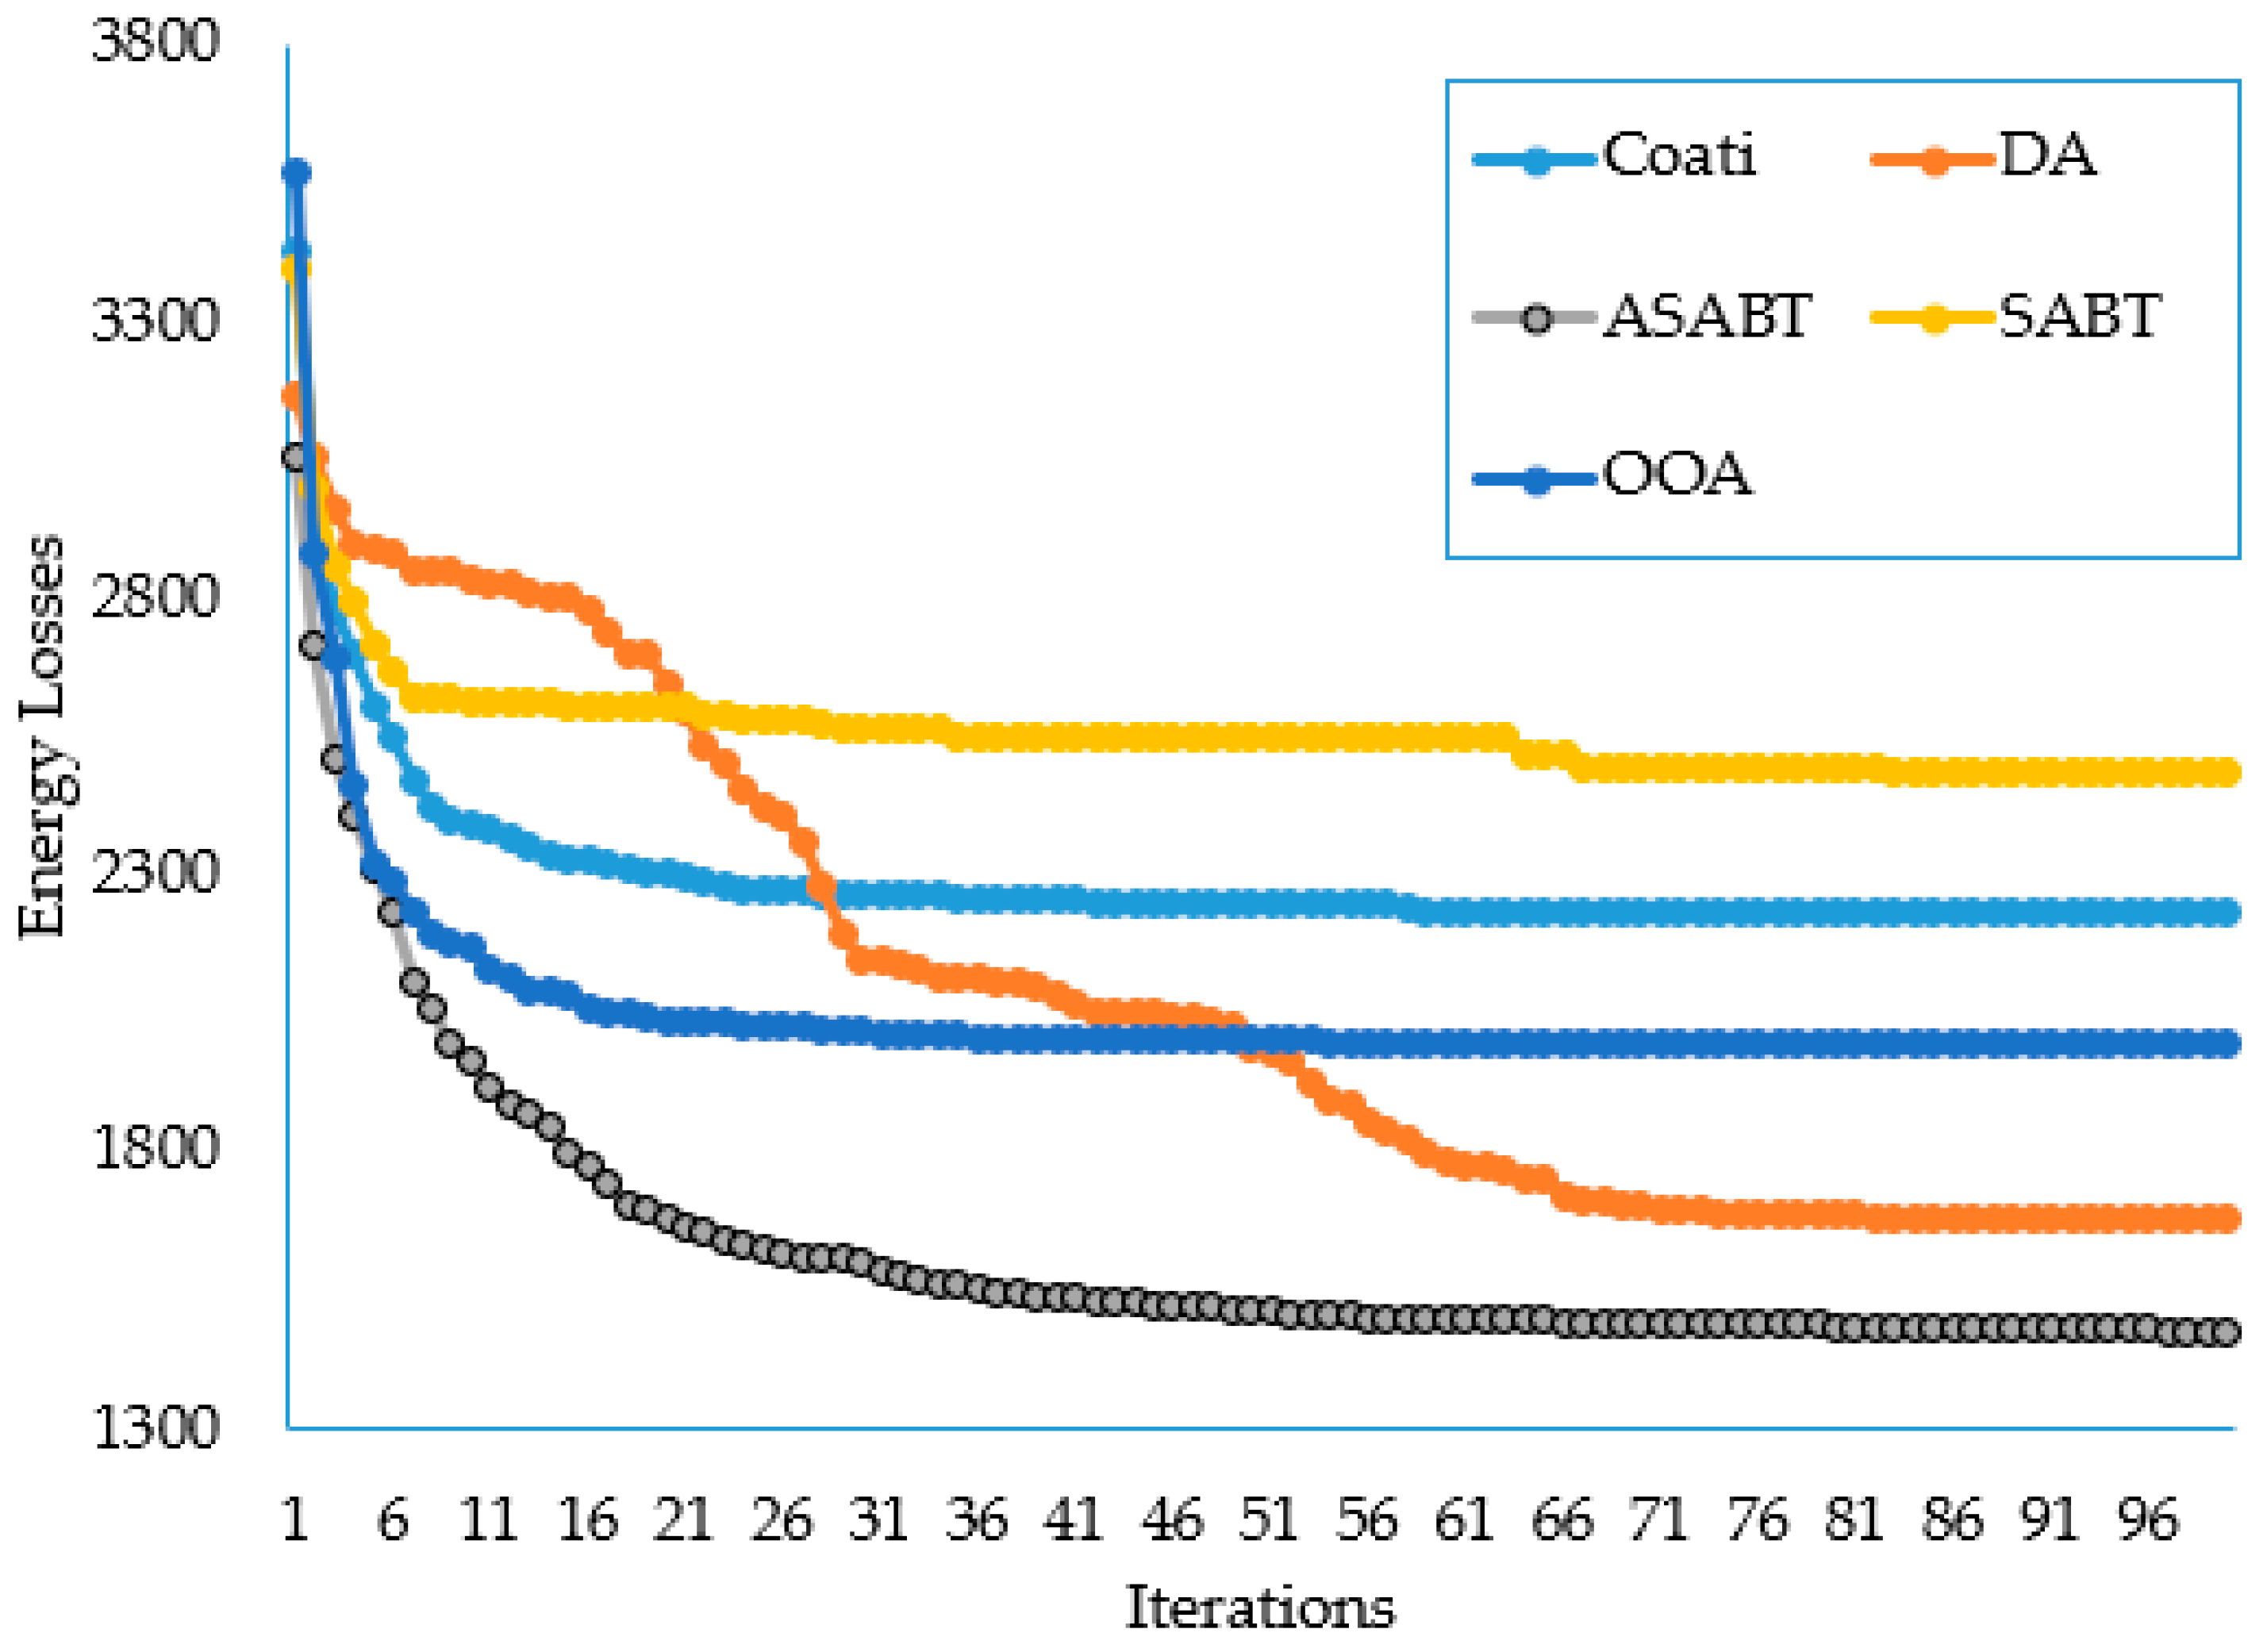
4.2.2. Second Scenario

In this scenario, the suggested ASABT is employed as opposed to the conventional SABT to optimize the placement and sizes of PV units and shunt capacitors, aiming to minimize energy losses throughout the day. Table 5 illustrates the optimal configurations obtained using both the proposed ASABT and the conventional SABT. The results obtained from the ASABT demonstrate a substantial reduction in energy losses from 3784.568 to 1359.819 kW/day, achieving a remarkable reduction of 64.07% compared to the initial case. In contrast, the standard SABT yields energy losses of 1660.33 kW/day. Furthermore, by employing the proposed ASABT to determine the PV unit and capacitor configurations, the daily supplied energy decreases significantly from 79.432 MW to 60.03 MW, resulting in a reduction of 24.43% compared to the initial case. Consequently, based on an emission coefficient of 910 kgCO2 for each MW production, the emissions generated from the substation are greatly reduced from 72,283.328 kgCO2 to 54,627.009 kgCO2 compared to the initial case.
Additionally, Figure 20 provides a visual representation of the hourly losses observed in the initial case and with the implementation of the proposed ASABT. As depicted in Figure 20, substantial improvements in power losses are achieved in each hour when the PV units and capacitors are selected using the proposed ASABT, particularly exhibiting a reduction of over 75% from hour 8 to hour 16 compared to the initial case. Comparing the obtained hourly losses between the SABT and the proposed ASABT, Figure 21 illustrates significant enhancements in power losses for each hour when employing the proposed ASABT, with an average percentage improvement of 24.2% compared to the initial case.
In this scenario, Coati [31], OOA [32], and DA [33] are implemented in addition to the proposed ASABT and SABT methods. Figure 22 displays their average converging properties while their statistical metrics are tabulated in Table 6. As shown, the proposed ASABT shows superior outcomes compared to the others in finding the least four metrics. Compared to Coati, the proposed ASABT derives great improvement of 23.31%, 32.65%, 26.11%, and 29.70%, respectively. Compared to DA, the proposed ASABT derives great improvement of 5.41%, 12.85%, 1.69%, and 7.76%, respectively. Compared to SABT, the proposed ASABT derives great improvement of 30.07%, 38.54%, 28.97%, and 9.37%, respectively. Compared to OOA, the proposed ASABT derives great improvement of 18.22%, 24.20%, 34.05%, and 50.43%, respectively.

4.3. Discussion

The simulation results demonstrate the effectiveness of the proposed ASABT in optimizing PV sources and shunt capacitors for energy efficiency improvement in distribution systems. The proposed ASABT derives great superiority over different compared techniques considering both a practical Egyptian distribution system and the standard IEEE 69-node systems. Two scenarios are investigated. The first one deals with the allocation of shunt capacitors only to minimize the power losses while the second one handles the allocations of simultaneous PV units and shunt capacitors to minimize the energy losses considering the variations in load and PV power productions.

4.3.1. Major Achievements

The proposed ASABT consistently outperforms the conventional SABT in minimizing both power losses and energy consumption across various scenarios and distribution feeder configurations. First, a practical Egyptian distribution system is considered. The results of the simulation show that the suggested ASABT has a significant 56.4% decrease in power losses over the original scenario using the capacitors only. Additionally, the voltage magnitudes have improved across the system, with the minimum voltage showing a notable 40.22% improvement. By incorporating PV units in addition to the capacitors, the energy losses are reduced from 26,227.31 to 10,554 kW/day with significant reductions of 59.75% and 4.26% compared to the initial case and the SABT, respectively. Also, the emissions produced from the substation are greatly reduced from 110,823.88 kgCO2 to 79,189 kgCO2 with a reduction of 28.54% compared to the initial case. Second, the standard IEEE 69-node system is added to the application. Comparable results indicate that ASABT significantly reduces power losses (5.61%) as compared to SABT. Additionally, the voltage magnitudes have improved throughout the system, with the minimum voltage showing a notable improvement of 2.38%. By incorporating PV units in addition to the capacitors, the results obtained from the ASABT demonstrate a substantial reduction in energy losses from 3784.568 to 1359.819 kW/day, achieving a remarkable reduction of 64.07% compared to the initial case. Consequently, the emissions generated from the substation are greatly reduced from 72,283.328 kgCO2 to 54,627.009 kgCO2 compared to the initial case. For both investigated systems, the proposed ASABT outcomes are compared with Coati optimization algorithm, the Osprey optimization algorithm (OOA), the dragonfly algorithm (DA), and the SABT methods, where the proposed ASABT shows superior outcomes especially in the standard deviation of the obtained losses.

4.3.2. Difficulties and Challenges

The study acknowledges that the proposed ASABT involves enhanced mechanisms, including collaborative learning and an adaptive constriction factor. The increased complexity may pose challenges in terms of computational efficiency and implementation in large-scale real-time systems. Also, the optimization of algorithm parameters, such as the number of search agents and maximum iterations, could be challenging. Fine-tuning these parameters for different distribution scenarios may require additional computational efforts.

4.3.3. Limitations

The study primarily focuses on minimizing power losses and energy consumption as single objectives. Future research could explore multi-objective optimization to address conflicting goals and trade-offs more comprehensively. The findings, although promising, are based on simulation results. Real-world validation on operational distribution systems would provide more concrete evidence of the algorithm’s practical applicability.

4.3.4. Suggestions for Future Research

  • Extending the ASABT algorithm to handle multiple objectives, such as economic cost, reliability, and environmental impact, would enhance its practical utility and relevance.
  • Conducting field trials and implementing the ASABT in operational distribution systems would validate its effectiveness in real-world conditions and provide insights into its scalability.
  • Exploring the integration of ASABT with emerging technologies, such as machine learning and advanced control systems, could further enhance its adaptability to dynamic and evolving distribution environments.

5. Conclusions

In an effort to enhance search capabilities, this study introduced an improved version of the augmented subtraction-average-based technique (ASABT), incorporating a shared learning mechanism that is reliant on the best solutions. The developed ASABT methodology specifically focuses on minimizing energy dissipation losses in power distribution systems through the optimization of photovoltaic (PV) distributed generation and shunt capacitors. This optimization is crucial for maximizing energy efficiency in power distribution networks globally. The results of the study offer several notable benefits in a global context:
  • Energy efficiency: the optimized approach, as demonstrated by the enhanced ASABT algorithm, contributes to minimizing energy dissipation losses in power distribution systems.
  • Environmental impact: the incorporation of PV distributed generation and shunt capacitors not only reduces power losses but also results in a substantial decrease in associated CO2 emissions.
  • Applicability across systems: the study’s findings, validated on both a practical Egyptian distribution system and the standard IEEE 69-node system, highlight the algorithm’s versatility and applicability across diverse distribution network configurations.
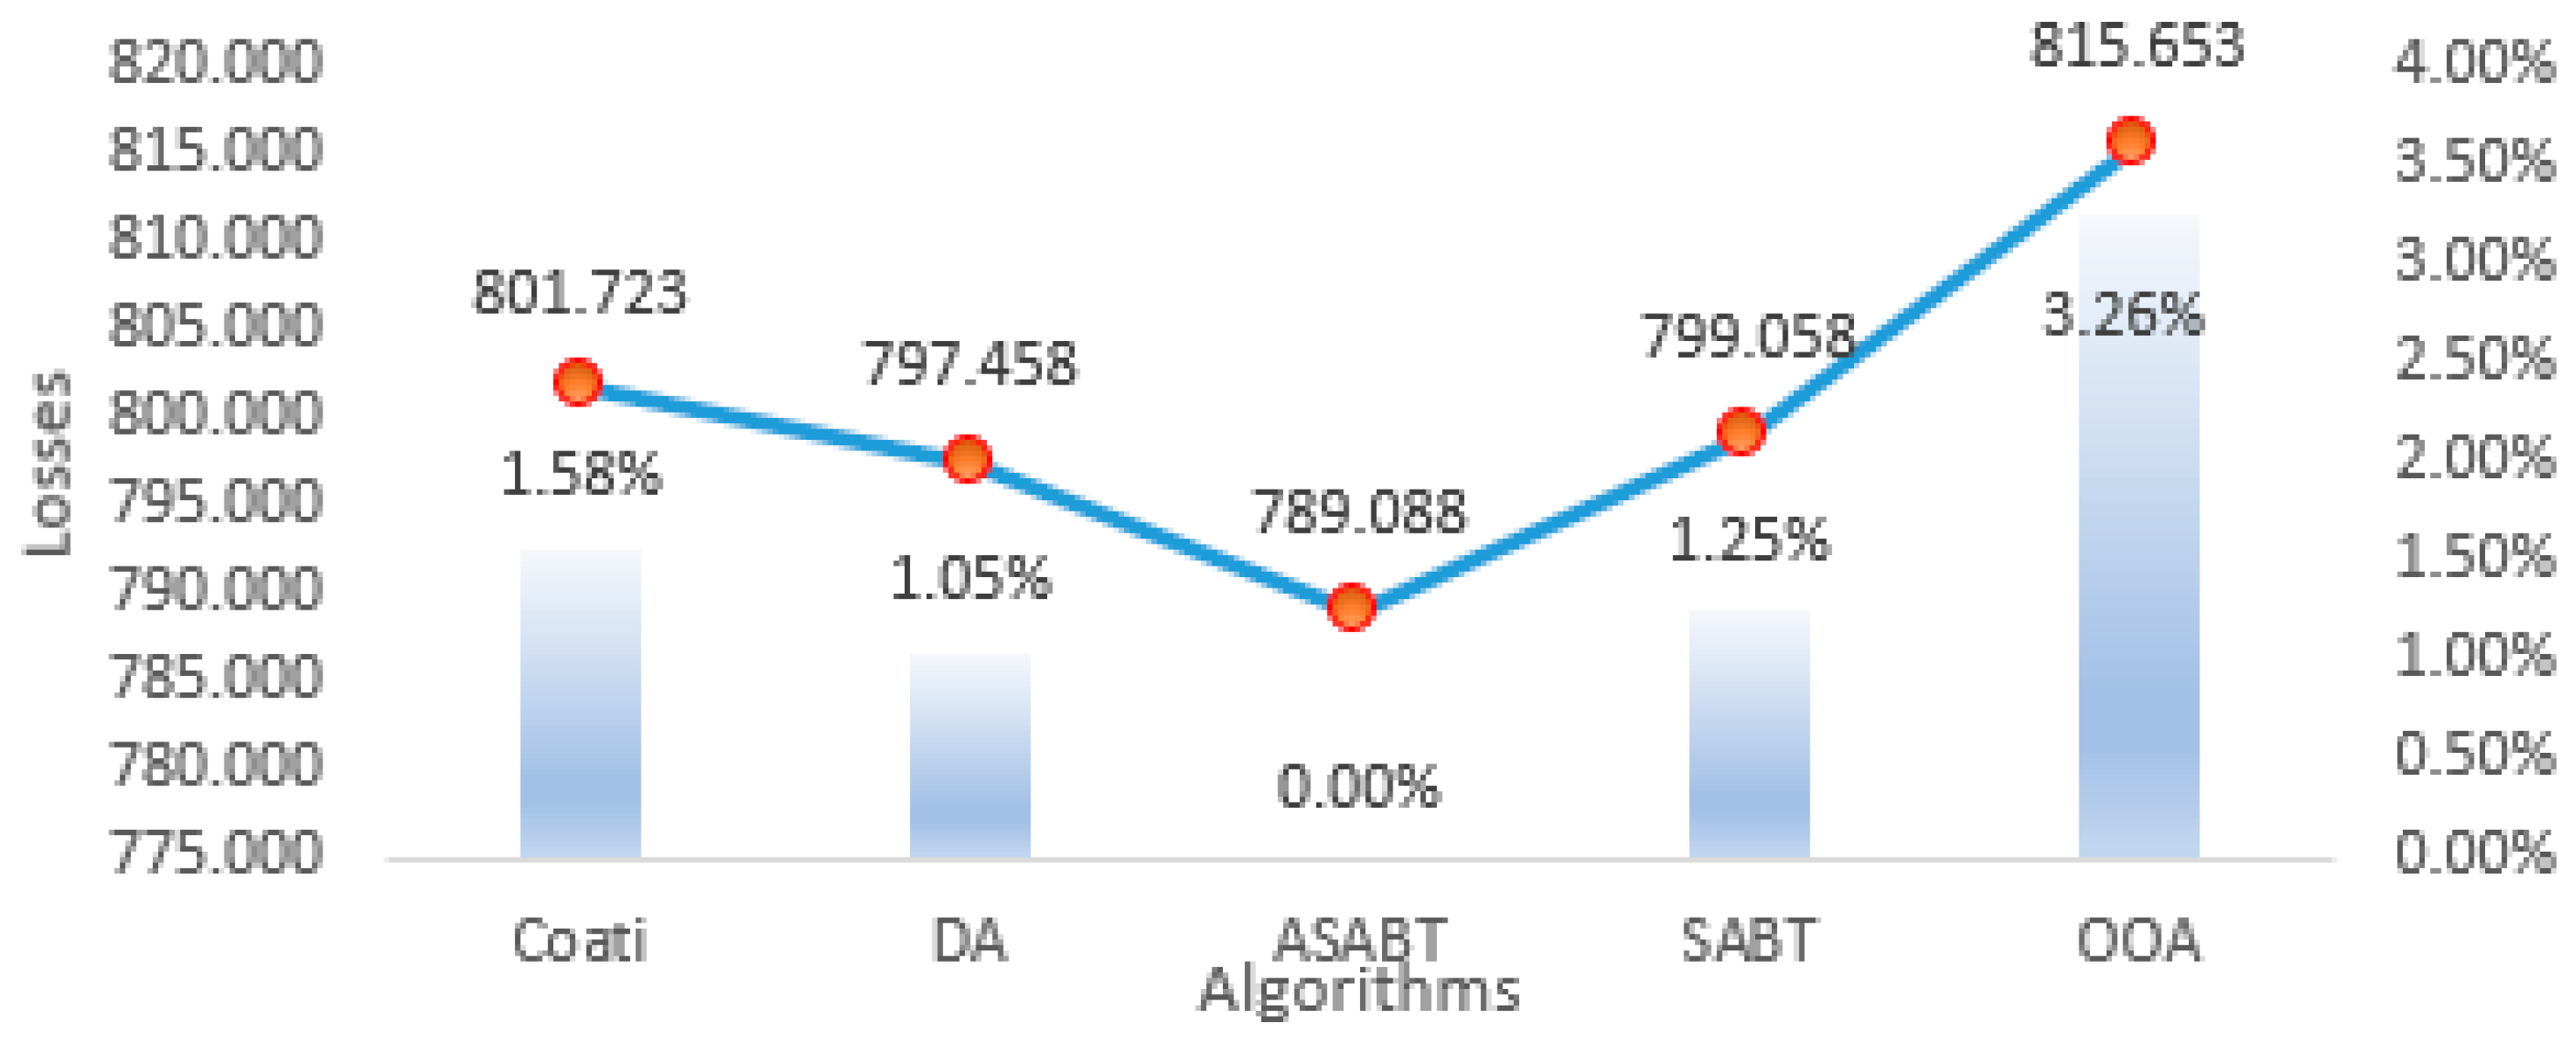
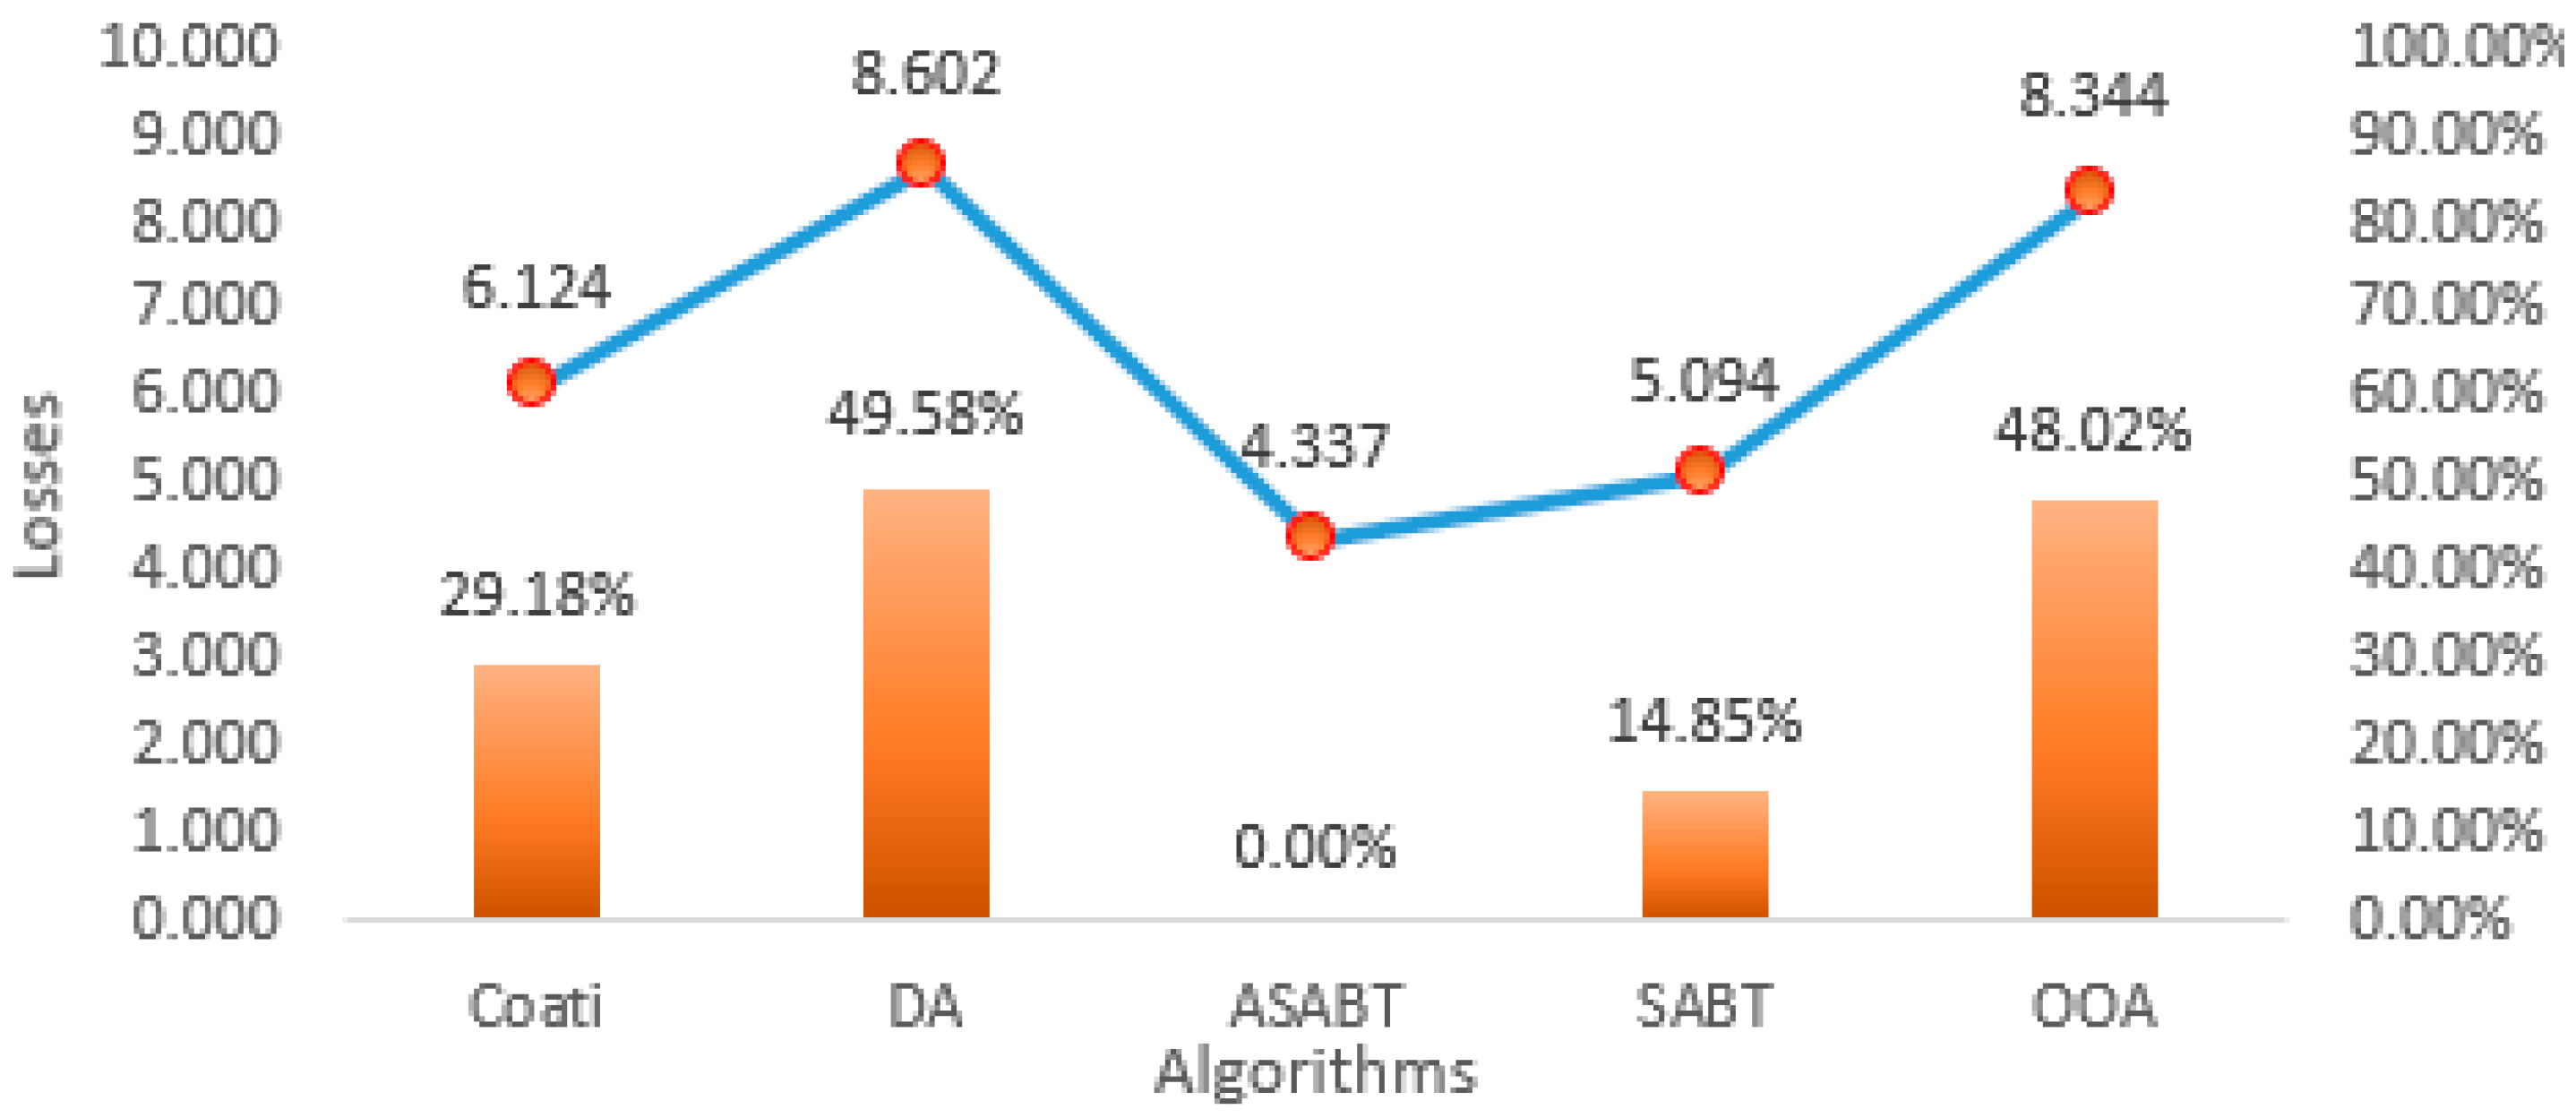
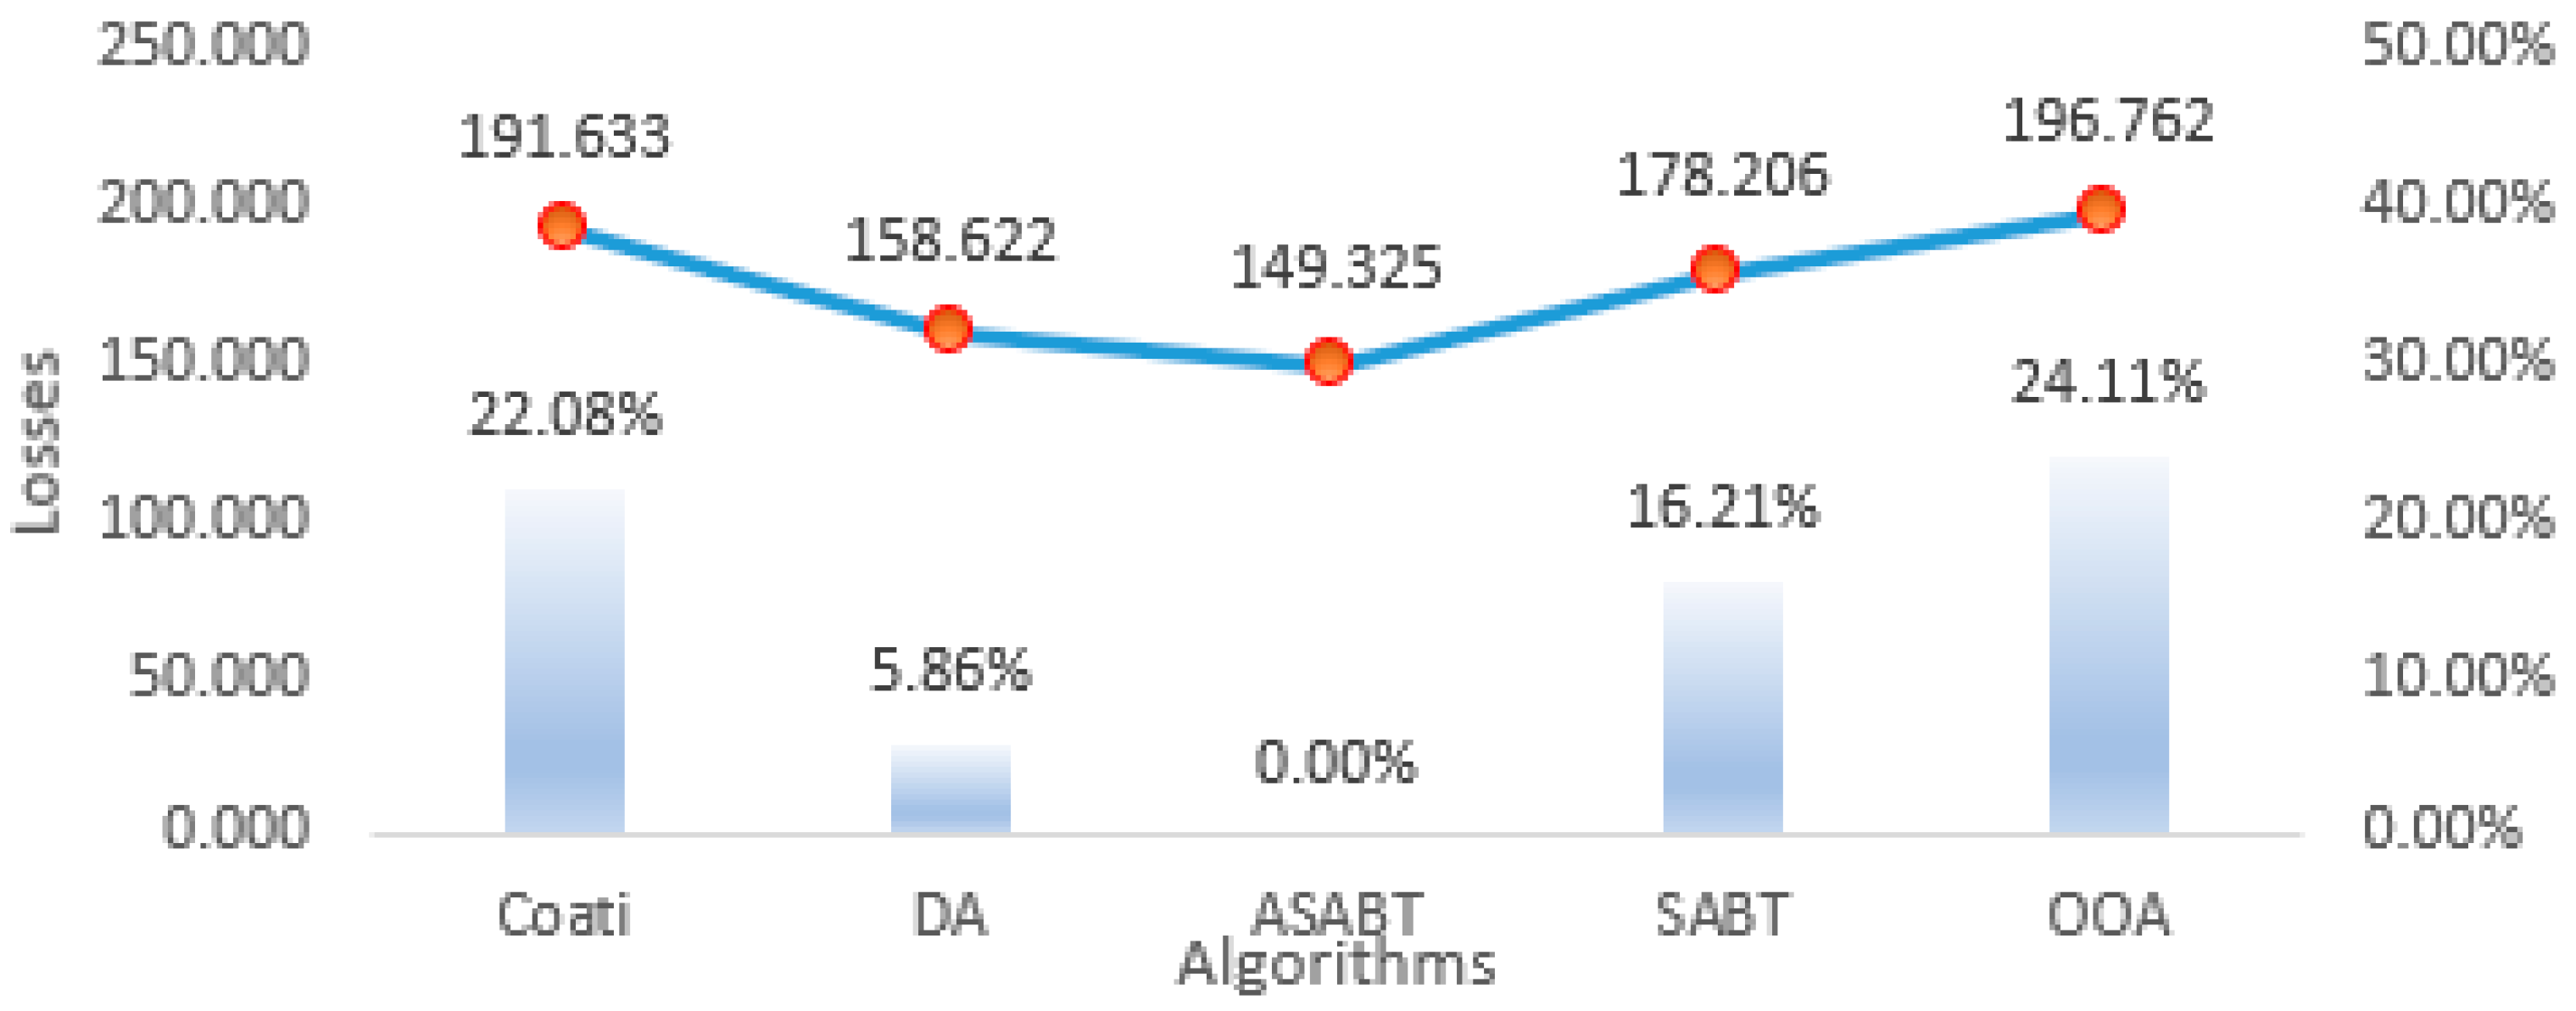
  • Competitive optimization approach: the comparative assessment with the Coati optimization algorithm, the Osprey optimization algorithm (OOA), and the dragonfly algorithm (DA) demonstrates the competitive performance of ASABT. Its effectiveness in minimizing power losses and improving voltage profiles positions it as a reliable and competitive optimization approach applicable to a wide range of power system scenarios globally.
  • Potential for integration: the incorporation of PV units in addition to the capacitor banks led to significant reduction in the grid power supply and substantial decrease in the associated CO2 emissions. However, the emissions were not taken into consideration as a mathematical target. Therefore, it is recommended that is it formulated as another objective function or additional constraint in future work.

Author Contributions

Conceptualization, H.S.E.M.; Methodology, A.M.S.; Software, A.M.S.; Validation, A.M.S.; Formal analysis, D.R.A.; Writing—original draft, H.S.E.M.; Writing—review & editing, D.R.A. and A.M.S.; Visualization, I.H.S.; Supervision, I.H.S. All authors have read and agreed to the published version of the manuscript.

Funding

This research was funded by the Deputyship for Research & Innovation, Ministry of Education in Saudi Arabia.

Data Availability Statement

Data are contained within the article.

Acknowledgments

The authors extend their appreciation to the Deputyship for Research and Innovation, Ministry of Education in Saudi Arabia for funding this research work through the project number ISP23-57.

Conflicts of Interest

The authors declare no conflict of interest.

References

  1. Mansouri, N.; Lashab, A.; Guerrero, J.M.; Cherif, A. Photovoltaic power plants in electrical distribution networks: A review on their impact and solutions. In IET Renewable Power Generation; John Wiley & Sons, Inc.: New York, NY, USA, 2020; Volume 14, pp. 2114–2125. [Google Scholar] [CrossRef]
  2. Leghari, Z.H.; Kumar, M.; Shaikh, P.H.; Kumar, L.; Tran, Q.T. A Critical Review of Optimization Strategies for Simultaneous Integration of Distributed Generation and Capacitor Banks in Power Distribution Networks. Energies 2022, 15, 8258. [Google Scholar] [CrossRef]
  3. Guzman-Henao, J.; Grisales-Noreña, L.F.; Restrepo-Cuestas, B.J.; Montoya, O.D. Optimal Integration of Photovoltaic Systems in Distribution Networks from a Technical, Financial, and Environmental Perspective. Energies 2023, 16, 562. [Google Scholar] [CrossRef]
  4. Ali, E.S.; Elazim, S.M.A.; Hakmi, S.H.; Mosaad, M.I. Optimal Allocation and Size of Renewable Energy Sources as Distributed Generations Using Shark Optimization Algorithm in Radial Distribution Systems. Energies 2023, 16, 3983. [Google Scholar] [CrossRef]
  5. Al-Dhaifallah, M.; Alaas, Z.; Rezvani, A.; Le, B.N.; Samad, S. Optimal day-ahead economic/emission scheduling of renewable energy resources based microgrid considering demand side management. J. Build. Eng. 2023, 76, 107070. [Google Scholar] [CrossRef]
  6. Alam, M.M.; Alshahrani, T.; Khan, F.; Hakami, J.; Shinde, S.M.; Azim, R. AI-based efficiency analysis technique for photovoltaic renewable energy system. Phys. Scr. 2023, 98, 126006. [Google Scholar] [CrossRef]
  7. Hachemi, A.T.; Sadaoui, F.; Arif, S.; Saim, A.; Ebeed, M.; Kamel, S.; Jurado, F.; Mohamed, E.A. Modified reptile search algorithm for optimal integration of renewable energy sources in distribution networks. Energy Sci. Eng. 2013, 11, 4635–4665. [Google Scholar] [CrossRef]
  8. Aref, M.; Oboskalov, V.; El-Shahat, A.; Abdelaziz, A.Y. Modified Analytical Technique for Multi-Objective Optimal Placement of High-Level Renewable Energy Penetration Connected to Egyptian Power System. Mathematics 2023, 11, 958. [Google Scholar] [CrossRef]
  9. Amin, A.; Ebeed, M.; Nasrat, L.; Aly, M.; Ahmed, E.M.; Mohamed, E.A.; Alnuman, H.H.; Abd El Hamed, A.M. Techno-Economic Evaluation of Optimal Integration of PV Based DG with DSTATCOM Functionality with Solar Irradiance and Loading Variations. Mathematics 2022, 10, 2543. [Google Scholar] [CrossRef]
  10. Ebeed, M.; Hashem, M.; Aly, M.; Kamel, S.; Jurado, F.; Mohamed, E.A.; Abd El Hamid, A.M. Optimal integrating inverter-based PVs with inherent DSTATCOM functionality for reliability and security improvement at seasonal uncertainty. Sol. Energy 2024, 267, 112200. [Google Scholar] [CrossRef]
  11. Soma, G.G. Optimal Sizing and Placement of Capacitor Banks in Distribution Networks Using a Genetic Algorithm. Electricity 2021, 2, 187–204. [Google Scholar] [CrossRef]
  12. Iyer, A.A.; Patel, C.D. Optimal Placement of Distributed Energy Resources and Shunt Capacitors with Consideration of Existing On-line tap changer using Honey Badger Optimization. In Proceedings of the 2023 Third International Conference on Advances in Electrical, Computing, Communication and Sustainable Technologies (ICAECT), Bhilai, India, 15 May 2023. [Google Scholar] [CrossRef]
  13. Shaheen, A.M.; El-Sehiemy, R.A.; Farrag, S.M. Optimal reactive power dispatch using backtracking search algorithm. Aust. J. Electr. Electron. Eng. 2016, 13, 200–210. [Google Scholar] [CrossRef]
  14. Tahir, M.J.; Rasheed, M.B.; Rahmat, M.K. Optimal Placement of Capacitors in Radial Distribution Grids via Enhanced Modified Particle Swarm Optimization. Energies 2022, 15, 2452. [Google Scholar] [CrossRef]
  15. Mahesh, K.; Nallagownden, P.; Elamvazuthi, I. Optimal placement and sizing of renewable distributed generations and capacitor banks into radial distribution systems. Energies 2017, 10, 811. [Google Scholar] [CrossRef]
  16. Sultana, S.; Roy, P.K. Capacitor placement in radial distribution system using oppositional cuckoo optimization algorithm. Int. J. Swarm Intell. Res. 2018, 9, 103. [Google Scholar] [CrossRef]
  17. Neagu, B.C.; Ivanov, O.; Gavrila, M. A comprehensive solution for optimal capacitor allocation problem in real distribution networks. In Proceedings of the 2017 11th International Conference on Electromechanical and Power Systems (SIELMEN), Iasi, Romania, 11–13 October 2017. [Google Scholar] [CrossRef]
  18. Villa-Acevedo, W.M.; López-Lezama, J.M.; Valencia-Velásquez, J.A. A novel constraint handling approach for the optimal reactive power dispatch problem. Energies 2018, 11, 2352. [Google Scholar] [CrossRef]
  19. Gil-González, W.; Montoya, O.D.; Rajagopalan, A.; Grisales-Noreña, L.F.; Hernández, J.C. Optimal selection and location of fixed-step capacitor banks in distribution networks using a discrete version of the vortex search algorithm. Energies 2020, 13, 4914. [Google Scholar] [CrossRef]
  20. Díaz, P.; Pérez-Cisneros, M.; Cuevas, E.; Camarena, O.; Martinez, F.A.F.; González, A. A swarm approach for improving voltage profiles and reduce power loss on electrical distribution networks. IEEE Access 2018, 6, 49498–49512. [Google Scholar] [CrossRef]
  21. Prakash, D.B.; Lakshminarayana, C. Optimal siting of capacitors in radial distribution network using Whale Optimization Algorithm. Alex. Eng. J. 2017, 56, 499–509. [Google Scholar] [CrossRef]
  22. Askarzadeh, A. Capacitor placement in distribution systems for power loss reduction and voltage improvement: A new methodology. IET Gener. Transm. Distrib. 2016, 10, 3631–3638. [Google Scholar] [CrossRef]
  23. Da Silva, D.J.; Belati, E.A.; Angelos, E.W.S.D. Fpaes: A hybrid approach for the optimal placement and sizing of reactive compensation in distribution grids. Energies 2020, 13, 6409. [Google Scholar] [CrossRef]
  24. Gandoman, F.H.; Ahmadi, A.; Sharaf, A.M.; Siano, P.; Pou, J.; Hredzak, B.; Agelidis, V.G. Review of FACTS technologies and applications for power quality in smart grids with renewable energy systems. Renew. Sustain. Energy Rev. 2017, 82, 502–514. [Google Scholar] [CrossRef]
  25. Shaheen, A.M.; Elattar, E.E.; Nagem, N.A.; Nasef, A.F. Allocation of PV Systems with Volt/Var Control Based on Automatic Voltage Regulators in Active Distribution Networks. Sustainability 2023, 15, 15634. [Google Scholar] [CrossRef]
  26. Chamana, M.; Chowdhury, B.H. Optimal Voltage Regulation of Distribution Networks With Cascaded Voltage Regulators in the Presence of High PV Penetration. IEEE Trans. Sustain. Energy 2018, 9, 1427–1436. [Google Scholar] [CrossRef]
  27. Liu, Y.; Li, J.; Wu, L. Coordinated Optimal Network Reconfiguration and Voltage Regulator/DER Control for Unbalanced Distribution Systems. IEEE Trans. Smart Grid 2019, 10, 2912–2922. [Google Scholar] [CrossRef]
  28. Elshahed, M.; Tolba, M.A.; El-Rifaie, A.M.; Ginidi, A.; Shaheen, A.; Mohamed, S.A. An Artificial Rabbits’ Optimization to Allocate PVSTATCOM for Ancillary Service Provision in Distribution Systems. Mathematics 2023, 11, 339. [Google Scholar] [CrossRef]
  29. Khodr, H.M.; Olsina, F.G.; De Jesus, P.M.D.O.; Yusta, J.M. Maximum savings approach for location and sizing of capacitors in distribution systems. Electr. Power Syst. Res. 2008, 78, 1192–1203. [Google Scholar] [CrossRef]
  30. Trojovský, P.; Dehghani, M. Subtraction-Average-Based Optimizer: A New Swarm-Inspired Metaheuristic Algorithm for Solving Optimization Problems. Biomimetics 2023, 8, 149. [Google Scholar] [CrossRef] [PubMed]
  31. Dehghani, M.; Montazeri, Z.; Trojovská, E.; Trojovský, P. Coati Optimization Algorithm: A new bio-inspired metaheuristic algorithm for solving optimization problems. Knowl. Based Syst. 2023, 259, 110011. [Google Scholar] [CrossRef]
  32. Dehghani, M.; Trojovský, P. Osprey optimization algorithm: A new bio-inspired metaheuristic algorithm for solving engineering optimization problems. Front. Mech. Eng. 2023, 8, 1126450. [Google Scholar] [CrossRef]
  33. Mirjalili, S. Dragonfly algorithm: A new meta-heuristic optimization technique for solving single-objective, discrete, and multi-objective problems. Neural Comput. Appl. 2016, 27, 1053–1073. [Google Scholar] [CrossRef]
  34. Nasef, A.; Shaheen, A.; Khattab, H. Local and remote control of automatic voltage regulators in distribution networks with different variations and uncertainties: Practical cases study. Electr. Power Syst. Res. 2022, 205, 107773. [Google Scholar] [CrossRef]
  35. Moustafa, G.; El-Rifaie, A.M.; Smaili, I.H.; Ginidi, A.; Shaheen, A.M.; Youssef, A.F.; Tolba, M.A. An Enhanced Dwarf Mongoose Optimization Algorithm for Solving Engineering Problems. Mathematics 2023, 11, 3297. [Google Scholar] [CrossRef]
  36. Moustafa, G.; Tolba, M.A.; El-Rifaie, A.M.; Ginidi, A.; Shaheen, A.M.; Abid, S. A Subtraction-Average-Based Optimizer for Solving Engineering Problems with Applications on TCSC Allocation in Power Systems. Biomimetics 2023, 8, 332. [Google Scholar] [CrossRef] [PubMed]
  37. El-Ela, A.A.A.; El-Sehiemy, R.A.; Shaheen, A.M.; Wahbi, W.A.; Mouwafi, M.T. A multi-objective equilibrium optimization for optimal allocation of batteries in distribution systems with lifetime maximization. J. Energy Storage 2022, 55, 10597. [Google Scholar]
  38. Abdelsalam, A.A.; Mansour, H.S.E. Optimal Allocation and Hourly Scheduling of Capacitor Banks Using Sine Cosine Algorithm for Maximizing Technical and Economic Benefits. Electr. Power Compon. Syst. 2019, 47, 1025–1039. [Google Scholar] [CrossRef]
Figure 1. ASABT flowchart for optimizing the PV units and shunt capacitors in distribution feeders.
Mathematics 12 00625 g001
Figure 2. Egyptian 37-node system.
Mathematics 12 00625 g002
Figure 3. Convergences of the ASABT and SABT for solving scenario 1.
Mathematics 12 00625 g003
Figure 4. Voltage profile over the system based on the ASABT in solving scenario 1 versus the initial case.
Mathematics 12 00625 g004
Figure 5. Best losses obtained by Coati, DA, ASABT, SABT, and OOA for scenario 1 and the improving percentage compared to ASABT.
Mathematics 12 00625 g005
Figure 6. Mean losses obtained by Coati, DA, ASABT, SABT, and OOA for scenario 1 and the improving percentage compared to ASABT.
Mathematics 12 00625 g006
Figure 7. Worst losses obtained by Coati, DA, ASABT, SABT, and OOA for scenario 1 and the improving percentage compared to ASABT.
Mathematics 12 00625 g007
Figure 8. Standard deviation of the obtained losses by Coati, DA, ASABT, SABT, and OOA for scenario 1 and the improving percentage compared to ASABT.
Mathematics 12 00625 g008
Figure 9. Hourly loading variations.
Mathematics 12 00625 g009
Figure 10. Hourly PV generation variation at the selected buses using the proposed ASABT.
Mathematics 12 00625 g010
Figure 11. Obtained hourly losses based on the PV units and capacitors allocated by the SABT and the proposed ASABT and the regarding improvement percentage.
Mathematics 12 00625 g011
Figure 12. Average convergences of the ASABT, SABT, Coati, OOA, and DA for scenario 2.
Mathematics 12 00625 g012
Figure 13. IEEE 69-node system.
Mathematics 12 00625 g013
Figure 14. Convergences of the ASABT and SABT for solving scenario 3.
Mathematics 12 00625 g014
Figure 15. Voltage profile over the system based on the ASABT in solving scenario 3 versus the initial case.
Mathematics 12 00625 g015
Figure 16. Best losses obtained by Coati, DA, ASABT, SABT, and OOA for scenario 3 and the improving percentage compared to ASABT.
Mathematics 12 00625 g016
Figure 17. Mean losses obtained by Coati, DA, ASABT, SABT, and OOA for scenario 3 and the improving percentage compared to ASABT.
Mathematics 12 00625 g017
Figure 18. Worst losses obtained by Coati, DA, ASABT, SABT, and OOA for scenario 3 and the improving percentage compared to ASABT.
Mathematics 12 00625 g018
Figure 19. Standard deviation of the obtained losses by Coati, DA, ASABT, SABT, and OOA for scenario 3 and the improving percentage compared to ASABT.
Mathematics 12 00625 g019
Figure 20. Hourly losses of the initial case and the proposed ASABT.
Mathematics 12 00625 g020
Figure 21. Hourly losses of the proposed ASABT and the standard SABT.
Mathematics 12 00625 g021
Figure 22. Average convergences of the ASABT, SABT, Coati, OOA, and DA for scenario 4.
Mathematics 12 00625 g022
Table 1. Obtained capacitors locations and sizes by the ASABT and SABT for the first scenario.
AlgorithmsInitialProposed ASABTSABT
Parameters-Location (node)Size (kVAr)Location (node)Size (kVAr)
Allocation of Capacitors-4135041200
-560091350
-6120012750
-111650171200
-2560026750
Total installed Capacity-5400 kVAr5250 kVAr
Losses1766.2 kW767.957 kW772.08 kW
Table 2. The obtained capacitors locations and sizes arranged by the ASABT and SABT for the second scenario.
AlgorithmsInitialProposed ASABTSABT
Parameters-Location (node)SizeLocation (node)Size
Allocation of PV distributed units-6974 kW12521 kW
-10559 kW15546 kW
-21445 kW16453 kW
-25726 kW29563 kW
-29497 kW37738 kW
Allocation of capacitors-71363 kVAr101696 kVAr
-8219 kVAr11869 kVAr
-141077 kVAr18966 kVAr
-161469 kVAr231390 kVAr
-25897 kVAr
Energy losses/day (kWday)26,227.309610,55411,024.55275
Table 3. Statistica data regarding the daily losses (kW/day) of the compared algorithms for the second scenario.
ASABTCoatiDASABTOOA
Best10,554.0510,715.7710,653.4211,369.1610,964.46
Improve in Best %-1.51%0.93%7.17%3.74%
Mean10,887.3311,663.5811,058.1811,889.0211,918.46
Improve in Mean %-6.66%1.55%8.43%8.65%
Worst11,390.6912,457.7111,962.7812,425.3512,768.1
Improve in Worst %-8.57%4.78%8.33%10.79%
Standard Deviation (STd)268.12514.0318332.08293.5009396.2263
Improve in STd %-47.84%19.26%8.65%32.33%
Table 4. Obtained capacitors locations and sizes by the ASABT and SABT for the third scenario.
AlgorithmsInitialProposed ASABTSABT
Parameters-Location (node)Size (kVAr)Location (node)Size (kVAr)
Allocation of Capacitors-4960057900
-11300281650
-1830019450
-61120046300
- 62600
Total installed Capacity-2400 kVAr3900 kVAr
Losses224.94 kW144.449 kW153.064 kW
Table 5. Obtained capacitors locations and sizes by the ASABT and SABT for the fourth scenario.
AlgorithmsInitialProposed ASABTSABT
Parameters-Location (node)SizeLocation (node)Size
Allocation of PV distributed units-10141 kW34252 kW
-58292 kW4546 kW
-61911 kW57957 kW
-62426 kW58923 kW
-64764 kW64524 kW
Allocation of capacitors-21328 kVAr4349 kVAr
-1497 kVAr51811 kVAr
-36465 kVAr291522 kVAr
-61936 kVAr63897 kVAr
-67409 kVAr
Energy losses/day (kWday)3784.5681359.8196381660.336971
Table 6. Statistica data regarding the daily losses (kW/day) of the compared algorithms for scenario 4.
ASABTCoatiDASABTOOA
Best1359.8196381773.1378071437.5886241962.2689711662.829212
Improve in Best %-23.31%5.41%30.70%18.22%
Mean1544.7192532293.562771772.5567972513.5629262037.824553
Improve in Mean %-32.65%12.85%38.54%24.20%
Worst2101.8297292844.6827062138.0205032959.1838883187.036325
Improve in Worst %-26.11%1.69%28.97%34.05%
Standard Deviation (STd)204.3140806290.6380761221.5006561225.4343624412.1774451
Improve in STd %-29.70%7.76%9.37%50.43%
Disclaimer/Publisher’s Note: The statements, opinions and data contained in all publications are solely those of the individual author(s) and contributor(s) and not of MDPI and/or the editor(s). MDPI and/or the editor(s) disclaim responsibility for any injury to people or property resulting from any ideas, methods, instructions or products referred to in the content.

