

Enhancing Medical Decision Making: A Semantic Technology-Based Framework for Efficient Diagnosis Inference
Abstract
1. Introduction
2. Background and Prior Work
2.1. Background
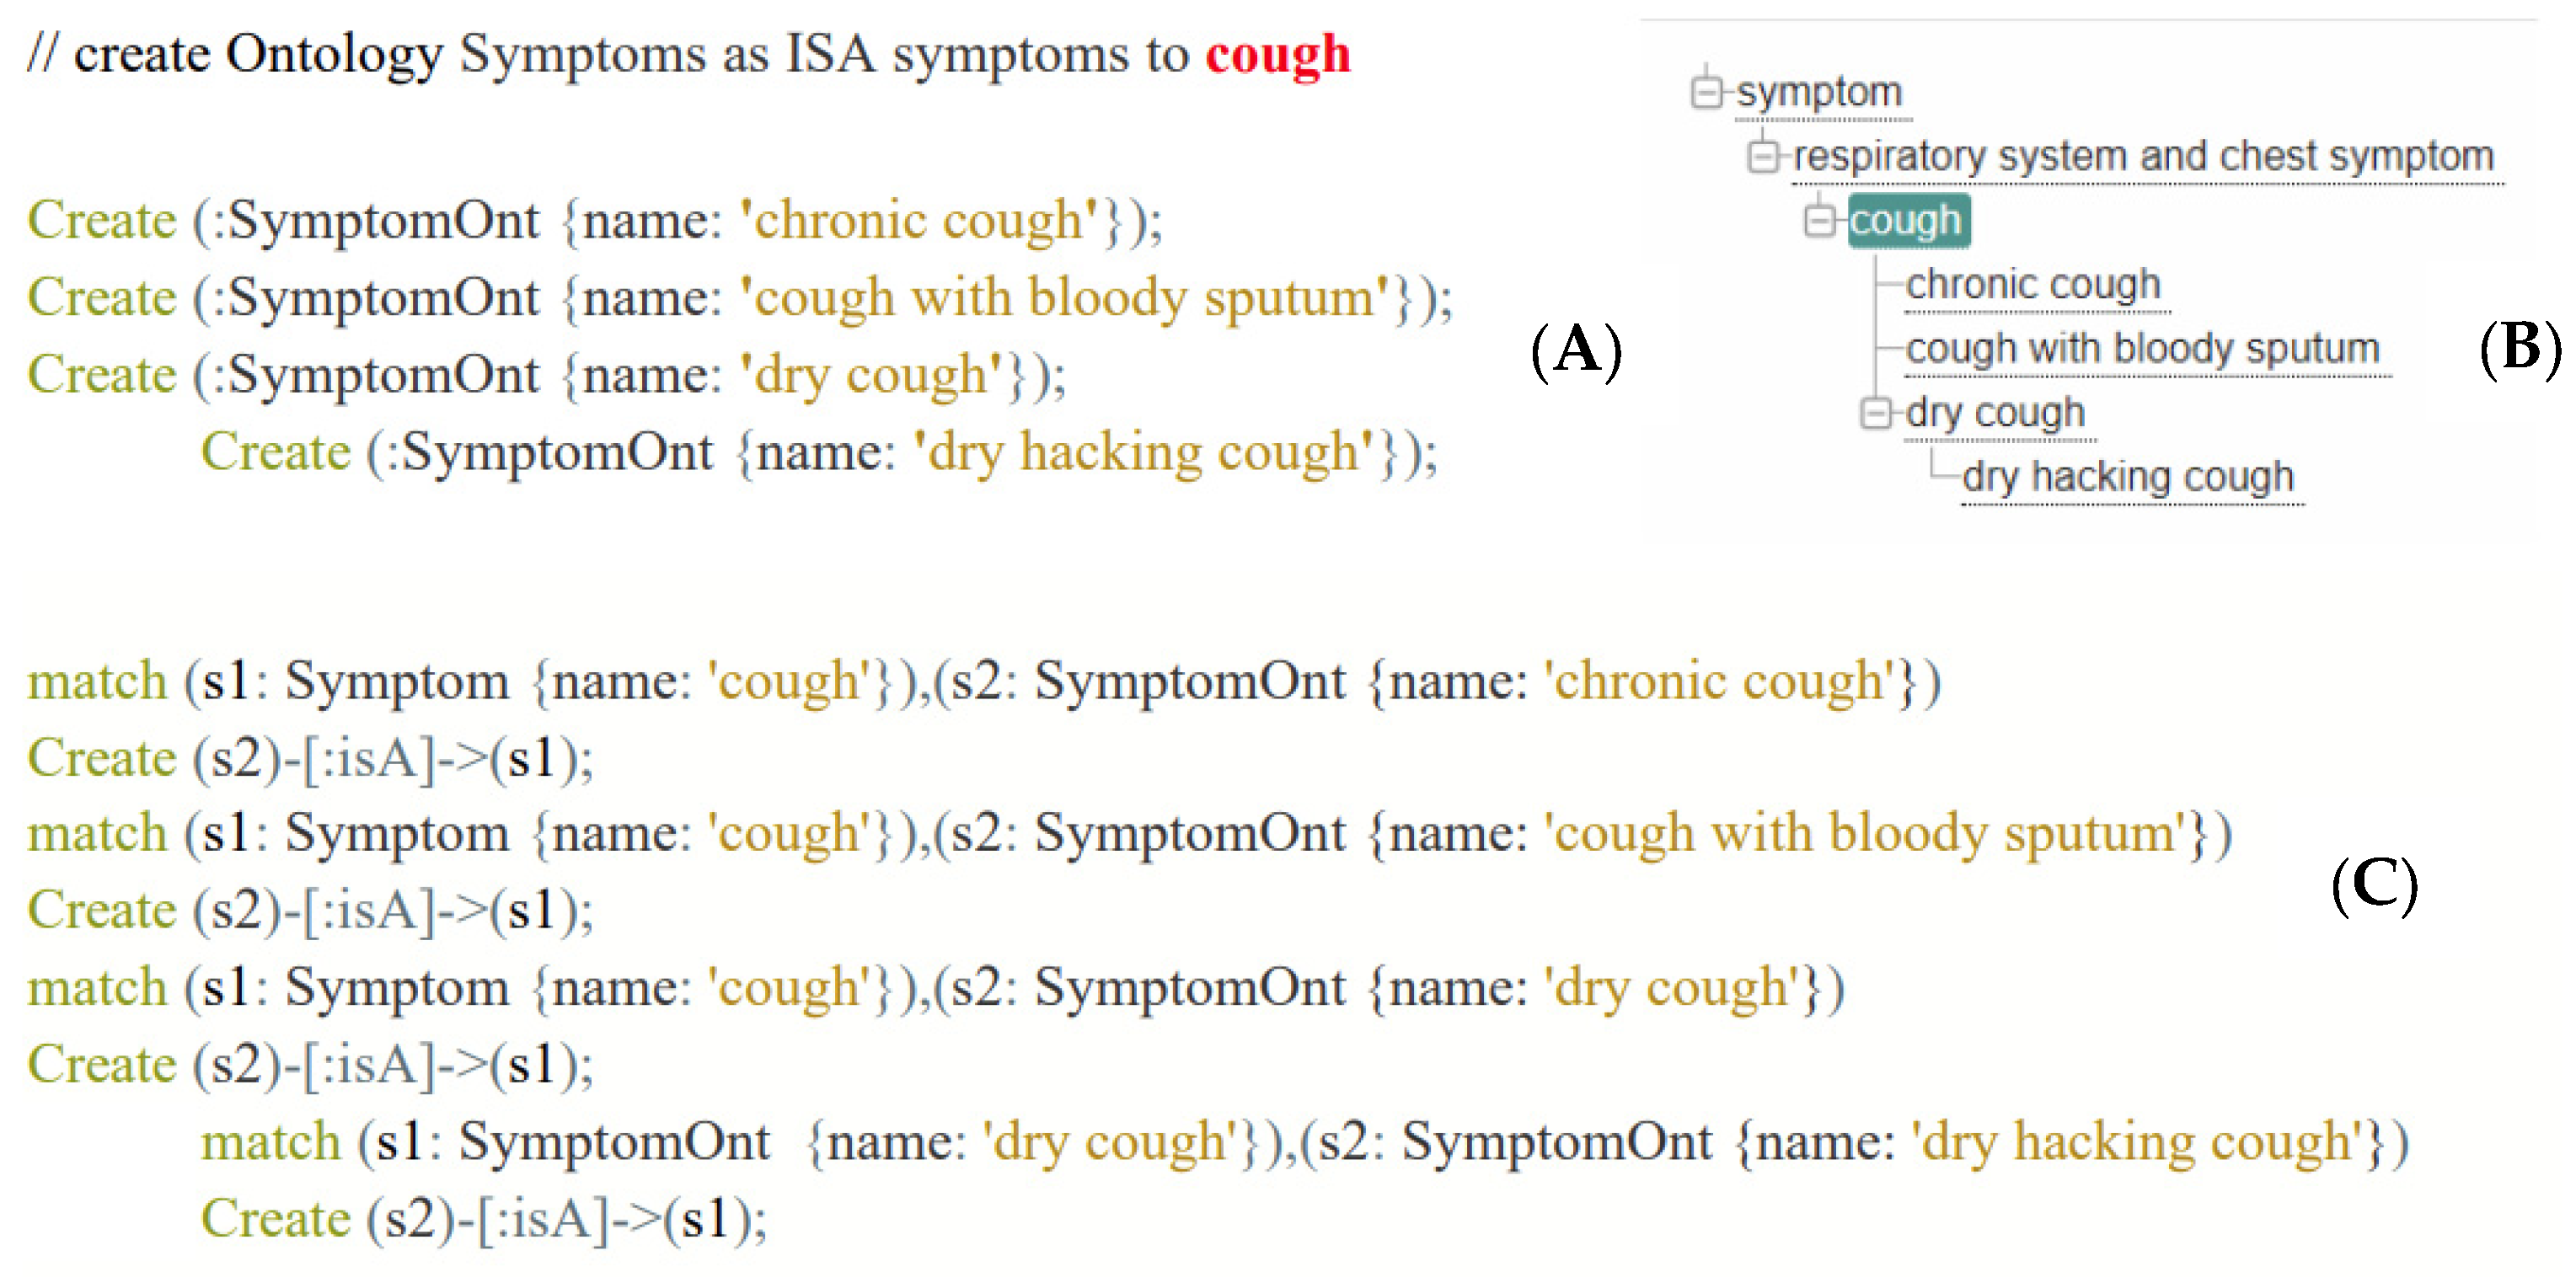
2.1.1. Ontology
2.1.2. Semantic Technology and Graph Reasoning
2.2. Prior Works
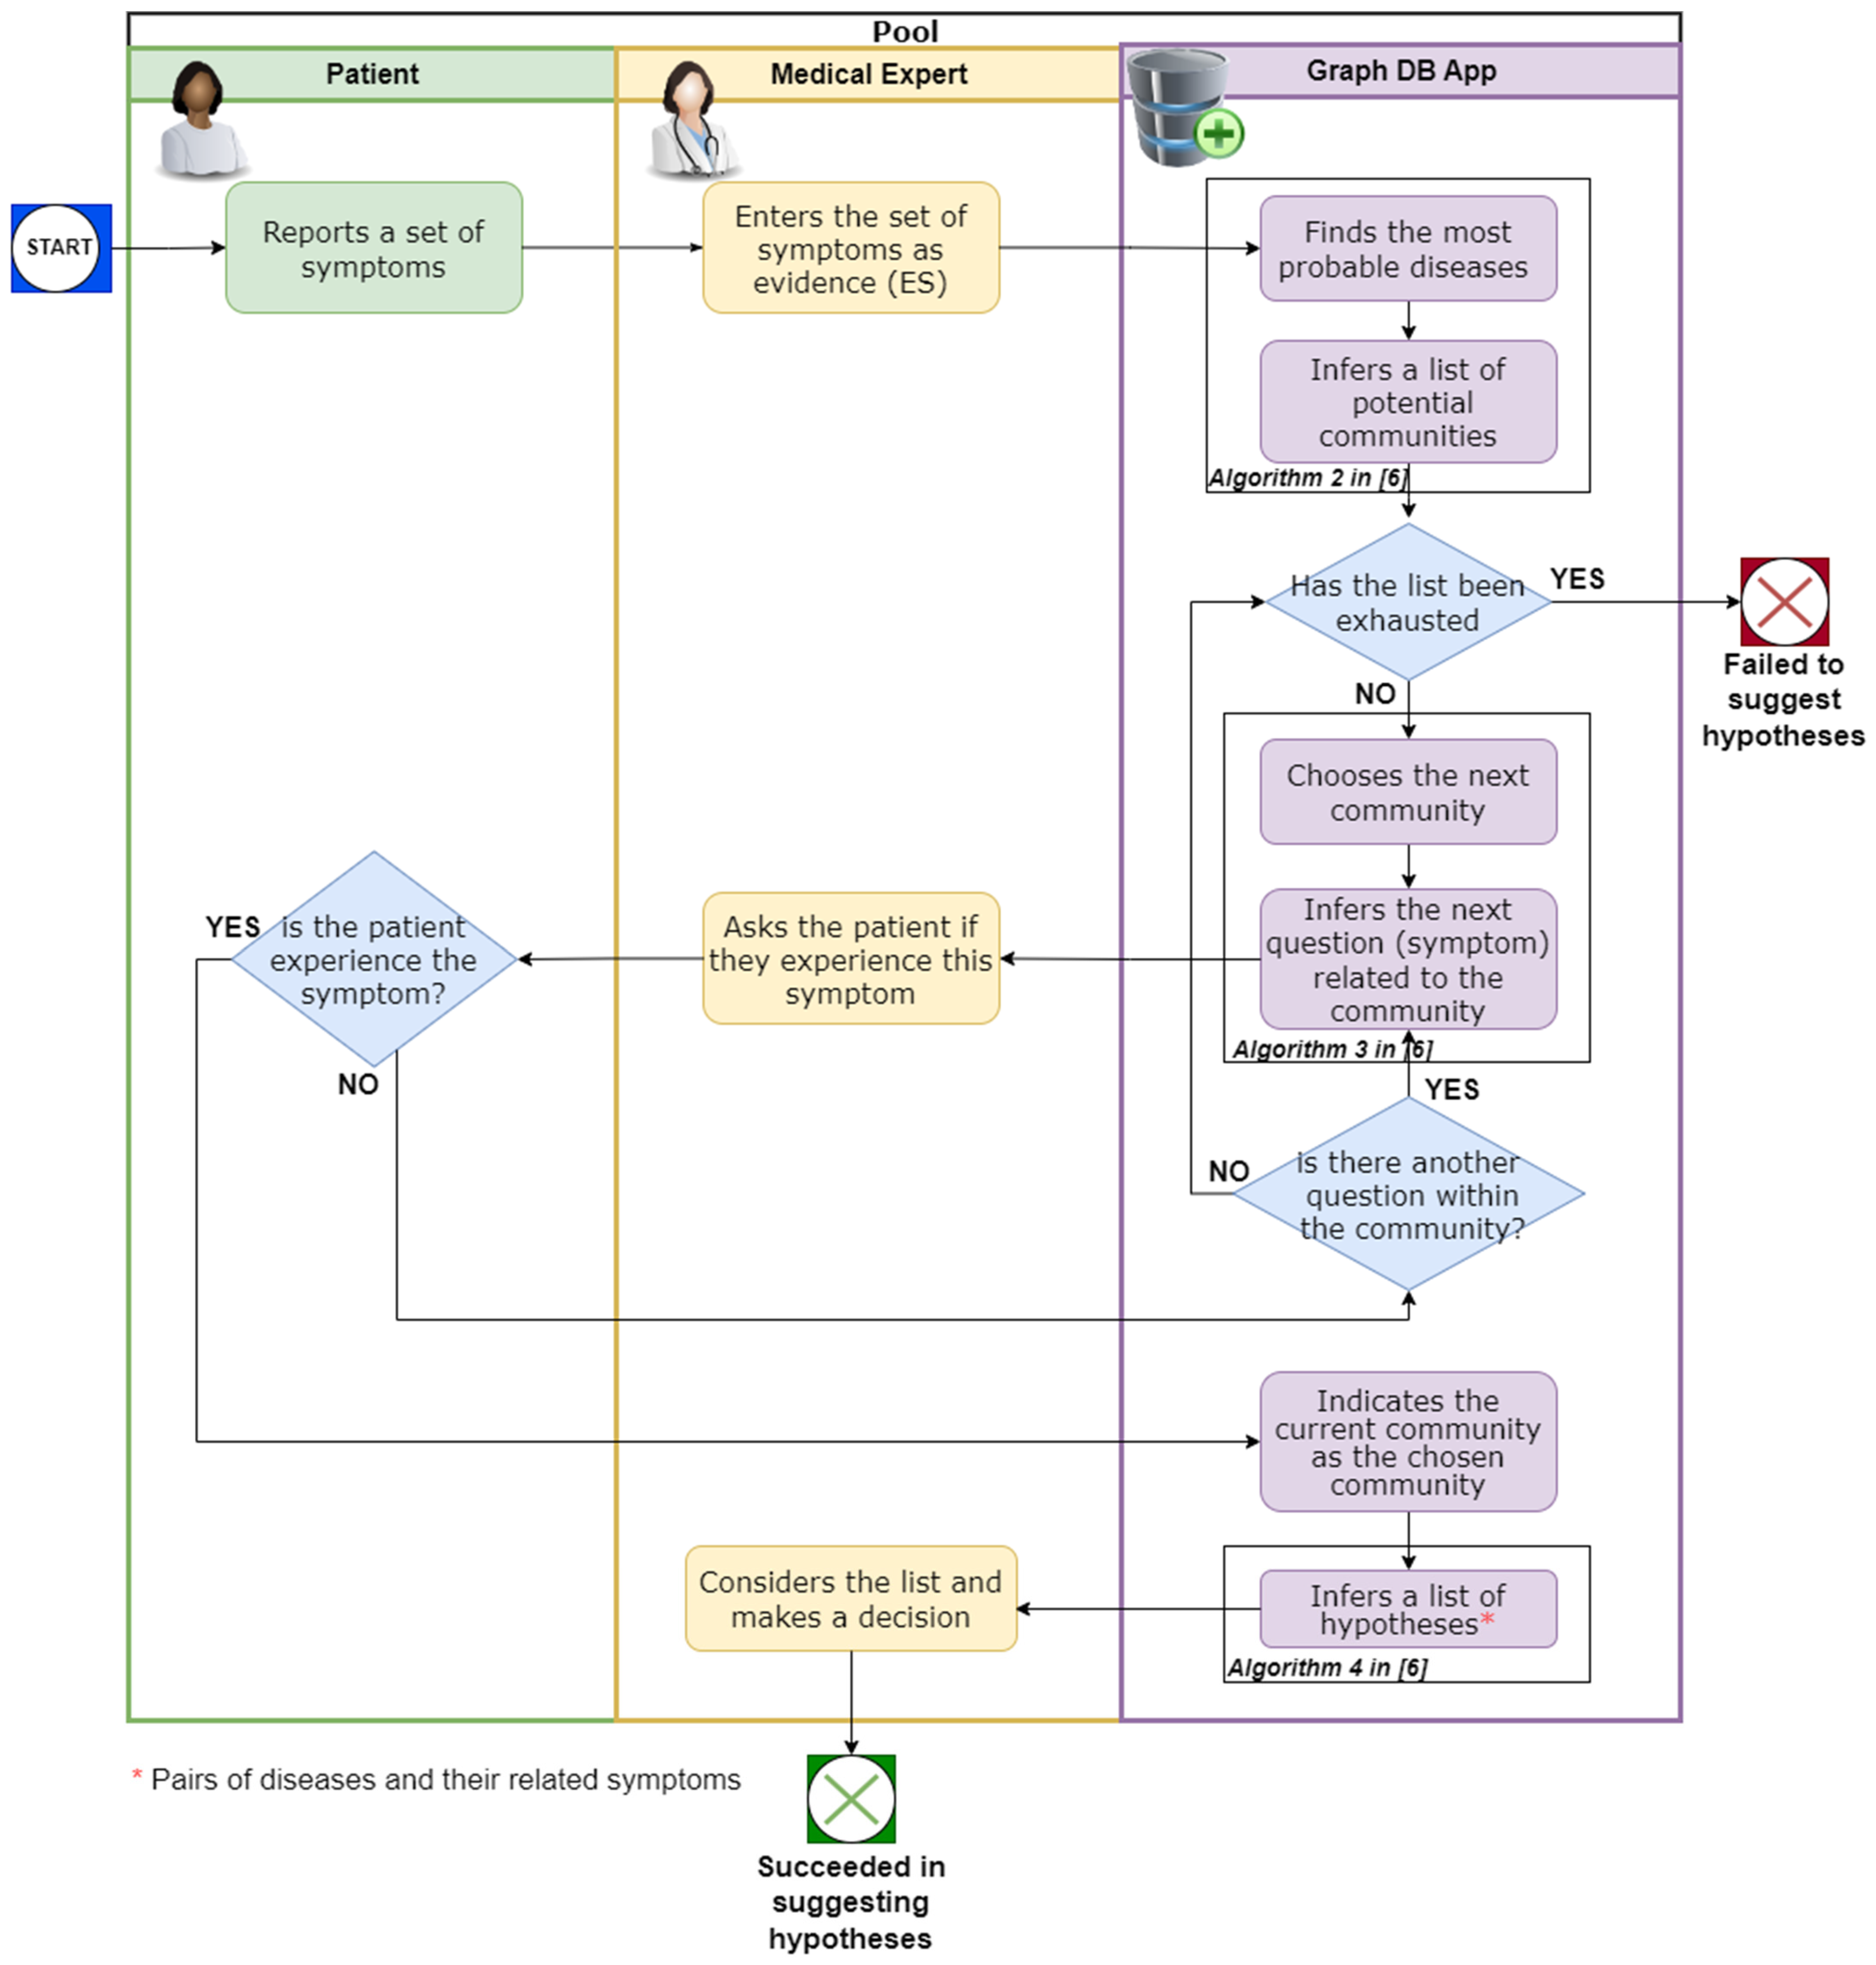
3. The Framework
4. Framework Evaluation
4.1. Implementation Details
4.2. DataSet Description
4.3. Applying the Framework on the Dataset
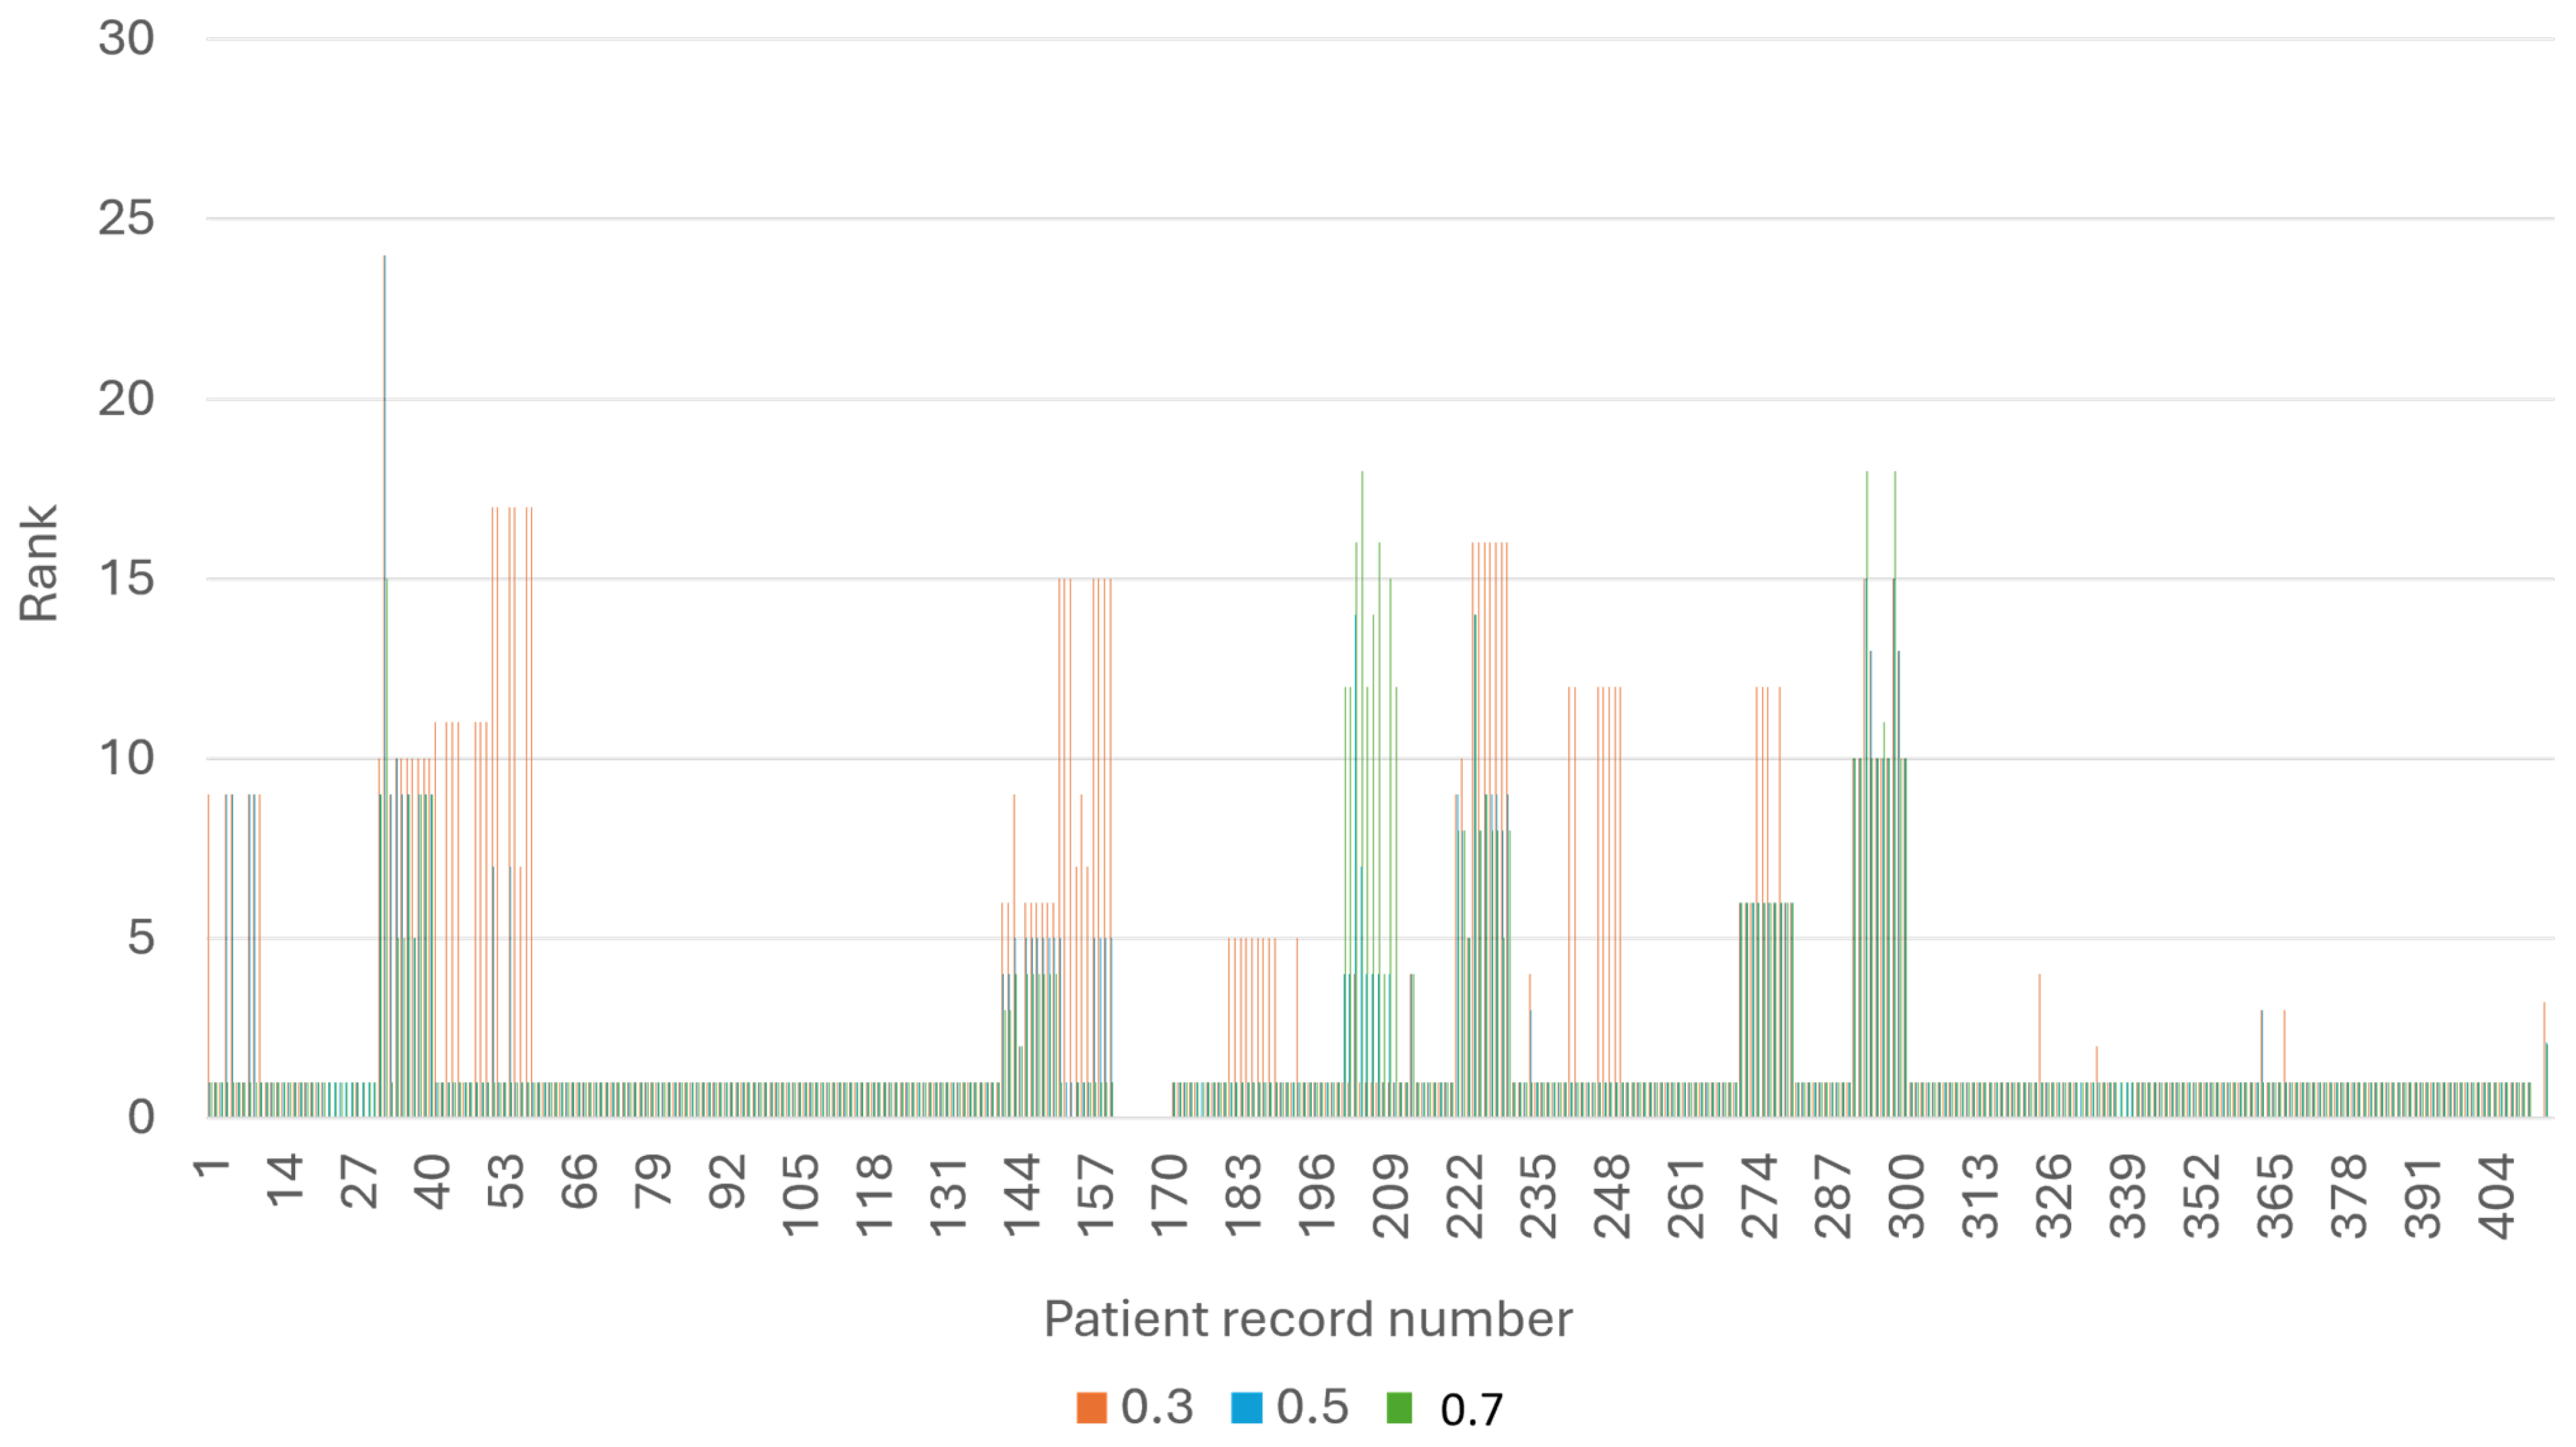
4.4. Evaluation Measures
5. Enriching the Framework with Semantic Technology
5.1. Knowledge Graph Enhancement
| Algorithm 1: Add Symptom Nodes to the KG |
| Input: KG, SYMP |
| Output: KG |
| Algorithm: |
| For all edges ) in SYMP, such that and |
| Add as a symptom node to KG. |
| Algorithm 2: Add ISA Relations between Symptoms in the KG, according to the Ontology |
| Input: KG, SYMP |
| Output: enhanced KG |
| Algorithm: |
| For all edges ) in and |
| Add the edge to KG, labeled ISA. |
- (i)
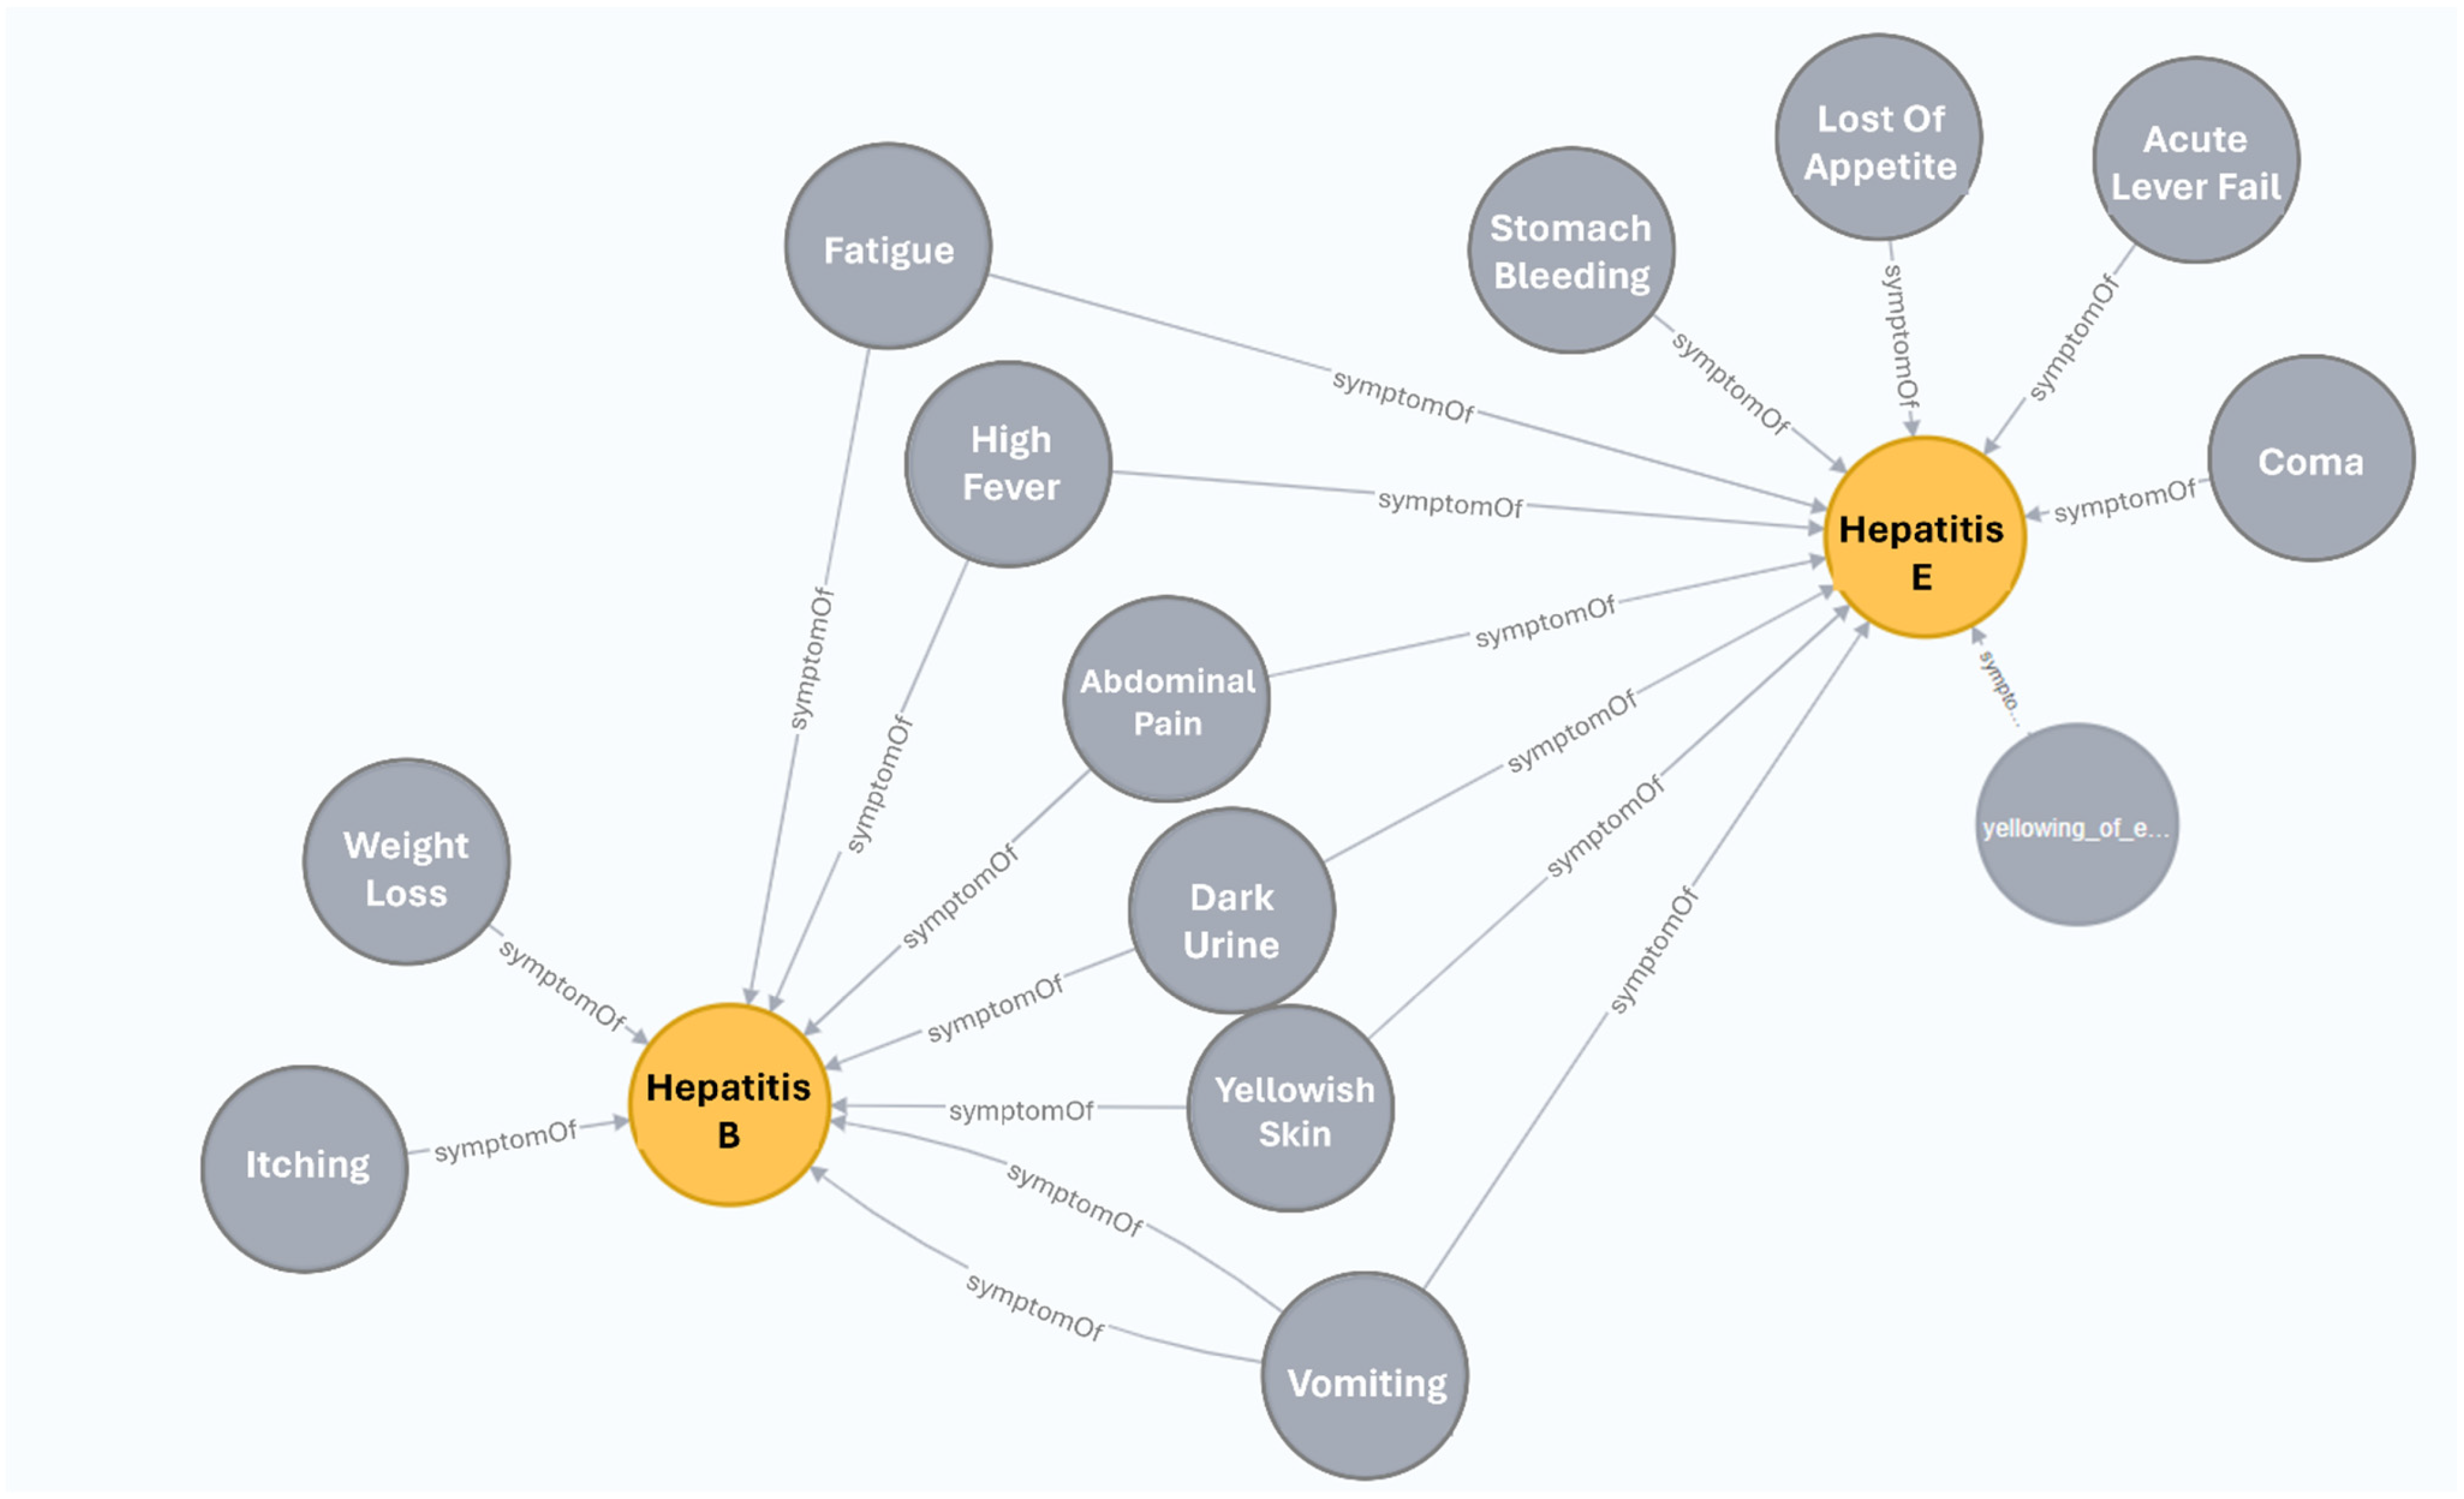
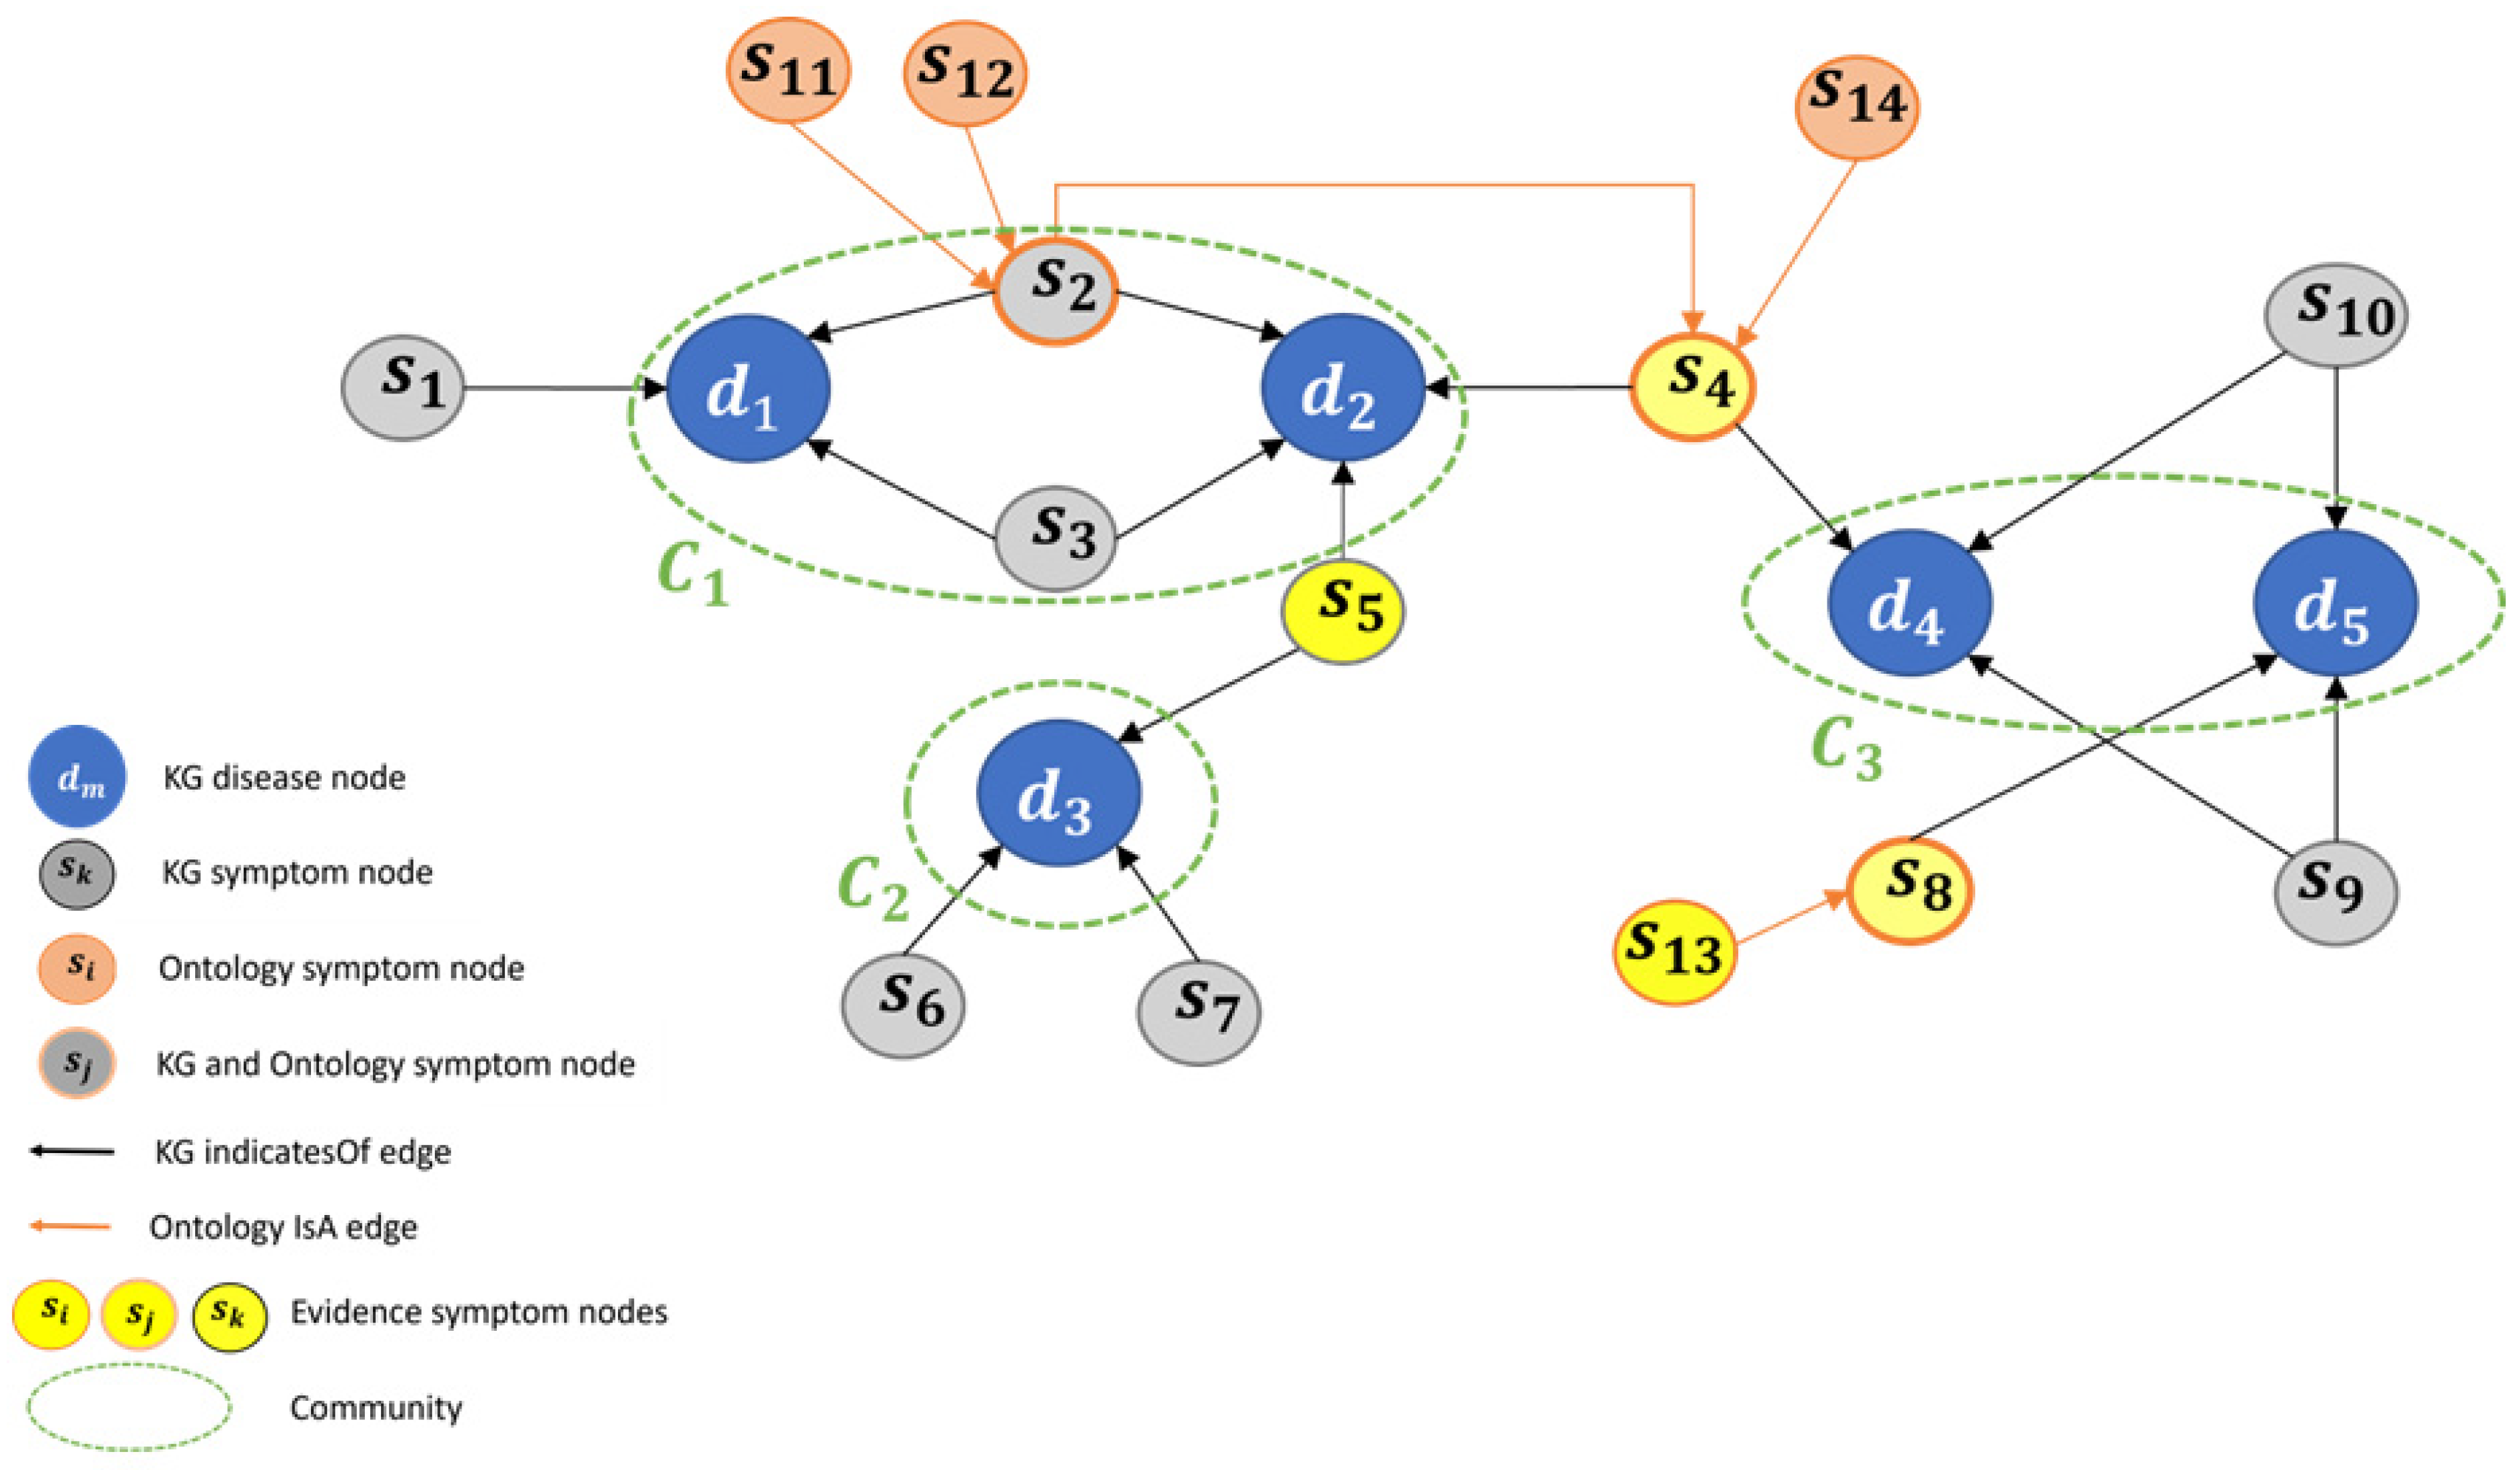
- An “original” KG symptom node, named as KG symptom node: these nodes appeared in the KG before the enhancement, and are directly connected to disease nodes, via relation (for example, see node s1 in Figure 7C).
- (ii)
- New ontological symptom node, named ontology symptom node: these are SYMP ontology nodes, which were added by Algorithm 1. These nodes are directly connected to the KG symptom node via relation, according to Algorithm 2 rules (for example, see node s11 in Figure 7C).
- (iii)
- A node that is both “original” and ontological, named a hybrid symptom node: these nodes are directly connected to a KG disease node (via relation) and to some other hybrid node or ontology symptom node (via relation). For example, see node s2 in Figure 7C.
- (i)
- An edge between a KG node to a disease node it indicates, named as KG edge.
- (ii)
- An edge between the ontology symptom node or hybrid node to its parent node (which can be an ontology symptom node or hybrid node), named an ontology edge.
5.2. Implementing Algorithms 1 and 2
5.2.1. Overview
5.2.2. Identifying Matching Symptoms
5.3. Inference in the Enhanced KG: Demonstrating via a Toy Problem
- (i)
- Evidence Propagation: Evidence symptoms (ES) can propagate through the edges of the graph, providing additional evidence, hence increasing the number of ES. This process has the potential to discover new diseases and expand the number of possible diseases for the patient.
- (ii)
- Symptoms Hierarchy Impact: Incorporating the symptoms hierarchy, along with the given ES, can indicate which community is more likely to be considered, especially in cases where multiple communities have equal LIND (LIND (=Local-in-Degree) of a given community c, is defined by the number of edges that point to diseases of c, by ES) scores.
- (iii)
- Expansion of Symptoms Range:
- ◯
- Increasing the number of hypotheses presented to the medical expert.
- ◯
- Facilitating a broader coverage of potential patient symptoms through the utilization of natural language processing (NLP) techniques (see further details in Section 6 where we discuss future work).
6. Discussion and Future Work
Author Contributions
Funding
Data Availability Statement
Conflicts of Interest
Appendix A
References
- Aceto, G.; Persico, V.; Pescapé, A. The role of Information and Communication Technologies in healthcare: Taxonomies, perspectives, and challenges. J. Netw. Comput. Appl. 2018, 107, 125–154. [Google Scholar] [CrossRef]
- Aceto, G.; Persico, V.; Pescapé, A. Industry 4.0 and health: Internet of things, big data, and cloud computing for healthcare 4.0. J. Ind. Inf. Integr. 2020, 18, 100129. [Google Scholar] [CrossRef]
- Estrela, V.V.; Monteiro AC, B.; França, R.P.; Iano, Y.; Khelassi, A.; Razmjooy, N. Health 4.0: Applications, management, technologies and review: Array. Med. Technol. J. 2018, 2, 262–276. [Google Scholar]
- Magrabi, F.; Ammenwerth, E.; McNair, J.B.; De Keizer, N.F.; Hyppönen, H.; Nykänen, P.; Georgiou, A. Artificial intelligence in clinical decision support: Challenges for evaluating AI and practical implications. Yearb. Med. Inform. 2019, 28, 128–134. [Google Scholar] [CrossRef] [PubMed]
- Lan, K.; Wang, D.T.; Fong, S.; Liu, L.S.; Wong, K.K.; Dey, N. A survey of data mining and deep learning in bioinformatics. J. Med. Syst. 2018, 42, 139. [Google Scholar] [CrossRef] [PubMed]
- Albagli-Kim, S.; Beimel, D. Knowledge Graph-Based Framework for Decision Making Process with Limited Interaction. Mathematics 2022, 10, 3981. [Google Scholar] [CrossRef]
- Denecke, K. How to Design Successful Conversations in Conversational Agents in Healthcare? In Proceedings of the International Conference on Human-Computer Interaction, Copenhagen, Denmark, 23–28 July 2023; Springer Nature: Cham, Switzerland, 2023; pp. 39–45. [Google Scholar]
- Hakimov, S.; Tunc, H.; Akimaliev, M.; Dogdu, E. Semantic question answering system over linked data using relational patterns. In Proceedings of the Joint EDBT/ICDT 2013 Workshops, Genoa, Italy, 18–22 March 2013; pp. 83–88. [Google Scholar]
- Goodwin, T.R.; Harabagiu, S.M. Medical question answering for clinical decision support. In Proceedings of the 25th ACM International conference on Information and Knowledge Management, Indianapolis, IN, USA, 24–28 October 2016; pp. 297–306. [Google Scholar]
- Davis, R.; Shrobe, H.; Szolovits, P. What is a Knowledge Representation? AI Mag. 1993, 14, 17–33. [Google Scholar]
- Webber, R.J.; Eifrem, E. Graph Databases: New Opportunities for Connected Data; O’Reilly Media, Inc.: Middlesex County, MA, USA, 2015. [Google Scholar]
- Wang, Q.; Mao, Z.; Wang, B.; Guo, L. Knowledge graph embedding: A survey of approaches and applications. IEEE Trans. Knowl. Data Eng. 2020, 29, 2724–2743. [Google Scholar] [CrossRef]
- Rajabi, E.; Kafaie, S. Knowledge graphs and explainable ai in healthcare. Information 2022, 13, 459. [Google Scholar] [CrossRef]
- Symptom Ontology (SYMP), Ontology Lookup Service (OLS). Available online: https://www.ebi.ac.uk/ols/ontologies/symp (accessed on 30 January 2024).
- Bonner, S.; Barrett, I.P.; Ye, C.; Swiers, R.; Engkvist, O.; Hoyt, C.T.; Hamilton, W.L. Understanding the performance of knowledge graph embeddings in drug discovery. Artif. Intell. Life Sci. 2022, 2, 100036. [Google Scholar] [CrossRef]
- Gruber, T.R. Toward Principles for the Design of Ontologies Used for Knowledge Sharing. Intl. J. Hum. Comput. Stud. 1995, 43, 907–928. [Google Scholar] [CrossRef]
- Smith, B.; Ashburner, M.; Rosse, C.; Bard, J.; Bug, W.; Ceusters, W.; Goldberg, L.J.; Eilbeck, K.; Ireland, A.; Mungall, C.J. The OBO Foundry: Coordinated evolution of ontologies to support biomedical data integration. Nat. Biotechnol. 2004, 25, 1251–1255. [Google Scholar] [CrossRef] [PubMed]
- Noy, N.F.; McGuinness, D.L. Ontology Development 101: A Guide to Creating Your First Ontology. Stanford Medical Informatics Technical Report SMI-2001-0880. 2001. Available online: http://protege.stanford.edu/publications/ontology_development/ontology101.pdf (accessed on 30 January 2024).
- Guarino, N. (Ed.) Formal ontology in information systems. In Proceedings of the First International Conference (FOIS’98), Trento, Italy, 6–8 June 1998; IOS Press: Amsterdam, The Netherlands, 1998; Volume 46. [Google Scholar]
- Fernández-López, M.; Gómez-Pérez, A.; Juristo, N. Methontology: From Ontological Art Towards Ontological Engineering; Association for the Advancement of Artificial Intelligence: Washington, DC, USA, 1997. [Google Scholar]
- Studer, R.; Benjamins, V.R.; Fensel, D. Knowledge engineering: Principles and methods. Data Knowl. Eng. 1998, 25, 161–197. [Google Scholar] [CrossRef]
- Zou, X. A survey on application of knowledge graph. J. Phys. Conf. Ser. 2020, 1487, 012016. [Google Scholar] [CrossRef]
- Gashkov, A.; Perevalov, A.; Eltsova, M.; Both, A. Improving Question Answering Quality through Language Feature-Based SPARQL Query Candidate Validation. The Semantic Web. ESWC 2022. Lecture Notes in Computer Science; Springer: Cham, Switzerland, 2022; Volume 13261. [Google Scholar] [CrossRef]
- Guo, Q.; Zhuang, F.; Qin, C.; Zhu, H.; Xie, X.; Xiong, H.; He, Q. A survey on knowledge graph-based recommender systems. IEEE Trans. Knowl. Data Eng. 2020, 34, 3549–3568. [Google Scholar] [CrossRef]
- Dietz, L.; Kotov, A.; Meij, E. Utilizing knowledge graphs for text-centric information retrieval. In Proceedings of the 41st International ACM SIGIR Conference on Research & Development in Information Retrieval, Ann Arbor, MI, USA, 8–12 July 2018; pp. 1387–1390. [Google Scholar]
- Jiang, Y.; Qiu, B.; Xu, C.; Li, C. The research of clinical decision support system based on three-layer knowledge base model. J. Healthc. Eng. 2017, 2017, 6535286. [Google Scholar] [CrossRef] [PubMed]
- De Silva, N.T.; Jayamanne, D.J. Computer-aided medical diagnosis using bayesian classifier-decision support system for medical diagnosis. Int. J. Multidiscip. Stud. 2016, 3, 2. [Google Scholar] [CrossRef]
- Rahaman, S. Diabetes diagnosis decision support system based on symptoms, signs and risk factor using special computational algorithm by rule base. In Proceedings of the 2012 15th International Conference on Computer and Information Technology (ICCIT), Chittagong, Bangladesh, 22–24 December 2012; pp. 65–71. [Google Scholar]
- Dong, Z.; Yin, Z.; He, M.; Chen, X.; Lv, X.; Yu, S. Validation of a guideline-based decision support system for the diagnosis of primary headache disorders based on ICHD-3 beta. J. Headache Pain 2014, 15, 40. [Google Scholar] [CrossRef]
- Tandra, S.; Gupta, D.; Amudha, J.; Sharma, K. A fuzzy-neuro-based clinical decision support system for disease diagnosis using symptom severity. In Soft Computing and Signal Processing, Proceedings of the 2nd ICSCSP, Hyderabad, India, 21–22 June 2019; Springer: Singapore, 2020; pp. 81–98. [Google Scholar]
- Belciug, S.; Gorunescu, F. Intelligent Decision Support Systems-A Journey to Smarter Healthcare; Springer International Publishing: Berlin/Heidelberg, Germany, 2020; pp. 130–137. [Google Scholar]
- Moreira, M.W.; Rodrigues, J.J.; Korotaev, V.; Al-Muhtadi, J.; Kumar, N. A comprehensive review on smart decision support systems for health care. IEEE Syst. J. 2019, 13, 3536–3545. [Google Scholar] [CrossRef]
- Li, L.; Wang, P.; Yan, J.; Wang, Y.; Li, S.; Jiang, J.; Liu, Y. Real-world data medical knowledge graph: Construction and applications. Artif. Intell. Med. 2020, 103, 101817. [Google Scholar] [CrossRef]
- Riaño, D.; Real, F.; López-Vallverdú, J.A.; Campana, F.; Ercolani, S.; Mecocci, P.; Caltagirone, C. An ontology-based personalization of health-care knowledge to support clinical decisions for chronically ill patients. J. Biomed. Inform. 2012, 45, 429–446. [Google Scholar] [CrossRef]
- Yamada, D.B.; Bernardi, F.A.; Miyoshi NS, B.; de Lima, I.B.; Vinci, A.L.T.; Yoshiura, V.T.; Alves, D. Ontology-based inference for supporting clinical decisions in mental health. In Proceedings of the Computational Science–ICCS 2020: 20th International Conference, Amsterdam, The Netherlands, 3–5 June 2020; Proceedings, Part IV 20. Springer International Publishing: Berlin/Heidelberg, Germany, 2020; pp. 363–375. [Google Scholar]
- Santos, A.; Colaço, A.R.; Nielsen, A.B.; Niu, L.; Strauss, M.; Geyer, P.E.; Mann, M. A knowledge graph to interpret clinical proteomics data. Nat. Biotechnol. 2022, 40, 692–702. [Google Scholar] [CrossRef]
- Dissanayake, P.I.; Colicchio, T.K.; Cimino, J.J. Using clinical reasoning ontologies to make smarter clinical decision support systems: A systematic review and data synthesis. J. Am. Med. Inform. Assoc. 2020, 27, 159–174. [Google Scholar] [CrossRef] [PubMed]
- Shanavas, N.; Wang, H.; Lin, Z.; Hawe, G. Ontology-based enriched concept graphs for medical document classification. Inf. Sci. 2020, 525, 172–181. [Google Scholar] [CrossRef]
- Kaggle. Available online: https://www.kaggle.com (accessed on 30 January 2024).
- Hao, L.; Halappanavar, M.; Kalyanaraman, A. Parallel heuristics for scalable community detection. Parallel Comput. 2015, 47, 19–37. [Google Scholar]
- Luo, J.; Wu, M.; Gopukumar, D.; Zhao, Y. Big data application in biomedical research and health care: A literature review. Biomed. Inform. Insights 2016, 8, BII-S31559. [Google Scholar] [CrossRef] [PubMed]
- Chen, C.M.; Jyan, H.W.; Chien, S.C.; Jen, H.H.; Hsu, C.Y.; Lee, P.C.; Chan, C.C. Containing COVID-19 among 627,386 persons in contact with the diamond princess cruise ship passengers who disembarked in Taiwan: Big data analytics. J. Med. Internet Res. 2020, 22, e19540. [Google Scholar] [CrossRef]
- Svedberg, P.; Reed, J.; Nilsen, P.; Barlow, J.; Macrae, C.; Nygren, J. Toward successful implementation of artificial intelligence in health care practice: Protocol for a research program. JMIR Res. Protoc. 2022, 11, e34920. [Google Scholar] [CrossRef]
- van der Vegt, A.H.; Scott, I.A.; Dermawan, K.; Schnetler, R.J.; Kalke, V.R.; Lane, P.J. Implementation frameworks for end-to-end clinical AI: Derivation of the SALIENT framework. J. Am. Med. Inform. Assoc. 2023, 30, 1503–1515. [Google Scholar] [CrossRef]
- Thukral, A.; Dhiman, S.; Meher, R.; Bedi, P. Knowledge graph enrichment from clinical narratives using NLP, NER, and biomedical ontologies for healthcare applications. Int. J. Inf. Technol. 2023, 15, 53–65. [Google Scholar] [CrossRef]
- Malik, P.; Pathania, M.; Rathaur, V.K. Overview of artificial intelligence in medicine. J. Fam. Med. Prim. Care 2019, 8, 2328. [Google Scholar]
- Chaddad, A.; Peng, J.; Xu, J.; Bouridane, A. Survey of explainable AI techniques in healthcare. Sensors 2023, 23, 634. [Google Scholar] [CrossRef] [PubMed]


| REF | Description | Input | Inter Active? | Technologies | Framework/ System Output | Implementation Details | Sample Size | Evaluation Metric (M) and Results (R) | ||
|---|---|---|---|---|---|---|---|---|---|---|
| Cases | Diseases | |||||||||
| 1 | [6] | Q&A-based medical decision support framework utilizing semantic technologies to infer diseases | Symptoms | Yes | Knowledge graph, Ontology | List of ordered pairs of possible diseases with their indicated symptoms, sorted by relevance | Neo4j Graph Database (version 5), Python | 410 | 41 | M: Presence and position of the true disease within the ranked list of potential diseases. R: In 94% of cases, the real disease is on the list. In 73% it is top ranked. |
| 2 | [26] | CDSS utilizing a three-layer KB model (disease-symptom-property), to calculate diseases probability | Symptoms, Basic info (e.g., sex, age) | Yes | Bayesian classifier | List of possible diseases and their related probabilities | C# language, SQL Server, IIS (versions not specified) | 50 | 10 | M: Probability ranging from 80% to 100% of correctly identifying the true disease. R: Overall, 14% of the cases met the criteria. |
| 3 | [27] | Bayesian-based system to identify diseases based on symptoms and medical test results | Symptoms, Medical lab test results | No | Bayesian classifier | The disease with the highest probability | Web-based programming (version not specified) | 100 | 15 | M: Probability of 100% of correctly identifying the true disease. R: Ten general diseases: 71%–99%, Five complex diseases: 71%–83% |
| 4 | [28] | CDSS for Diabetes diagnosis | Symptoms, Signs, Risk factor | Yes | Rule-Based system (SCARB) | One of five possible responses: “Not Diabetic” to “Very high chance of Diabetic” | Netbean’s GUI (version 7.1), MySQL server | NA | 1 | NA: No evaluation was conducted, presumably because the system implemented decision rules in accordance with a medical protocol |
| 5 | [29] | Guideline based CDSS for diagnosing primary headache disorders | Symptoms, Clinical info (e.g., location, duration, attack frequency, severity) | No | Ontology, Rule-based engine | The disease with the highest probability | SAGE 1, Rule generator (computer program) (verion not specified) | 543 | 11 | M: Probability of 100% of correctly identifying the true disease. R: Ranged from 60% for PTTH 2 disease to 100% for MOH 2 disease. |
| 6 | [30] | CDSS for diagnostic decisions related to common internal diseases | Symptoms, Severity | No | Neuro-fuzzy technique, Rule-based system | Most probable diseases and relevant lab tests and medications | Sugeno-Takagi inference system, MySQL server (verion not specified) | 180 | 8 | NA: No evaluation measures were reported. While the authors mentioned that the system yielded accurate results, no specific details were provided |
| 7 | [34] | Ontology-based personalization processes to generate individualized ontology and treatment plan for chronically ill patients | Symptoms, Signs, Diagnoses | No | Ontology Inference Engine, | Detailed medical and social description and intervention plan for a single patient | Protégé 3, Jena 3, SDA Lab tool 3, K4CARE proj 3 wrapper system (verions not specified) | 23 | 4 | M: Personalization of the ontology to a single disease. R: Personalized ontologies contain 8.03%, 5.46%, 9.77%, and 10.84% of the case profile ontology classes (for 4 diseases). |
| 8 | [35] | ontology-based system for evidence-based inferences in the mental health domain | Symptoms | No | Ontology Inference Eng, RDF DB | Upon a SPARQL query, returns data such as prevention recommendations | Protégé, Jena, SPARQL (verions not specified) | 72 | 1 | NA: The authors presented the outcomes of executing SPARQL queries; however, they did not furnish details regarding the success ratio. |
Disclaimer/Publisher’s Note: The statements, opinions and data contained in all publications are solely those of the individual author(s) and contributor(s) and not of MDPI and/or the editor(s). MDPI and/or the editor(s) disclaim responsibility for any injury to people or property resulting from any ideas, methods, instructions or products referred to in the content. |
© 2024 by the authors. Licensee MDPI, Basel, Switzerland. This article is an open access article distributed under the terms and conditions of the Creative Commons Attribution (CC BY) license (https://creativecommons.org/licenses/by/4.0/).
Share and Cite
Beimel, D.; Albagli-Kim, S. Enhancing Medical Decision Making: A Semantic Technology-Based Framework for Efficient Diagnosis Inference. Mathematics 2024, 12, 502. https://doi.org/10.3390/math12040502
Beimel D, Albagli-Kim S. Enhancing Medical Decision Making: A Semantic Technology-Based Framework for Efficient Diagnosis Inference. Mathematics. 2024; 12(4):502. https://doi.org/10.3390/math12040502
Chicago/Turabian StyleBeimel, Dizza, and Sivan Albagli-Kim. 2024. "Enhancing Medical Decision Making: A Semantic Technology-Based Framework for Efficient Diagnosis Inference" Mathematics 12, no. 4: 502. https://doi.org/10.3390/math12040502
APA StyleBeimel, D., & Albagli-Kim, S. (2024). Enhancing Medical Decision Making: A Semantic Technology-Based Framework for Efficient Diagnosis Inference. Mathematics, 12(4), 502. https://doi.org/10.3390/math12040502