3.1. Problem Description and Assumptions
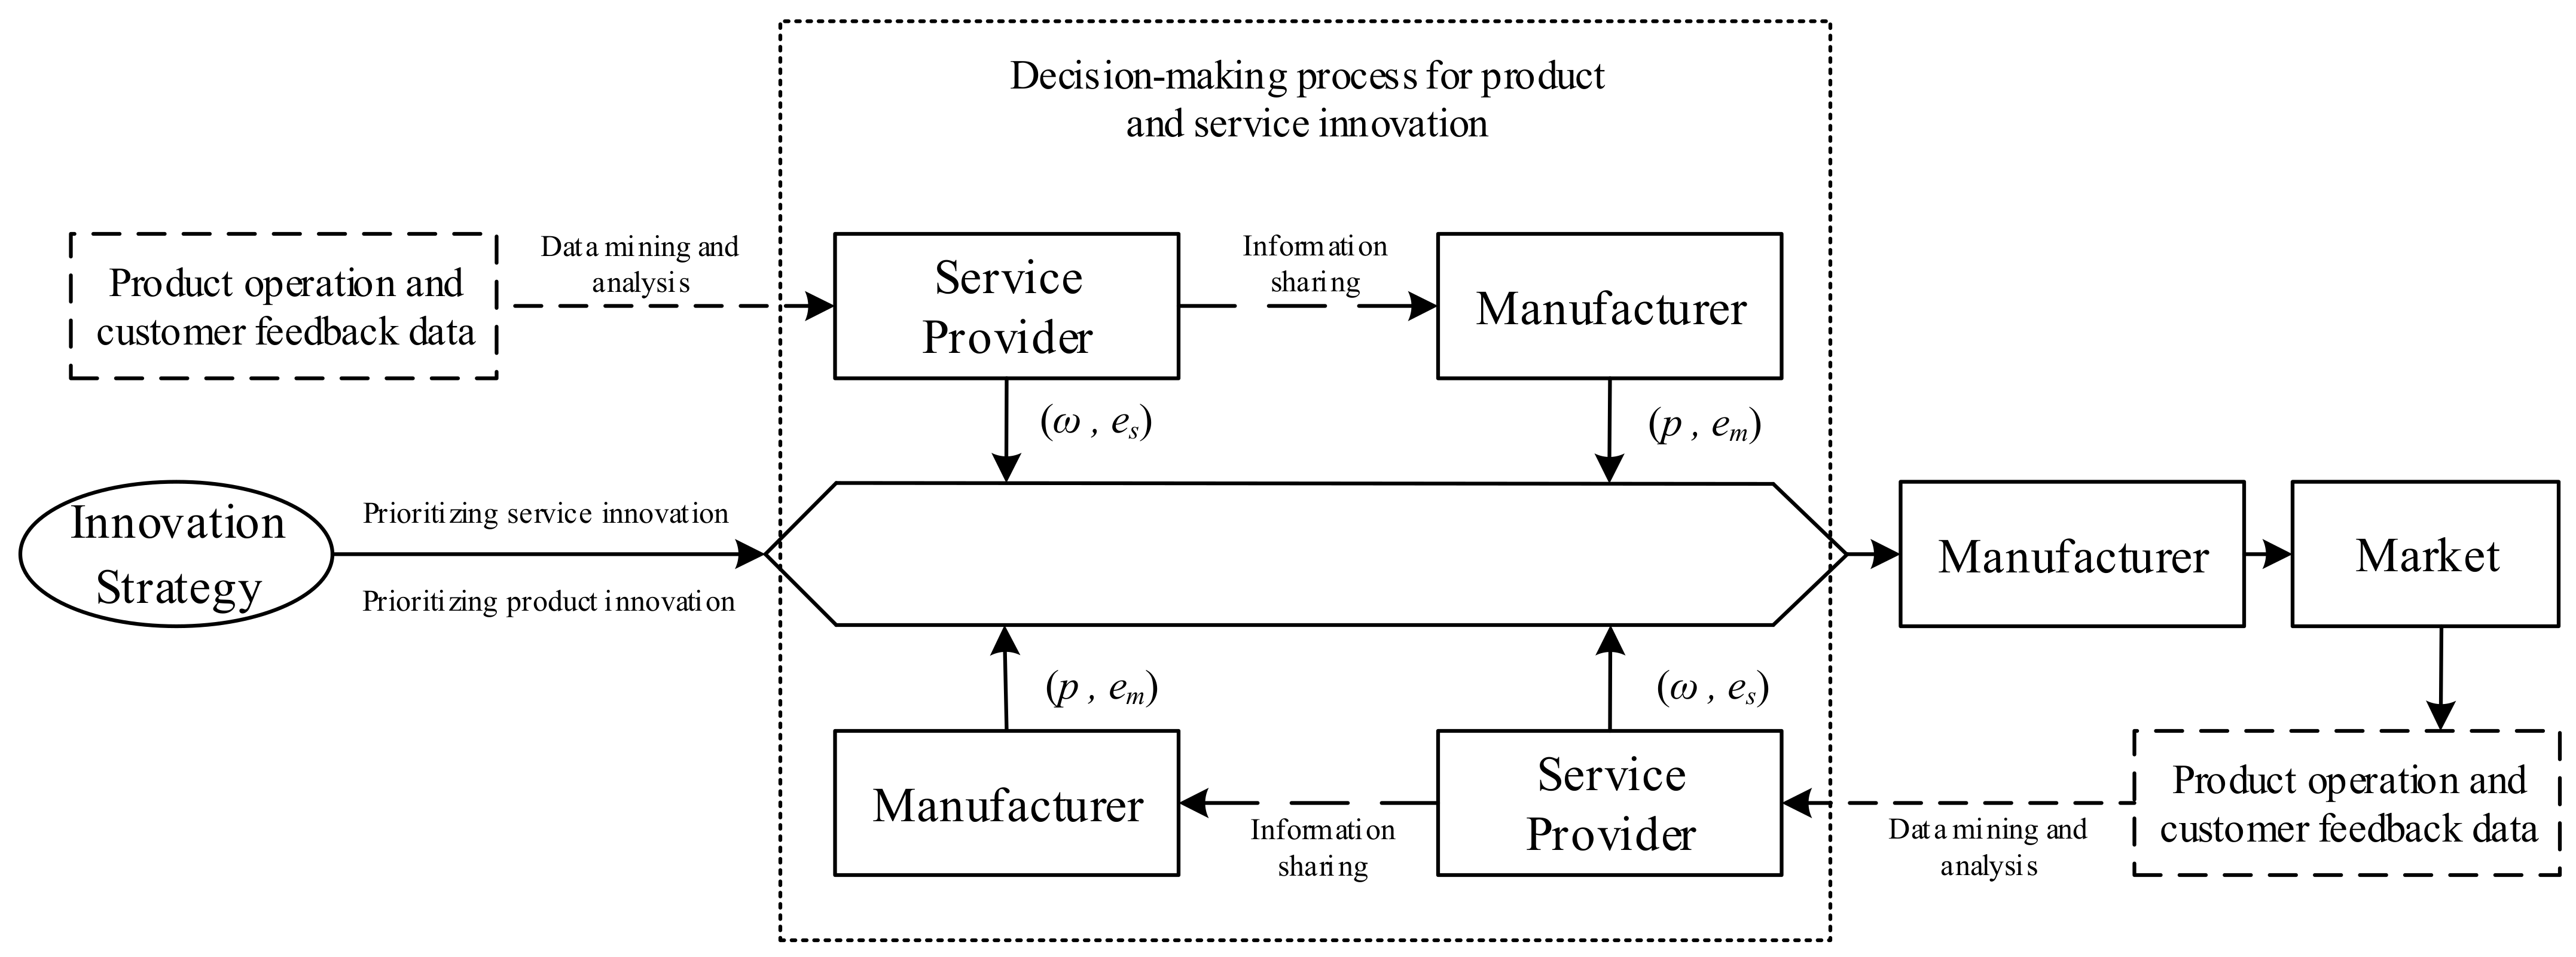
Consider a product–service supply chain consisting of a digital service provider (hereinafter referred to as ‘service provider’, S) and a product manufacturer (hereinafter referred to as ‘manufacturer’, M) which, together, provide an integrated solution, a ‘product + digital service’ (hereinafter referred to as ‘integrated solution’), to a customer. Among them, the service provider provides digital services such as product system modification and additional function expansion of the integrated solution. The manufacturer produces products according to customer and market demand, combines them with the digital services provided by the service provider, and delivers a comprehensive solution integrating products and services to the customer. In order to meet the increasingly individualized needs of customers, both parties must continuously improve and innovate their products and services. Manufacturers, for example, upgrade technology through modular product design, intelligent product upgrades, and ecosystem product design. Service providers, on the other hand, offer innovative services through remote monitoring, troubleshooting for data-driven service optimization, and customized solutions. In the process of implementing product and service innovations, the manufacturer and the service provider first decide on an innovation prioritization strategy and the service provider decides whether to share information. With the service provider adopting an information sharing strategy, if both parties decide to prioritize product innovation, the manufacturer initiates product modification and innovation activities and sets the final sales price of the integrated solution. The service provider then innovates the service and also decides on the unit service price. After both parties have completed their innovations, the manufacturer delivers to the market a comprehensive solution that integrates the innovative products and services. At the end of the sales period, the service provider collects product operation and customer feedback data during the service process, converts them into demand information, and shares them with the manufacturer to guide further innovation. When both parties decide to prioritize service innovation, the service provider takes the lead in initiating service innovation activities and determines the unit service price. At the same time, the service provider shares service innovation information and customer demand information with the manufacturer so that the manufacturer can adapt its product innovation program to the new service characteristics. The manufacturer then innovates the product, sets the selling price, and brings the integrated solution to the market. In cases where the service provider does not share information, the two parties set innovation levels and prices according to different innovation priorities. The product service innovation supply chain structure is shown in
Figure 1.
Demand Assumption: Product innovation enhances the performance, stability, and functionality of hardware, software, or systems, making integrated solutions more relevant and flexible, and increasing the attractiveness of the solutions. Service innovation, on the other hand, enhances customer satisfaction and loyalty by providing personalized, continuously optimized services and improving service quality and responsiveness [
36]. This has led customers to focus more and more on the overall value provided by integrated solutions, rather than just on single products or services. Therefore, it is further assumed that both the level of product innovation and the level of service innovation have a positive impact on the demand for integrated solutions. With reference to similar studies [
37,
38], the demand for innovative integrated solutions is portrayed as
, where
is the potential market demand for integrated solutions;
is the selling price of integrated solutions;
is the price elasticity coefficient of integrated solutions, which measures the sensitivity of the market demand to the selling price; and
is the product innovation utility and
is the service innovation utility, which represent the degree of customer demand for product and service innovations, respectively.
Innovation Cost Assumptions: Consistent with most innovation cost function assumptions [
39,
40,
41], the innovation input cost functions of manufacturers and service providers are convex functions with respect to the level of innovation. Assuming that the level of service innovation by the service provider is
and the level of product innovation by the manufacturer is
, the cost function of service innovation input by the service provider is
and the cost function of product innovation input by the manufacturer is
, where
represents the cost coefficient of service innovation by the service provider and
is the cost coefficient of product innovation by the manufacturer. For the convenience of the study, the initial production cost of products and services in this study is set to 0, which does not affect the conclusions of the study.
Information Sharing Costs and Benefits Assumptions: According to Ma [
42] and Correani [
43], the ability of an enterprise to ‘process’ massive data resources into valuable knowledge or information depends largely on the enterprise’s ability to analyze and process massive data and big data. This includes the ability to make data-driven decisions, data productization, and value realization, which is expressed in terms of shorter decision-making cycles, cost reductions as a result of data optimization, and the number of innovative products supported by data. Manufacturers and service providers have the ability to convert data resources into information values,
and
. In this study, integrated solutions are sold to customers as integrated innovative products and services. Therefore, the number of data resources acquired by the service provider is equal to the number of its services under the product innovation priority model [
44]. The value of the shared information received by the manufacturer is then quantified as
. In the service innovation priority model, the service provider transforms the collected market demand information into service innovation, and the level of its service innovation represents the data value of the data resources that the service provider converts into information. The manufacturer converts the shared data value into product innovation knowledge, which increases the value of the manufacturer’s product innovation [
45] by
. Additionally, the cost of information sharing by service providers in both models is categorized as
and
, including, for example, technical operation and maintenance, data conversion, and communication costs [
46]. Among them,
is the cost coefficient of information sharing for service providers.
The primary parameters utilized in this paper are presented in
Table 1 below.
For the sake of clarity, superscripts , , , and represent service innovation priority without information sharing, product innovation priority without information sharing, service innovation priority with information sharing, and product innovation priority with information sharing, respectively. The subscripts and denote manufacturers and service providers, respectively. The symbol ‘*’ indicates the optimal solution.
3.3. Model Analysis
By employing backward induction, the equilibrium solutions of the four models can be derived. The derivation of Propositions 1 and 2 is presented below, and the procedure for proving the remaining propositions is analogous. The proofs of the corollaries are included in
Appendix A.
Proposition 1 (DP Model). Manufacturers prioritize product innovation without considering service provider information sharing.
(i) The optimal levels of product innovation (), service innovation (), price per unit of service (), and selling price () for both manufacturers and service providers are defined as follows: (ii) The optimal profits for manufacturers () and service providers () are defined as follows: Proof. The manufacturer first sets the sales premium for the innovative integrated solution, and the sales price determined by the manufacturer is the price per unit of service provided by the service provider plus its sales premium , which can be expressed as . Substituting into Equations (1) and (2) and applying the inverse induction method of solving for Equation (2) to find the first-order derivatives of with respect to and and making the first-order derivatives equal to 0 yields , . Therefore, the Hessian matrix of is . It can be shown that the Hessian matrix is negative definite when . The service provider profit is a joint concave function of and , and there exists an optimal solution with great value. Substituting the result of and being equal to 0 into Equation (1) and taking the first-order derivatives of and , respectively, the Hessian matrix of is . When , the Hessian matrix is negative definite and the profit function is the joint concave function of and . Seeking its first-order derivatives equal to 0, the joint solution to the manufacturer’s optimal level of innovation and the optimal sales premium, which will be brought into the , , are solved to obtain the optimal level of innovation of the service provider and the optimal unit price of service results for Formulas (10) and (11). The manufacturer’s optimal sales price is equal to the optimal unit service price plus . Substituting the above optimal decision variables into the profit function of the manufacturer, the service provider can be obtained. In the product innovation priority, the manufacturer and the service provider profit results in Formulas (13) and (14), and Proposition 1 is proved. □
Proposition 2 (SP Model). Service providers prioritize service innovation without considering service provider information sharing.
(i) The optimal levels of product innovation (), service innovation (), price per unit of service (), and selling price () for both manufacturers and service providers are defined as follows: (ii) The optimal profits for manufacturers () and service providers () are defined as follows: Proof. The inverse induction method is used to solve Equation (3) to find the first-order derivative of with respect to , and make it equal to 0 to obtain , . Then, the Hessian matrix of is . It can be seen that the Hessian matrix is negatively definite when . The manufacturer profit is a joint concave function of and , and there exists an optimal solution with a great value. Substituting the result of and equal to 0 into Equation (4) and taking the first-order derivatives of and , respectively, it can be seen that the Hessian matrix of is . When , the Hessian matrix is negative definite and the profit function is the joint concave function of and . Seeking its first-order derivatives equal to 0, the joint solution to the optimal level of innovation of the service provider and the optimal price of services, respectively, can be found for the results of Equations (16) and (17), with and being used to solve for the optimal level of innovation of the manufacturer and the optimal price of the results of the sales from Equations (15)–(18). Substituting the above optimal decision variables into the profit function of the manufacturer, the service provider can be obtained. When the service innovation is prioritized, the manufacturer and the service provider profits result in Equations (19) and (20), respectively, and Proposition 2 is proved. □
Corollary 1. The optimal decision, when product innovation is prioritized, increases with the product innovation utility and decreases with the product innovation cost coefficient , without considering service provider information sharing. Corollary 2. The optimal decision, when service innovation is prioritized, increases with the service innovation utility and decreases with the service innovation cost coefficient , without considering service provider information sharing. Corollaries 1 and 2 suggest that both manufacturers and service providers benefit from increased service and product innovation effects. Greater product and service innovation utility implies greater customer acceptance of the innovative content and model. When service providers introduce more flexible and personalized services to give new functions and usage scenarios to their products, this expands the scope of application of the products, brings new market opportunities for manufacturers, and encourages manufacturers to innovate their products to meet different customer needs. At the same time, product innovation by manufacturers usually introduces new technologies, which change the operation mode and service process of existing service providers, prompting service providers to adjust and innovate their existing services to adapt to new products. Both parties cooperate in technology development and the production process, and the innovation effects promote each other to form a spiral development mode. On the contrary, the increase in the innovation cost coefficient implies that manufacturers and service providers have insufficient innovation capability and cannot meet the market demand despite investing more in innovation costs. The uncertainty of innovation leads both parties to be more cautious when investing in innovation, or even to reduce their investment in innovation, which leads to a decrease in the level of innovation.
Proposition 3 (DPI model). Considering the scenario of information sharing by service providers, product innovation is prioritized.
(i) The optimal levels of product innovation (), service innovation (), price per unit of service (), and selling price () for both manufacturers and service providers are defined as follows: (ii) The optimal profits for manufacturers () and service providers () are defined as follows: To ensure the existence and practical significance of the equilibrium solution, the following conditions must be satisfied: , , .
Proposition 4 (SPI model). Considering the scenario of information sharing by service providers, service innovation is prioritized.
(i) The optimal levels of product innovation (), service innovation (), price per unit of service (), and selling price () for both manufacturers and service providers are defined as follows: (ii) The optimal profits for manufacturers () and service providers () are defined as follows: To ensure the existence and practical significance of the equilibrium solution, the following conditions must be satisfied: , , .
Corollary 3. (i) In the service provider information sharing scenario, the optimal decision ,
,
,
for the product innovation prioritization decision increases with the increase in the service provider information value transformation coefficient and decreases with the increase in the information sharing cost coefficient .
(ii) When , the optimal decision increases with the increase in the service provider information value transformation coefficient and decreases with the increase in the information sharing cost coefficient . When , the optimal decision decreases with the increase in the service provider’s information value transformation coefficient and increases with the increase in the information sharing cost coefficient .
(iii) The optimal decision increases with the increase in the service provider’s information value transformation coefficient . When , the optimal decision increases with the increase in the information sharing cost coefficient . When , the optimal decision decreases with the increase in the information sharing cost coefficient .
Corollary 4. In the service provider information sharing scenario, the optimal decision to prioritize service innovation , , , , , increases with the increase in the value transformation coefficient of the manufacturer’s information and decreases with the increase in the information sharing cost coefficient .
It follows from Corollaries 3 and 4 that, on the one hand, information sharing by service providers allows manufacturers to capture economic value beyond the benefits of the innovation itself. For example, by obtaining more innovation information based on product operation data and customer feedback data, the cost of innovation for the manufacturer can be reduced through information sharing. On the other hand, enterprises process and analyze product operation data, customer feedback, and market demand information to identify potential market opportunities and changes in consumer demand, improve R&D efficiency through optimal allocation of resources, and reduce the risk of innovation due to market uncertainty. In this case, manufacturers and service providers will tend to increase the level of innovation of their products and services to meet specific market demands. Customers are willing to pay higher prices to try and accept innovative products when the manufacturer’s and service provider’s innovations greatly satisfy their needs. In this case, both parties can set higher prices in order to make higher profits. On the contrary, higher information sharing costs mean that the service provider needs to invest more resources in information collection, processing, and delivery. The increase in information sharing costs means service providers have to undermine their investment in service innovation, leading to a decrease in the level of service innovation. The decrease in the level of service innovation directly affects the value of innovation information and indirectly increases the cost of product innovation for manufacturers, which leads to a decrease in the level of product innovation. In the case of a decline in the level of product and service innovation, service providers and manufacturers maintain market competitiveness and market share by lowering wholesale and selling prices.
Corollary 5 (DPI Model vs. DP Model).
(i) There exists . When , if , the level of product innovation, the level of service innovation, the selling price, the manufacturer’s profit, and the service provider’s profit under the product innovation priority strategy satisfy , , , ; if , the level of product innovation, the level of service innovation, the selling price, the manufacturer’s profit, and the service provider’s profit satisfy , , , . When , if , the level of product innovation, the level of service innovation, the selling price, the manufacturer’s profit, and the service provider’s profit satisfy , , , . The comparison between and has the same threshold, but the magnitude of both depends on .
Where
, .
(ii) There exists
. When
, if
, the price of the service satisfies
; if
, the price of the service satisfies
. When
, if
, the price of the service satisfies
, where
.
Corollary 5 shows that the choice of information sharing strategy under the priority of product innovation is closely related to the information value conversion coefficient and information sharing cost coefficient of the service provider. Only when the service provider’s information value conversion coefficient and information sharing cost coefficient satisfy certain conditions will the information sharing strategy increase the innovation level of both parties as well as bring excess profits. The market demand information acquired by the service provider is not always directly transformed into product innovation knowledge. Only if the service provider transforms it into knowledge that is highly compatible with the manufacturer’s product innovation needs will information sharing be of sufficient economic value to the manufacturer. In addition, service providers incurring additional information sharing costs will demand higher service prices, which will directly affect manufacturers’ product pricing and profit allocation. In conjunction with Corollary 3, the information sharing strategy benefits both parties more when the service provider’s ability to transform the value of information is higher and the cost of information sharing is lower.
Corollary 6 (SPI model vs. SP model).
(i) There exists
. When
, the level of product innovation, the price per unit of service, and the manufacturer’s profit under the service innovation priority decision satisfy
,
,
. When
, the level of product innovation, the price per unit of service, and the manufacturer’s profit satisfy
,
,
.
(ii) There exists
. When
, the level of service innovation satisfies
. When
, the level of service innovation satisfies
.
(iii) There exists
. When
, the sales price satisfies
. When
, the sales price satisfies
.
(iv) There exists
. When
, service provider profits satisfy
. When
, service provider profits satisfy
.
Where
,
;
;
;
.
Corollary 6 shows that the choice of information sharing strategy under service innovation prioritization is not only closely related to the information sharing cost coefficient of the service provider, but also significantly associated with the information value conversion coefficient of the manufacturer. If the manufacturer can effectively use the service innovation information and demand information shared by the service provider to accurately adjust the product design, improve the production process, and quickly launch innovative products in response to the market demand, this efficient information conversion can significantly increase the added value of service innovation to product innovation. Innovative products and services occupy a larger market share, which, in turn, will lead to the growth of service providers’ profits and make up for the economic losses caused by service providers in the process of information sharing. However, the value of information sharing cannot be maximized if the manufacturer’s ability to convert the value of information is weak, even if the service provider provides detailed information on market demand. In this case, there is limited improvement in the service provider’s level of innovation and profitability, and the high cost of information sharing may even cause the service provider’s profit to be lower than it would have been without information sharing.
The previous section analyzed the correlation between the optimal decision and each parameter as well as the impact of the service provider’s information sharing strategy on the optimal decision and profit by solving different models. Comprehensively comparing the four models constructed, it is found that the key factors affecting the product–service innovation supply chain are the information value conversion coefficient of the manufacturer and the service provider and the information sharing cost coefficient of the service provider. Next, we further compare the market demand under different innovation priorities and analyze the impact of these parameters on the choice of supply chain innovation priorities.
Proposition 7. (i) Market demand under product innovation prioritization and service innovation prioritization decisions in the scenario of no information sharing by the service provider: (ii) Market demand under product innovation prioritization and service innovation prioritization decisions in the scenario of information sharing by the service provider:
Corollary 7 (SP Model vs. DP Model). Introduces two parameters, product innovation efficiency and service innovation efficiency, , . When the party with high innovation efficiency carries out innovation activities as a sub-priority, higher market demand can be obtained.
A party with high innovation efficiency usually has better resource optimization and cost control capabilities, and can further reduce innovation costs on the basis of previous innovations, which helps it to be more competitive in the market. At the same time, by drawing on the technological foundation and market experience of the prior innovation process, it avoids innovation risks, makes use of existing market data and technological advances to carry out more optimized innovation, integrates the latest technology with market demand, and provides more mature and efficient products or services. This precise alignment enables them to quickly meet demand and gain market share when entering the market.
Corollary 8 (SPI Model vs. DPI Model).
Case 1: If
, then
.
There exist
,
,
. When
, if
, the market demand under the product innovation priority and service innovation model satisfies
; if
, the market demand satisfies
. When
, the market demand satisfies
. When
, if
,
, the market demand satisfies
; if
,
, the market demand satisfies
; if
, market demand satisfies
.
Case 2: If
, then
.
There exist
,
,
. When
, if
, the market demand under the product innovation priority and service innovation model satisfies
; if
, the market demand satisfies
. When
, if
, the market demand satisfies
. If
,
, the market demand satisfies
; if
,
, the market demand satisfies
. When
, if
,
, market demand satisfies
. If
, the market demand satisfies
.
Where
,
,
,
,
.
Corollary 8 shows that, in the case of service provider information sharing, the choice of innovation priority for integrated solutions is closely related to the information value conversion coefficients of the manufacturer and the service provider. When the cost coefficient of data resource sharing and the information conversion coefficients of both parties satisfy a certain magnitude relationship, it is possible to decide the priority of product innovation according to the market demand. This means that the delivery and use of integrated solutions are not only expressed in the delivery of physical products and value-added services, but also include regular services, optimization services, and upgrading services in the process of product use and operation. The value of data resources such as customer needs and services for product innovation provides ‘external incentives’ for manufacturers and service providers to innovate.


