6.1. Quantitative Analysis
Table 5 demonstrates that BanglaBERT demonstrates the highest performance across all metrics, with an accuracy of 92.25%, precision of 92.23%, recall of 92.27%, and an F1-Score of 92.19%. This indicates its strong performance in hate speech detection. Bangla BERT Base performs slightly worse, with accuracy, precision, recall, and F1-Score around 91.29%, 91.30%, 91.24%, and 91.27%, respectively, showing it is a strong model, though not as effective as BanglaBERT. mBERT has an accuracy of 91.28% and precision of 91.30%, but it excels in recall (92.24%) and F1-Score (92.19%), making it comparable to BanglaBERT. XLM-RoBERTa shows an accuracy of 91.22% and precision of 91.36%, but its F1-Score drops to 90.27%, indicating a slight trade-off between precision and recall. sahajBERT has the lowest performance among the evaluated models, with an accuracy of 90.67%, precision of 90.88%, recall of 90.14%, and an F1-Score of 90.39%. Despite performing well, sahajBERT is less effective compared to the other models listed. This analysis highlights BanglaBERT as the top-performing model for the BD-SHS dataset, followed closely by mBERT due to its high recall and F1-Score.
Table 6 shows that BanglaBERT emerges as the top performer in Bengali hate speech detection, excelling across several key metrics. It achieves the highest accuracy at 89.21%, indicating that it correctly classifies 89.21% of the samples. Its recall is equally impressive at 89.21%, demonstrating its effectiveness in identifying actual positive samples. BanglaBERT also leads with an F1-Score of 89.20%, reflecting a balanced performance between precision and recall. However, its precision is slightly lower at 88.05%, which means that while it identifies most positive samples, a small proportion of its positive predictions is incorrect. In close competition, Bangla BERT Base exhibits an accuracy of 88.53% and shines with the highest precision among the models at 89.03%. This indicates that it has a high ratio of true positive predictions to total predicted positives. Its recall and F1-Score are 88.53% and 88.49%, respectively, showcasing its reliability and balanced performance, though marginally behind BanglaBERT in recall and F1-Score. Both mBERT and sahajBERT present similar results, each attaining an accuracy of 87.93%. Their precision and F1-Scores are closely matched, with mBERT achieving a precision of 88.14% and an F1-Score of 87.92%, while sahajBERT scores 88.21% in precision and 87.91% in F1-Score. These results suggest that both models are competent, with minor variations in their ability to balance precision and recall. XLM-RoBERTa, while still competitive, ranks lowest among the evaluated models. It achieves an accuracy of 87.23%, precision of 87.32%, recall of 87.23%, and an F1-Score of 87.23%. Despite being at the lower end of the performance spectrum in this comparison, XLM-RoBERTa still offers a robust performance, underscoring the overall competitive nature of these models in handling Bengali hate speech detection.
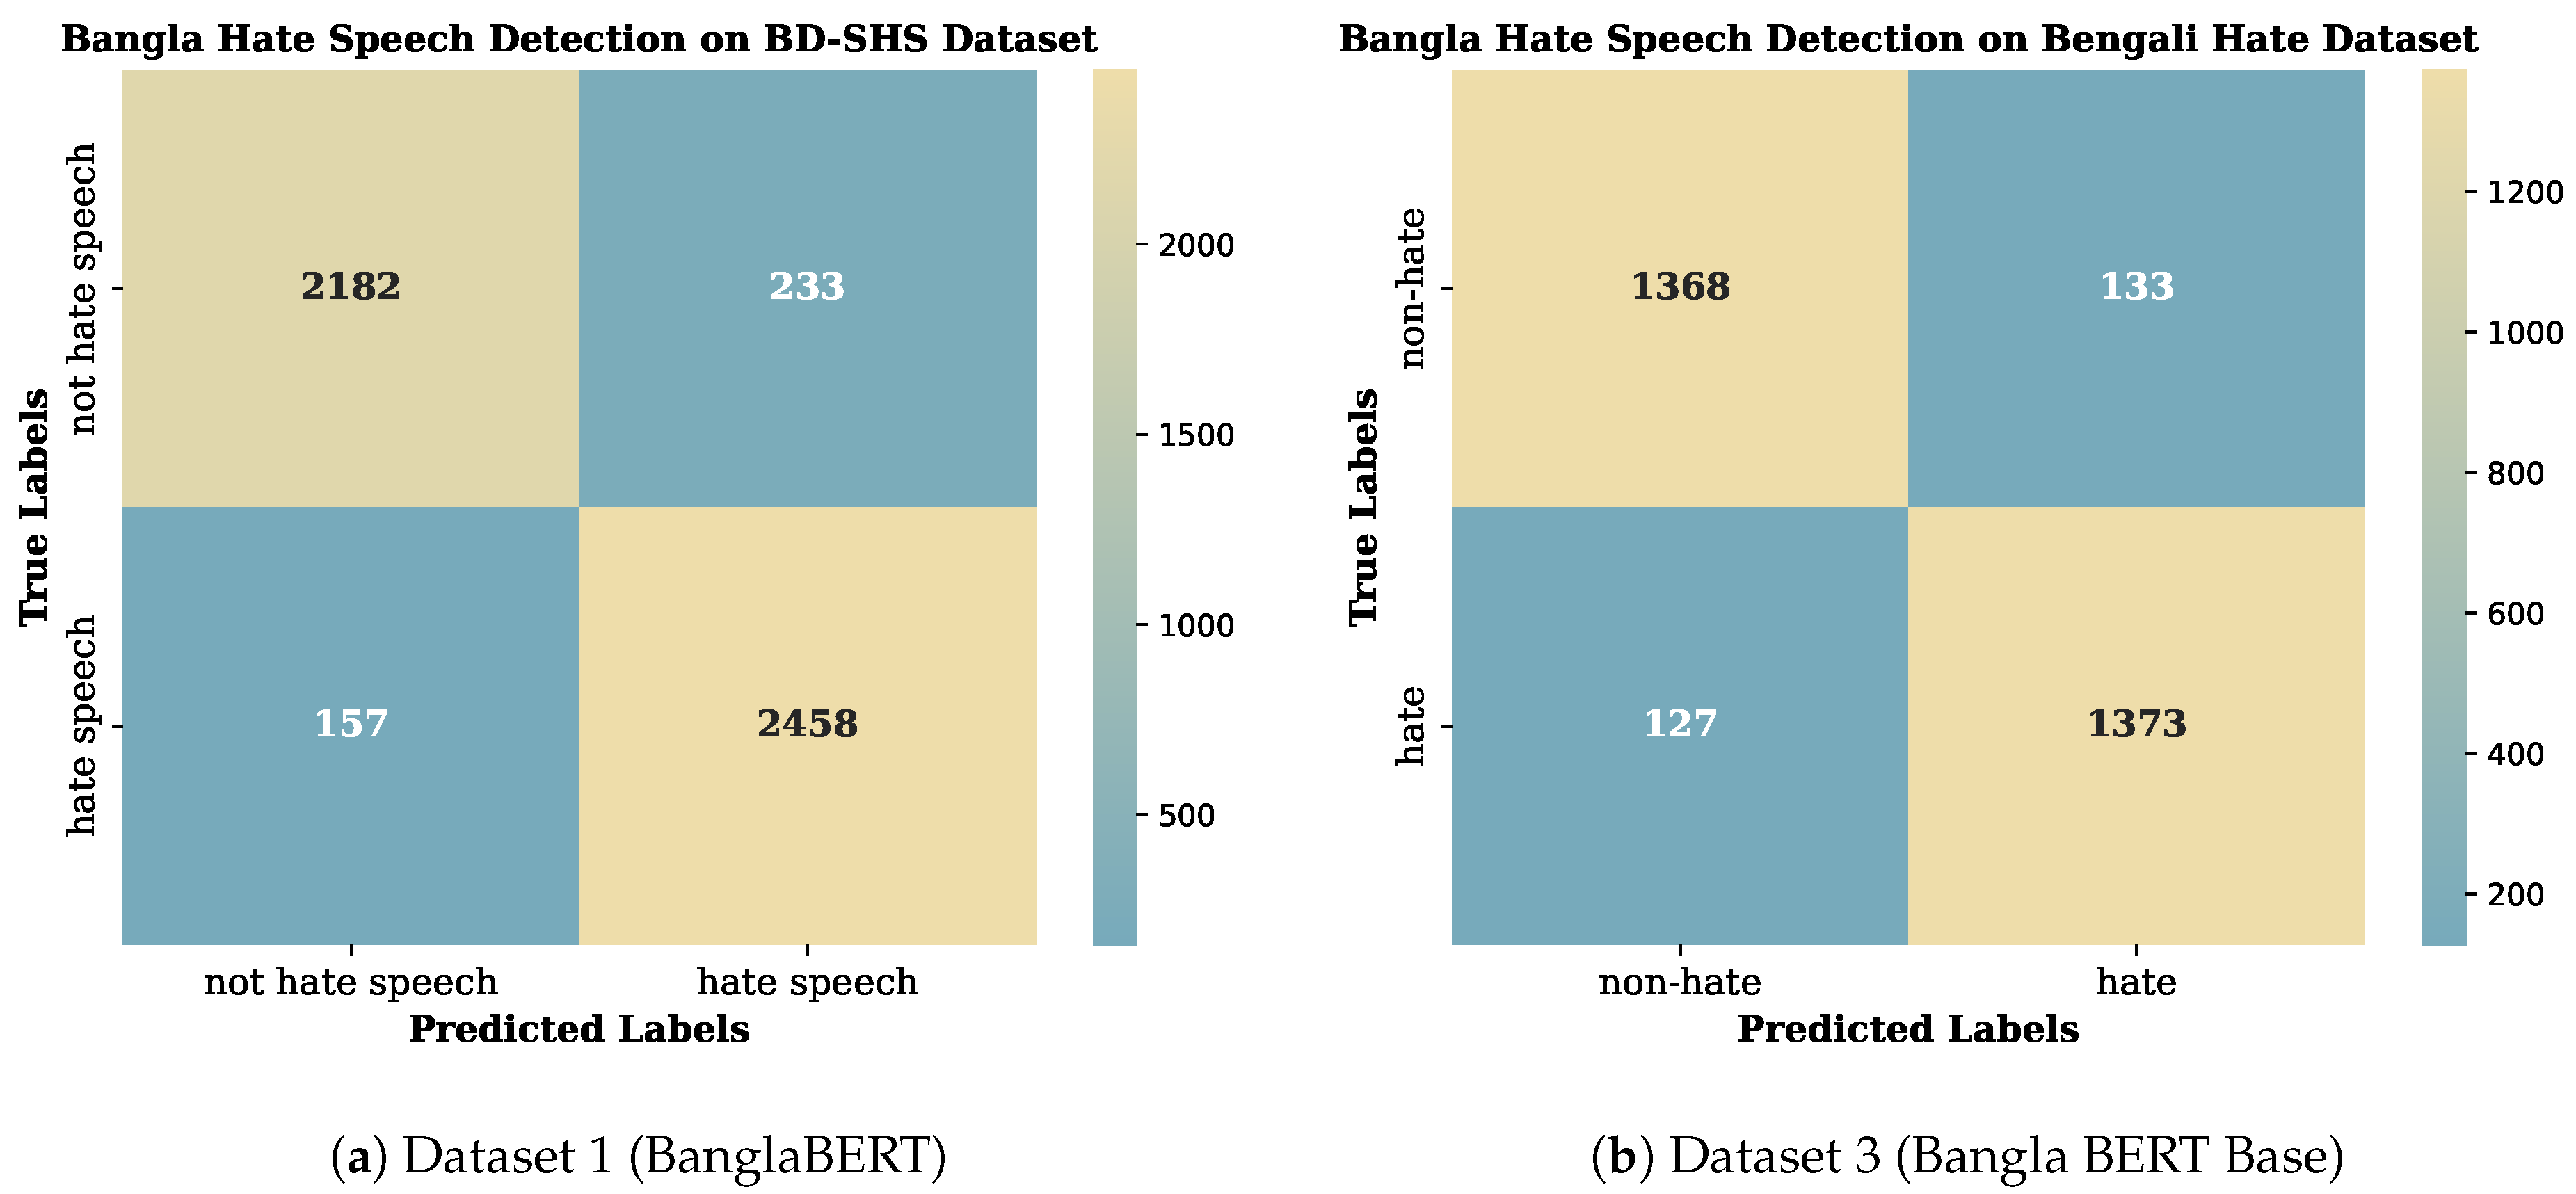
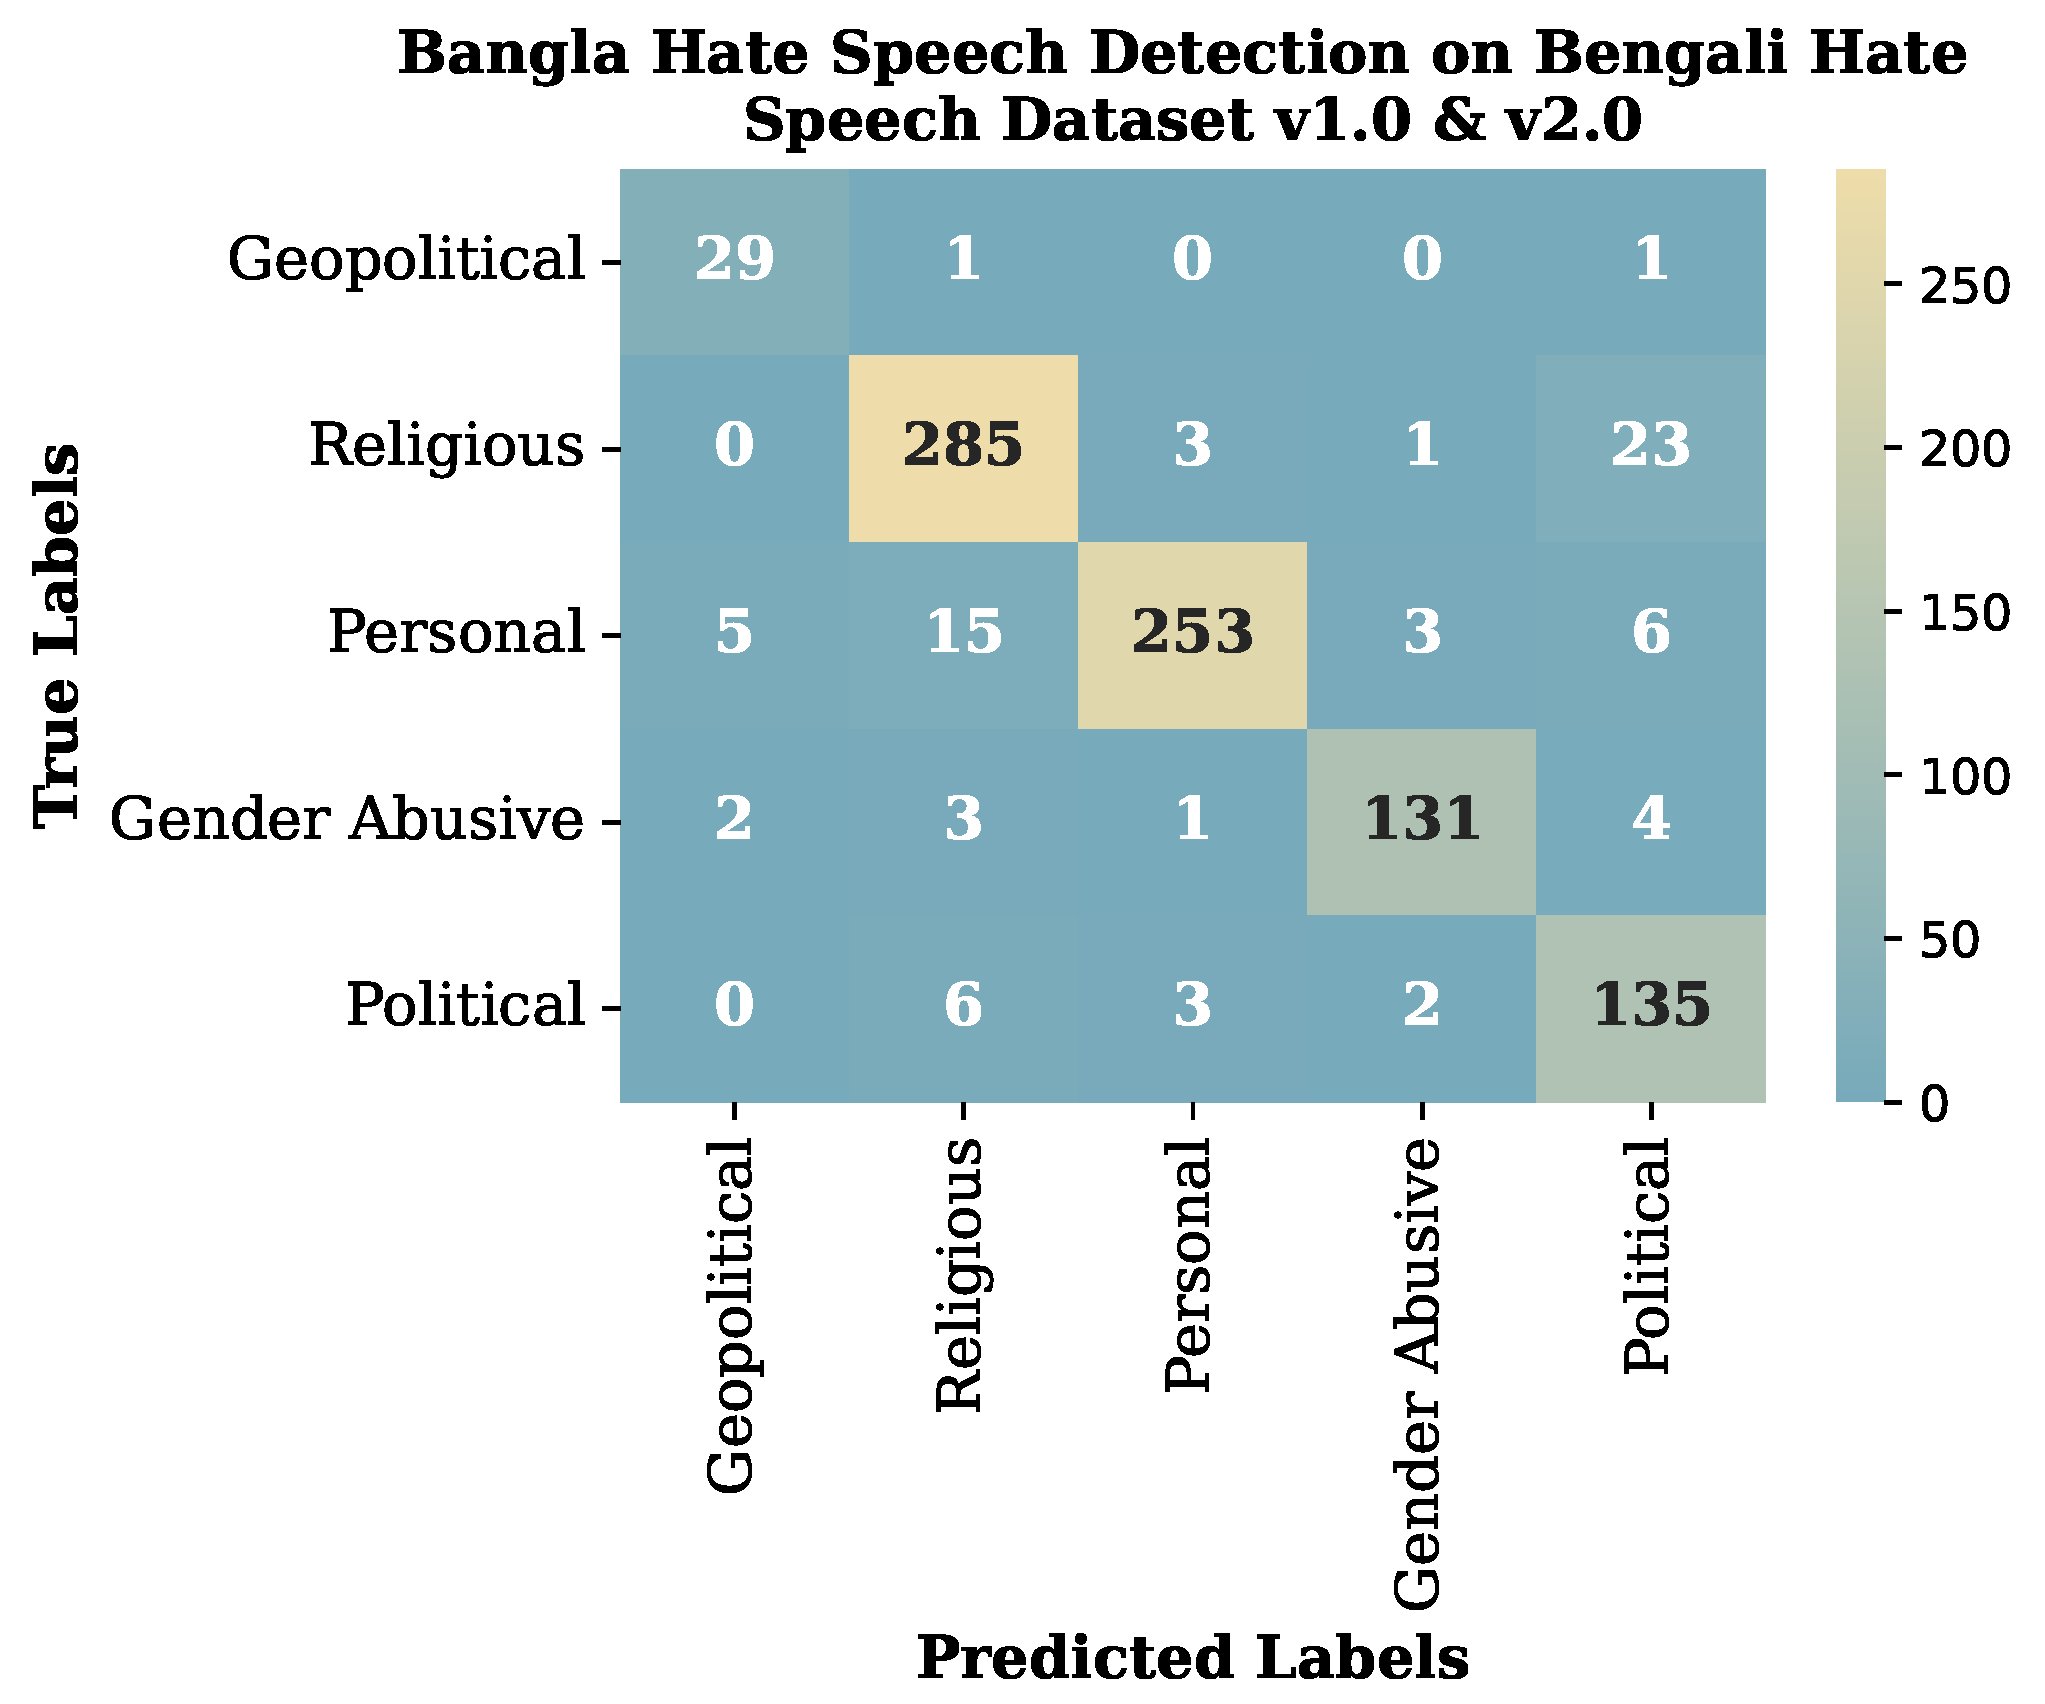
Table 7 provides a comprehensive evaluation of several models on the Bengali Hate Dataset, revealing that Bangla BERT Base achieves the highest accuracy at 91.34%, indicating it correctly classifies approximately 91.34% of the instances. Following closely, BanglaBERT and mBERT perform well with accuracies of 90.42% and 90.21%, respectively, while sahajBERT and XLM-RoBERTa have lower accuracies of 85.63% and 85.52%. In terms of precision, mBERT stands out with the highest value of 91.43%, suggesting a high rate of correctly identified positive instances, followed by Bangla BERT Base and BanglaBERT with similar high precision values of 91.76% and 90.87%. SahajBERT and XLM-RoBERTa, however, have lower precision values of 78.07% and 77.68%, indicating more false positives. Bangla BERT Base again leads with a recall of 91.12%, closely followed by BanglaBERT at 90.25% and mBERT at 90.84%, whereas sahajBERT and XLM-RoBERTa have lower recall values of 84.81% and 81.84%, respectively, indicating they miss more positive instances. The highest F1-Score is achieved by Bangla BERT Base at 91.54%, reflecting a strong balance between precision and recall, with BanglaBERT and mBERT also performing well with F1-Scores of 90.63% and 91.26%, respectively. Conversely, sahajBERT and XLM-RoBERTa have lower F1-Scores of 80.14% and 78.92%, reflecting their lower precision and recall. Overall, Bangla BERT Base demonstrates the best performance across all metrics, making it the most effective model for the Bengali Hate Dataset, while BanglaBERT and mBERT also show strong performance, particularly in precision and recall, making them reliable choices for hate speech detection. In contrast, sahajBERT and XLM-RoBERTa show comparatively lower performance across all metrics, suggesting they are more prone to false positives and false negatives, respectively. Furthermore,
Figure 14 and
Figure 15 present the confusion metrics for all the pre-trained language models (PLMs).
To further evaluate the performance differences among the pre-trained language models on the BD-SHS dataset, we conduct a one-way ANOVA analysis. This statistical test is applied to assess whether there are significant differences in accuracy, precision, recall, and F1-Score across the models presented in
Table 5,
Table 6 and
Table 7. The null hypothesis (H0) states that there are no significant differences in the means of the performance metrics among the models, while the alternative hypothesis (H1) proposes that at least one model exhibits a significantly different performance. The results of the ANOVA indicate a statistically significant effect of the model type on performance metrics (
p < 0.05). Consequently, post hoc tests, such as Tukey’s HSD, are performed to identify specific model comparisons contributing to the significant differences observed.
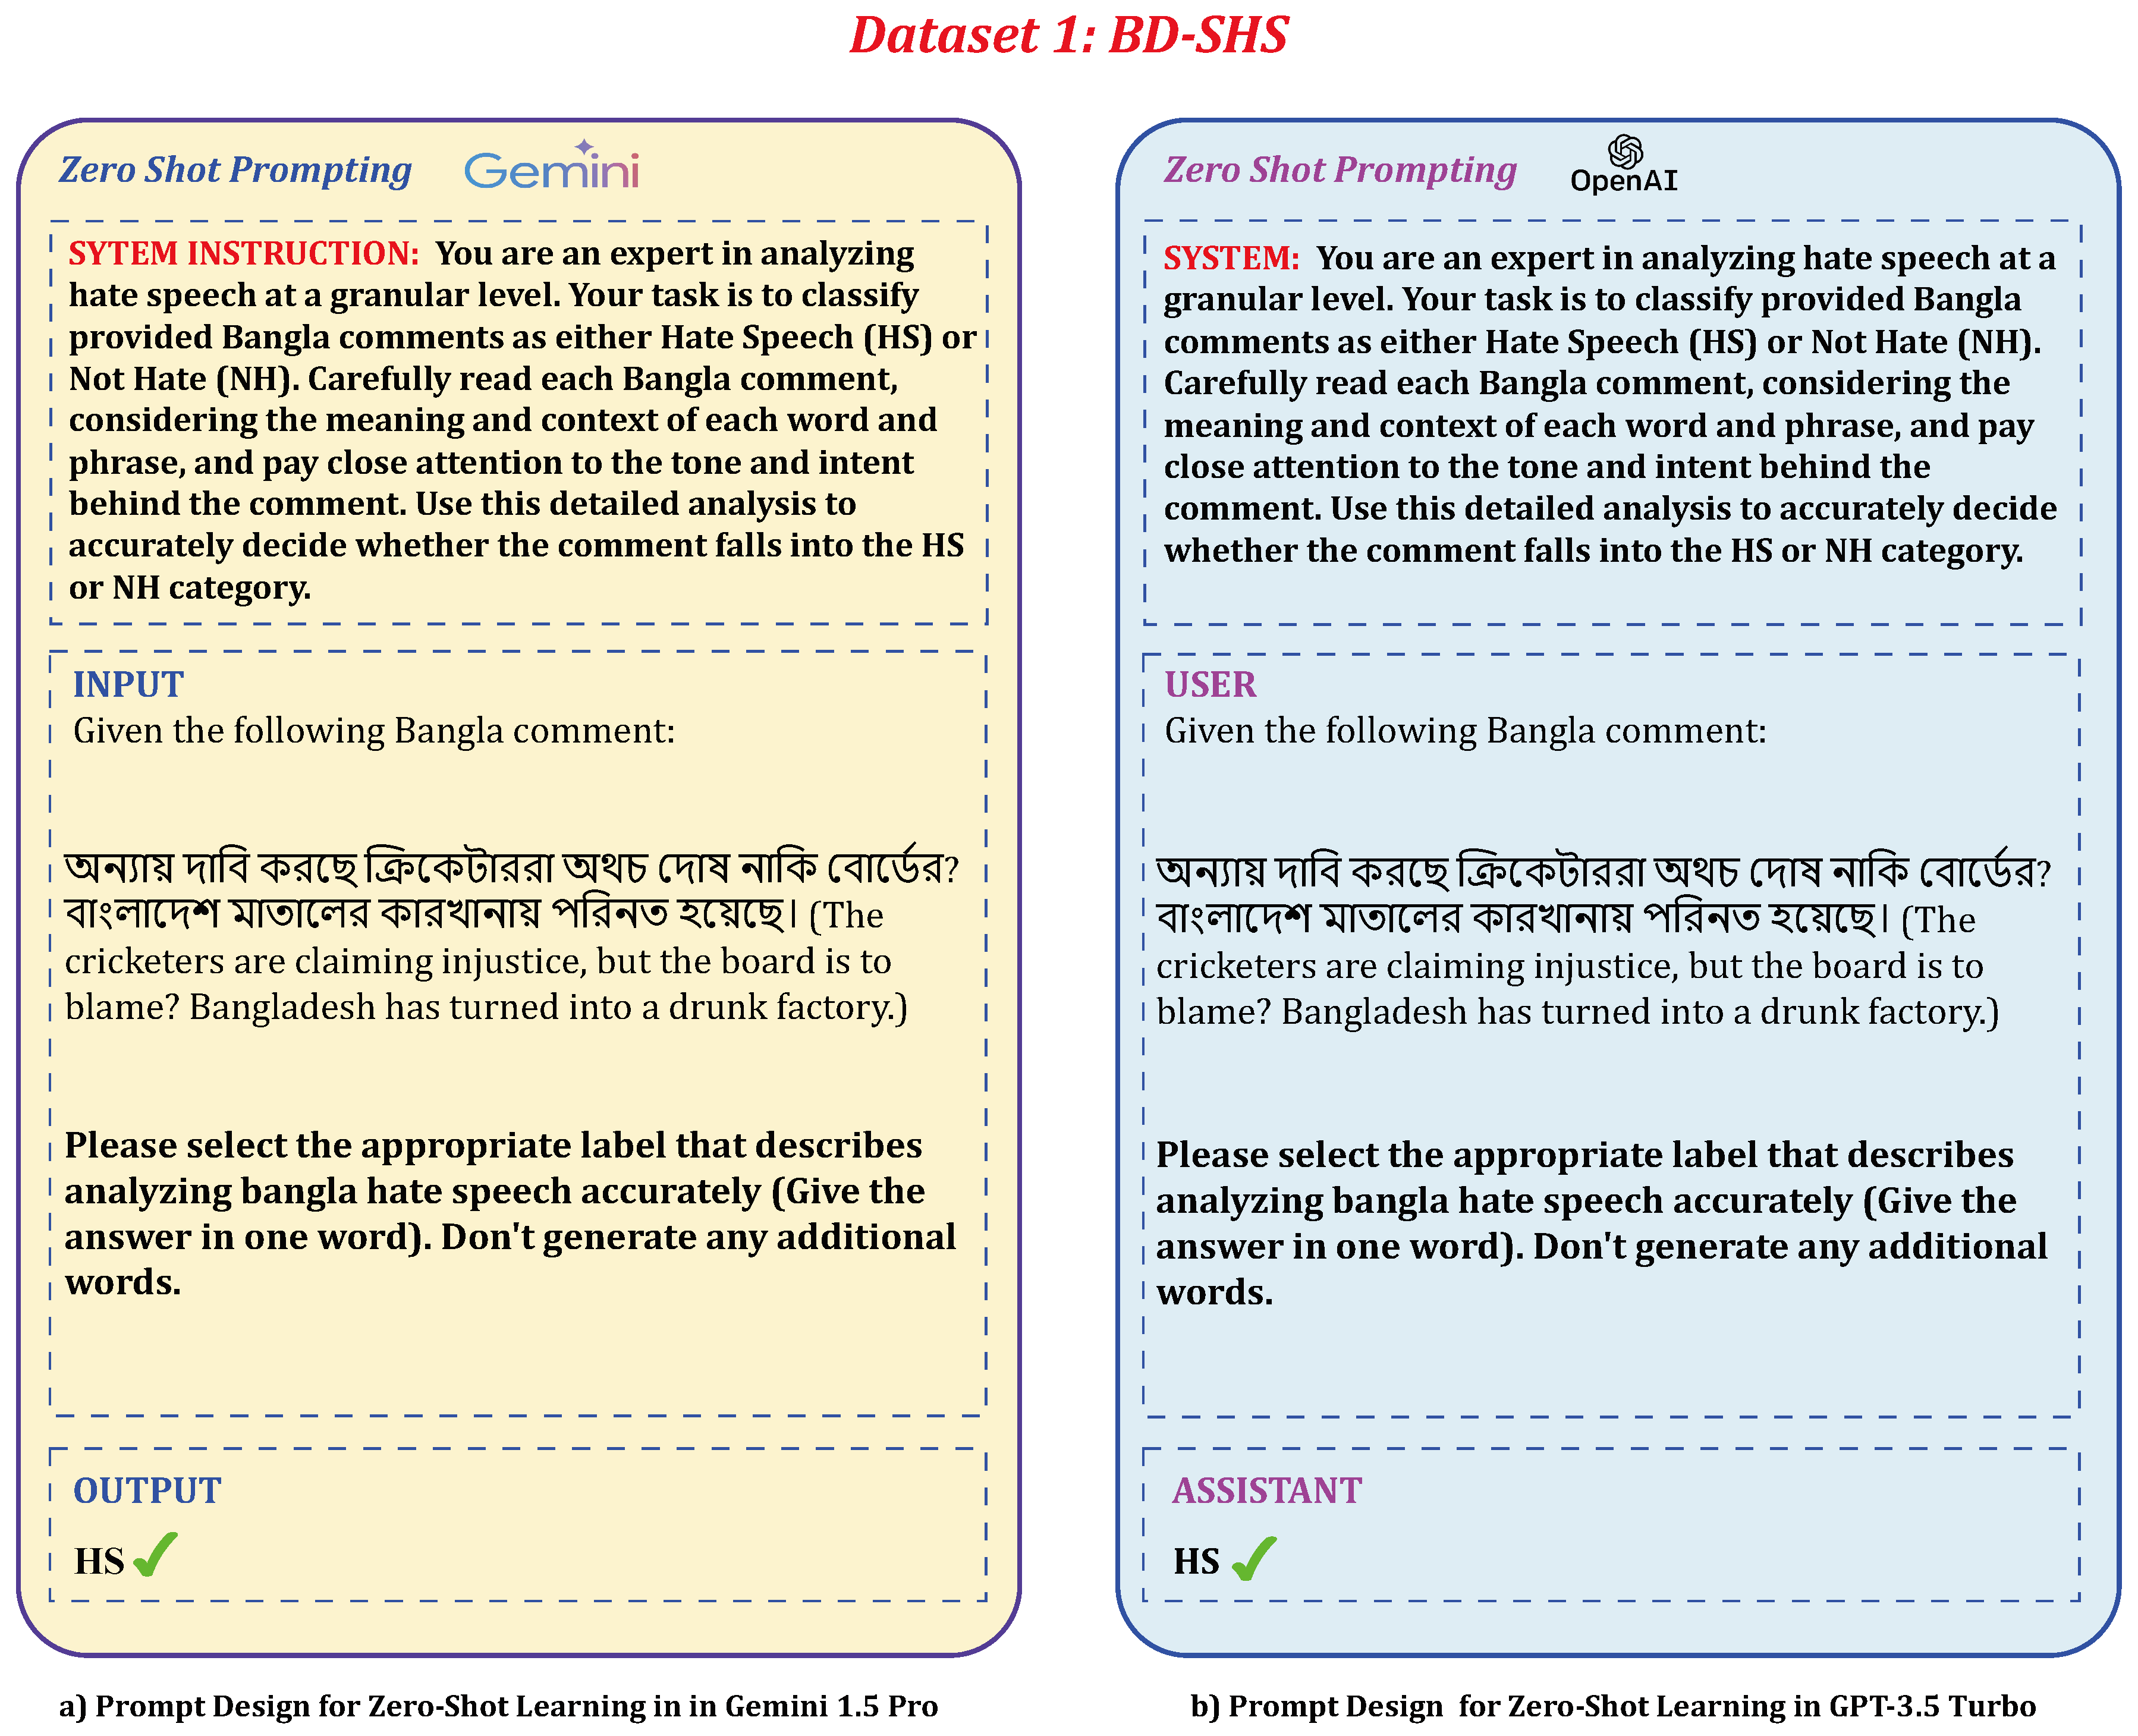
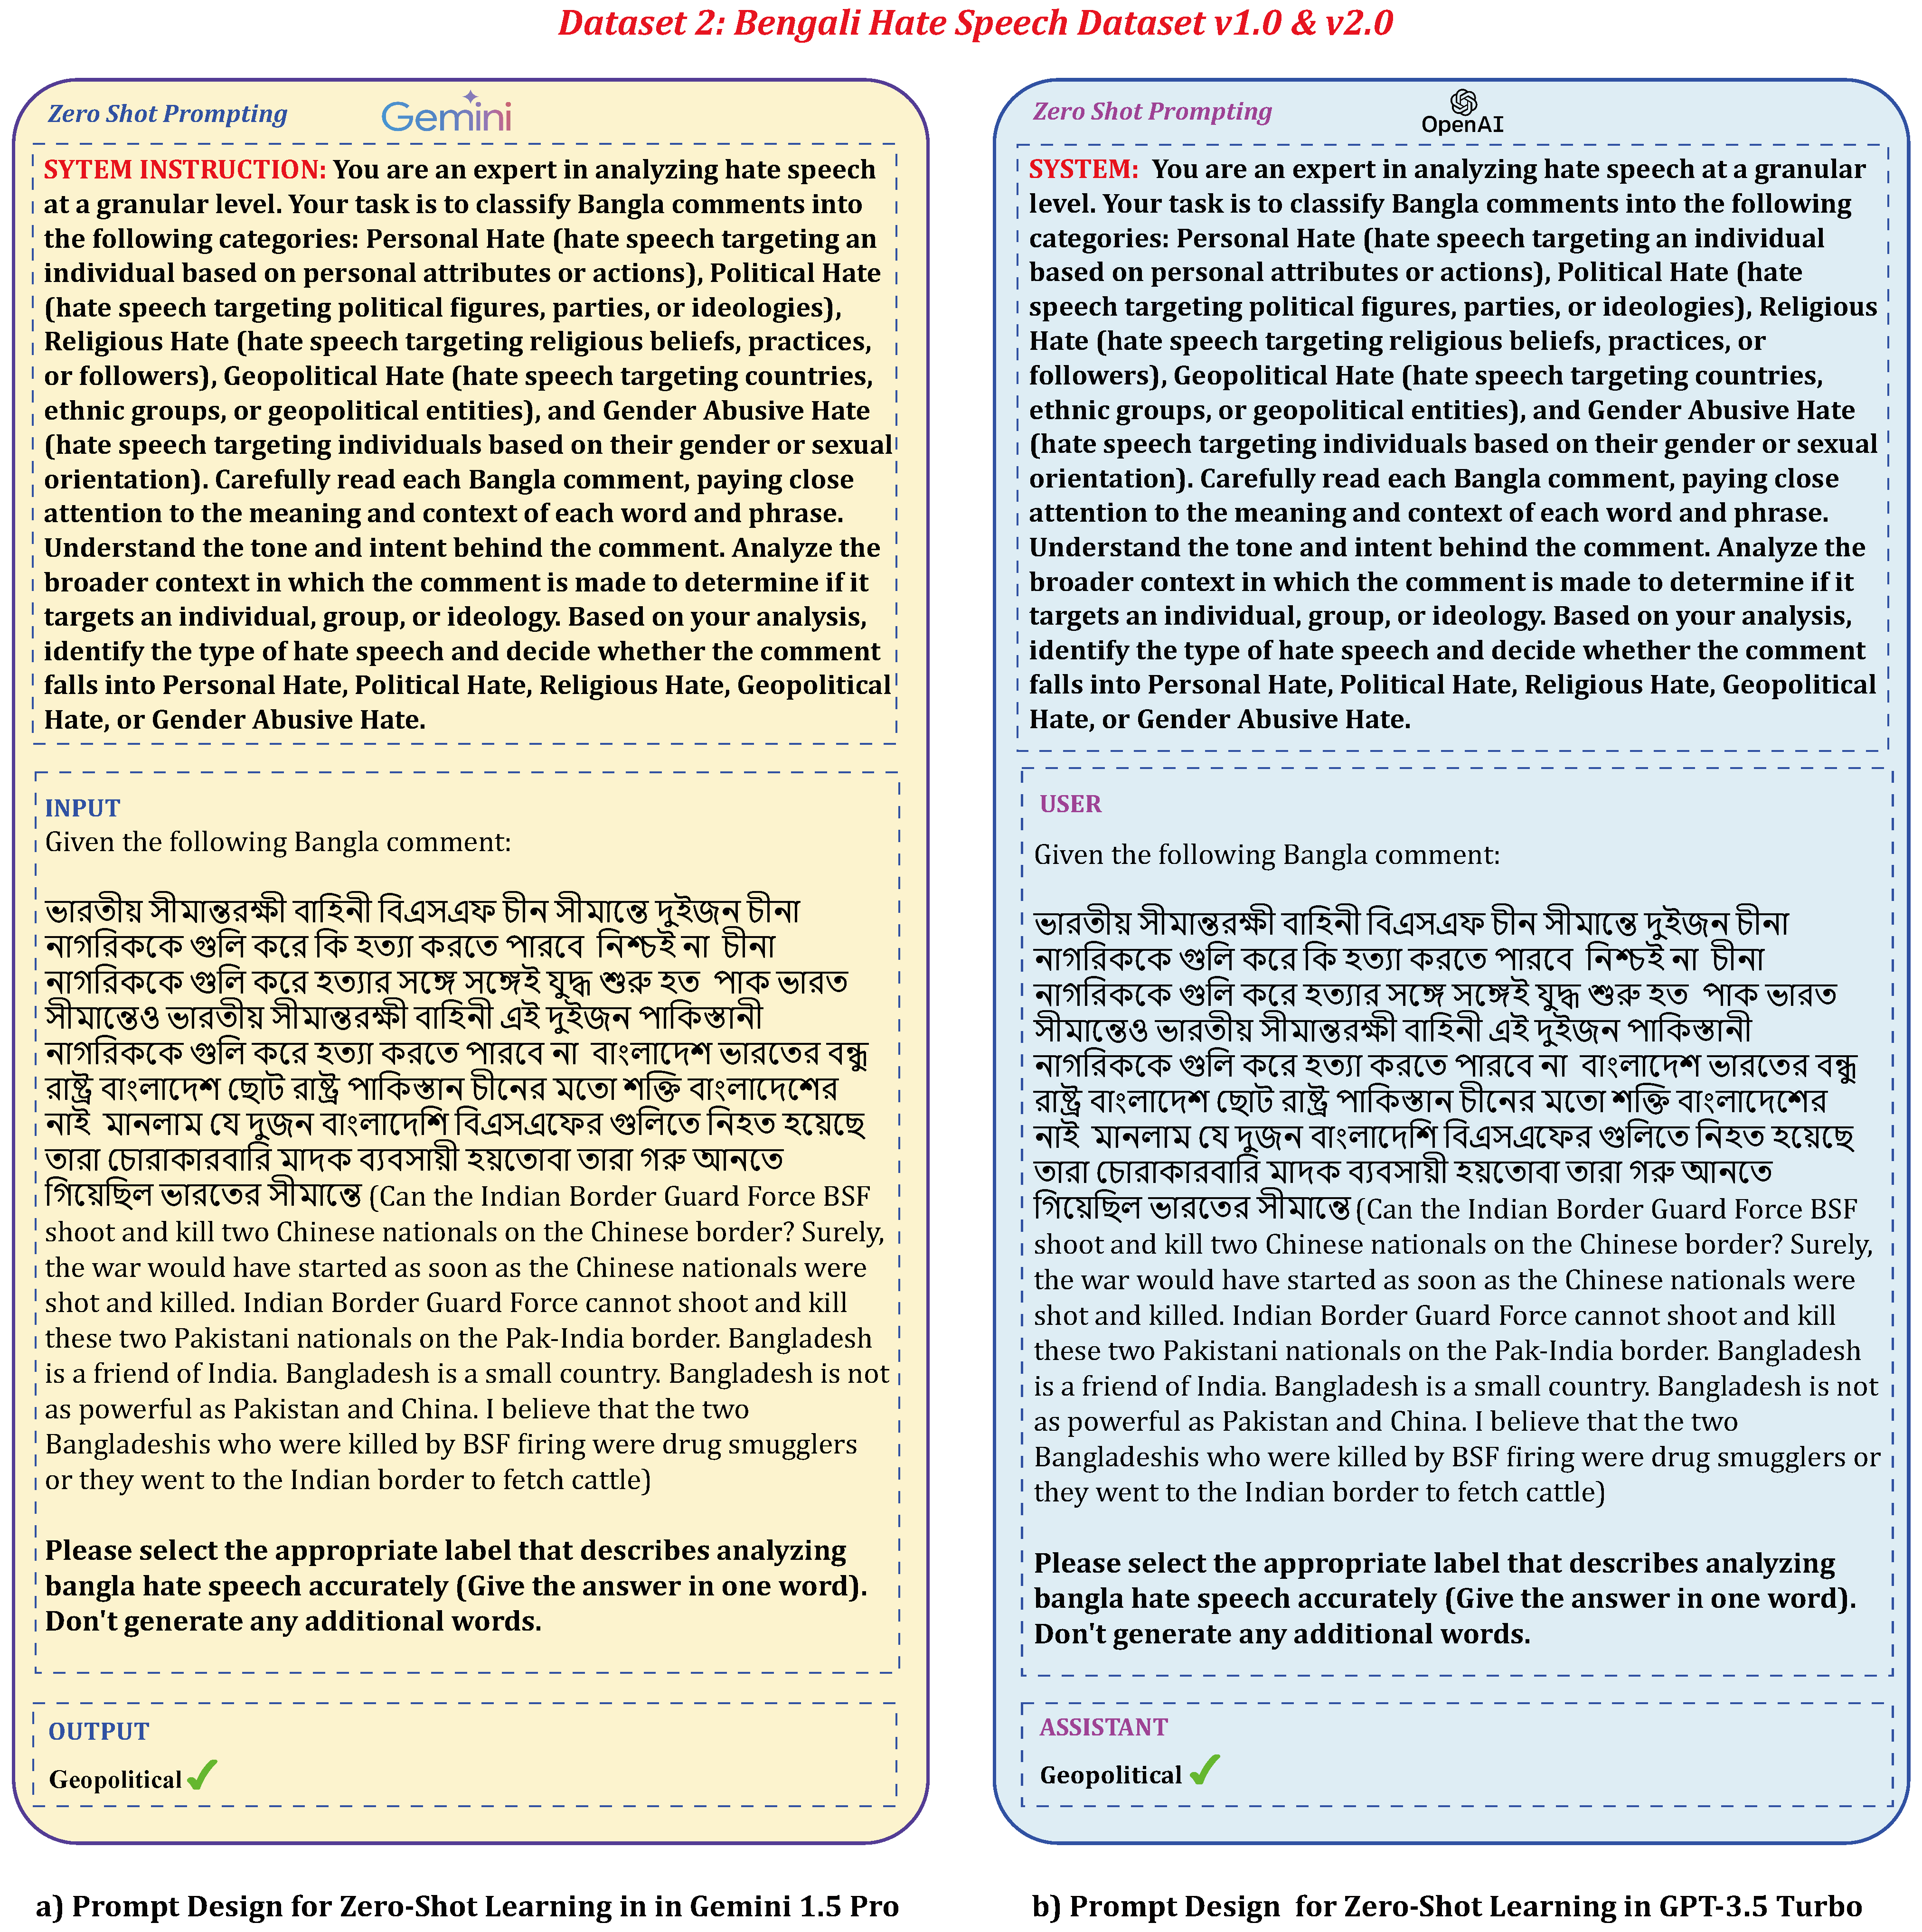
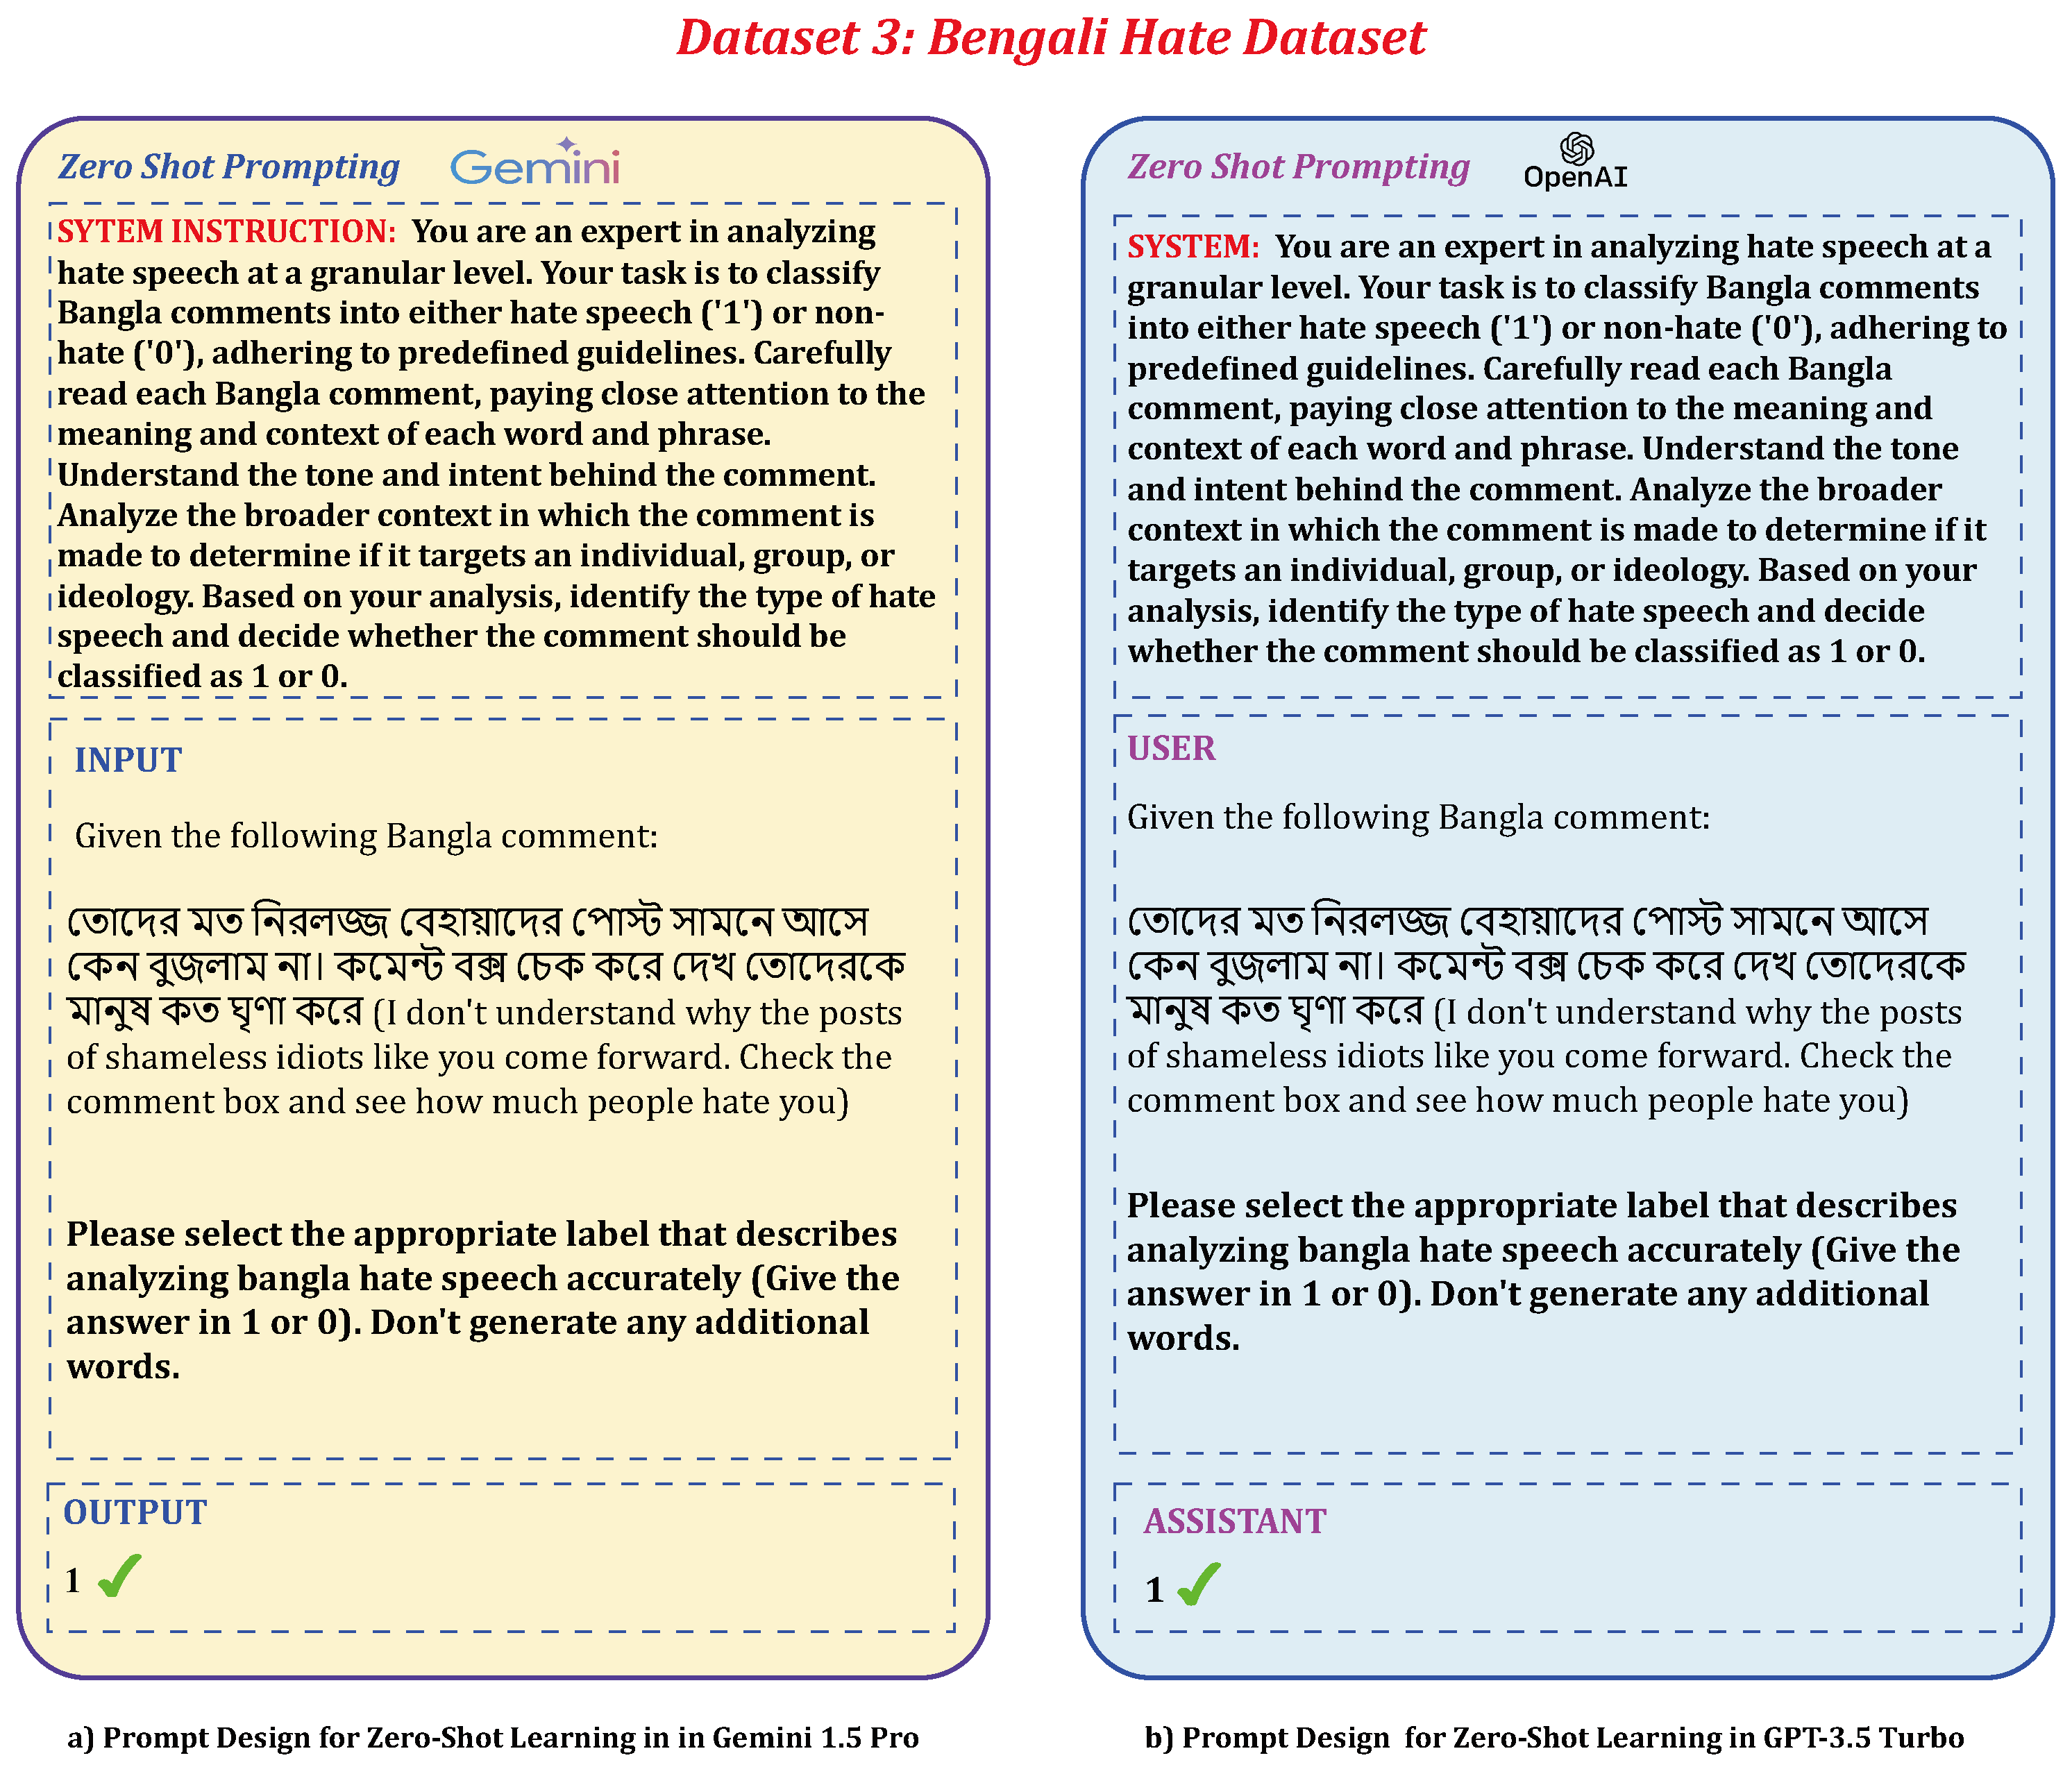
Table 12 presents a comparative analysis of the performance metrics of two language models, GPT 3.5 Turbo and Gemini 1.5 Pro, across three distinct datasets in a Zero-Shot Learning setting. In Dataset 1, GPT 3.5 Turbo achieves an accuracy of 86.61%, with precision, recall, and F1-Score values closely aligned at 86.69%, 86.71%, and 86.65%, respectively, while Gemini 1.5 Pro achieves 82.20% accuracy, with precision, recall, and F1-Score values around 82.18%, 82.24%, and 82.19%, respectively. Moving to Dataset 2, GPT 3.5 Turbo demonstrates an accuracy of 80.29%, with precision, recall, and F1-Score values of approximately 80.31%, 80.24%, and 80.27%, respectively, whereas Gemini 1.5 Pro shows a slightly higher accuracy of 81.30%, maintaining consistent precision, recall, and F1-Score values of 81.30%. In Dataset 3, GPT 3.5 Turbo achieves an accuracy of 83.31%, with precision, recall, and F1-Score values all hovering around 83.30% and 83.31%, respectively, while Gemini 1.5 Pro demonstrates superior performance with an accuracy of 87.76%, achieving precision, recall, and F1-Score values of 87.82%, 87.69%, and 87.75%, respectively. Overall, both models show competitive performance metrics across datasets, with GPT 3.5 Turbo maintaining stable performance and Gemini 1.5 Pro exhibiting noticeable improvements, particularly in Dataset 3. However, it is important to note that these zero-shot results generally indicate worse performance compared to models fine-tuned on specific tasks, such as pre-trained language models, due to the lack of task-specific training and adaptation.
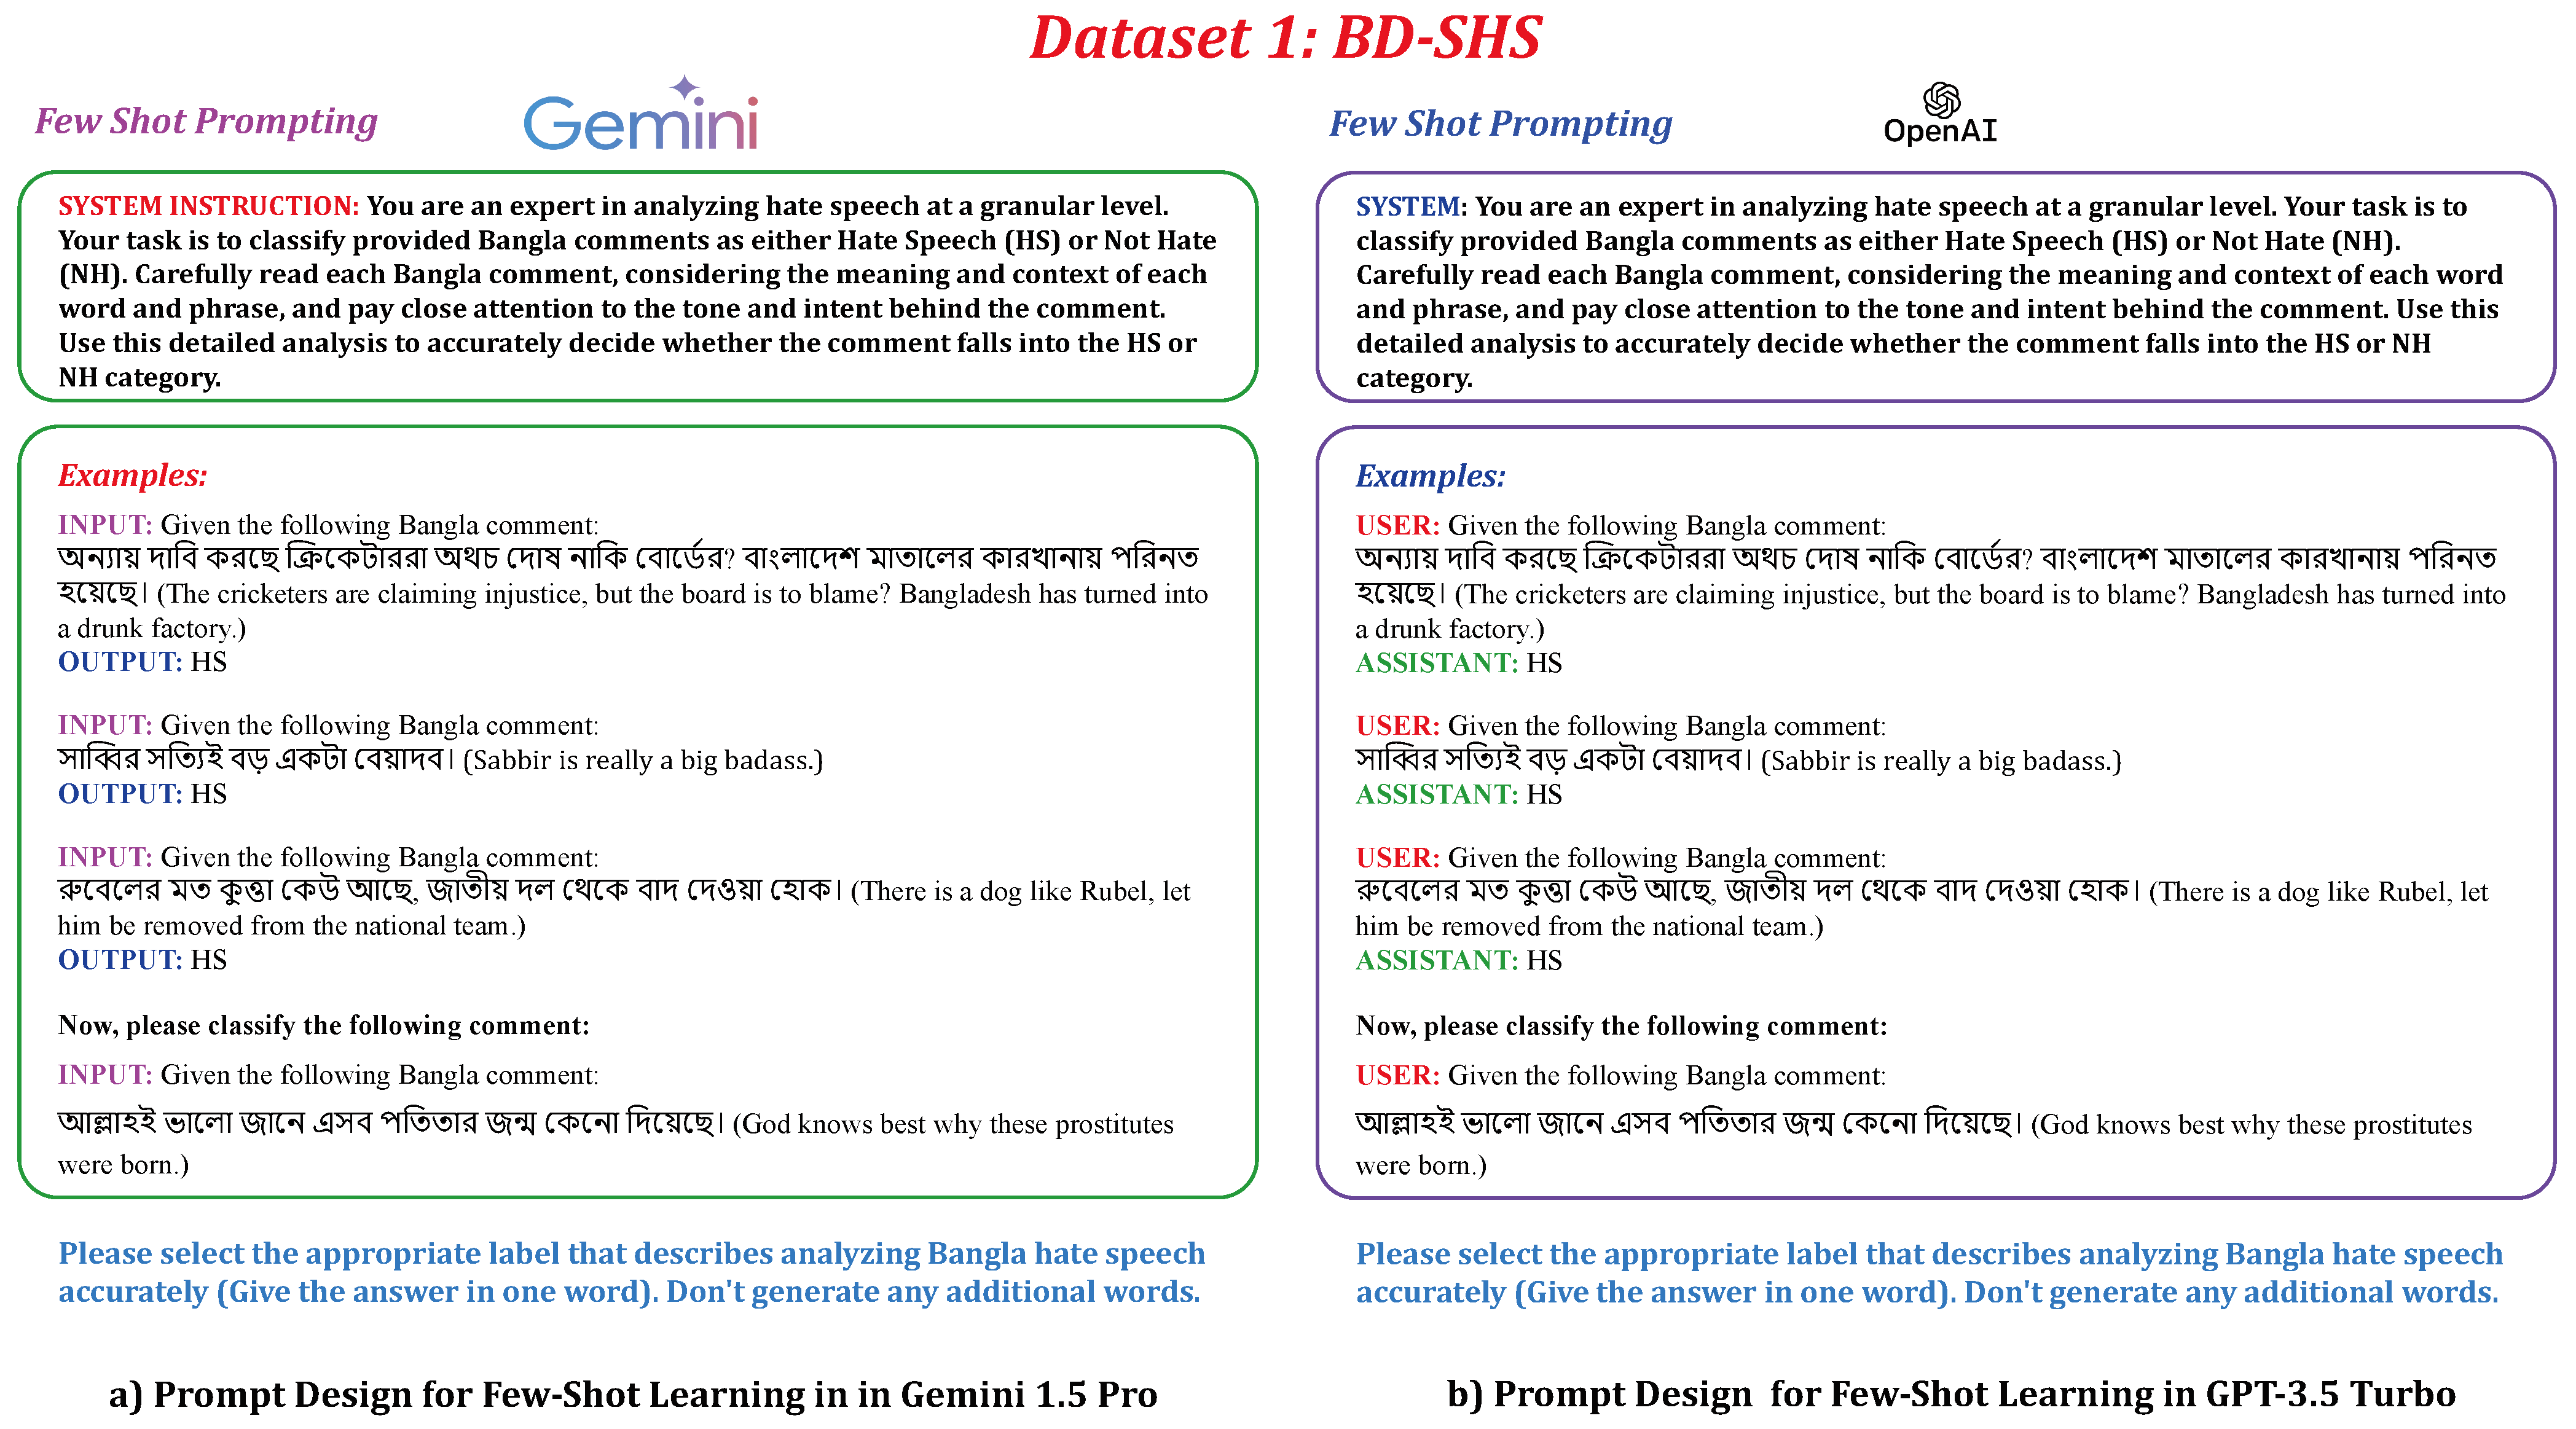
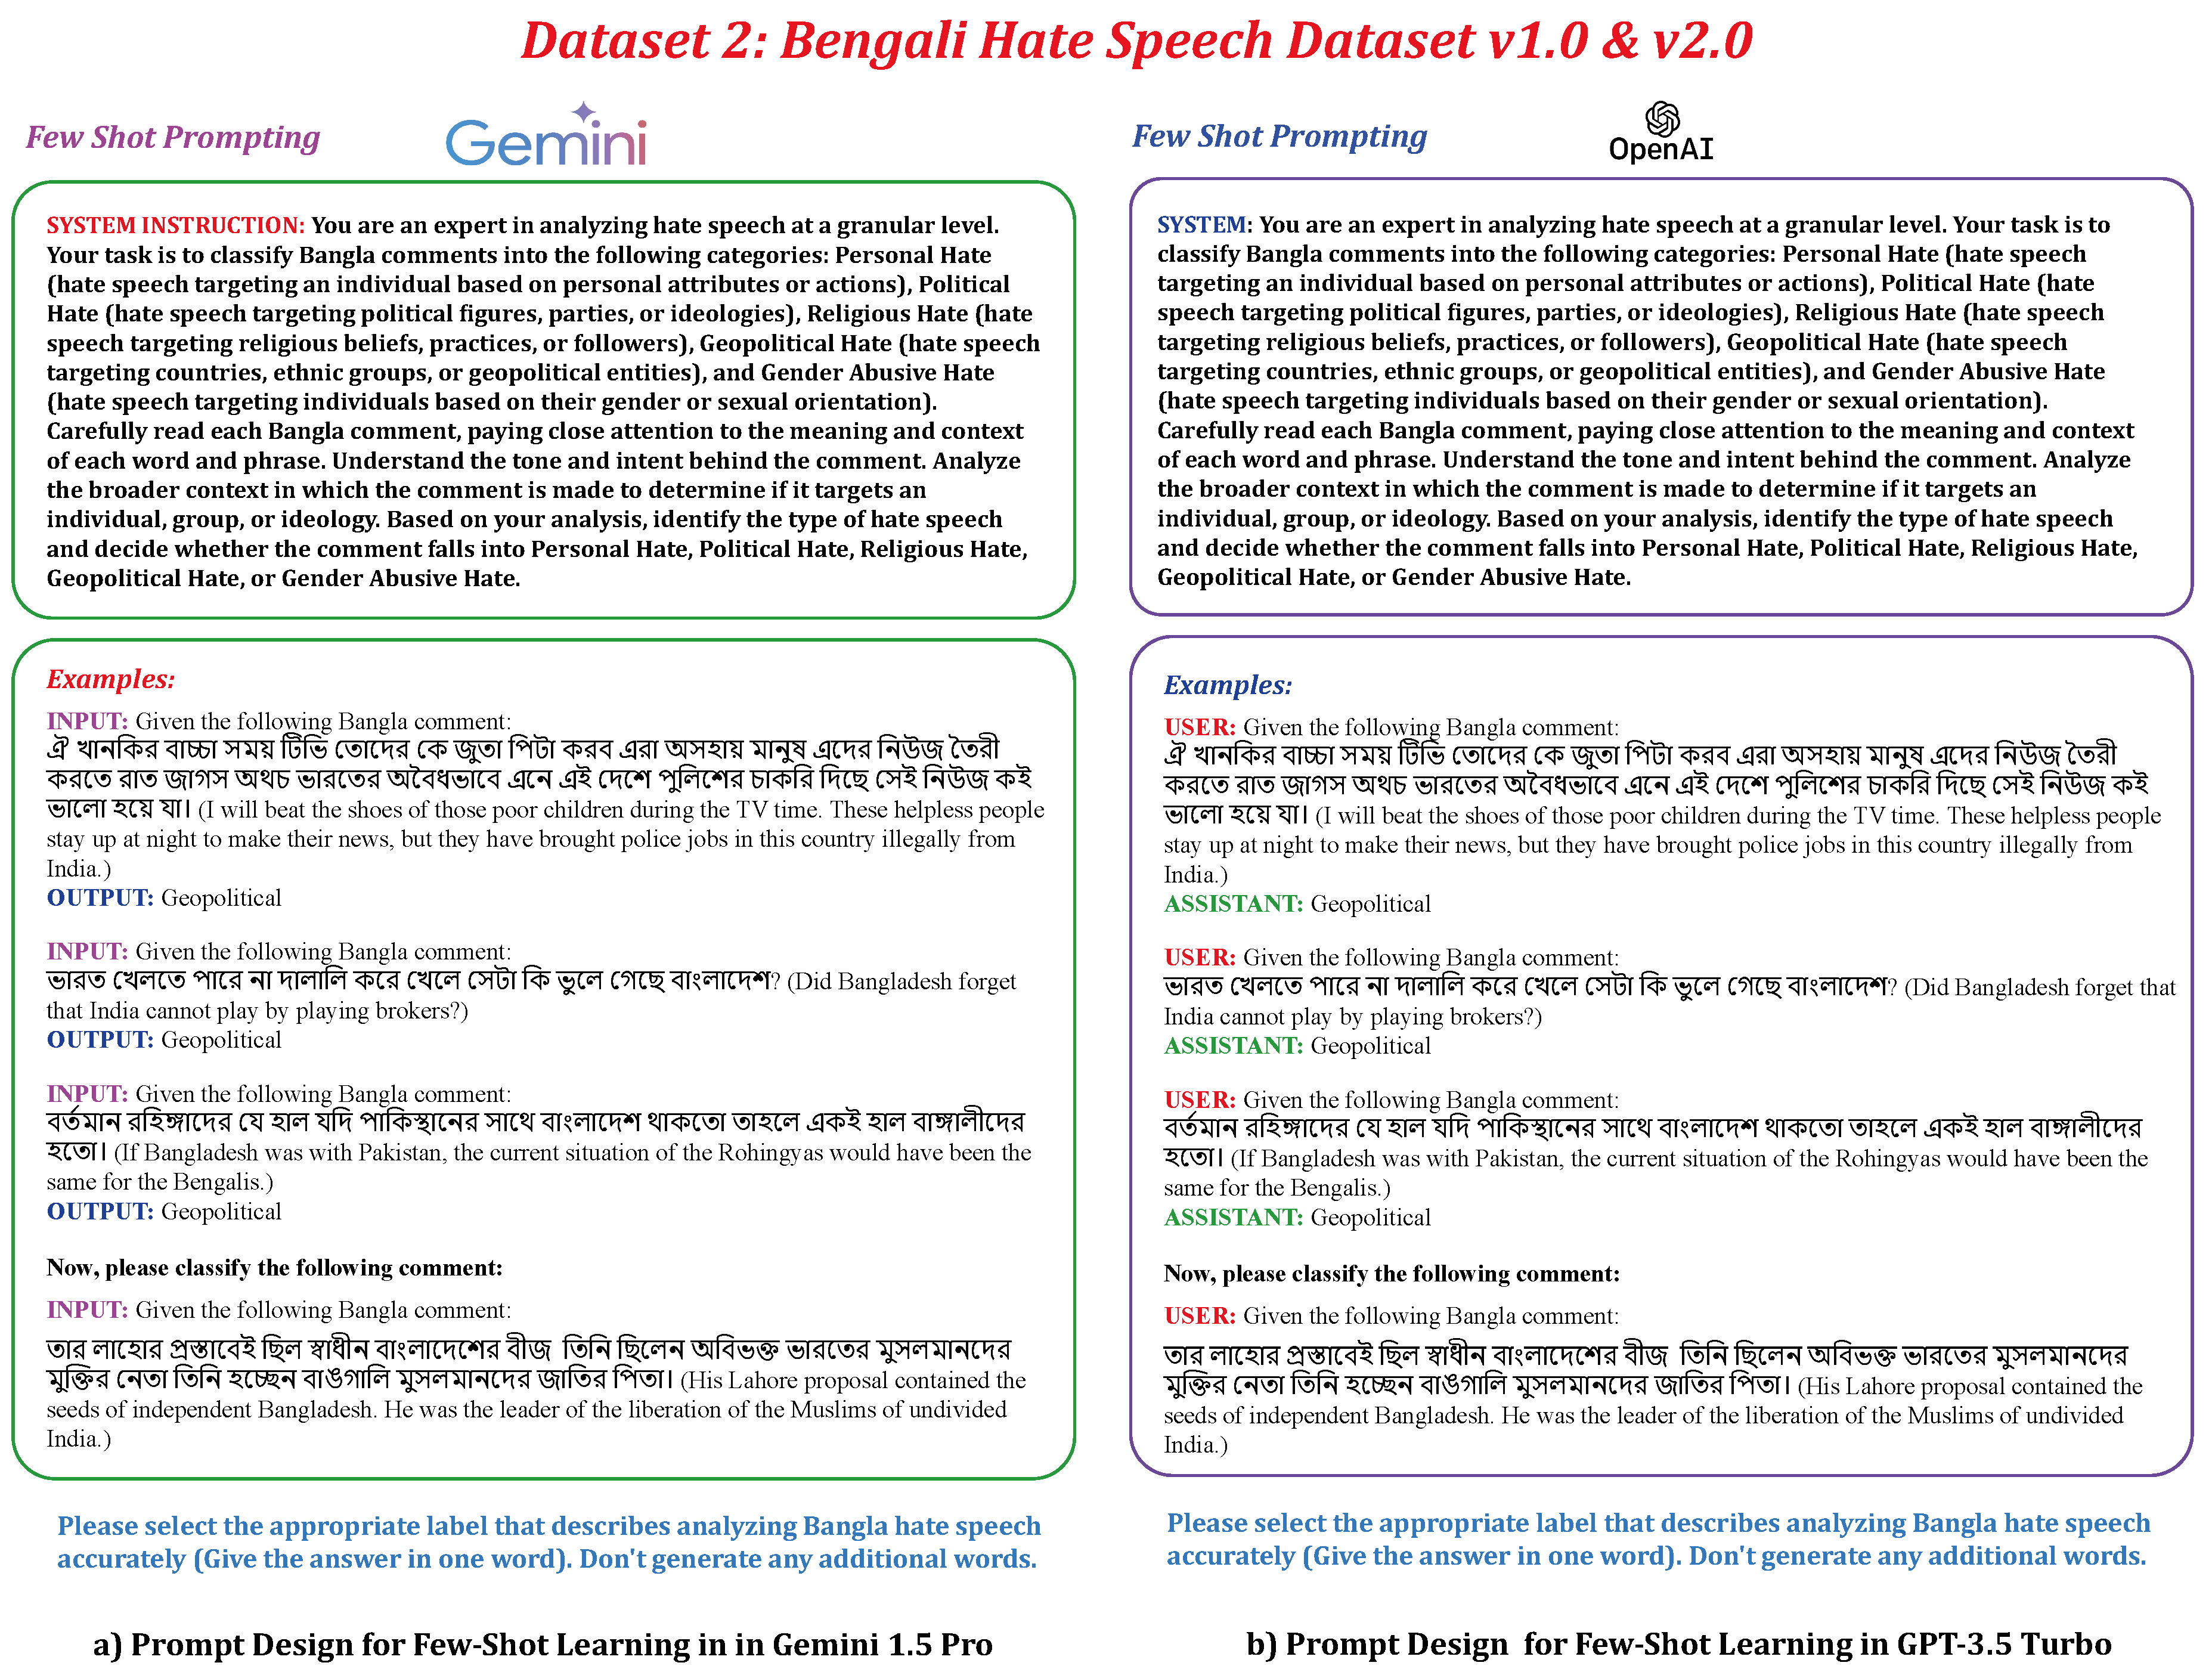
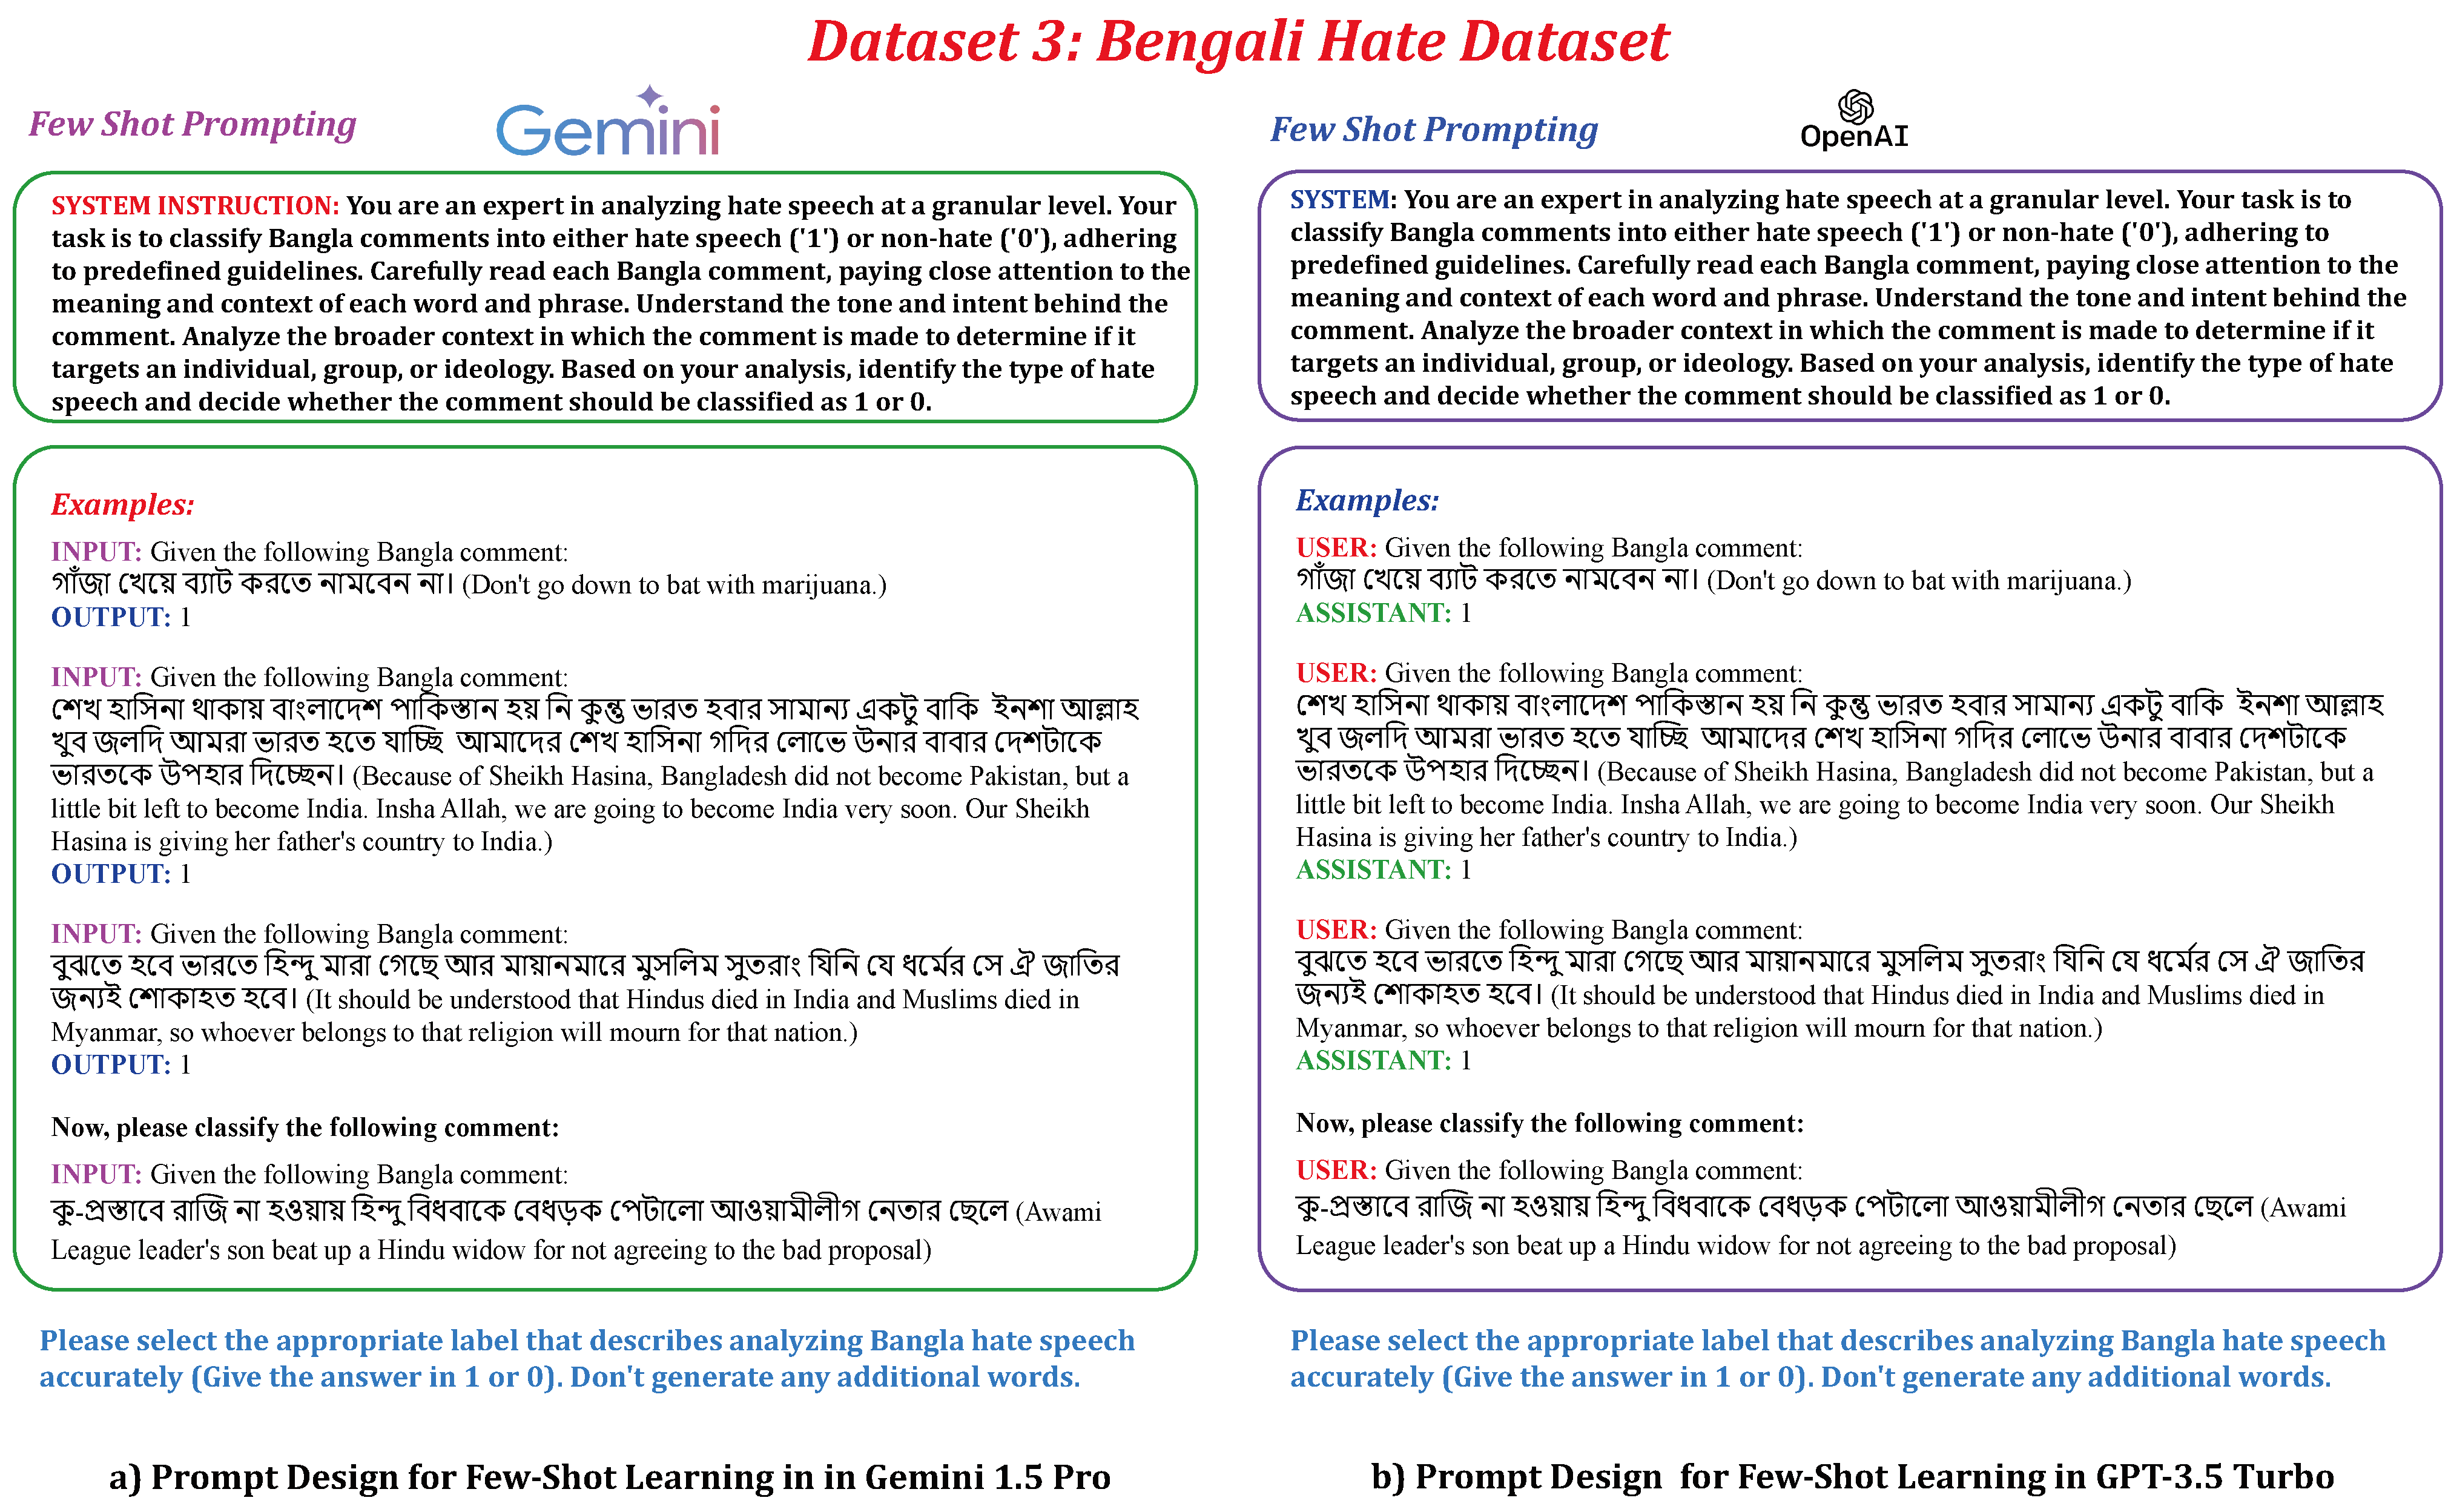
Table 8 showcases the performance of two Large Language Models, GPT-3.5 Turbo and Gemini-1.5 Pro, across three datasets in a 5-shot learning scenario. GPT-3.5 Turbo consistently outperforms Gemini-1.5 Pro on all datasets, with the most pronounced difference in Dataset 1 (approximately 2.5 percentage points across all metrics) and the least in Dataset 2 (less than 0.2 percentage points). For Dataset 1, GPT-3.5 Turbo achieves 93.79% accuracy, 93.85% precision, 93.73% recall, and 93.79% F1-Score, while Gemini-1.5 Pro scores 91.29%, 91.30%, 91.24%, and 91.27%, respectively. On Dataset 2, GPT-3.5 Turbo’s metrics remain strong and consistent with those of Dataset 1, whereas Gemini-1.5 Pro improves significantly to 93.65% accuracy, 93.71% precision, 93.79% recall, and 93.64% F1-Score. For Dataset 3, GPT-3.5 Turbo demonstrates its best performance with metrics around 94.65%, compared to Gemini-1.5 Pro’s 92.29% accuracy, 92.30% precision, 92.24% recall, and 92.27% F1-Score. Overall, GPT-3.5 Turbo shows higher consistency and robustness across datasets, while Gemini-1.5 Pro exhibits more variation, indicating potential sensitivity to dataset characteristics. Notably, the 5-shot learning approach consistently outperforms both zero-shot and pre-trained language models due to its ability to leverage a small amount of task-specific training data, allowing for improved adaptation to the task at hand.
Table 9 provides a detailed performance comparison of two advanced Large Language Models, GPT-3.5 Turbo and Gemini 1.5 Pro, across three different datasets in a 10-shot learning scenario using four key evaluation metrics: accuracy, precision, recall, and F1-Score. For Dataset 1, GPT-3.5 Turbo demonstrates strong performance with an accuracy of 94.53%, precision of 94.48%, recall of 94.57%, and F1-Score of 94.52%, outperforming Gemini 1.5 Pro which has an accuracy of 93.75%, precision of 93.72%, recall of 93.78%, and F1-Score of 93.76%. On Dataset 2, GPT-3.5 Turbo maintains high performance with an accuracy of 95.67%, precision of 95.63%, recall of 95.69%, and F1-Score of 95.66% but is surpassed by Gemini 1.5 Pro, which achieves an accuracy of 96.67%, precision of 96.63%, recall of 96.69%, and F1-Score of 96.66%. For Dataset 3, GPT-3.5 Turbo again shows strong performance with an accuracy of 95.67%, precision of 95.63%, recall of 95.69%, and F1-Score of 95.66%, whereas Gemini 1.5 Pro performs less well with an accuracy of 93.20%, precision of 93.18%, recall of 93.24%, and F1-Score of 93.19%. Overall, GPT-3.5 Turbo generally outperforms Gemini 1.5 Pro on Datasets 1 and 3, while Gemini 1.5 Pro shows superior performance on Dataset 2, with trends in precision, recall, and F1-Score following the accuracy trends. The 10-shot learning approach consistently demonstrates better performance compared to 5-shot learning, zero-shot, and pre-trained language models. This improvement is attributed to the increased amount of task-specific training data, allowing the models to better adapt and generalize to the evaluation tasks, resulting in higher accuracy and more balanced precision–recall trade-offs.
In the comparative analysis presented in
Table 10, GPT 3.5 Turbo and Gemini 1.5 Pro are evaluated across three distinct datasets in a 15-shot learning scenario. Across Dataset 1, GPT 3.5 Turbo slightly outperforms Gemini 1.5 Pro with higher accuracy (97.33% compared to 97.11%), precision (97.31% compared to 97.02%), recall (97.35% compared to 97.15%), and F1-Score (97.33% compared to 97.13%). Moving to Dataset 2 and Dataset 3, GPT 3.5 Turbo consistently demonstrates superior performance with noticeably higher accuracy, precision, recall, and F1-Scores compared to Gemini 1.5 Pro. Specifically, in Dataset 2, GPT 3.5 Turbo achieves an accuracy and F1-Score of 98.42%, while Gemini 1.5 Pro scores 97.23% and 97.23%, respectively. In Dataset 3, GPT 3.5 Turbo maintains high metrics with 98.53% accuracy and 98.53% F1-Score, whereas Gemini 1.5 Pro achieves 97.47% and 97.48%. This comprehensive analysis highlights GPT 3.5 Turbo’s consistent superiority over Gemini 1.5 Pro across diverse datasets in the 15-shot learning scenario. The 15-shot learning approach demonstrates superior performance compared to the 5-shot and 10-shot learning methods, as well as the zero-shot and pre-trained language models. This improvement can be attributed to the increased availability of task-specific training data, allowing the models to refine their understanding and optimization for the evaluation tasks, resulting in higher accuracy and precision–recall balance. Additionally, the 15-shot learning scenario benefits from a larger sample of task-specific examples during training, facilitating deeper model adaptation and more accurate predictions.
Table 13 provides a comprehensive performance comparison of four traditional machine learning models—Logistic Regression (LR), Support Vector Machine (SVM), Random Forest (RF), and Naive Bayes (NB)—across three distinct datasets. In Dataset 1, Naive Bayes achieves the highest accuracy at 74.35%, demonstrating its efficacy in handling the data characteristics, while Logistic Regression closely follows with an accuracy of 74.01%. Random Forest and SVM perform slightly worse, with accuracies of 73.23% and 72.12%, respectively. This indicates that, while all models show comparable performance, Naive Bayes and LR are particularly adept in this scenario. In Dataset 2, Logistic Regression leads with an accuracy of 75.12%, showcasing its strength in this dataset. SVM, despite being the second-best performer overall, records an accuracy of 73.34%, which is significantly lower than the performance of LR. Random Forest and Naive Bayes trail with accuracies of 74.05% and 72.56%, respectively, further highlighting the competitive edge of LR in this context. Dataset 3 reveals a similar trend, where Naive Bayes again excels, achieving the highest accuracy of 75.92%. Random Forest follows with an accuracy of 73.56%, while SVM lags behind at 71.23%. This dataset reinforces Naive Bayes’ robust performance across varying data characteristics. Overall, the results underscore that Naive Bayes consistently provides strong performance across all datasets, particularly excelling in Dataset 3, while Logistic Regression stands out in Dataset 2.
However, it is essential to note that the reported metrics lack confidence intervals, which limits our ability to fully assess the uncertainty and variability of these performance estimates. Confidence intervals provide a critical range within which the true performance of the models is likely to fall, allowing for a more nuanced understanding of their reliability. For instance, a model reported with an accuracy of 74.35% may have a confidence interval of 72% to 76%, indicating that while the model performs well, there is still some uncertainty about its effectiveness across different samples. Conversely, if another model has an accuracy of 75.12% with a confidence interval of 70% to 80%, this suggests a broader range of uncertainty, which could affect the interpretability of the results.
Moreover, confidence intervals are particularly valuable when comparing models; overlapping intervals can suggest that the differences in performance are not statistically significant, while non-overlapping intervals can indicate clear distinctions between model effectiveness. Therefore, the absence of confidence intervals means we cannot confidently claim which model performs better or how reliable these performance metrics are in real-world applications (see
Figure 16).
The comparative analysis indicates that while traditional models can yield valuable insights, their effectiveness is significantly overshadowed by the performance of pre-trained language models (PLMs) and Large Language Models (LLMs) in our experiment. Naive Bayes and Logistic Regression, although promising for accurate predictions, are notably less effective compared to the advanced capabilities exhibited by PLMs and LLMs, highlighting a clear advantage for these modern approaches in this study.
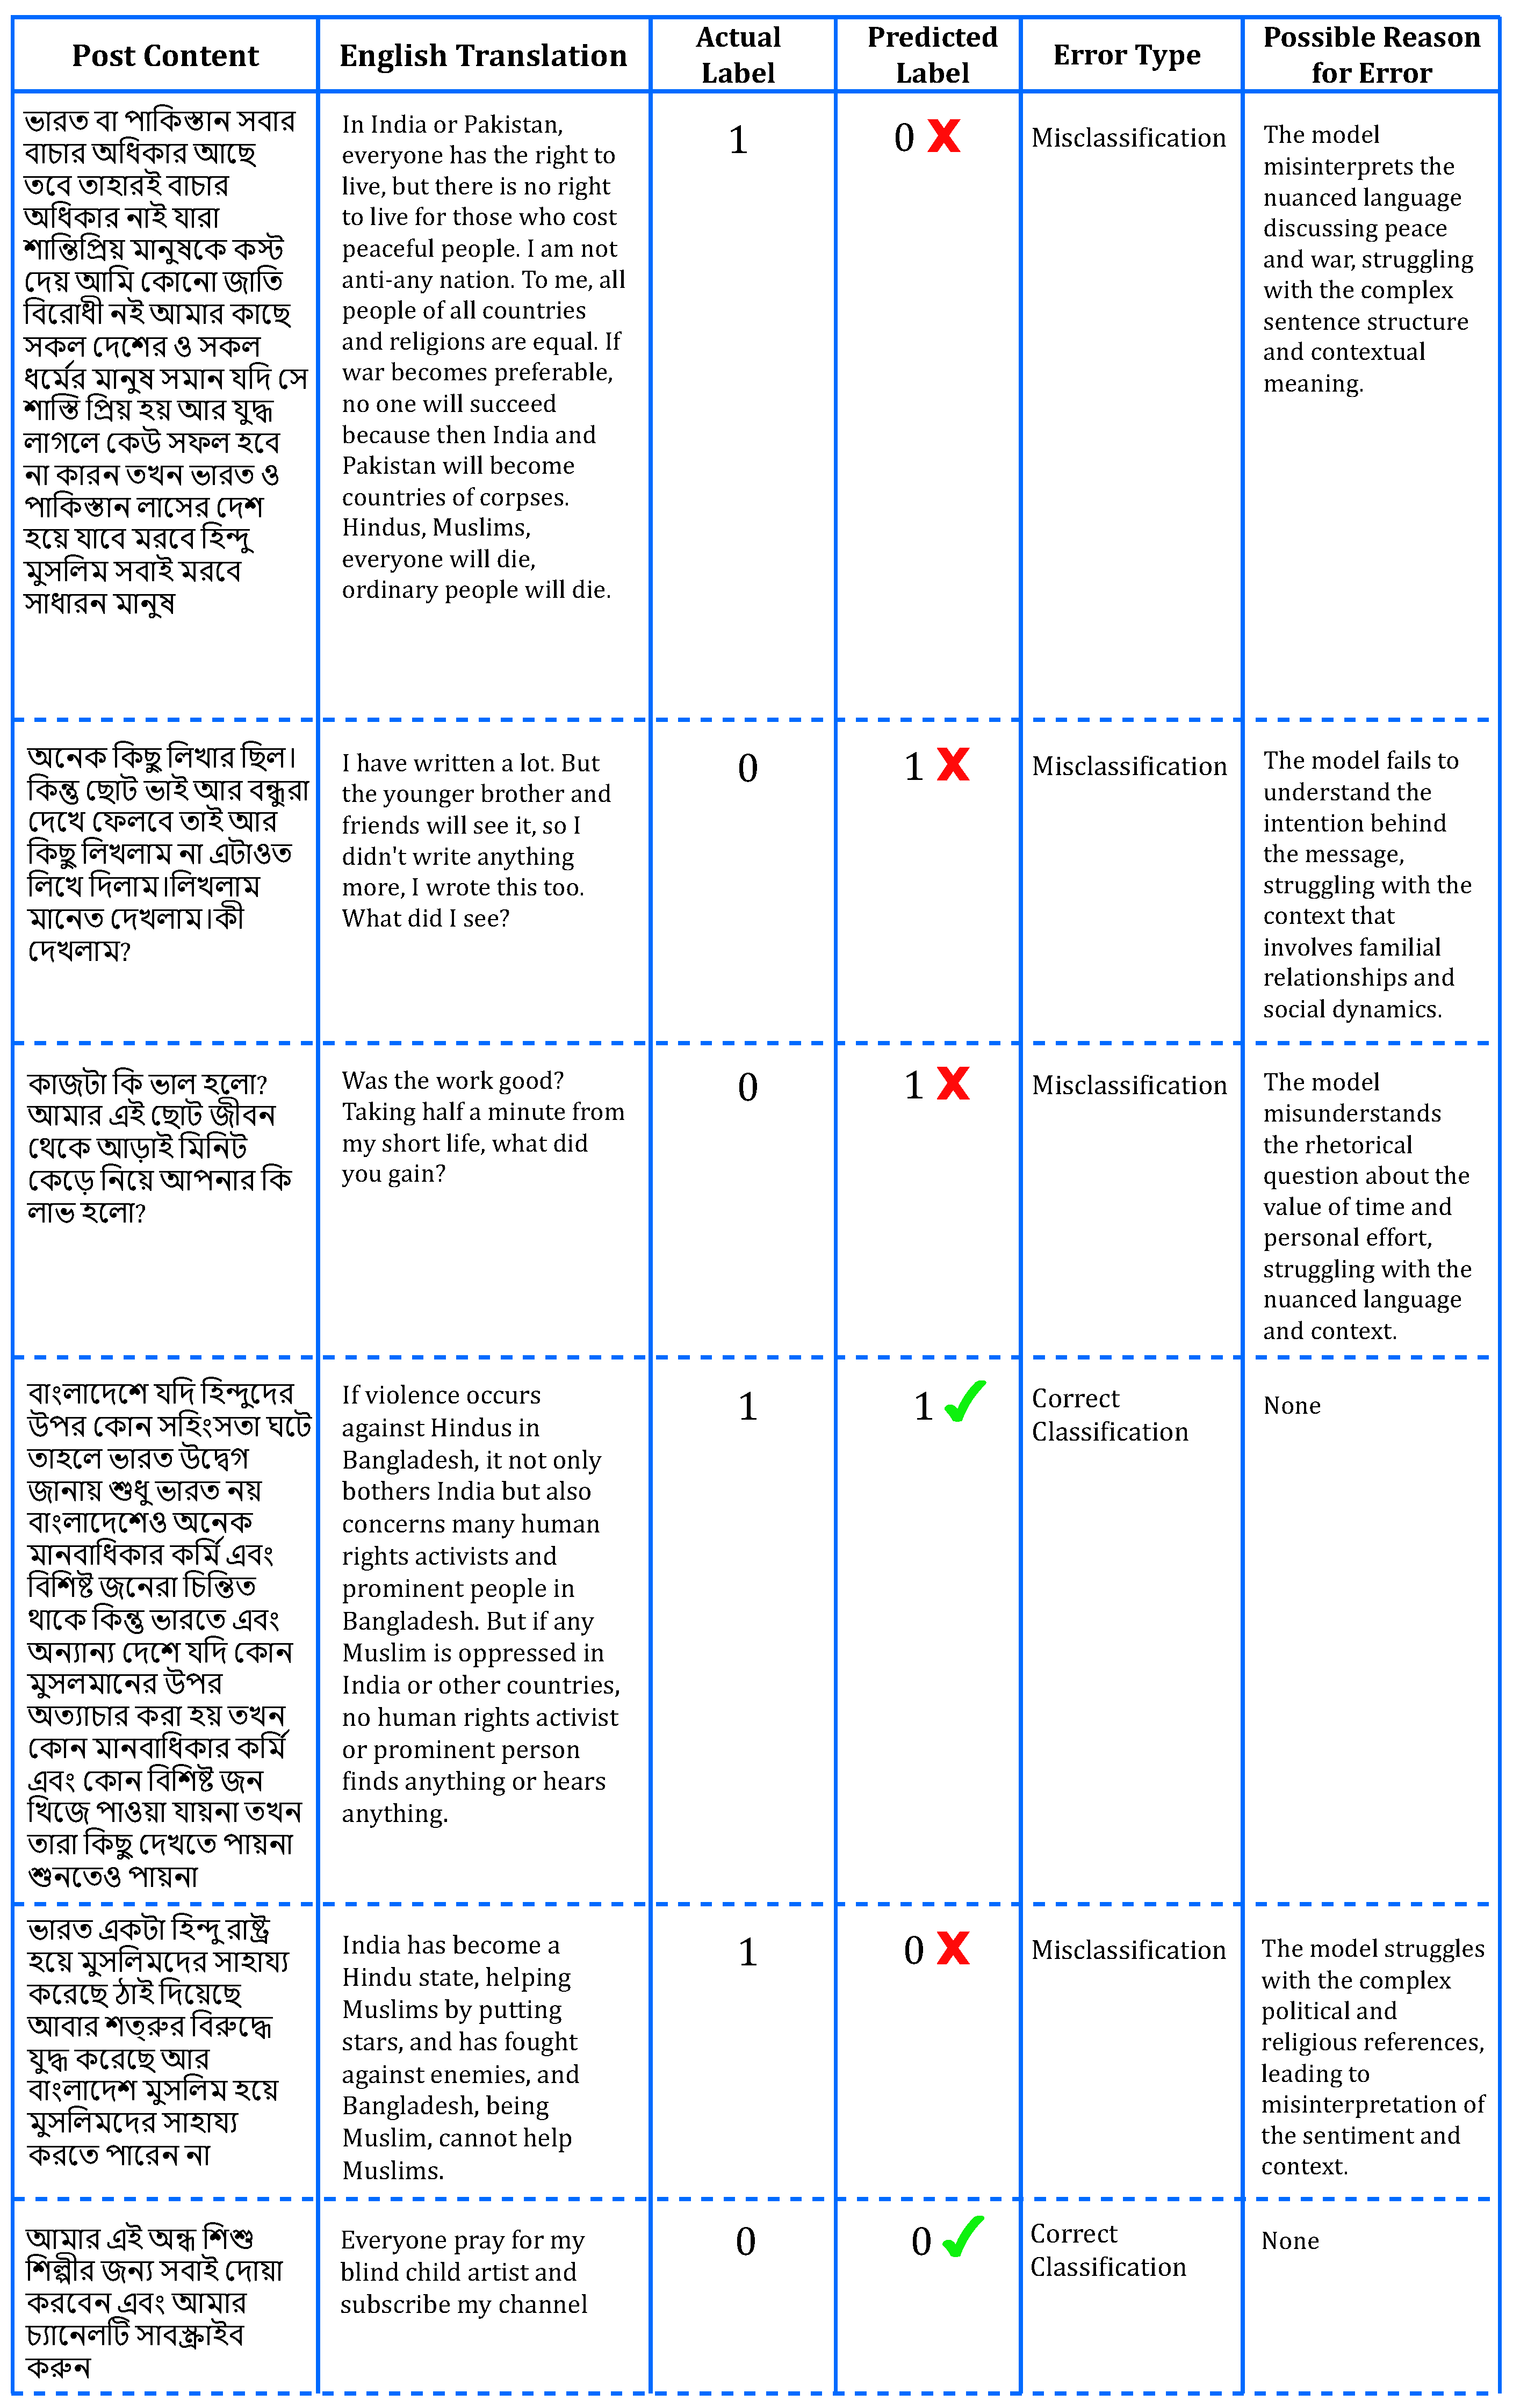
Figure 10 illustrates an error analysis of Bangla language social media posts evaluated by PLMs, emphasizing the critical role of error analysis in evaluating model performance. Firstly, it sheds light on the model’s proficiency in interpreting nuanced language, evident in its misclassification of sentiments related to war, equality, and peace in the first post. This highlights the necessity for the model to better comprehend complex socio-political discussions for accurate sentiment analysis and contextual understanding in sensitive topics. Secondly, error analysis identifies specific challenges faced by the model, such as its difficulty in distinguishing neutral or rhetorical statements from positive sentiments as observed in the misclassifications of the second and third posts. Understanding these challenges is pivotal for refining model training strategies to enhance its performance in real-world applications where precise sentiment classification is crucial. Moreover, correct classifications, exemplified by the fourth and sixth posts, validate the model’s capability to accurately interpret sentiments concerning human rights issues and neutral content, respectively. These instances underscore areas where the model excels and provides reliable predictions, bolstering confidence in its performance. Conversely, the misclassification of the fifth post, which discusses intricate political and religious themes, exposes significant hurdles in the model’s comprehension of such culturally specific references. This insight underscores the need for targeted improvements to broaden the model’s understanding of diverse content, thereby enhancing its overall reliability in Bangla language processing tasks. Ultimately, conducting thorough error analysis yields actionable insights for enhancing PLMs’ proficiency in sentiment analysis and contextual understanding of Bangla social media discourse. By addressing the identified challenges and leveraging strengths, these efforts aim to bolster the models’ accuracy and effectiveness in handling complex linguistic nuances and socio-cultural contexts.


