Abstract
Accurate and timely passenger flow prediction is important for the successful deployment of rail transit intelligent operation. The Sparrow Search Algorithm (SSA) has been applied to the parameter optimization of a Long-Short-Term Memory (LSTM) model. To solve the inherent weaknesses of SSA, this paper proposes an improved SSA-LSTM model with optimization strategies including Tent Map and Levy Flight to practice the short-term prediction of boarding passenger flow at rail transit stations. Aimed at the passenger flow at four rail transit stations in Nanjing, China, it is found that the day of a week and rainfall are the influencing factors with the highest correlation. On this basis, we apply the proposed SSA-LSTM and four baseline models to realize the short-term prediction, and carry out the prediction experiments with different time granularities. According to the experimental results, the proposed SSA-LSTM model has a more effective performance than the Support Vector Regression (SVR) method, the eXtreme Gradient Boosting (XGBoost) model, the traditional LSTM model, and the improved LSTM model with the Whale Optimization Algorithm (WOA-LSTM) in the passenger flow prediction. In addition, for most stations, the prediction accuracy of the proposed SSA-LSTM model is greater at a larger time granularity, but there are still exceptions.
Keywords:
passenger flow prediction; long-short-term memory; improved sparrow search algorithm; machining learning MSC:
68T07
1. Related Works
In the rail transit system, stations attract passengers with different travel purposes under their unique geographical locations, and some of them are relatively stable with certain regularity. By processing and studying a large number of passenger flow travel data, it is helpful to discover and predict the temporal and spatial patterns of station-level passenger flow so that the operation department can make response measures. Especially for short-term prediction, accurate prediction results can help operators to formulate and adjust the passenger transport organization and management strategy in a timely manner and then improve the quality of operation and service. The public can also choose appropriate travel routes and public transportation modes according to the prediction results to save the price cost and time cost of travel.
The passenger flow at rail transit stations is affected by many factors. According to common sense, changes in the day of the week and the time of the day will lead to significant differences in the passenger flow at the same station. Weather is also a possible influencing factor. Liu et al. (2020) [1] found that weather variables including one-hour temperature and wind speed effected hourly metro passenger flow at Taipei Main Station significantly. Zhang et al. (2021a) [2] took weather and air quality indicators into account and quantified their influences on short-term passenger flow prediction in Beijing’s subway network. There are also some papers on passenger flow fluctuations. For example, Zhang et al. (2021b) [3] took event and weather factors into account and proposed fuzzy rule-based predictive models for passenger flow on London underground trains. In addition, researchers also found that it was necessary to conduct sensitivity analysis on the time granularity for passenger flow forecasting to better evaluate the applicability of a model. The research results of Ma et al. (2020) [4] showed that the average relative errors of the station-level passenger flow forecasting model were 4.12%, 3.54%, and 4.97% for time granularities of 30 min, 60 min, and 1 day, respectively. Yang et al. (2022) [5] concluded that 30 min and 50 min were preferable for origin–destination demand prediction on workdays and weekends, respectively, in the Beijing URT system. Zhang et al. (2021a) [2], Tu et al. (2022) [6], and Su et al. (2022) [7] believed that the prediction accuracy of models improved with the increase in time granularity. In this paper, workdays or not, weather conditions and time granularity are included in the model variables or sensitivity analyses.
Some traditional forecasting methods, such as the autoregressive integrated moving average model (ARIMA), have often been applied to short-term passenger flow forecasting (Li et al., 2021) [8]. With the advancement of computer technology, a large amount of data can be mined, and due to their excellent performance, an increasing number of machine learning algorithms are being applied to short-term forecasting. Sina and Kaur (2020) [9] proposed a short-term load forecasting method based on Support Vector Regression (SVR) and the Social Spider Optimization technique (SSO). Wang et al. (2022) [10] developed a semi-supervised co-training (S-MLR-XGBoost) model to predict passenger flow changes in the expanding subway. However, Neural Networks (NNs) and their combined models seem to be more widely used in this field (Peng and Xiang, 2020) [11]. Fu et al. (2022) [12] established an NN model for short-term prediction of metro passenger flow using multiple data sources, such as spatial and temporal characteristics inside and outside the metro system. Many studies have shown that the Recurrent Neural Network (RNN) is more efficient than other models in forecasting time series. Madan et al. (2018) [13] decomposed and extracted time series data and used ARIMA and RNN, respectively, to predict passenger flow, which also fully demonstrated the advantages of RNN in time series prediction. Hewamalage et al. (2021) [14] compared RNN with Exponential Smoothing and ARIMA and considered it a competitive forecasting method. Zhang and Guo (2022) [15] proposed a GA-LSTM model, demonstrating the capability of the Graph Attention mechanism in modeling spatial diffusion processes of traffic flow.
However, in the process of long sequence training, RNN is no longer appropriate due to the gradient disappearance and explosion problems. In response to this problem, Long-Short-Term Memory (LSTM) (Hochreiter and Schmidhuber, 1997) [16] was gradually employed in short-term passenger flow prediction. Moreover, based on LSTM, some combination models were put forward to improve the prediction accuracy. Jing et al. (2021) [17] applied the Light Gradient Boosted Decision Tree and Dynamic Regression Selection to establish an LGB-LSTM-DRS model, which reduced the passenger flow prediction error. Yang et al. (2021a) [18] proposed a novel Wavelet-LSTM model and proved the superiority of the hybrid model in terms of prediction accuracy through actual passenger flow data. To predict passenger demand under hybrid ride-sharing service modes, Li et al. (2020) [19] proposed a hybrid Wavelet Transform-Fast Correlation based Filter-LSTM model. Wan et al. (2020) [20] constructed a kind of LSTM model for correlated time series prediction (CTS-LSTM) to forecast the civil aviation passenger demand. By comparing with the basic LSTM model, it was found that RMSE, MAE, and MAPE of the CTS-LSTM combined model decreased by at least 9.0%, 16.5%, and 21.3%, respectively. To solve the problem that spatial factors cannot be considered in the LSTM model, a convolutional neural network (CNN) and other methods were used to extract the features among stations, combined with LSTM to forecast passenger flow of the whole rail transit system or outbound passenger flow (Zhang et al., 2021a [2]; Yang et al., 2021b [21]). Zhang et al. (2020) [22] proposed the Conv-GCN model, combining GCN and 3D CNN for short-term passenger flow prediction in urban rail transit. The model employs multi-graph GCN to capture spatiotemporal correlations and 3D CNN to extract advanced features between different patterns and stations, enabling predictions at 10, 15, and 30 min intervals. Tang et al. (2021) [23] introduced a multi-community spatiotemporal graph convolutional network (MC_STGCN) framework. This model utilizes GCN to encode spatial correlations between regions into geographically adjacent and functionally similar graphs. The prediction module, based on the Louvain algorithm, is employed to achieve multi-region passenger demand forecasting. Xu (2024) [24] combined CNN-LSTM and SVM with the wavelet transformation method for short-term subway tourist flow prediction. Jing et al. (2024) [25] adopted an improved LSTM method and integrated multiple data dimensions to predict short-term passenger flow. Considering external factors and periodicity, Shi et al. (2024) [26] combined data from multiple sources and dimensions and fed them into a deep neural network to capture the complex correlation of multi-dimensional data, and proposed a novel spatial–temporal deep learning framework for subway passenger flow prediction.
The selection of different parameter values of the LSTM model dramatically influences the prediction results. Generally, the trial-and-error or empirical method used to determine the parameter values has some degree of randomness. Due to the operability and scalability of the swarm intelligence optimization algorithm, researchers try to introduce the algorithm to optimize the parameters of the LSTM model. Xue and Shen (2020) [27] put forward the Sparrow Search Optimization algorithm (SSA), a new swarm intelligence optimization algorithm with excellent performance in accuracy, convergence speed, and robustness. This algorithm performs well in the optimization of various model parameters. For example, Li et al. (2022a) [28] applied SSA for hyperparameter selection of the support vector machine model (SVM) for mid-to-long-term photoelectric power load prediction. Guo et al. (2021) [29] applied SSA to optimize the backpropagation neural network to predict the evaluation score of a sports smart bracelet. The LSTM based on SSA optimization (SSA-LSTM) has been used in many fields. Tian and Chen (2021) [30] proposed SSA-optimized reinforced LSTM to predict ultra-short-term wind speed in meteorology. Song et al. (2021) [31] established SSA-LSTM for water quality prediction. Li et al. (2022b) [32] built a convolutional LSTM (CLSTM) for photovoltaic power combination prediction and designed an improved SSA to optimize the model parameters during retraining. For predicting short-term and long-term dissolved oxygen (DO) in ponds accurately, Wu et al. (2021) [33] selected vital factors that were highly correlated with DO by extreme gradient boosting (XGBoost) and proposed a hybrid DO prediction model based on the LSTM optimized by SSA. Compared with basic models, the SSA-LSTM method has superiority at both the theoretical and practical levels. Furthermore, methods such as Particle Swarm Optimization (PSO) and Whale Optimization Algorithm (WOA) have also been applied in parameter optimization of LSTM for interval of wind power prediction (Yuan et al., 2019) [34], pollutant prediction (Luo and Gong, 2023) [35], and monthly evapotranspiration estimation (Fu and Li, 2022) [36]. Li et al. (2024) applied SSA optimized VMD-LSTM for predicting the total volatile basic nitrogen (TVB-N) [37]. However, to the best of our knowledge, the application of this method in passenger flow prediction is still rare, and whether it is suitable for predicting short-term passenger flow at rail transit stations needs to be explored. At the same time, it reduces the algorithm efficiency and optimal local solution along with the parameter optimization process.
Comparing previous studies, the contributions of this paper are as follows: considering the day of the week, weather, and other factors, it proposes an improved SSA-LSTM model with optimization strategies to achieve the short-term prediction of boarding passenger flow at rail transit stations. Specifically, the SSA is used to optimize the number of neurons in the LSTM, and the Tent Map and Levy Flight are introduced into the SSA optimization process. The tent map strategy increases the diversity and uniformity of population initialization. Furthermore, using the Levy flight strategy can effectively improve the searchability of the algorithm and its ability to jump out of the local optimum. Aimed at the passenger flow data at rail transit stations in Nanjing, this paper finds the influencing factors with the highest correlation, applies the proposed SSA-LSTM to realize the short-term prediction with higher credibility, and analyzes the prediction results of the model with different time granularities.
2. Models and Components of the Proposed System
2.1. Brief Description of the LSTM Model
The Long-Short-Term Memory Neural Network (LSTM) is a modified Recurrent Neural Network (RNN) with an architecture consisting of storage units as the basic units. In contrast to RNNs, LSTMs incorporate forget gates, input gates, and output gates. Including the gate structure allows the LSTM to retain information selectively, thus enabling it to store and read long-term contextual information. The gradient disappearance problem could be solved in such a model structure. As a result, the LSTM is widely used in time series modeling problems.
The working process of LSTM starts by reading the states of the latest hidden layer , the latest cell state , and the current input , and finally updates the states of and through the following steps. The architecture of an LSTM cell is shown as in Figure 1.
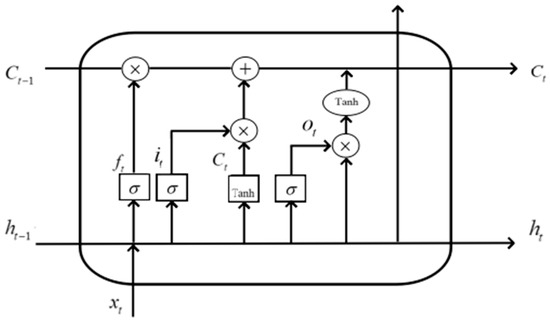
Figure 1.
Architecture of an LSTM cell.
Forget Gate : It identifies which information should be discarded from the cell state at the previous time . The output value of the forget gate lies between 0 and 1, with values closer to 0 meaning a higher probability of being forgotten. The forget gate calculation formula is
Input Gate : It determines the new information that should be saved to the current cell state. Firstly, the sigmoid layer decides the probability that the input can be saved. This process can be expressed as
The Tanh function generates new instant cell states , as shown in (3).
Then, the current cell state can be computed by throwing out irrelevant information and adding new information. The calculation formula is
Output Gate : It controls the effect of long-term memory on the current output. Then Tanh is used to process the Cell state. The calculation is shown in (5) and (6).
where is the weight matrix of the corresponding gate; is the bias term of the corresponding gate; is the activation function; and Tanh is the hyperbolic tangent activation function.
2.2. Sparrow Search Optimization Algorithm
The Sparrow Search Optimization Algorithm (SSA) is a novel swarm intelligence optimization algorithm based on the foraging and anti-predatory behavior of sparrows. Based on the related behavior patterns of sparrows, the sparrow population is mainly divided into producers and scroungers. Moreover, all sparrows have to guard against predators.
The virtual sparrow is set to find food. The positions of the sparrows can be represented by a matrix:
where n denotes the number of sparrow populations and d is the dimensionality of the variable to be optimized.
The fitness values of all sparrows in operation can be expressed as:
The values in each row indicate the fitness value of each sparrow in each dimension. A producer with a higher fitness value has the priority of finding food. In addition to this, producers have a broader area to find food than scroungers.
In each iteration, the positions of the producers can be updated as:
where t denotes the number of iterations, j = 1, 2,…, d; indicates the position of the i-th sparrow in the j-th dimension at the t-th iteration; is the maximum iterations; and Q are both random numbers; R2 and ST denote the warning value and the safety threshold, respectively; and L denotes a one × d matrix where each element is 1. means that there are no predators around the sparrows and the producers can move into a wide area to search for food; means that some sparrows have detected the predators, and all sparrows move to the safe areas.
For each scrounger, if a producer finds an abundance of food, it immediately leaves the current position to compete for the food. If the scrounger wins, it immediately receives the food from the producers. Otherwise, it continues to monitor the producer. The position of the scrounger will be updated as shown in (10).
where denotes the best position occupied by the producer; denotes the position with the worst fitness in the search range at iteration t; and A denotes a one × d matrix where each element is randomly assigned to 1 or −1. The condition indicates that the i-th scrounger with the worst fitness value is most likely to fly to other places.
In the simulation experiment, a danger awareness mechanism is implemented. It is assumed that the sparrows which have discovered the predators (called whistlers) account for a certain proportion range of the total. The update rule of the whistlers’ positions is expressed as:
where represents the control parameter of step size; represents the fitness value of the current sparrow; and represent the current global best and worst fitness values, respectively; denotes the current global optimum position; is a random number with the range −1 to 1, indicating the moving direction of the sparrow; and is a small constant to prevent the denominator from being zero.
2.3. Tent Chaos Mapping
During the initialization of the sparrow population, an uneven distribution of the population occurs. To address the problem, the sparrow population is initialized using chaotic mapping.
Among the chaotic mapping approaches, the resulting chaotic sequence of tent mapping has a homogeneous and ergodic nature. Therefore, tent mapping is chosen to initialize the sparrow population of the SSA.
The tent mapping expression formula is as follows.
The initialization of the parameters using the tent chaos mapping proceeds as:
Step 1. Use the Random function to generate an initial value within (0, 1).
Step 2. Produce a chaotic sequence with the Formula (12).
Step 3. When the number of iterations reaches the setting value, the iteration stops automatically and the chaotic sequence is saved as .
Finally, is imported into the solution space of the initial sparrow population through (13).
where and are the extreme values of .
2.4. Levy Flight Strategy
To enable sparrows to have a wider distribution of individuals in the search range when scroungers update their positions, a Levy flight strategy is used for the global search, thus improving the overall search performance of the model.
Levy flight is a kind of non-Gaussian random walk process, and its step size follows a heavy-tailed distribution, which gives Levy flights good global search performance.
The position of the Levy flight is updated according to the following formula:
where and are the i-th solution in the t-th generation and the present optimal solution, respectively; s denotes the step size; and is the variable that controls the step size of flight.
As the Levy distribution is too complex, simulations are usually carried out using the Mantegna algorithm with the following step size formula:
where and
where is usually taken as 1.5, and is the Gamma function.
2.5. Improved SSA-LSTM with Optimization Strategies
In the construction of a LSTM prediction model, the blindness in setting each parameter leads to the randomness of prediction accuracy, and the model performance cannot be fully exploited. Tian and Chen (2021) [30], Li et al. (2022b) [32], Yuan et al. (2019) [34], and Luo and Gong (2023) [35] all utilized swarm intelligence optimization algorithms to optimize the LSTM neural network, resulting in improvements in the accuracy of the model. Furthermore, Xue and Shen (2020) [27] verified that the SSA had better performances in search accuracy, convergence speed, and robustness than particle swarm optimization and the grey wolf optimizer. Therefore, in this paper, the SSA with optimization strategies is used in the LSTM model to find the optimal number of neurons in the model.
However, it will increase the model computation and make the model fall into the local optimal. Introducing tent chaos mapping into the SSA could increase the diversity and uniformity of the initial population, and the application of the Levy flight strategy could effectively improve the search capability of the algorithm as well as the ability to jump out of the local optimum (Ma et al., 2021) [38]. Therefore, in this paper, tent chaotic mapping and the Levy flight strategy are incorporated into the SSA algorithm to enhance the computational capability of the model and its ability to find the optimal solution.
Here are the extraordinary steps.
Step 0. Set up parameter values, including the maximum number of neurons, the maximum number of iterations M, the dimension d, and the number of sparrow populations P.
Step 1. Initialize the population using the tent chaos mapping to generate P d-dimensional vectors and carry each vector component to a value range of the variables of the original problem.
Step 2. Calculate the fitness value for each sparrow , i.e., the prediction accuracy of the LSTM model. Rank the sparrows according to their fitness and then select the optimal fitness and its position (value of each parameter).
Step 3. Select PD sparrows with the highest fitness levels to act as producers and the rest as scroungers, and then update the sparrow positions according to the Levy flight strategy.
Step 4. Randomly select ST sparrows to act as whistlers for early warning detection and update their locations.
Step 5. At the end of each iteration, the fitness value for each sparrow and the average fitness value for the sparrow population are recalculated.
Step 6. Update the best position and fitness according to the current state of the sparrow population.
Step 7. Judge whether the maximum iterations M has been reached; if yes, return to the best position and save its corresponding fitness; otherwise, skip back to step 3 and continue the execution.
The framework of the proposed SSA-LSTM model with optimization strategies is as shown in Figure 2.
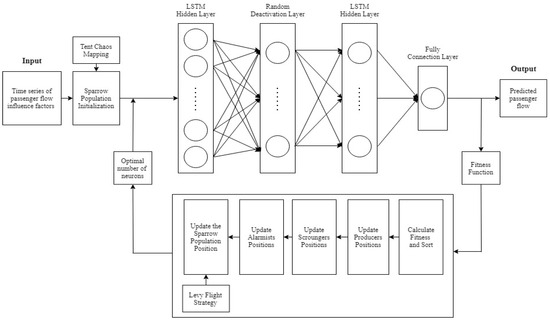
Figure 2.
Framework of the proposed SSA-LSTM model.
To verify the efficiency of the SSA with the tent chaos mapping and the Levy flight strategy, it is used to optimize the single-peak function, which is shown in (17), and the search results are shown in Figure 3. The Tent-Levy-SSA is found to be faster and more effective.
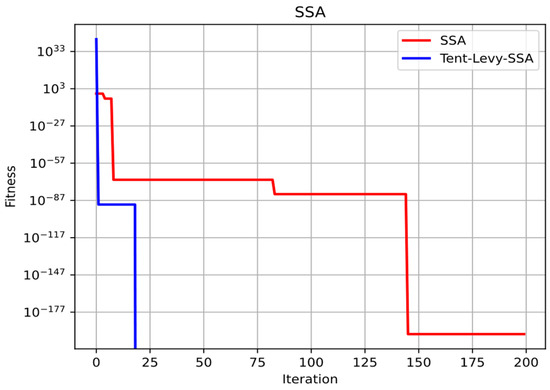
Figure 3.
Example of the optimization procedure for Tent-Levy-SSA.
Different learning rates can affect LSTM model training. A learning rate too large may lead to significant loss fluctuations during iterations, while a learning rate too small may result in slow convergence of the model. Therefore, it is necessary to gradually decrease the learning rate during the training process to improve the training effectiveness (Yu et al., 2020) [39]. Moreover, if the number of iterations is defined, on the one hand, the model may have reached the optimal value after a certain number of iterations, but the computation does not stop, which leads to over-fitting of the model and may increase the calculation time cost. On the other hand, if the model has not yet reached the optimum when the algorithm jumps out of the iteration, underfitting will occur. To address this issue, the Keras-based ReduceLROnPlateau callback function and the EarlyStopping function are added to the model, both of which can be used in conjunction with each other to reduce the number of parameters to be optimized by SSA and increase the efficiency of the model training.
3. Case Study
Nanjing is located in the Yangtze River Delta, with a bustling commercial and financial center, Xinjiekou district. Nanjing is one of the four ancient capitals of China, with a large number of tourist resources, such as the Confucius Temple, Purple Mountain, Xuanwu Lake, etc. The city has a humid subtropical climate with plenty of rain.
On 3 September 2005, the first subway line in Nanjing went into operation, making Nanjing the 6th city in China to operate an urban rail transit line. As of November 2017, Nanjing’s rail transit system consisted of 7 lines and 139 stations, with daily passenger flow exceeding 2.8 million, which is shown in Figure 4. In the heat map on the right, the more red the color, the more daily ridership.
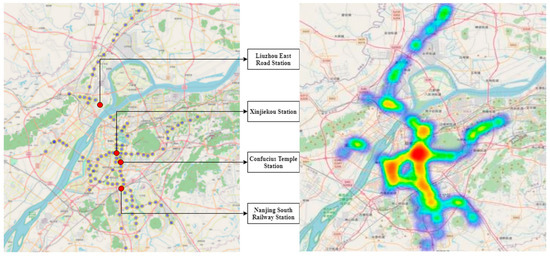
Figure 4.
Nanjing rail system and passenger flow thermodynamic diagram (In 2017).
3.1. Data Description
3.1.1. Passenger Flow Data of Nanjing Rail Transit System
Auto Fare Collection (AFC) data from the Nanjing rail system for a total of 75 days in 2017 are applied in this paper. The original dataset contains a total of 210,263,896 records. This article uses 18,912,461 pieces of information with a sampling rate of 8.99%. Information on each record consists of arrival and departure timestamps (precisely on the second), transaction devices, origin and destination stations, and ticket ID and type. Origin Station ID and Destination Station ID are values ranging from 1 to 139; arrival time is the time when the passenger enters a rail transit station; transaction time is the time when the transaction is completed through the AFC system, i.e., the time of departure; ticket ID is the ticket or card number. Each trip generates one piece of data.
The passenger flow data of each station are extracted according to the origin station, and then the data are counted according to different time granularities through data resampling and finally combined in chronological order. The period for the statistics in this paper is from 5:30 to 24:00 daily.
This paper identifies four types of stations, including commercial/office-dominated, residential-dominated, scenic-dominated, and transport hub-dominated, according to the maximum proportion of land use attributes within the 500 m range. Xinjiekou Station, Liuzhou East Road Station, Confucius Temple Station, and Nanjing South Railway Station, which have the highest passenger flow among each type, are taken as the research objects to carry out predictions. Xinjiekou Station is one of the largest metro stations in Asia, serving as a hub for business districts spanning multiple provinces. The vicinity of Liuzhou East Road Station is surrounded by large residential areas with over 100,000 residents. Confucius Temple Station is located near a range of scenic spots, including the Jiangnan Tribute Academy built in the Song Dynasty. Nanjing South Railway Station is a typical transportation hub connecting to external destinations. The locations of these four stations in the Nanjing rail transit network are shown in the left image of Figure 4, while the right image displays a passenger flow thermodynamic map. The color intensity represents the magnitude of passenger flow, with warmer colors closer to red indicating higher passenger volumes and cooler colors closer to blue indicating lower passenger volumes. From the map, it can be observed that Xinjiekou station is the heat center of the whole city, while the other three stations are local heat centers. The statistics values of the boarding passenger flow at the four stations on the study days are presented in Table 1.

Table 1.
Data statistics on the study days.
3.1.2. Day of a Week
Weekdays and weekends have been the primary factors affecting rail passenger flow. The data are divided into weekdays and weekends, with 1 indicating weekdays and 0 indicating weekends and holidays. The daily passenger flow for each research station in October 2017 is shown in Figure 5 and separated by a dotted line, and it can be found that the boarding passenger flow at each station showed cyclical changes in the three weeks after the National Day holiday. On weekends, the passenger flow at Xinjiekou Station, Confucius Temple Station, and Nanjing South Railway Station increased compared with that on weekdays. In contrast, passenger flow at Liuzhou East Road Station decreased. On Fridays, all four stations increased in boarding passenger flow.
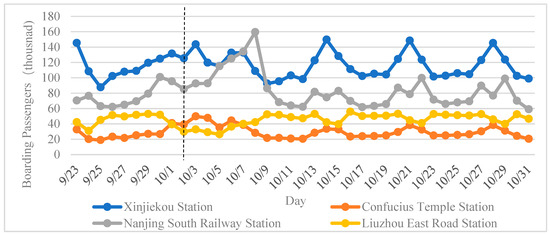
Figure 5.
Daily boarding passenger flow at the stations in October 2017.
3.1.3. Weather Data
From the perspective of transport authorities, weather conditions are considered an exogenous factor that indirectly affects transport demand. Numerous studies have also verified that weather conditions are the most critical influences on the travels of rail transit passengers. Historical weather information for Nanjing can be obtained from the weather website (https://www.tianqi.com/ (accessed on 15 May 2022)). The available parameters of weather conditions contain maximum temperature, minimum temperature, rainfall, and wind speed for a given day. Of the 75 days studied, there were 12 sunny days, 30 cloudy days, and 33 rainy days.
We compared the boarding passenger flow on 11 October (rainy), 18 October (cloudy), and 25 October (sunny), all of which were Wednesdays, as depicted in Figure 6a–d. It was found that there was almost no noticeable change in the passenger flow at Xinjiekou and Liuzhou East Road Stations under different weather conditions. The passenger flow at these two stations on weekdays is mainly for commuting purposes, and the travel decisions are less likely to change with the weather conditions. Nevertheless, the passenger traffic at Confucius Temple Station, situated close to the scenic attraction of Confucius Temple, experienced a certain level of impact, with a decrease in passenger flow observed during rainy days.
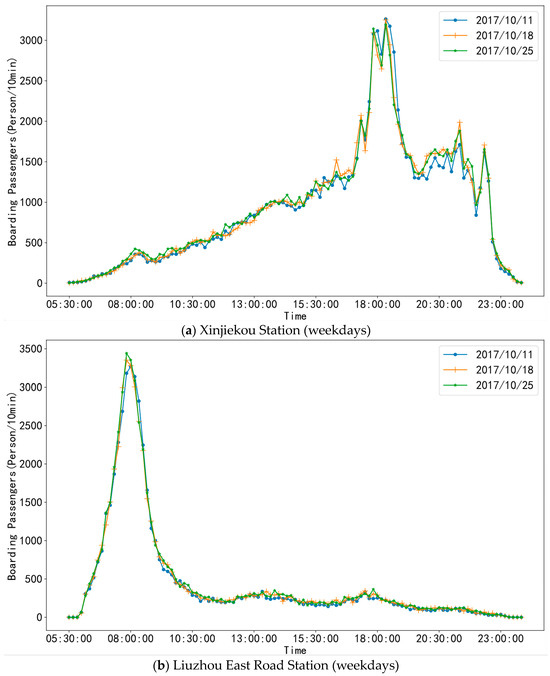
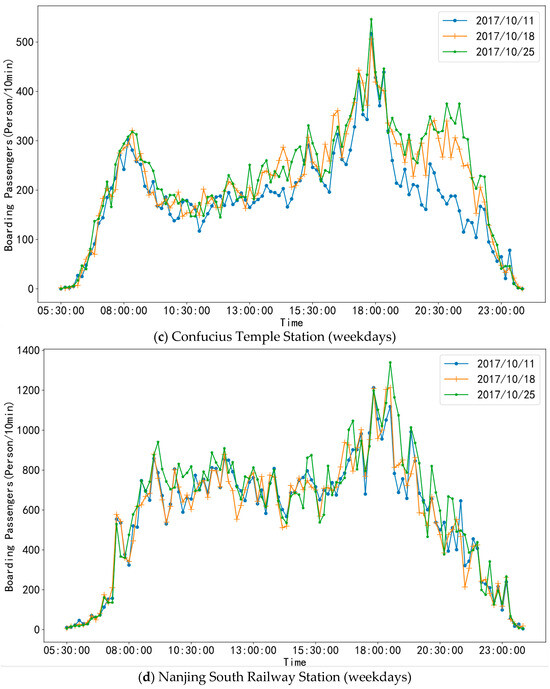
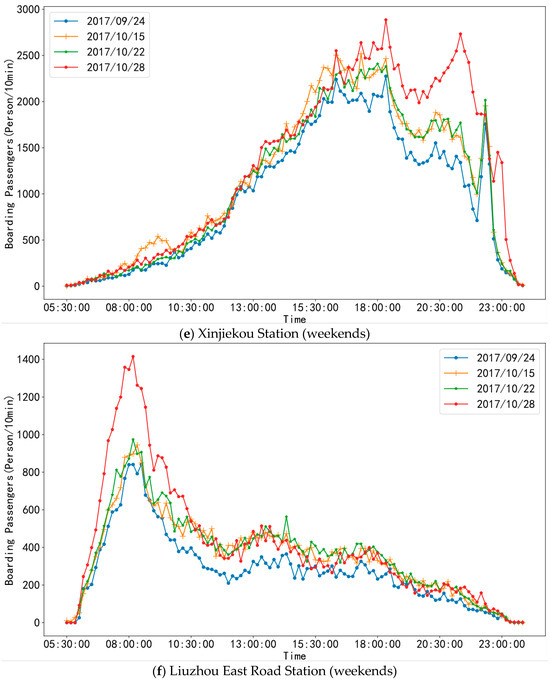
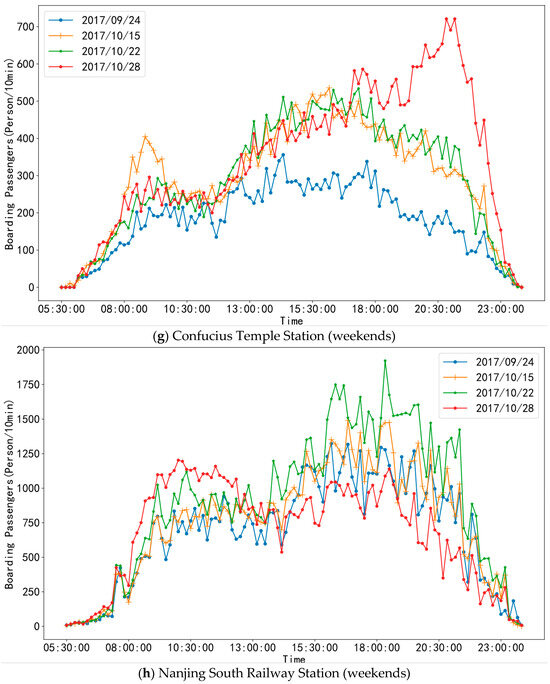
Figure 6.
Temporal patterns of boarding passenger flow on different days at the stations.
At the same time, the boarding passenger flow on weekends on 24 September (heavy rain), 15 October (light rain), 22 October (cloudy), and 28 October (sunny) was selected for comparison. As illustrated in Figure 6e–h, there were more passengers on sunny days than on rainy days, especially on heavily rainy days.
To further explore the influence of the variables, including the day of the week, rainfall, highest air temperature, and lowest air temperature on Nanjing rail transit passenger flow, correlation analysis was performed using Spearman’s coefficient. It can be seen from Table 2 that day of the week has the largest and most significant influence on passenger flow, rainfall has a significant impact at some stations, and the temperature has little effect. Specifically, due to its proximity to a large residential area, Liuzhou East Road Station exhibits increased passenger flow on weekdays with a positive correlation coefficient. Conversely, other stations show a negative correlation, indicating higher passenger flow on weekends and holidays. Therefore, in this paper, the day of the week and rainfall are considered factors affecting passenger flow when constructing the model.

Table 2.
Correlation analysis between variables and boarding passenger flow.
3.2. Data Preprocessing
To obtain accurate passenger flow data, this paper discriminates and deletes abnormal data records, including four situations: data with missing items; data with the same origin and destination stations; data with the transaction time earlier than or the same as the arrival time; and data with timestamps between 00:40 and 5:30 (non-service time).
3.3. Model Parameter Configuration
The proposed SSA-LSTM model in this paper consists of two implicit layers. Tent-Levy-SSA decides the number of neurons. To prevent overfitting of the model, a random Dropout layer is added to the model. The Dropout value is set to 0.5, the number of times the model is trained is set to 200, and the mean square error (MSE) in the Formula (18) is chosen as the model training loss function.
The model performance is evaluated by the root mean square error (RMSE), determination coefficient (R2), and mean absolute percentage error (MAPE), which can be calculated as (19), (20), and (21), respectively.
where is the predicted value of the boarding passenger flow at the station, is the actual value of the boarding passenger flow at the station, is the average value of the actual values, and n is the number of samples.
3.3.1. Partition of Data Set
The 75 days of boarding passenger flow data on Nanjing rail transit system in 2017 were selected as the research objects, with the first 71 days of data as the training set and the last 4 days as the test set, which includes two weekdays and a weekend.
3.3.2. Optimizer
With other parameters consistent, the four optimizers, Adam, SGD, Adagrad and RMSProp, are substituted into the model, respectively, and the results are shown in Table 3. By comparing RMSE, R2, and MAPE, the optimizer of the model is determined to be the RMSProp.

Table 3.
Comparison of models with different optimizers.
3.3.3. Activation Function
With other parameters being consistent, the short-time prediction model for boarding passenger flow was tested using the Tanh, Sigmoid, and Relu activation functions. The prediction results were evaluated using RMSE, R2, and MAPE. As shown in Table 4, Relu was determined to be the activation function of the model.

Table 4.
Comparison of models with different activation functions.
3.3.4. Batch
The batch sizes were assigned as 16, 32, and 64 and substituted into the model, respectively, and the prediction results were evaluated as shown in Table 5. The evaluation indexes were optimal when the batch size was equal to 32. Therefore, the batch size of the model was set to 32.

Table 5.
Comparison of models with different batch sizes.
3.3.5. Parameters of SSA
The LSTM model is often limited to the randomness of determining the number of neurons, which significantly reduces the prediction effect. In this paper, the number of neurons in the two hidden layers of the LSTM model was optimized using the SSA. After multiple trials, the parameter configuration for SSA was determined as shown in Table 6.

Table 6.
Parameter configuration of SSA.
4. Results and Discussion
To verify the superiority of the proposed SSA-LSTM model, a comparison was conducted between the performance of the proposed model and that of the Support Vector Regression (SVR) method, the eXtreme Gradient Boosting (XGBoost) model, the traditional LSTM model, as well as the improved LSTM Model with Whale Optimization Algorithm (WOA-LSTM).
4.1. Baseline Models
SVR is a tolerant linear regression method. The main idea is to create an “a band of intervals” on both sides of a linear function. No loss will be counted for all samples that fall into the band. Finally, the model will be optimized by minimizing the total loss and maximizing the width of the interval band.
XGBoost is a boosting tree model composed of many classification and regression tree models. The core idea of this method is to add a new tree in each iteration to fit the residual of the last iteration so that the predicted value will be closer and closer to the actual value.
WOA is a metaheuristic optimization algorithm inspired by the hunting behavior of whale pods in nature. It employs three main strategies, namely encircling prey, bubble-net hunting, and random searching, to explore and search for the optimal solution.
The passenger flow data and corresponding variables for day of a week and weather are identical in the proposed SSA-LSTM and baseline models. The specific configurations of the baseline models are as follows.
SVR: The SVR model is adopted in sci-kit-learn, and the radial basis function (RBF-SVR) is used as the kernel function. The regularization parameter C is set to 1.0, and the allowable error of the stopping criterion is set to 0.001.
XGBoost: Sci-kit-learn is also invoked with 100 iterations, a random sampling parameter of 1, and a learning rate of 0.3.
LSTM: The LSTM model consists of two implicit layers, with the first layer typically having 100 neurons and the second layer having 50 neurons based on empirical experience. The other parameters are set as in the proposed SSA-LSTM model.
WOA-LSTM: The initial whale population size is 20, with a dimension of 4, and the number of iterations is set to 500.
4.2. Prediction Results
The prediction results of different models were compared with the actual values for each station, as depicted in Figure 7. The trend of boarding passenger flow at each station could be effectively predicted by the four models. The prediction performances are displayed in Table 7.
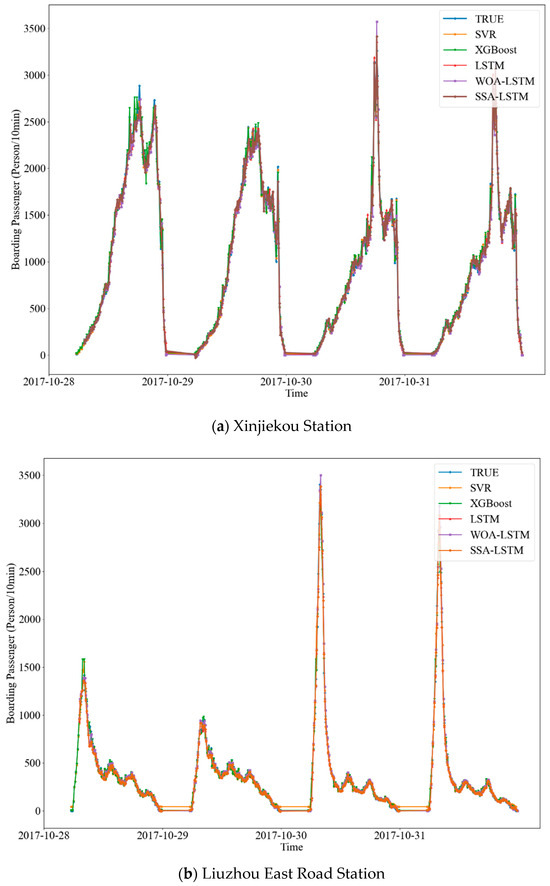
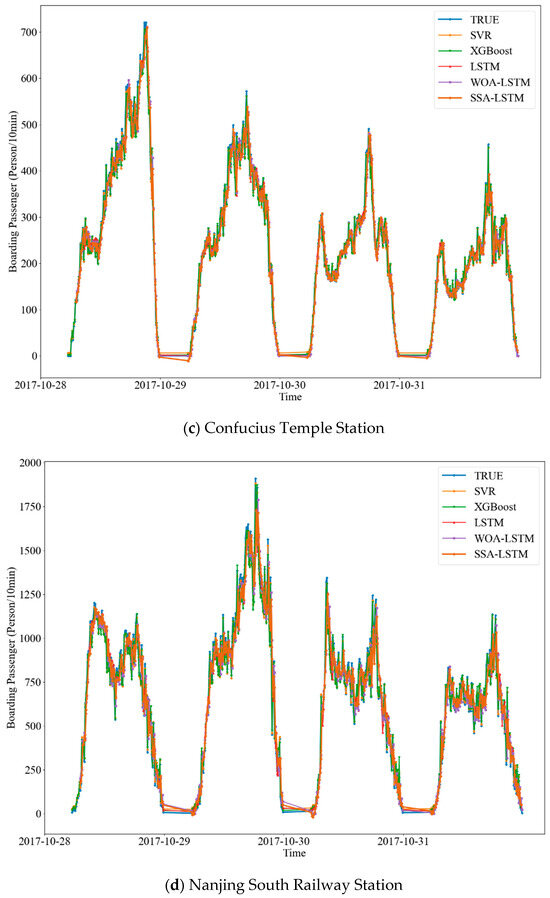
Figure 7.
Prediction results of boarding passenger flow at stations with 10 min time granularity.

Table 7.
Performance metrics of various models with 10 min time granularity.
As can be seen from the table, the prediction performances vary from station to station and from model to model. In a vertical comparison, in terms of either RMSE or R2, the proposed SSA-LSTM model outperforms other models in all cases. The LSTM and WOA-LSTM models show slightly inferior performances, while the SVR and XGBoost models exhibit the poorest prediction accuracy. In addition, SVR results in higher computation cost, so it is only suitable for calculation with small amounts of data. Compared to the performances of the proposed SSA-LSTM with XGBoost, the RMSE decreases obviously, with it decreasing the fastest at 56% for Liuzhou East Road Station and Confucius Temple Station decreasing the slowest at 10%. The R2 increases significantly, with it increasing the fastest at 0.0365 for Confucius Temple Station and the slowest for Nanjing South Railway Station, at 0.01. The R2 values of the four SSA-LSTM models are more significant than 0.9, and the maximum can reach 0.99. By further contrasting, it was found that compared with the traditional LSTM model, the prediction accuracy of WOA-LSTM did not improve significantly, and even decreased for some stations. The R2 of the proposed SSA-LSTM model for each station did not improve significantly, with a maximum of only 0.01 better; however, the RMSE for Xinjiekou Station, with the fastest decline, reached 14%.
In a horizontal comparison among different stations, the prediction performances of the proposed SSA-LSTM model for Xinjiekou Station and Liuzhou East Road Station in R2, more significant than 0.98, were better than those for other stations. It can be understood that, as the city center, the land around Xinjiekou Station is mainly used for office and commercial purposes. At the same time, several large residential communities are distributed around Liuzhou East Road Station. Therefore, the two stations have much stable commuter traffic demand during working days, and the daily passenger flow pattern is similar. These characteristics are favorable for the construction of the prediction models. Meanwhile, the R2 and RMSE for Nanjing South Railway Station were the lowest, and the results for Confucius Temple Station also did not perform well. This is mainly because, in addition to some residents, Confucius Temple Station services tourists of the scenic area, and its passenger flow has randomness. Nanjing South Railway Station, as an intercity transportation hub, also has uncertain passenger flow. Due to the large passenger flow of Nanjing South Railway Station, the models show much greater errors than Confucius Temple Station in RMSE.
4.3. Different Time Granularities
The selection of time granularity may have an impact on the short-term passenger flow prediction effect. Larger time granularity may not be practically meaningful in effectively capturing the actual passenger flow variations. On the contrary, smaller time granularity may lead to significant fluctuations in data due to sudden adverse weather conditions, among other factors, which can result in large variations in passenger volume (Ma et al., 2022). To investigate the influence of the time granularity on the prediction accuracy of the boarding passenger flow, the passenger flow in intervals of 15 min and 30 min was counted and predicted further.
For a comparison of the accuracy of predicting results with different time granularities, the RMSE values with time granularities of 10 min and 15 min are converted to RMSE values with a time granularity of 30 min, and the metric in the uniform dimension is named U-RMSE. Specifically, U-RMSE (10 min) = RMSE (10 min) × 3, U-RMSE (15 min) = RMSE (15 min) × 2. The prediction results and performances of each station using different time granularities are shown in Table 8.

Table 8.
Performance metrics of various models with different time granularities.
Under different time granularities, the proposed SSA-LSTM model and the traditional LSTM model always have good prediction accuracy, while the SVR model and XGBoost model show unstable performance, but the changing trend of the prediction accuracy of these two models is almost the same. The performance of the WOA-LSTM model is inferior to the SSA-LSTM model under different time granularities, indicating that the proposed SSA-LSTM model exhibits stronger parameter optimization capabilities and higher accuracy. In general, the prediction results of the proposed SSA-LSTM model maintain better performance than the other four models.
For Xinjiekou Station, Confucius Temple Station, and Nanjing South Railway Station, the prediction accuracy of the proposed SSA-LSTM model improves with increasing time granularity. Compared with the performances of prediction results under a time granularity of 10 min, the U-RMSE (30 min) for Xinjiekou Station decreases from 255.51 to 231.35, down by almost 10 percent, while for Nanjing South Railway Station, the U-RMSE (30 min) decreases by 9%, and R2 increases by more than 0.01. For Confucius Temple Station, the prediction accuracy under a time granularity of 15 min is the lowest, and U-RMSE (30 min) is optimized by 8% compared to U-RMSE (15 min). According to the proposed SSA-LSTM model for Liuzhou East Road Station under different time granularities, the model with 10 min performs the best, and the prediction precision slowly decreases with increasing time granularity. Furthermore, the SVR model and XGBooST model are more likely to have better performance when the time granularity is 10 min.
In general, for different stations, the proposed SSA-LSTM model corresponds to different optimal time granularities to predict passenger flow. This is different from conclusions in previous research that as the granularity of time increases, the accuracy of predictions will increase in LSTM models (Zhang et al., 2021a; Su et al., 2022; Tu et al., 2022) [2,6,7]. For most stations, the similarity and regularity of passenger flow would be stronger at a larger time granularity, so the prediction accuracy of the model would be greater. However, some stations, such as Liuzhou East Station, have highly concentrated peak passenger flow, which may lead to higher prediction accuracy with smaller time granularities. In addition, the smaller the time granularity is, the larger the learning sample size is, and it can be found that the prediction accuracies of the SVR model and XGBoost model are more likely to drop as the sample size decreases. It can also be proven that LSTM, WOA-LSTM, and the proposed SSA-LSTM have more robust stability.
4.4. Without Weather Variable
To further explore the impact of weather factors on the SSA-LSTM model, short-term predictions of boarding passenger flow were conducted without adding weather variables. The results are shown in Table 9.

Table 9.
Performance metrics of SSA with and without weather variables.
The proposed SSA-LSTM model maintains a similar trend with and without weather variables, and models with weather variables outperformed those without weather variables for most stations under different time granularities. Similarly, Liuzhou East Road station had a special performance. When there was no weather variable, the model under the time granularity of 15 min had the best performance, and its prediction accuracy was higher than that of the model with a weather variable. Therefore, the above conclusion on the time granularity is still valid. Meanwhile, the surrounding residential land attributes make its passenger flow more characterized by rigid demand and less affected by weather.
4.5. Model Applicability
The proposed SSA-LSTM model is applied for boarding passenger flow prediction for four Nanjing rail transit stations. The prediction results of the proposed SSA-LSTM model are better than those of SVR, XGBoost, LSTM, and WOA-LSTM in all cases, indicating its ability to fit the volatility of passenger flow at each type of stations. Among the four cases, the models for stations with a large amount and strong regularity of passenger flow have higher prediction accuracy, such as residential-dominated stations (Liuzhou East Road station) and commercial/office-dominated stations (Xinjiekou station).
Furthermore, prediction experiments under different time granularities have also been investigated. It can be found that in the proposed SSA-LSTM model, for most stations, the similarity and regularity of passenger flow would be stronger at a larger time granularity, so the prediction accuracy of the model is greater; however, some stations, such as Liuzhou East Station, have highly concentrated peak passenger flow in a shorter time, which may lead to higher prediction accuracy with smaller time granularities. In addition, the prediction accuracy of the SVR model and XGBoost model are more likely to drop as the time granularity increases.
To explore the impact of weather factors on the passenger flow prediction, a comparison is made between the performances of the models under the influence of weather variables and without them. It was found that the SSA-LSTM models with weather variables achieved higher prediction accuracy for most stations. However, for Liuzhou East Road station, the prediction accuracy of the model regardless of the weather was higher than models adding weather variables.
5. Conclusions
Considering the influence of the day of the week and the weather, an improved SSA-LSTM model with optimization strategies is established to practice the short-term prediction of the boarding passenger flow at rail transit stations in this research. Specifically, SSA is used to find the optimal number of neurons in LSTM; the tent mapping strategy is combined with SSA to make the initial sparrow population more diverse and uniform; and the Levy flight strategy is applied in SSA to improve the searchability of the algorithm and its ability to jump out of the local optimum. A better solution is proposed for short-term forecasting of passenger flow at rail transit stations.
Through some experiments, it is verified that the SSA-LSTM model with the inclusion of Levy flights and tent chaotic mapping can indeed enhance the short-term passenger flow prediction accuracy. However, it also comes with limitations. For instance, for each prediction for a different station under a different granularity, it requires recalculating the model’s fitness value to determine the optimal number of neurons, resulting in a computational cost. Furthermore, although most stations follow the trend of a higher prediction accuracy with a larger time granularity, there are exceptions, such as Liuzhou East Road Station. This discrepancy cannot be fully explained or demonstrated quantitatively in this paper.
Author Contributions
Conceptualization, X.Z. (Xing Zhao); Methodology, X.Z. (Xing Zhao); Validation, X.D.; Investigation, X.Z. (Xueting Zou); Resources, X.D.; Data curation, C.L.; Writing—review & editing, A.I.; Visualization, X.Z. (Xueting Zou). All authors have read and agreed to the published version of the manuscript.
Funding
This research is supported by the Natural Science Foundation of Jiangsu Province, China (BK20211203).
Data Availability Statement
The datasets used or analyzed during the current study are available from the corresponding author upon reasonable request.
Conflicts of Interest
Author Xiwang Du was employed by the company Jsti Group. The remaining authors declare that the research was conducted in the absence of any commercial or financial relationships that could be construed as a potential conflict of interest.
References
- Liu, L.; Chen, R.C.; Zhu, S. Impacts of whether on short-term metro passenger flow forecasting using a deep LSTM neural network. Appl. Sci. 2020, 10, 2962. [Google Scholar] [CrossRef]
- Zhang, J.; Chen, F.; Zhu, Y.; Guo, Y. Deep learning architecture for short-term passenger flow forecasting in urban rail transit. IEEE Trans. Intell. Transp. Syst. 2021, 22, 7004–7014. [Google Scholar] [CrossRef]
- Zhang, Q.; Liu, X.; Spurgeon, S.; Yu, D. A two-layer modelling framework for predicting passenger flow on trains: A case study of London underground trains. Transp. Res. Part A 2021, 151, 119–139. [Google Scholar] [CrossRef]
- Ma, C.; Li, P.; Zhu, C.; Lu, W.; Tian, T. Short-term passenger flow forecast of urban rail transit based on different time granularities. J. Chang. Univ. (Nat. Sci. Ed.) 2020, 40, 75–83. [Google Scholar]
- Yang, F.; Shuai, C.; Qian, Q.; Wang, W.; He, M.; He, M.; Lee, J. Predictability of short-term passengers’ origin and destination demands in urban rail transit. Transp. 2022, 50, 2375–2401. [Google Scholar] [CrossRef]
- Tu, Q.; Zhang, Q.; Zhang, Z.; Gong, D.; Jin, C. Forecasting subway passenger flow for station-level service supply. Big Data 2022. [Google Scholar] [CrossRef]
- Su, H.; Peng, S.; Mo, S.; Wu, K. Neural network-based hybrid forecasting models for time-varying passenger flow of intercity high-speed railways. Mathematics 2020, 10, 4554. [Google Scholar] [CrossRef]
- Li, W.; Sui, L.; Zhou, M.; Dong, H. Short-term passenger flow forecast for urban rail transit based on multi-source data. EURASIP J. Wirel. Commun. Netw. 2021, 2021, 9. [Google Scholar] [CrossRef]
- Sina, A.; Kaur, D. Short term load forecasting model based on kernel-support vector regression with social spider optimization algorithm. J. Electr. Eng. Technol. 2019, 15, 393–402. [Google Scholar] [CrossRef]
- Wang, K.; Guo, B.; Yang, H.; Li, M.; Zhang, F.; Wang, P. A semi-supervised co-training model for predicting passenger flow change in expanding subways. Expert Syst. Appl. 2022, 209, 118310. [Google Scholar] [CrossRef]
- Peng, Y.; Xiang, W. Short-term traffic volume prediction using GA-BP based on wavelet denoising and phase space reconstruction. Phys. A Stat. Mech. Its Appl. 2020, 549, 123913. [Google Scholar] [CrossRef]
- Fu, X.; Zuo, Y.; Wu, J.; Yuan, Y.; Wang, S. Short-term prediction of metro passenger flow with multi-source data: A neural network model fusing spatial and temporal features. Tunn. Undergr. Space Technol. 2022, 124, 104486. [Google Scholar] [CrossRef]
- Madan, R.; Mangipudi, P. Predicting computer network traffic: A time series forecasting approach using DWT the ARIMA and RNN. In Proceedings of the 11th International Conference on Contemporary Computing, Noida, India, 2–4 August 2018. [Google Scholar]
- Hewamalage, H.; Bergmeir, C.; Bandara, K. Recurrent Neural Networks for Time Series Forecasting: Current status and future directions. Int. J. Forecast. 2021, 37, 388–427. [Google Scholar] [CrossRef]
- Zhang, T.; Guo, G. Graph Attention LSTM: A Spatiotemporal Approach for Traffic Flow Forecasting. IEEE Intell. Transp. Syst. Mag. 2020, 14, 190–196. [Google Scholar] [CrossRef]
- Hochreiter, S.; Schmidhuber, J. Long short-term memory. Neural Comput. 1997, 9, 1735–1780. [Google Scholar] [CrossRef]
- Jing, Y.; Hu, H.; Guo, S.; Wang, X. Short-term prediction of urban rail transit passenger flow in external passenger transport hub based on LSTM-LGB-DRS. IEEE Trans. Intell. Transp. Syst. 2021, 22, 4611–4621. [Google Scholar] [CrossRef]
- Yang, X.; Xue, Q.; Yang, X.; Yin, H.; Qu, Y.; Li, X.; Wu, J. A novel prediction model for the inbound passenger flow of urban rail transit. Inf. Sci. 2021, 566, 347–363. [Google Scholar] [CrossRef]
- Li, X.; Zhang, Y.; Du, M.; Yang, J. The forecasting of passenger demand under hybrid ridesharing service modes: A combined model based on WT-FCBF-LSTM. Sustain. Cities Soc. 2020, 62, 102419. [Google Scholar] [CrossRef]
- Wan, H.; Guo, S.; Yin, K.; Liang, X.; Lin, Y. CTS-LSTM: LSTM-based neural networks for correlated time series prediction. Knowl.-Based Syst. 2020, 191, 105239. [Google Scholar] [CrossRef]
- Yang, X.; Xue, Q.; Ding, M.; Wu, J.; Gao, Z. Short-term prediction of passenger volume for urban rail systems: A deep learning approach based on smart-card data. Int. J. Prod. Econ. 2021, 231, 107920. [Google Scholar] [CrossRef]
- Zhang, J.; Chen, F.; Guo, Y.; Li, X. Multi-graph convolutional network for short-term passenger flow forecasting in urban rail transit. IET Intell. Transp. Syst. 2020, 14, 1210–1217. [Google Scholar] [CrossRef]
- Tang, J.; Liang, J.; Liu, F.; Hao, J.; Wang, Y. Multi-community passenger demand prediction at region level based on spatio-temporal graph convolutional network. Transp. Res. Part C Emerg. Technol. 2021, 124, 102951. [Google Scholar] [CrossRef]
- Xu, Q. Incorporating CNN-LSTM and SVM with wavelet transform methods for tourist passenger flow prediction. Soft Comput. 2024, 28, 2719–2736. [Google Scholar] [CrossRef]
- Xuan, J.; Song, J.; Liu, J.; Zhang, Q.; Xue, G. Short-time Prediction of Urban Rail Transit Passenger Flow. Teh. Vjesn. 2024, 343, 474–485. [Google Scholar]
- Shi, B.; Wang, Z.; Yan, J.; Yang, Q.; Yang, N. A Novel Spatial–Temporal Deep Learning Method for Metro Flow Prediction Considering External Factors and Periodicity. Appl. Sci. 2024, 14, 1949. [Google Scholar] [CrossRef]
- Xue, J.; Shen, B. A novel swarm intelligence optimization approach: Sparrow search algorithm. Syst. Sci. Control. Eng. 2020, 8, 22–34. [Google Scholar] [CrossRef]
- Li, J.; Lei, Y.; Yang, S. Mid-long term load forecasting model based on support vector machine optimized by improved sparrow search algorithm. Energy Rep. 2022, 8, 491–497. [Google Scholar] [CrossRef]
- Guo, J.; Liu, P.; An, Z. Research on computer prediction model using SSA-BP neural network and sparrow search algorithm. J. Phys. Conf. Ser. 2021, 2033, 12003. [Google Scholar] [CrossRef]
- Tian, Z.; Chen, H. A novel decomposition-ensemble prediction model for ultra-short-term wind speed. Energy Convers. Manag. 2021, 248, 114775. [Google Scholar] [CrossRef]
- Song, C.; Yao, L.; Hua, C.; Ni, Q. A novel hybrid model for water quality prediction based on synchrosqueezed wavelet transform technique and improved long short-term memory. J. Hydrol. 2021, 603, 126879. [Google Scholar] [CrossRef]
- Li, S.; Yang, J.; Wu, F.; Li, R. Combined Prediction of Photovoltaic Power Based on Sparrow Search Algorithm Optimized Convolution Long and Short-Term Memory Hybrid Neural Network. Electronics 2022, 11, 1654. [Google Scholar] [CrossRef]
- Wu, Y.; Sun, L.; Sun, X.; Wang, B. A hybrid XGBoost-ISSA-LSTM model for accurate short-term and long-term dissolved oxygen prediction in ponds. Environ. Sci. Pollut. Res. 2021, 29, 18142–18159. [Google Scholar] [CrossRef] [PubMed]
- Yuan, X.; Chen, C.; Jiang, M.; Yuan, Y. Prediction interval of wind power using parameter optimized Beta distribution based LSTM model. Appl. Soft Comput. 2019, 82, 105550. [Google Scholar] [CrossRef]
- Luo, J.; Gong, Y. Air pollutant prediction based on ARIMA-WOA-LSTM model. Atmos. Pollut. Res. 2023, 14, 101761. [Google Scholar] [CrossRef]
- Fu, T.; Li, X. Hybrid the long short-term memory with whale optimization algorithm and variational mode decomposition for monthly evapotranspiration estimation. Sci. Rep. 2022, 12, 20717. [Google Scholar] [CrossRef]
- Li, P.; Li, Z.; Hu, Y.; Huang, S. Prediction of total volatile basic nitrogen (TVB-N) in fish meal using a metal-oxide semiconductor electronic nose based on the VMD-SSA-LSTM algorithm. J. Sci. Food Agric. 2024, 104, 7873–7884. [Google Scholar] [CrossRef]
- Ma, B.; Lu, P.; Zhang, L.; Liu, Y. Enhanced sparrow search algorithm with mutation strategy for global optimization. IEEE Access 2021, 9, 159218–159261. [Google Scholar] [CrossRef]
- Yu, C.; Qi, X.; Ma, H.; He, X.; Wang, C.; Zhao, Y. LLR: Learning learning rates by LSTM for training neural networks. Neurocomputing 2020, 394, 41–50. [Google Scholar] [CrossRef]
Disclaimer/Publisher’s Note: The statements, opinions and data contained in all publications are solely those of the individual author(s) and contributor(s) and not of MDPI and/or the editor(s). MDPI and/or the editor(s) disclaim responsibility for any injury to people or property resulting from any ideas, methods, instructions or products referred to in the content. |
© 2024 by the authors. Licensee MDPI, Basel, Switzerland. This article is an open access article distributed under the terms and conditions of the Creative Commons Attribution (CC BY) license (https://creativecommons.org/licenses/by/4.0/).