Abstract
This study investigates the optimization of taxi-pooling operations using the M/M/1/m queuing model, aiming to enhance efficiency and revenue for taxi service platforms. Traditional taxi operations face challenges during peak periods, including inefficiency and increased operational costs. Taxi-pooling, by accommodating multiple passengers with similar travel demands, offers a solution that reduces travel costs, operational expenses, and urban congestion. The study develops an optimization model to balance operational costs and passenger waiting times, identifying the utilization rate of taxis as a critical factor in platform revenue. By modeling the taxi-pooling service as a queuing system, we derive mathematical expressions for passenger waiting times and platform revenue under varying conditions. Our findings highlight the importance of optimal vehicle investment strategies and pricing decisions to maximize revenue. The study provides theoretical support for improving taxi-pooling platforms’ efficiency and competitiveness, contributing to better urban transportation solutions.
Keywords:
taxi-pooling optimization; M/M/1/m queuing model; revenue maximization; passenger waiting time MSC:
90B22
1. Introduction
Urban taxis, as a prevalent mode of public transportation, address the limitations of predetermined bus schedules by offering point-to-point transportation services [1]. However, traditional taxi operations exhibit lower efficiency, particularly during peak travel periods, leading to supply shortages. This inefficiency exacerbates traffic congestion, fuel consumption, and air pollution, and critically, it creates operational challenges for taxi companies in terms of efficiency and passenger satisfaction [2]. In the era of Internet+, emerging taxi industries such as Uber and Didi leverage digital tools to enhance service quality and operational efficiency [3,4]. The taxi-pooling operational mode has been introduced for commercial use to meet the increasing demand for personalized and diversified travel options.
Unlike the traditional taxi operation mode, which typically targets passengers hailing on the roadside and usually serves a single passenger, the taxi-pooling system can accommodate multiple passenger requests with similar travel demands, such as comparable destinations or nearly identical travel times [2,5]. Compared to conventional taxi operations, the state-of-the-art taxi-pooling system offers several advantages. From the passengers’ perspective, travel costs can be significantly reduced as co-passengers share the fare, effectively alleviating the individual travel burden and reducing urban road congestion. From the drivers’ perspective, operational costs are mitigated since multiple travel requests can be fulfilled simultaneously. Additionally, taxi enterprises can enhance their operational efficiency through this mode. Consequently, in the context of increasingly severe urban traffic congestion, taxi-pooling, a modern mode of transportation, has garnered growing attention from stakeholders. From an operational standpoint, excessive investment in taxis, while reducing customer waiting times, results in increased operational costs. Conversely, reducing the investment in taxis, although lowering costs, may lead to prolonged customer waiting times and potential customer attrition. To balance operational costs with customer waiting times, we develop an optimization model aimed at minimizing operational expenses. Simultaneously, we consider the taxi-pooling operational model and establish a corresponding mathematical model. Through the analysis of the optimal solution, we find that the utilization rate of taxis engaged in taxi-pooling services is the most critical factor influencing the revenue of taxi-pooling platforms. Therefore, vehicle investment strategies should be formulated based on achieving the optimal service utilization rate.
During peak travel periods, passengers often face wait times for taxis. The taxi-pooling service can be modeled as a queuing system. In other words, as passenger flow fluctuates, the waiting time for passengers and the revenue of taxi enterprises varies accordingly. Therefore, developing a robust queuing theory model to accurately predict and manage passenger waiting times, taxi service quality, and operational efficiency during the taxi-pooling service is crucial for optimizing taxi operations, enhancing taxi platforms, and increasing passenger satisfaction, thereby improving urban transportation efficiency [6]. Compared to the current taxi-pooling operations, research on precise organization and pricing remains limited. This study considers the taxi-pooling service of each vehicle as an independent operational process, examining the relationship between the revenue of taxi-pooling platforms and related operational decisions, as well as fluctuations in passenger flow. Additionally, the study investigates the mathematical expressions for optimizing taxi-pooling platform revenue.
It is recognized that during taxi-pooling services, passenger queuing times are influenced by the number of available taxis, the number of pooling passengers per vehicle, and fluctuations in passenger flow. To address this, the M/M/1/m queuing model was initially employed to derive a mathematical model for passenger waiting times for a single taxi engaged in taxi-pooling services. The mathematical expression for waiting time in the passenger service queue was then derived for scenarios involving taxis participating in pooling services, treating taxis as independent entities. Through theoretical derivation and mathematical analysis, it was concluded that vehicle service utilization is the most critical indicator in taxi-pooling service systems. Moreover, a steady-state pricing strategy was identified as the optimal pricing decision for taxi-pooling platforms under varying passenger flows. Additionally, this study provides a mathematical analytical expression for the optimal revenue of taxi-pooling platforms when each vehicle accommodates two shared passengers. The contribution of this article is twofold: (1) precisely characterizing the waiting time of carpooling passengers on a taxi-pooling platform using the M/M/1/m queuing model and (2) providing a mathematical expression for the optimal revenue of taxi-pooling platforms.
The remainder of this article Is structured as follows: Section 2 reviews the literature related to the taxi-pooling problem, focusing on the impact of ride-sharing services on the utilization of traditional taxis, decision-making processes in ride-sharing taxi systems, and revenue optimization in taxi service platforms. Section 3 formulates and establishes the optimization model for the taxi-pooling operation system. Section 4 presents the theoretical analysis of the taxi-pooling operation system. Section 5 conducts model validation and case study. Section 6 performs sensitivity analysis. Section 7 concludes the article.
2. Literature Review
This article surveys research topics on the pricing problem of ride-sharing taxi services on a shared platform, primarily focusing on the impact of ride-sharing services on traditional taxi usage, the decision-making processes in ride-sharing taxi systems, and revenue optimization within taxi service platforms. The following paragraphs provide an overview of these three aspects in the corresponding order.
Previous studies have not reached a consensus regarding the impact of ride-sharing services on the use of traditional taxis. Opinions on whether and how ride-sharing services have impacted traditional taxis are divided [7]. This divergence is primarily due to the varied research contexts and backgrounds of these studies [8,9]. The rapid growth of ride-sharing operators, such as Uber and Didi Chuxing, has influenced traditional modes of transportation, significantly impacting urban traffic and the environment. Since the advent of ride-sharing operators, traditional taxi users have increasingly opted for ride-sharing services due to their higher vehicle utilization rates, more affordable pricing, and ease of hailing [10,11]. Some studies posit that the entry of ride-sharing services benefits urban transportation efficiency, mitigates urban air pollution, and promotes sustainable urban development. For instance, Wallsten [12] observed that traditional urban taxi industries improved their service quality under competitive pressure from ride-sharing operators, effectively reducing passenger complaints about conventional taxi services. Similarly, Kim, Baek, and Lee [8] found that local taxi companies in New York City altered their operational strategies following Uber’s market entry, significantly improving their number of trips and occupancy rates. However, despite some traditional taxi companies enhancing operational efficiency in response to the competition from ride-sharing services, these improvements are often reactive and driven by pressure. Consequently, other scholars argue that introducing ride-sharing services has more drawbacks than benefits for traditional taxi companies. Berger et al. [13] noted that the most immediate effect of shared transportation is a reduction in the direct income of traditional taxi drivers. Moreover, an investigation by Contreras and Paz [14] in Las Vegas, Nevada revealed that Uber’s entry significantly decreased traditional taxi ridership. Similarly, in China, Sun et al. [15] analyzed taxi operation data in Yiwu and concluded that ride-sharing services had a significant negative impact on traditional taxi industries concerning drivers’ income and company interests. Therefore, understanding the impact of ride-sharing services on traditional taxi operators is crucial. This understanding not only provides local taxi companies with an incentive to adapt but also creates opportunities for traditional taxi companies to develop their ride-sharing services.
Regarding the decision-making problem of ride-sharing taxi systems, the proliferation of smartphone usage has catalyzed the growth of app-based taxi services, significantly facilitating the expansion of ride-sharing services within the taxi industry and providing urban travelers with diverse and competitive options. Given that ride-sharing services have reshaped the entire taxi industry, an increasing number of scholars are focusing on the decision-making challenges inherent in ride-sharing taxi systems [16,17,18]. Ride-sharing taxi services, or taxi sharing, are essentially a variant of ride-sharing systems that provide pooling services to urban travelers, particularly during peak hours [19]. To meet on-demand requests, a predetermined number of taxis can be dispatched from one or multiple depots to serve passengers [20,21,22,23]. The decision-making process in this context often involves the assignment of taxis to batches of riders with similar itineraries, while idle taxis are dispatched to high-demand areas filled with unserved urban travelers. This approach mitigates the shortcomings observed in traditional taxi systems by designing efficient shared taxi services. The decision-making problem in ride-sharing systems aims to maximize the taxi operator’s income while minimizing urban travelers’ fares. The literature in this field refers to this as the dial-a-ride problem (DARP) [21]. For instance, Nanry and Barnes [24] used a reactive tabu search method to solve the pickup and delivery problem with time windows. Cordeau and Laporte [25] also employed a tabu search heuristic approach to solve the static multi-vehicle pickup and delivery problem, an advancement of this type of problem. Hong et al. [26] designed a GPS trace data-based clustering algorithm to select carpooling routes, while Qian et al. [27] proposed a group ride system to gather different groups at a specific location for collective pickup. Ding et al. [28] proposed a hierarchical and cooperative macroscopic and microscopic dynamic dispatching approach for real-time urban network taxis in a connected taxi information environment, demonstrating that the proposed DSCMM method effectively improves taxi operational efficiency and reduces resource wastage in urban road networks across various service scales. Additionally, autonomous taxi services have been introduced to the market, offering door-to-door services without being constrained by driver preferences [29]. Despite significant progress in previous research, there remains a lack of mathematical models that accurately define passenger queuing service within the ride-sharing taxi service process.
Regarding revenue optimization in taxi service platforms, the charging price is one of the most critical factors influencing passengers’ choice of urban taxi services [30]. Compared to traditional taxi fares, ride-sharing taxi services can adopt more flexible pricing strategies, creating a win–win situation for all stakeholders. Developing a reasonable ride-sharing taxi operation plan can therefore increase profits compared to traditional taxi services [31]. According to Zhang et al. [32], the profit margin and sustainability of the taxi service platform are mainly affected by the coordination mechanism of the ride-sharing taxi pricing strategy. Specifically, the charging method should ensure that each shared passenger is charged proportionally to their requested travel distances during the ride-sharing process. Therefore, pricing strategies for optimizing revenue on taxi service platforms should comprehensively consider urban traveler benefits, platform operational interests, and taxicab utilization. Scholars have investigated ride-sharing pricing strategies to ensure charging feasibility and fairness, balancing the charges among different shared passengers. In early research by Sayarshad and Chow [33], a multi-server queue-based DARP was proposed to optimize social welfare, attracting more urban travelers to ride-sharing services. Conversely, Wang et al. [34] proposed a two-sided market strategy to simulate equilibrium in a mixed taxi environment combining ride-sharing and roadside-hailing services. Wolfson et al. [35] developed a price-charging strategy to maximize overall benefits based on individual fairness, finding that urban travelers with lower consumption ability are more likely to share taxicabs. Considering the schedule-cancel behavior of urban travelers, He et al. [36] adopted a punishing continuous linear programming strategy to optimize taxi pricing and compensation strategies. Yan et al. [37] developed a dynamic pricing method accounting for supply–demand changes over time and space, concluding that their approach alleviates price charging fluctuations and improves performance indicators such as utilization rate, travel throughput, and overall benefits through the joint optimization of pricing and urban traveler waiting times. More recently, Ke et al. [38] discovered that monopoly optimal, social optimal, and second best solutions in non-sharing and sharing markets were typically in the normal regime rather than the wild goose chase regime. Nourinejad and Ramezani [39] examined the effects of dynamic wages and fares set by ride-sharing operators on supply, demand, and market states through ride-sharing models and pricing schemes in two-sided markets.
In summary, while the existing literature extensively explores various dimensions of taxi-pooling models on operating platforms—such as market acceptance, user behavior patterns, and platform operation strategies—there is a dearth of research systematically and quantitatively analyzing how fluctuations in demand-side passenger flow and supply-side carpooling efficiency (particularly the number of passengers per shared taxi) jointly affect the pricing strategy and service vehicle configuration of the platform. This article introduces queuing theory and innovatively constructs a mathematical model for passenger waiting time. Based on this, an optimization framework for the taxi-pooling revenue function of the operation platform is further developed. The impact of passenger flow and taxi-pooling numbers on platform revenue, pricing, and vehicle scale is quantitatively analyzed. Specifically, this article provides explicit functional expressions for optimal platform revenue and pricing in scenarios involving taxi-pooling with two passengers. This provides theoretical support for the refinement and data-driven development of taxi-pooling platforms, thereby promoting improved operational efficiency and market competitiveness.
3. Queuing Model Establishment
To efficiently coordinate the relationship between a shared taxi service company and the corresponding passenger demands, a model framework for a taxi-pooling service pattern is developed in this section. Given that the interaction between the taxi platform and passengers can be viewed as on-demand behavior—where taxi companies provide services based on varying customer needs—the taxi service platform in this study also aims to adjust its pricing strategies and vehicle fleet size to maximize targeted revenue. Unlike conventional roadside-hailing taxi operations, where platform revenue is primarily influenced by factors such as pricing and fleet size, shared taxi service operations are additionally affected by the number of passengers per vehicle and the number of passengers waiting for service. These factors significantly impact the platform’s revenue as they influence passenger wait times.
Recognizing the on-demand nature of the shared taxi service process, an M/M/1/m queuing model was initially employed to investigate the impact of the interaction between the taxi service platform and passengers on passenger service waiting times for a single taxi vehicle. Further, by treating each taxi service process as independent and non-interfering, the queuing and waiting model is extended to taxis to explore how service platform decisions affect the interests of both service providers (taxi companies and shared passengers). This approach provides a valuable methodology for understanding and optimizing shared taxi platform performance in terms of pricing, vehicle fleet size, and passenger satisfaction.
Assumptions are established regarding both passengers and the taxi platform. For passengers, it is assumed that the market size remains fixed within a specified time period, ensuring that all generated service requests can be accommodated by the predefined taxi fleet, and that all analyses are conducted under consistent conditions. Additionally, the pricing rate is standardized for all shared passengers, with service requests quantified in arbitrary units (e.g., taxi travel miles). The pricing rate charged by the taxi platform is also expressed in units (e.g., yuan per kilometer). It is further assumed that passengers arrive at the platform according to a random distribution, allowing the system to maintain optimal operation under realistic conditions.
Regarding the taxi company providing services, it is assumed that all vehicles are designated as shared taxis, with the actual number of shared taxis in service defined as . Given the fixed capacity of each taxi, the number of shared passengers per vehicle is also constrained. Concerning the revenue generated by the service platform through the deployment of taxi vehicles, the cost per service unit provided by each taxi vehicle , as well as the fixed unit cost per taxi vehicle, are defined accordingly.
Based on the aforementioned assumptions, this study systematically constructs a functional model of the demand and supply sides, aiming to elucidate and quantify the interaction between passengers and carpooling platforms. Additionally, we employ the M/M/1/m queuing theory as an analytical tool to quantify the revenue generated by passengers in carpooling services (Section 3.2), the waiting time (Section 3.3), and the platform’s service revenue, thereby laying the foundation for subsequent theoretical derivations.
3.1. Notations
To facilitate a clearer understanding of the model framework, the fundamental parameters and notations used in this study are outlined in Table 1.

Table 1.
Notations and parameters.
3.2. Passenger Benefits of Taxi-Pooling Service
It is noted that shared passengers must access the taxi platform to request services for the completion of the taxi-pooling process. Within a specified time period, is defined as the maximum potential demand rate for passengers entering the platform to request taxi-pooling services. Given that the passengers considered in this study exhibit shared characteristics, specifically being price-sensitive, each requested shared passenger has an associated ‘psychological valuation’ (i.e., the perceived value of the taxi-pooling service). To account for this, we define the value rate per service as , which reflects the heterogeneity among demand requests and approximates real passenger sharing behavior. For the purposes of model evaluation, we assume that the service value rate v follows a strictly increasing cumulative distribution function F(v), with v being in the range of [0,1] according to the cumulative function.
In the model analysis presented in this article, the demand service unit for a shared passenger is denoted as D, with the average service unit represented as d = E(D), considered as the steady-state value in the model framework. For analytical convenience, the pricing of the taxi-pooling service is framed as a time-based pricing problem. Specifically, the taxi-pooling service rate is predetermined for the analysis period, allowing adjustments to the pricing P based on variations in passenger demand rates across different time periods. Consequently, the surplus for each shared passenger utilizing the taxi-pooling service is expressed as (v – P)d, which reflects the passenger’s valuation relative to the offered fare. When the psychological valuation of the service exceeds the platform’s charging price (i.e., v > P), passengers are more likely to accept the taxi-pooling service. Conversely, if the valuation is less than the charging price, passengers are likely to opt for alternative modes of transportation, thereby exiting the queuing system.
Another factor influencing passengers’ preference for taxi-pooling services is the waiting time. It is important to note that, in practice, for time-sensitive passengers, extended waiting periods can quickly lead to impatience, causing them to abandon taxi-pooling as a transportation option. Consequently, the cost of waiting time for shared passengers must be incorporated into the revenue optimization model. We let denote the cost of passenger waiting time per unit duration, i.e., the time each passenger waits for a taxi service. The total cost associated with passenger waiting time can then be expressed as , where represents the average waiting time. Accordingly, the expected benefits for passengers utilizing taxi-pooling services are computed based on the surplus value of the service received and the cost of waiting time, as outlined in Equation (1).
Equation (1) shows that rational passengers only opt for taxi-pooling services if their expected benefits are positive, i.e., . Consequently, the number of passengers entering the platform to request service and who are ultimately willing to accept the service, denoted as , can be calculated as specified in Equation (2).
It should also be noted that each passenger has an individual valuation for the benefits derived from the taxi-pooling service, denoted as in this article, which varies among passengers. To model this heterogeneity, we assume the existence of a continuum of passenger types, such that their service value rate is distributed within the range [0,1] according to a cumulative distribution function that is strictly increasing. Accordingly, Equation (2) can be reformulated as Equation (3), and the corresponding pricing rate can be derived as outlined in Equation (4).
To further simplify the model framework, we assume that the passenger value rate follows a uniform distribution over the interval [0,1]. Consequently, the cumulative distribution function F(v) is given by F(v) = v. This allows the pricing rate P to be reformulated as specified in Equation (5).
3.3. Passenger Waiting Time Wq
In addition to pricing strategies on the taxi platform, passenger waiting time is a critical factor affecting the quality of the taxi-sharing experience. The decision of whether demand passengers accept taxi-pooling services is influenced not only by factors such as the pricing and the number of serviced taxis but also by the volume of taxi-pooling service requests and passenger flow. Given the multitude of variables affecting passengers’ choices regarding taxi-pooling services, quantifying these effects through mathematical models presents significant challenges. To address this, this article introduces an innovative approach that separates the analysis of serviced taxi vehicles. Specifically, the model evaluates the relationship between shared passenger waiting time and passenger flow as well as the number of shared passengers in the context of a single taxi vehicle. The optimization model is then extended to accommodate serviced taxi vehicles to derive the corresponding mathematical expressions.
In the taxi-pooling service process, the arrival of each shared passenger to the taxi-pooling platform during a given time period is considered an independent event, with each arrival occurring with uniform probability. Likewise, the service times for different shared passengers provided by a taxi vehicle are treated as mutually independent. Consequently, the taxi-pooling process can be modeled using the M/M/1/m queuing theory framework, where the first parameter M represents the Poisson distribution of the passenger arrival rate during the specified time period. The second parameter M denotes the negative exponential distribution of the service time for each passenger in the taxi-pooling service. Parameter indicates the presence of a single taxi vehicle providing the service. Parameter m represents the capacity of the taxi-pooling service system. Given that only one taxi vehicle is involved in the taxi-pooling service, the number of shared passengers that can be accommodated on the platform is equal to the maximum number m of shared passenger requests that a single taxi vehicle can handle. According to the conclusions from Operations Research by Hamdy A. Taha [40], the passenger waiting time in the queue for service, when a single vehicle participates in a ride-pooling service, can be derived as in Equation (6),
Moreover, considering that the shared taxi vehicles involved in the taxi-pooling service operate independently without mutual interference, it follows that when taxi vehicles participate in the taxi-pooling service, the utilization rate of the shared taxi vehicles () and the service waiting time for shared passengers participating in the taxi-pooling service can be represented as in Equation (7),
3.4. Taxi-Pooling Service Platform Revenue
We assume that the shared taxi company sets the price for each shared service as P and represents the cost per unit of service a shared taxi vehicle provides, which encompasses the operational costs incurred by potential taxi service providers in the taxi-pooling process. When the average number of shared passengers requesting service is d and the average number of shared passengers per taxi vehicle is m, the surplus generated by the taxi-pooling platform for serving the achieved shared passenger request rate is . Considering the fixed costs associated with shared taxi vehicle participation in providing services, the taxi-pooling platform’s revenue can be expressed as shown in Equation (8),
By substituting Equation (5) into the revenue function of the taxi service platform, it can be expressed as in Equation (9). Subsequently, by incorporating Equation (7) into the taxi-pooling platform’s revenue Function (9), Equation (10) can be derived accordingly.
where , represents the scenario of taxis and .
4. Theoretical Analysis of Taxi-Pooling Operation System
To conduct a comprehensive study on the operational strategies of taxi-pooling service platforms aimed at maximizing revenue, this chapter adopts a dual perspective, encompassing both the supply side and the demand side. It thoroughly examines how variations in taxi-pooling numbers and fluctuations in passenger flow impact platform operations. Specifically, we analyze how the platform can flexibly adjust the service acceptance rate and the operational scale to maximize the overall revenue of carpooling services. Additionally, this section focuses on the specific scenario of taxi-pooling with two passengers, deriving the detailed mathematical expression of the platform’s revenue function. The applicability and accuracy of the mathematical model are validated using the least squares method, providing a theoretical foundation for the optimization decision-making of taxi-pooling service platforms.
4.1. The Impact of the Number of Shared Passengers from the Supply Side on Platform Revenue
Compared to traditional private vehicle transportation, a significant feature of taxi-pooling service vehicles is their ability to simultaneously serve multiple orders. As the number of shared passengers increases, the taxi-pooling platform can achieve more efficient resource utilization, thereby reducing unit costs and significantly enhancing the platform’s profitability. However, an increase in the number of shared passengers can also impact their travel experiences, such as increasing waiting times or reducing riding comfort, potentially diminishing passenger satisfaction with taxi-pooling services, and encouraging a switch to alternative modes of transportation. This shift can have adverse effects on the platform’s user retention and earnings. Therefore, the impact of the number of shared passengers on taxi-pooling platform revenue is a complex and multifaceted issue. To explore this relationship in depth, this section employs a mathematical derivation approach to ascertain the specific correlation and trend between the number of shared passengers and the platform’s revenue.
We derive Equation (9) with respect to the number of shared passengers m to obtain Equation (11),
According to Equation Equation (12) can be derived.
Taking the derivative of with respect to yields Equation (13),
Given that the utilization rate of the shared taxi vehicles is , it can be inferred that , leading to . By substituting into Equation (13), it follows that . Therefore, when external environmental variables remain constant, the waiting time of the shared passengers exhibits an inverse relationship with the number of shared passengers. Substituting back into Equation (11), it can be concluded that the relationship between the taxi-pooling platform revenue and the number of shared passengers is not a simple linear correlation.
From the above deduction process, we can draw an interesting conclusion: an increase in the number of services offered by taxi vehicles actually increases the waiting time for shared passengers while simultaneously reducing the operating costs of the shared taxi vehicles, thereby enhancing the platform’s revenue. Therefore, to maximize the profits of the taxi-pooling platform, the number of shared passengers accepted by each taxi vehicle should be strategically planned based on the traffic environment. As indicated by revenue Function (11), given that the variable cost per unit service price remains constant, it is imperative to minimize passenger waiting times during peak hours while maintaining a stable number of service vehicles to enhance vehicle turnover rates. Specifically, to address passenger demand during peak periods, the number of shared passengers per taxi vehicle should be set to two, thereby increasing the frequency of shared taxi orders. Conversely, during off-peak hours, a strategy of maximizing the number of passengers per vehicle should be employed to reduce , effectively distributing operational costs among vehicles.
4.2. The Impact of Variations in Passenger Flow from the Supply Side on Platform Revenue
Variations in shared passenger flow are crucial parameters for taxi-pooling platforms to adjust their operational strategies. As passenger demand increases, the need for taxi-pooling services also rises, necessitating the platform to offer more taxi-pooling options and implement more efficient matching mechanisms to address the travel needs of shared passengers. Higher passenger flow enhances the utilization and efficiency of taxi-pooling services, which reduces the per-trip cost and attracts a greater number of passengers to the service. However, excessive passenger flow can present challenges in matching and scheduling, requiring ongoing optimization of algorithms and system performance to manage the increased pressure during peak periods. Therefore, understanding the relationship between passenger flow and related decision adjustments is vital for taxi-pooling platforms to maximize profitability.
4.2.1. Theoretical Derivation of the Impact of Variations in Passenger Flow
To investigate the impact of shared passenger flow on the revenue of the taxi-pooling service platform, the following hypotheses are proposed:
- (1)
- As the shared passenger flow increases, the optimal passenger service acceptance rate , the optimal number of serviced platform vehicles , and the optimal revenue of the taxi-pooling platform are expected to increase correspondingly.
- (2)
- As the shared passenger flow increases, the optimal taxi vehicle service utilization rate and the platform’s optimal pricing are anticipated to remain unchanged.
To analyze the impact of shared passenger flow on the taxi-pooling platform’s revenue and related decision variables, Equation (10) is used to compute the first-order derivatives of the shared passenger service acceptance rate and the number of serviced platform vehicles , setting these derivatives to zero.
According to the Lagrange mean value theorem, the maximum platform revenue occurs at the point where the first derivative of platform revenue with respect to and is zero or at the boundary. From Equation (15), it is evident that there is only a single variable . Therefore, as passenger flow increases, to ensure , it is evident that the optimal taxi vehicle service utilization rate of the taxi-pooling platform remains constant regardless of variations in the demanded passenger flow . Consequently, combining this with Equation (14), it can be observed that since remains unchanged with respect to variations in passenger flow, the acceptance rate of taxi-pooling services must also remain fixed to satisfy the equation. In other words, the optimal passenger service acceptance rate increases as the passenger flow rises.
Due to the fact that , to ensure that the optimal utilization rate of the shared taxi vehicle service remains constant, an increase in the demanded passenger flow necessitates a corresponding increase in the number of serviced platform vehicles , which follows the same growth trend as the passenger service acceptance rate. Therefore, by substituting the shared passenger waiting time from Equation (7), we obtain Equation (16),
It can be observed that as the demanded passenger flow increases, the optimal waiting time for passengers remains unchanged. Furthermore, given that , the increase in demanded passenger flow does not affect the pricing strategy of the taxi-pooling platform’s operational model. By substituting into Equation (8) of the taxi-pooling platform’s revenue function, Equation (17) can be derived,
Consequently, it can be concluded that as the demanded passenger flow increases, the optimal revenue of the taxi-pooling platform also rises. From this analysis, it is evident that, unlike conventional taxi service platforms, an increase in the demanded shared passenger flow does not impact the pricing decisions of the taxi-pooling platform. During peak periods, despite a significant surge in demand for taxi-pooling services, excessively high prices may drive passengers to opt for private vehicle services, while excessively low prices may result in an insufficient supply of serviced taxi vehicles to meet the demand. Therefore, a stable pricing strategy should be implemented by the taxi-pooling platform.
4.2.2. Numerical Analysis of the Impact of Variations in Passenger Flow
This subsection presents a numerical analysis to validate the aforementioned proposition. The variable operating cost of a single taxi vehicle is approximately twice its fixed cost. The cost associated with waiting time for shared passengers is set to one. Furthermore, as indicated in Section 4.1, the optimal number of shared passengers per vehicle during peak passenger flow is two. External environment parameters are specified as . To clearly illustrate the trend of numerical changes, passenger flow is varied within the range of 10 to 100 with a variation of 10. In this context, Table 2 illustrates the impact of variations in shared passenger flow on the relevant parameters.
Table 2.
The impact of passenger flow on platform decision-making.
Table 2 demonstrates that the passenger flow positively impacts the scale of platform service taxis and platform revenue, with the growth rate consistently aligning with the increase in passenger flow. As passenger flow rises, the optimal number and scale of service taxis on the platform also increase synchronously, ensuring that the utilization rate of service taxis remains optimal. This allows for timely satisfaction of passenger demand while minimizing operating costs. However, in practice, the number of taxis available on the platform is limited. As passenger flow continues to rise, the platform’s taxi service capacity eventually becomes insufficient, failing to meet demand. This results in longer waiting times for passengers, thereby diminishing the potential for passenger flow to enhance platform revenue. Additionally, from Table 2, it is evident that variations in passenger flow have no significant impact on passenger waiting time and pricing strategies. Therefore, under the taxi-pooling operation model, the platform should adopt a stable pricing strategy to maintain passenger waiting time at a consistent level, thereby maximizing revenue.
4.3. The Impact of Passengers in Special Circumstance (m = 2) from the Supply Side on Platform Revenue
From Section 4.1, it is evident that an increase in the number of shared passengers raises their waiting time cost. To elucidate the decision-making process for taxi-pooling operations during peak hours and to facilitate subsequent theoretical derivations, this subsection assumes a fixed number of shared passengers set at two. This assumption is used to analyze the decision-making rules for optimizing platform revenue under these specific conditions.
When the number of shared passengers per taxi vehicle is two, the waiting time for shared passengers can be expressed as . Substituting this expression into the taxi platform benefit function given in Equation (9) yields Equation (18),
where , .
To more intuitively illustrate the trend of influence, a combination of numerical simulations and graphical representations was employed to investigate the impact of the number of serviced taxi vehicles (actual usage of vehicle fleet size) and the shared passenger acceptance rate (potential passenger demand rate) on platform revenue. According to Bai [41], the external parameters are defined as follows: the passenger waiting cost per unit time, denoted by c, the average number of service units per request, d, and the average service rate of providers, u, are set to 1, 0.5, and 1, respectively. The cost of taxi service per unit, r, is approximately twice the wage rate per service unit for participating providers, , leading to values of and . Based on the analysis in Section 4.1, the optimal number of shared passengers per vehicle, m, is set to two.
To elucidate the relationship between model parameters and to ensure positive platform revenue, the number of available taxi vehicles is constrained to the range of 3 to 6, while the passenger demand varies from 10 to 100 in increments of 10. These parameters were applied to Equation (18) and the model was executed using MATLAB 2019a. The results are displayed in Figure 1.
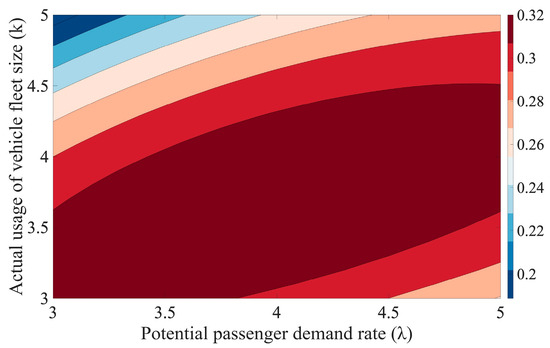
Figure 1.
Analysis of the dual-factor impact on platform revenue.
It can be observed that the platform revenue function exhibits a concave shape for variations in the number of serviced taxi vehicles and the shared passenger acceptance rate. Consequently, it can be inferred that, with the number of shared passengers fixed at two and external conditions remaining constant, there exists an optimal value for the taxi-pooling platform’s revenue.
Moreover, it can be observed that platform revenue decreases as the actual fleet size, k, increases when the potential passenger demand rate, λ, is relatively low. This phenomenon occurs primarily due to an oversupply of taxi vehicles when passenger demand is insufficient, resulting in underutilized taxi vehicles and elevated operational costs for the platform. Consequently, platform revenue diminishes under these conditions. However, when the passenger demand rate exceeds , platform revenue initially increases before experiencing a subsequent decline. This is because the initial increase in fleet size allows for better alignment with rising passenger demand, enhancing service provision and thereby boosting revenue. Yet, as the fleet size continues to grow, the platform encounters excess capacity, leading to inefficiencies and additional costs, which negatively impact revenue.
Additionally, platform revenue is positively correlated with an increasing passenger demand rate, λ, when the fleet size, k, is relatively large. In this scenario, higher passenger demand results in greater utilization of taxi-pooling services, which drives revenue growth. Conversely, when the fleet size, k, is small, an increase in passenger demand leads to a decrease in platform revenue. This is because an insufficient number of vehicles exacerbates service shortages, increases passenger wait times, and causes customer attrition, ultimately reducing platform revenue.
4.3.1. Theoretical Derivation of the Impact of Passengers in Special Circumstance
To explore the optimal adjustment strategies for operational decisions such as service pricing and fleet size in response to variations in the traffic environment, under the objective of maximizing taxi-pooling platform revenue, the platform revenue function given in Equation (18) is utilized. The first-order derivatives of the passenger service acceptance rate and the number of serviced taxi vehicles are computed and set to zero, as illustrated in Equations (19) and (20).
From Equation (20), it is evident that the optimal taxi vehicle service utilization rate for the taxi-pooling platform is relatively constant. This rate is influenced solely by the platform’s fixed operating costs and passenger waiting time costs, as detailed in Equation (21).
By substituting Equation (21) into the calculation of shared passenger waiting time , Equation (22) can be derived.
By substituting Equation (21) into Equation (19), it can be established that, with external traffic environment factors held constant, the optimal taxi-pooling service acceptance rate exists and is unique. Its optimal value can be determined as specified in Equation (19).
Given that the utilization rate of the shared taxi vehicle service is , the optimal number of serviced taxi vehicles for the platform can be calculated as specified in Equation (24).
By substituting Equation (24) into Equation (5), the optimal charging price for the taxi-pooling platform can be determined as expressed in Equation (25).
By substituting Equations (23) and (24) into Equation (18), the optimal revenue expression for the taxi-pooling platform, given that the number of shared passengers per taxi vehicle is two, can be derived and is provided in Equation (26).
From the above derivation, it can be observed that during peak hours, when the number of shared passengers per taxi vehicle is two, the taxi-pooling platform must make strategic decisions regarding the utilization rate of taxi vehicle services to maximize platform revenue. The optimal utilization rate is solely dependent on the cost of shared passenger waiting time and the fixed cost of the serviced taxi vehicles. This reflects the balance that the platform should strike between investing in its benefits and ensuring passenger satisfaction. Such an approach enables the taxi-pooling platform to tailor its service decisions according to different passenger types. For passengers with low unit waiting time costs, the platform should aim to maximize vehicle service utilization. During operations, the dispatch process can be intentionally delayed to accommodate high waiting time requirements or to recommend dedicated vehicle services for these passengers.
4.3.2. Numerical Analysis of the Impact of Passengers in Special Circumstance
To verify whether the analytical solution presented in this article represents the optimal solution for the proposed model, the optimal platform revenue for Equation (14) with shared passengers was determined through enumeration under varying passenger flow conditions. The analytical results were compared with those obtained through enumeration under different passenger flows, as depicted in Figure 2. To ensure that the platform’s revenue remains positive and the taxi vehicle service utilization rate is optimized, a passenger flow range from 1 to 30 was selected for analysis based on the previous environmental variables. The least squares analysis of the enumeration results and analytical solutions yielded , where represents the sum of squared errors and represents the total sum of squared differences. The figure demonstrates that the analytical solution consistently aligns with the optimal solution.
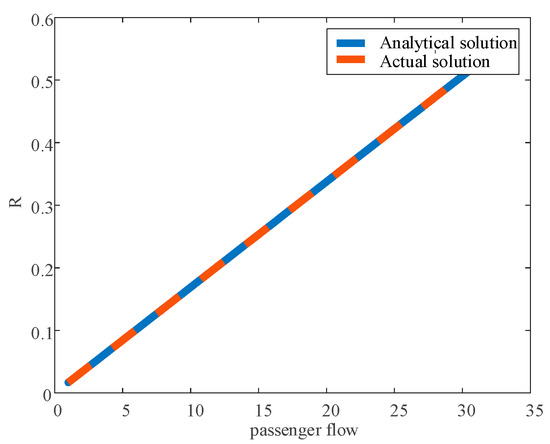
Figure 2.
Revenue function fitting and trend analysis chart for taxi-pooling platforms.
5. Case Study
In this section, we provide a comprehensive overview of the theoretical foundations related to taxi-pooling service strategies. Employing queuing theory as the central focus for the design and optimization of the taxi-pooling service process is essential for validating two key factors: the time intervals at which passengers enter the taxi-pooling system and the duration required for taxis to complete the pooling service. To rigorously validate and assess the proposed model, we first conducted a One-Sample Kolmogorov–Smirnov Test on the input data to confirm that the passenger arrival rate and service time follow a Poisson distribution and negative exponential distribution, respectively. Subsequently, we compare and evaluate the effectiveness and superiority of the proposed model.
5.1. Distribution Test of Input Data
We collected taxi-pooling order data from the Songjiang District of Shanghai over a 24 h period on 5 December 2023 to validate the passenger arrival component of this model. The data were aggregated hourly at one-minute intervals, and a one-sample Kolmogorov–Smirnov (K-S) test was conducted using SPSS (IBM SPSS Statistics 23), with the results detailed in the accompanying Table 3. Most of the p-values (22 out of 24) were greater than 0.1, indicating that the distribution of passenger arrivals conforms to a Poisson distribution based on the one-sample K–S validation. This validates that the queuing model utilized in our analysis effectively simulates real-world passenger arrivals.
Table 3.
One-sample Kolmogorov–Smirnov test for passenger arrivals.
We used the same taxi-pooling order data from Songjiang District, Shanghai to validate the service time distribution. Service times for all orders within the 24 h period of 5 December 2023 were extracted, and a one-sample Kolmogorov–Smirnov (K–S) test was performed using SPSS, with the results shown in Table 4. The p-value is greater than 0.1, indicating that the service time distribution conforms to an exponential distribution based on the one-sample K–S test. This confirms that the service time assumptions in our model, specifically its adherence to an exponential distribution, are valid.
Table 4.
One-sample Kolmogorov–Smirnov test for service times.
5.2. Performance Analysis
A case study was conducted to evaluate the performance of the proposed optimal control scheme within a real-world traffic scenario. This paper utilizes ride-hailing order data from the Songjiang District of Shanghai collected over six days in December 2023 averaging 58,370 orders per day. The specific data are depicted in Figure 3, where each red line represents an individual order, with the endpoints indicating the origin and destination areas. Regions with denser red lines signify higher order volumes. The figure illustrates that the spatial distribution of orders remains relatively consistent across the analyzed days. Furthermore, to validate the superiority of the proposed model, comparative analyses were performed against a unilateral pricing model for a taxi-pooling platform developed by Wei [42], which maintains positive changes in passenger fluctuation.
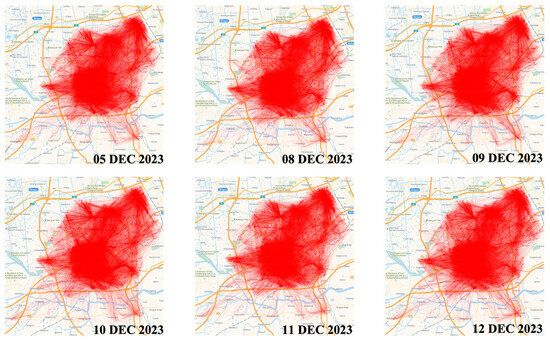
Figure 3.
Taxi-pooling orders in Songjiang District, Shanghai in December 2023.
To specifically investigate the impact of varying environmental parameters on ride-pooling platforms, this paper analyzes order data from 14 ride-hailing companies, including Didi, Xiangdao, Cao Cao Zhuanche, T3 Mobility, Bangge Jizi, Ark, Sunshine, Shenzhou, Tianmao, AA Zhuanche, Shouyue Automotive, Ctrip, Jiubai Yiyou, and Meituan, during the period from 7:00 to 20:00 on 5 December 2023. Using 1 h intervals, we compiled statistics on passenger flow, platform revenue, and other related data, as presented in Table 5. The data reveal that between 8:00 and 10:00, passenger flow is significantly higher than during other time periods, with revenue also surpassing that of other intervals.
Table 5.
Taxi demand data.
Furthermore, to explore the relationship between price trends and platform revenue under varying passenger flow conditions, we selected order data from 7:00 to 11:00 AM. Revenue was disaggregated to display earnings every 5 min, and we extracted the revenue from vehicles with two shared passengers from the overall earnings. To illustrate the impact of price fluctuations on revenue under different passenger flow levels, we organized the revenue within each hourly interval in ascending order of pricing. The relationship between revenue, pricing, and passenger traffic impact is shown in Figure 4. The blue line and blue peak chart represent the variable pricing and the corresponding platform revenue, while the green line and green peak chart illustrate the stable pricing and its associated platform revenue.
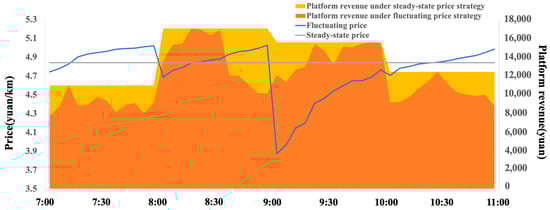
Figure 4.
Relationship between revenue, pricing, and passenger traffic impact.
As illustrated in Figure 4, since passenger volume is assumed to change once every hour, the platform revenue experiences abrupt shifts at the hour mark due to these fluctuations in demand. The relationship between platform revenue and pricing does not exhibit a simple linear correlation; that is, revenue does not necessarily increase with rising prices. Instead, the peak revenue points in the revenue surface plots for each time interval tend to align along a horizontal line, indicating that the maximum platform revenue occurs when the unit service distance pricing is approximately 4.8 yuan/km. In addition, the figure indicates that the revenue at each point under stable pricing exceeds that under variable pricing. This suggests that in the taxi-pooling model, a stable pricing strategy is essential for maximizing platform revenue amidst variations in passenger flow.
6. Sensitivity Analysis
To examine the impact of the scale of serviced taxi vehicles and the shared passenger service acceptance rate on taxi-pooling platform revenue, with the number of shared passengers fixed at two, both univariate impact analysis and sensitivity analysis were performed. These analyses aim to assist platform decision-makers in more accurately predicting potential risks and optimizing resource allocation.
6.1. Signal-Factor Analysis of the Impact of the Number of Taxi Vehicles and Service Acceptance Rate on Platform Revenue
The impact of the number of serviced taxi vehicles and the passenger service acceptance rate on taxi-pooling platform revenue is illustrated in Figure 5 and Figure 6, respectively. These figures reveal that both the number of serviced taxi vehicles and the passenger service acceptance rate λ exhibit a concave parabolic relationship with platform revenue, indicating a non-monotonic effect of these factors on revenue. Additionally, it is evident that as the number of serviced taxi vehicles increases, enhancing the passenger service acceptance rate λ contributes positively to maximizing platform revenue. This phenomenon is also reflected in the relationship between the number of serviced taxi vehicles and platform revenue.
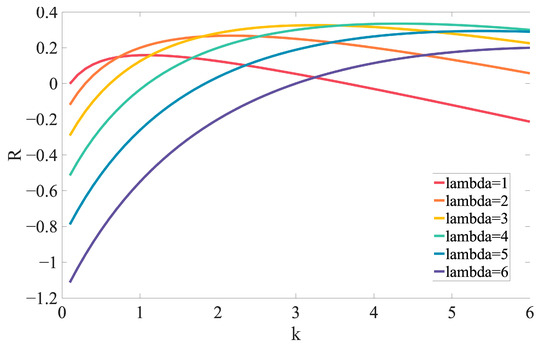
Figure 5.
Platform revenue R varies with the number of service vehicles k.
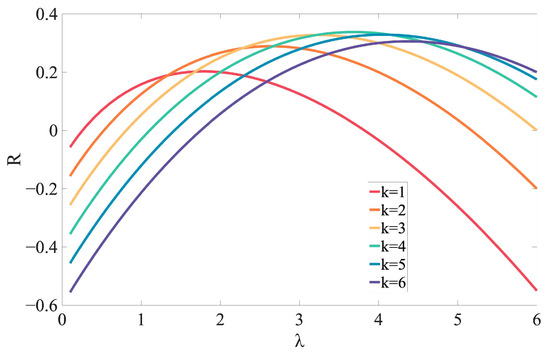
Figure 6.
Platform revenue R varies with service acceptance rate λ change.
From the observed phenomena, it can be concluded that while lower operating costs and higher service utilization rates of the serviced taxi vehicles are advantageous, reduced service responsiveness can lead to diminished platform revenue. Conversely, when the available service capacity exceeds passenger demand, reducing the number of serviced taxi vehicles—despite higher operating costs and lower service utilization—proves beneficial for the taxi-pooling platform.
6.2. Sensitivity Analysis of the Impact of the Number of Taxi Vehicles and Service Acceptance Rate on Platform Revenue
A sensitivity analysis was conducted to assist decision-makers in optimizing taxi-pooling service operations and investigate the influence of the number of serviced taxi vehicles and passenger service acceptance rate on platform revenue, as detailed in Table 6 and Table 7. To compare the impact of changes in the scale and quantity of service vehicles and service acceptance rates on platform revenue, the revenue change rate is calculated based on the intermediate quantity. An upward arrow indicates a growth trend relative to the platform revenue, while a downward arrow indicates a decline.
Table 6.
Impact of the number of serviced taxi vehicles on platform revenue.
Table 7.
Impact of passenger service acceptance rate on platform revenue.
In the context of the taxi-pooling service system, this article examines the impact of the number of serviced taxi vehicles and the passenger service acceptance rate on platform revenue, with the number of shared passengers fixed at two. It can be concluded that the relationship between these factors and platform revenue is nonlinear, exhibiting an initial increase followed by a subsequent decrease. Specifically, a moderate increase in the number of serviced taxi vehicles allows the platform to accommodate a greater number of passengers, thereby improving the passenger service acceptance rate. This is primarily because expanding the taxi fleet size enhances the transportation capacity, making it easier for passengers to find matching taxi-pooling services. During this phase, an increase in the number of serviced taxi vehicles enhances service efficiency and, consequently, platform revenue. However, as the number of taxi vehicles continues to rise, the positive impact on platform revenue diminishes. This occurs because an excessive fleet size relative to passenger demand results in idle vehicles, leading to resource inefficiencies. At this stage, further increases in the number of serviced taxi vehicles may negatively affect platform revenue.
Similarly, the impact of the passenger service acceptance rate on platform revenue exhibits a comparable trend. At lower service acceptance rates, increasing the service rate can significantly boost platform revenue by attracting more passengers to choose taxi-pooling services, thereby enhancing the platform’s revenue and market share. However, as the service acceptance rate approaches or reaches saturation, the incremental benefit of further increasing the acceptance rate on platform revenue diminishes.
Furthermore, the data indicate that the passenger service acceptance rate has a more pronounced impact on platform revenue. This suggests that, with other traffic conditions held constant, even minor adjustments in the service acceptance rate can lead to significant variations in platform revenue. In contrast, changes in the number of serviced taxi vehicles have a relatively modest effect on revenue. Consequently, the platform should prioritize enhancing the passenger service acceptance rate during operations to sustain higher revenue.
7. Conclusions
This paper models the taxi-pooling service as an independent operational process, introducing the M/M/1/m queuing model to analyze passenger waiting times and construct a bilateral pricing model. Through numerical analysis, the study explores the interdependencies among platform revenue, fleet size, shared passengers per vehicle, and passenger flow. The findings offer valuable insights into the sustainable development of taxi-pooling services and support informed strategic decision-making.
The study reveals that the effect of the number of shared passengers per vehicle on platform revenue is non-linear. While increasing shared passengers’ waiting times, it reduces operational costs and increases revenue. Therefore, platforms should adjust their strategy based on demand: reducing shared passengers during peak periods to minimize waiting times and maximize efficiency while increasing shared passengers during off-peak periods to lower costs and optimize revenue.
Additionally, the study finds that a steady-state strategy is optimal for taxi-pooling. As demand grows, platforms should expand their fleet to meet travel needs and maintain a stable pricing strategy to avoid deterring passengers.
For the case of two shared passengers per vehicle, explicit analytical expressions are provided for optimal revenue, waiting time, pricing, and fleet size. The key parameter, vehicle service utilization rate, depends only on passengers’ time costs and fixed vehicle costs.
The model incorporates simplifying assumptions, such as approximating the service process with an M/M/1/m model, though real-world deviations may occur. Future research will relax these assumptions to better capture operational complexities. Furthermore, exploring optimal strategies in mixed pooling and non-pooling scenarios could provide a more comprehensive reflection of real-world dynamics.
Author Contributions
Conceptualization, Y.H.; methodology, C.W. and Y.H.; software, C.W. and J.W.; validation, C.W., J.W. and Y.Z.; formal analysis, C.W., J.W. and Y.H.; investigation, C.W.; data curation, C.W.; writing—original draft preparation, C.W., J.W. and Y.Z.; writing—review and editing, J.O.M. and Y.H.; visualization, C.W., J.W., Y.Z. and J.O.M.; supervision, Y.H. All authors have read and agreed to the published version of the manuscript.
Funding
This research received no funding.
Data Availability Statement
The original contributions presented in the study are included in the article, further inquiries can be directed to the corresponding author/s.
Conflicts of Interest
The authors declare no conflicts of interest.
References
- Wang, Y.; Zheng, B.; Lim, E.-P. Understanding the effects of taxi ride-sharing—A case study of Singapore. Comput. Environ. Urban Syst. 2018, 69, 124–132. [Google Scholar] [CrossRef]
- Barann, B.; Beverungen, D.; Muller, O. An open-data approach for quantifying the potential of taxi ridesharing. Decis. Support Syst. 2017, 99, 86–95. [Google Scholar] [CrossRef]
- Jiang, B.; Tian, L. Collaborative Consumption: Strategic and Economic Implications of Product Sharing. Manag. Sci. 2018, 64, 1171–1188. [Google Scholar] [CrossRef]
- Benjaafar, S.; Kong, G.; Li, X.; Courcoubetis, C. Peer-to-Peer Product Sharing: Implications for Ownership, Usage, and Social Welfare in the Sharing Economy. Manag. Sci. 2019, 65, 477–493. [Google Scholar] [CrossRef]
- Furuhata, M.; Dessouky, M.; Ordonez, F.; Brunet, M.-E.; Wang, X.; Koenig, S. Ridesharing: The state-of-the-art and future directions. Transp. Res. Part B-Methodol. 2013, 57, 28–46. [Google Scholar] [CrossRef]
- Huang, K.; Liu, F.; Hu, Y.; Liu, Z. An Analysis of the Taxi-Sharing Organizing and Pricing. In Proceedings of the 7th International Conference on Green Intelligent Transportation System and Safety (GITSS), Nanjing, China, 19–21 November 2018; pp. 263–276. [Google Scholar]
- Zhong, J.; Zhou, H.; Lin, Y.; Ren, F. The impact of ride-hailing services on the use of traditional taxis: Evidence from Chinese urban panel data. IET Intell. Transp. Syst. 2022, 16, 1611–1622. [Google Scholar] [CrossRef]
- Kim, K.; Baek, C.; Lee, J.-D. Creative destruction of the sharing economy in action: The case of Uber. Transp. Res. Part A-Policy Pract. 2018, 110, 118–127. [Google Scholar] [CrossRef]
- Nie, Y. How can the taxi industry survive the tide of ridesourcing? Evidence from Shenzhen, China. Transp. Res. Part C-Emerg. Technol. 2017, 79, 242–256. [Google Scholar] [CrossRef]
- Cramer, J.; Krueger, A.B. Disruptive Change in the Taxi Business: The Case of Uber. Am. Econ. Rev. 2016, 106, 177–182. [Google Scholar] [CrossRef]
- d’Orey, P.M.; Ferreira, M. Can ride-sharing become attractive? A case study of taxi-sharing employing a simulation modelling approach. IET Intell. Transp. Syst. 2015, 9, 210–220. [Google Scholar] [CrossRef]
- Wallsten, S. The Competitive Effects of the Sharing Economy: How is Uber Changing Taxis; The Technology Policy Institute: Washington, DC, USA, 2015. [Google Scholar]
- Berger, T.; Chen, C.; Frey, C.B. Drivers of disruption? Estimating the Uber effect. Eur. Econ. Rev. 2018, 110, 197–210. [Google Scholar] [CrossRef]
- Contreras, S.D.; Paz, A. The effects of ride-hailing companies on the taxicab industry in Las Vegas, Nevada. Transp. Res. Part A-Policy Pract. 2018, 115, 63–70. [Google Scholar] [CrossRef]
- Sun, Z.; Yu, M.; Zeng, J.; Wang, H.; Tian, Y. Assessment of the Impacts of App-based Ride Service on Taxi Industry: Evidence from Yiwu City in China. In Proceedings of the Compendium of Papers of Transportation Research Board 96th Annual Meeting, Washington, DC, USA, 8–12 January 2017. [Google Scholar]
- Zhang, W.; Le, T.V.; Ukkusuri, S.V.; Li, R. Influencing factors and heterogeneity in ridership of traditional and app-based taxi systems. Transportation 2020, 47, 971–996. [Google Scholar] [CrossRef]
- Zhang, W.; Ukkusuri, S.V.; Lu, J.J. Impacts of urban built environment on empty taxi trips using limited geolocation data. Transportation 2017, 44, 1445–1473. [Google Scholar] [CrossRef]
- Zhang, W.; Kumar, D.; Ukkusuri, S.V. Exploring the Dynamics of Surge Pricing in Mobility-on-Demand Taxi Services. In Proceedings of the IEEE International Conference on Big Data (IEEE Big Data), Boston, MA, USA, 11–14 December 2017; pp. 1375–1380. [Google Scholar]
- Tafreshian, A.; Masoud, N.; Yin, Y. Frontiers in Service Science: Ride Matching for Peer-to-Peer Ride Sharing: A Review and Future Directions. Serv. Sci. 2020, 12, 44–60. [Google Scholar] [CrossRef]
- Ma, S.; Zheng, Y.; Wolfson, O. T-Share: A Large-Scale Dynamic Taxi Ridesharing Service. In Proceedings of the 29th IEEE International Conference on Data Engineering (ICDE), Brisbane, Australia, 8–12 April 2013; pp. 410–421. [Google Scholar]
- Hosni, H.; Naoum-Sawaya, J.; Artail, H. The shared-taxi problem: Formulation and solution methods. Transp. Res. Part B-Methodol. 2014, 70, 303–318. [Google Scholar] [CrossRef]
- Jung, J.; Jayakrishnan, R.; Park, J.Y. Dynamic Shared-Taxi Dispatch Algorithm with Hybrid-Simulated Annealing. Comput.-Aided Civ. Infrastruct. Eng. 2016, 31, 275–291. [Google Scholar] [CrossRef]
- Alonso-Mora, J.; Samaranayake, S.; Wallar, A.; Frazzoli, E.; Rus, D. On-demand high-capacity ride-sharing via dynamic trip-vehicle assignment (vol 114, pg 462, 2017). Proc. Natl. Acad. Sci. USA 2018, 115, E555. [Google Scholar] [CrossRef]
- Nanry, W.P.; Barnes, J.W. Solving the pickup and delivery problem with time windows using reactive tabu search. Transp. Res. Part B-Methodol. 2000, 34, 107–121. [Google Scholar] [CrossRef]
- Cordeau, J.F.; Laporte, G. A tabu search heuristic for the static multi-vehicle dial-a-ride problem. Transp. Res. Part B-Methodol. 2003, 37, 579–594. [Google Scholar] [CrossRef]
- Hong, Z.; Chen, Y.; Mahmassani, H.S.; Xu, S. Commuter ride-sharing using topology-based vehicle trajectory clustering: Methodology, application and impact evaluation. Transp. Res. Part C-Emerg. Technol. 2017, 85, 573–590. [Google Scholar] [CrossRef]
- Qian, X.; Zhang, W.; Ukkusuri, S.V.; Yang, C. Optimal assignment and incentive design in the taxi group ride problem. Transp. Res. Part B-Methodol. 2017, 103, 208–226. [Google Scholar] [CrossRef]
- Ding, H.; Li, J.; Zheng, N.; Zheng, X.; Huang, W.; Bai, H. Dynamic dispatch of connected taxis for large-scale urban road networks with stochastic demands: An MFD-enabled hierarchical and cooperative approach. Transp. Res. Part C-Emerg. Technol. 2022, 142, 103792. [Google Scholar] [CrossRef]
- Hyland, M.; Mahmassani, H.S. Dynamic autonomous vehicle fleet operations: Optimization-based strategies to assign AVs to immediate traveler demand requests. Transp. Res. Part C-Emerg. Technol. 2018, 92, 278–297. [Google Scholar] [CrossRef]
- Zeng, W.; Wu, M.; Chen, P.; Cao, Z.; Xie, S. Review of shared online hailing and autonomous taxi services. Transp. B-Transp. Dyn. 2023, 11, 486–509. [Google Scholar] [CrossRef]
- Jacob, J.; Roet-Green, R. Ride solo or pool: Designing price-service menus for a ride-sharing platform. Eur. J. Oper. Res. 2021, 295, 1008–1024. [Google Scholar] [CrossRef]
- Zhang, C.; Xie, J.; Wu, F.; Gao, X.; Chen, G. Pricing and allocation algorithm designs in dynamic ridesharing system. Theor. Comput. Sci. 2020, 803, 94–104. [Google Scholar] [CrossRef]
- Sayarshad, H.R.; Chow, J.Y.J. A scalable non-myopic dynamic dial-a-ride and pricing problem. Transp. Res. Part B-Methodol. 2015, 81, 539–554. [Google Scholar] [CrossRef]
- Wang, X.; He, F.; Yang, H.; Gao, H.O. Pricing strategies for a taxi-hailing platform. Transp. Res. Part E-Logist. Transp. Rev. 2016, 93, 212–231. [Google Scholar] [CrossRef]
- Wolfson, O.; Lin, J. Fairness versus Optimality in Ridesharing. In Proceedings of the 18th IEEE International Conference on Mobile Data Management (MDM), Daejeon, Republic of Korea, 29 May–1 June 2017; pp. 118–123. [Google Scholar]
- He, F.; Wang, X.; Lin, X.; Tang, X. Pricing and penalty/compensation strategies of a taxi-hailing platform. Transp. Res. Part C-Emerg. Technol. 2018, 86, 263–279. [Google Scholar] [CrossRef]
- Yan, C.; Zhu, H.; Korolko, N.; Woodard, D. Dynamic pricing and matching in ride-hailing platforms. Nav. Res. Logist. 2020, 67, 705–724. [Google Scholar] [CrossRef]
- Ke, J.; Yang, H.; Li, X.; Wang, H.; Ye, J. Pricing and equilibrium in on-demand ride-pooling markets. Transp. Res. Part B-Methodol. 2020, 139, 411–431. [Google Scholar] [CrossRef]
- Nourinejad, M.; Ramezani, M. Ride-Sourcing modeling and pricing in non-equilibrium two-sided markets. Transp. Res. Part B-Methodol. 2020, 132, 340–357. [Google Scholar] [CrossRef]
- Taha, H.A. Operations Research: An Introduction, 11th ed.; Pearson: New York, NY, USA, 2022. [Google Scholar]
- Bai, J.; So, K.C.; Tang, C.S.; Chen, X.; Wang, H. Coordinating supply and demand on an on-demand service platform with impatient customers. Manuf. Serv. Oper. Manag. 2019, 21, 556–570. [Google Scholar] [CrossRef]
- Wei, Q.; Rodriguez, J.A.; Pedarsani, R.; Coogan, S. Ride-sharing networks with mixed autonomy. In Proceedings of the 2019 American Control Conference (ACC), Philadelphia, PA, USA, 10–12 July 2019; pp. 3303–3308. [Google Scholar]
Disclaimer/Publisher’s Note: The statements, opinions and data contained in all publications are solely those of the individual author(s) and contributor(s) and not of MDPI and/or the editor(s). MDPI and/or the editor(s) disclaim responsibility for any injury to people or property resulting from any ideas, methods, instructions or products referred to in the content. |
© 2024 by the authors. Licensee MDPI, Basel, Switzerland. This article is an open access article distributed under the terms and conditions of the Creative Commons Attribution (CC BY) license (https://creativecommons.org/licenses/by/4.0/).