1. Introduction
Cognitive impairment refers to a condition in which intellectual functions, such as memory, language, and judgment, are diminished while the individual remains fully conscious [
1]. The severity of cognitive impairment can range from mild to severe, with severe cases potentially leading to memory loss and the progression of dementia. Mild cognitive impairment (MCI) is an intermediate stage between normal cognition (NC) and dementia (DE), where it is not severe enough to affect daily activities but is an early sign that may eventually lead to dementia [
2]. The progression rate from MCI to dementia is significantly higher than that in the general population, with 5–10% of patients with MCI deteriorating into dementia annually within a short period of time [
3]. Not everyone diagnosed with MCI will progress to dementia, so early medication or rehabilitation can slow cognitive deterioration or restore function to normal [
4]. Therefore, the early identification of cognitive impairment can contribute to socioeconomic cost savings by preventing dementia. However, it is difficult to distinguish between cognitive decline due to normal aging and MCI because there are no clear criteria for comparing them.
Accordingly, patient-data-driven research has been actively conducted to identify cognitive impairment by efficiently utilizing accumulated patient medical data. For example, studies have been conducted to detect cognitive decline and monitor patient conditions using neuroimaging, speech, and language data. An algorithm was developed to classify patients with cognitive impairment by applying computer-based signal processing and pattern recognition techniques to electroencephalography (EEG) data [
5]. Additionally, machine learning algorithms have been applied to acoustic parameters extracted from the recorded speech signals to distinguish between cognitively impaired patients and healthy individuals [
6]. Despite their contribution to identifying cognitive impairment, patient-data-driven approaches are limited in obtaining continuous data and may utilize incomplete data if patients refuse to participate [
7,
8].
To address these issues, an approach based on lifelog data that enables the collection of real-time information through sensors installed in everyday life was proposed. Lee, Kang [
9] trained an artificial neural network (ANN) from sleep and activity data collected from wristbands worn by participants to classify normal individuals and MCI patients. Minamisawa, Okada [
10] analyzed the impact of daily activity patterns on dementia by collecting activity data using multiple sensors installed in residential environments. Kim, Jang [
11] applied lifelog data collected from patients living in nursing homes to a multilayer perceptron (MLP) to detect abnormal behaviors in patients with dementia. Approaches that utilize lifelog data have the advantage of collecting large amounts of data in real-time, which makes it better to train a classification model. Additionally, the regular updating of lifelog data facilitates the maintenance of predictive models’ effectiveness [
12].
Although various studies have demonstrated the feasibility of identifying cognitive impairment through the analysis of patient data, several limitations remain. First, studies that utilize lifelog data have not fully leveraged the time-varying nature of continuous data. The temporal sequence of events or daily functions in everyday life can serve as a biomarker for diagnosing conditions that precede dementia [
13,
14]. However, previous studies have only utilized data from a single time point, despite the potential of real-time lifelog data to facilitate the analysis of changes in daily life over time. Therefore, this study aims to utilize the time-series characteristics of data as input variables to detect early signs of cognitive decline and improve the validity of cognitive impairment identification. Second, most data-driven studies have only focused on presenting learning outcomes and enhancing the performance of classification models; however, they have often lacked an interpretation for these results or identification of the primary factors influencing cognitive impairment. In various fields, identifying key variables in complex systems is critical for understanding underlying mechanisms. For instance, Lloret-Climent and Nescolarde-Selva [
15] applied such an approach in the analysis of tourist networks to uncover key factors influencing system behavior. The black-box nature of machine learning techniques complicates the traceability of the model’s predictive process, making them unsuitable for direct application in the actual diagnostic process in medicine. Therefore, it is essential not only to identify cognitive impairment but also to provide evidence for changes in behavioral patterns as cognitive function declines. To achieve this, it is crucial to analyze the primary factors influencing cognitive impairment using interpretable artificial intelligence (AI) algorithms, thereby enhancing the reliability of the prediction results.
To address the limitations of previous studies, this study aims to develop a long short-term memory (LSTM) model for learning from sleep lifelog data collected using wearable devices. LSTM models are particularly suitable for this type of data because they effectively capture temporal dependencies, making them ideal for identifying gradual changes in cognitive function. Given that cognitive impairment manifests gradually, the time-series nature of this lifelog data provides critical insights into daily patterns that cannot be captured by single point observations. Our approach seeks to exploit this continuity by reconstructing lifelog data into time series sequences, which allows the model to learn from behavioral trends over time. Furthermore, we examined the association between 32 sleep factors and cognitive impairment using the Shapley additive explanations (SHAP), an interpretable AI algorithm. This step is particularly important for providing insights into the most influential sleep factors, linking the study results to clinically significant outcomes. This study was conducted in three phases: (1) First, we collected sleep lifelog data from public institutions to construct a database of patients with cognitive impairment and converted the daily data into a time series dataset. (2) Next, we designed a classification model to identify cognitive impairment using sleep factors extracted from the lifelog data. (3) Finally, we identified the sleep factors influencing cognitive decline and interpreted the predicted results. This approach not only allows for the early identification of cognitive impairment but also provides interpretable evidence to support the model’s predictions, facilitating potential clinical application.
The contributions of this study are as follows: First, this study utilizes a dataset comprising sequences of three, four, and five consecutive days rather than isolated time points. By capturing longitudinal patterns in subjects’ daily lives, this approach allows for a more comprehensive analysis of behavioral changes over time. This approach enables the learning of patterns in subjects’ daily lives over time, minimizing reliance on fragmentary judgments and thereby enhancing the effectiveness of cognitive impairment identification compared with previous studies. This innovation in data handling significantly minimizes the reliance on fragmentary judgments and enhances the model’s robustness. Second, this study identifies the indicators that influence cognitive decline and offers empirical evidence for their significance. By leveraging interpretable AI methods, such as SHAP, we provide insights into how specific sleep-related factors contribute to cognitive impairment. Consequently, biomarkers of cognitive impairment can be used to interpret the experimental results and provide medical insights into the relationship between sleep and cognitive impairment. Third, from a practical standpoint, this study supports expert decision-making by rapidly predicting the presence or absence of cognitive impairment using easily accessible lifelog data, thereby reducing the time and cost associated with cognitive impairment diagnosis. The model enables rapid, non-invasive predictions, significantly reducing the time and cost associated with traditional cognitive impairment diagnosis methods, thereby supporting more efficient decision-making processes for healthcare professionals.
The remainder of this paper is organized as follows:
Section 2 reviews background research relevant to this study.
Section 3 details the research methodology and processes.
Section 4 presents the results of the empirical study, and
Section 5 concludes the paper and discusses future study directions.
2. Data-Driven Cognitive Impairment Analysis
While cognitive decline in older adults due to aging is considered normal, MCI can lead to a significant reduction in cognitive abilities, including memory loss, disorientation, and impaired visuospatial function. MCI can rapidly progress to severe dementia, ultimately rendering independent living impossible. Therefore, the early identification and prevention of cognitive impairment is crucial. However, the early detection of cognitive impairment is challenging because of the difficulty in distinguishing MCI from cognitive decline associated with normal aging, which often results in MCI being overlooked. In recent years, MCI has been systematically managed at the national level, and academic efforts to predict and analyze the presence of cognitive impairment have been increasing [
16].
Since the development of the mental status questionnaire in 1960 [
17], numerous screening tools have been continuously created to assess cognitive status and diagnose psychiatric disorders. The mini-mental state examination (MMSE) is the most widely used tool for assessing cognitive function [
18], capable of measuring cognitive impairment and detecting dementia within a short period of time. The Korean mini-mental state examination (K-MMSE), an adaptation of the MMSE for Korean individuals, is commonly used in Korea [
19]. However, these screening tools may be inadequate for identifying the early symptoms of cognitive impairment owing to their low sensitivity and specificity for milder symptoms. Additionally, these tools can only diagnose a patient’s current condition without addressing issues related to daily behavior. Consequently, predictive methods based on data accumulated directly from patients are needed to identify cognitive impairment more effectively.
Neuroimaging modalities, such as computed tomography, magnetic resonance imaging, and EEG, are increasingly utilized for the clinical diagnosis of cognitive impairment. Among these, EEG offers the distinct advantage of real-time measurements, facilitating studies aimed at diagnosing cognitive impairment through the analysis of EEG signal patterns. Baker and Akrofi [
5] leveraged computer-based signal processing and pattern recognition techniques on EEG data to classify patients with Alzheimer’s disease (AD) and controls and further predict the progression of MCI to AD. In addition to EEG, extensive research has focused on predicting cognitive impairment by analyzing various types of patient data, including voice, language, and facial expressions. Jarrold and Peintner [
20] gathered voice sample data from healthy controls and patients with four dementia subtypes, extracting acoustic features and linguistic text to differentiate between the subtypes. Yu and Quatieri [
21] used speech features derived from remotely collected speech data to predict cognitive impairment. Key factors such as pseudo-syllable rate, pitch variation, and articulation adjustments based on formant correlation measures were used to validate the predictive accuracy of clinical assessments of cognitive impairment. Although patient medical data can effectively identify cognitive impairment, the methods mentioned in previous studies are limited in that they are not suitable for the continuous data collection necessary for learning prediction models without burdening older adults [
7,
8].
The close relationship among cognitive impairment, daily physical activity, and sleep has been extensively studied [
22]. Recent advances in sensor technology and wearable devices have enabled the collection of various lifelog data, such as activity and sleep information, facilitating studies aimed at predicting cognitive impairment using these data. Specifically, Lee and Kang [
9] presented a model to classify individuals as normal or having MCI by training an ANN for the early identification of cognitive impairment. They extracted key behavioral factors from activity and sleep data collected from wristbands worn by subjects and trained ANN to distinguish patients with MCI from healthy controls. Minamisawa and Okada [
10] used a variety of lifelog data collected from patients in a nursing home to detect abnormal behaviors in patients with dementia. They analyzed the impact of daily activities and sleep patterns on dementia detection using data from doors, motion, location, and sleep sensors. Kim and Jang [
11] developed a machine learning-based framework for detecting abnormal behavior in patients with dementia using lifelog data. They trained an MLP using patient behavioral data collected using low-cost sensors, providing a cost-effective solution that can be widely implemented in many nursing homes.
Table 1 lists previous studies that analyzed cognitive impairment using medical and lifelog data collected from patients.
The utilization of lifelog data collected through wearable devices offers a substantial advancement over traditional methods in several key respects. First, wearable devices, such as wristbands and rings, facilitate continuous and long-term data collection in real-world environments, providing a more comprehensive view of an individual’s daily behavior and sleep patterns. This non-invasive nature of wearable devices reduces the burden on elderly patients and increases compliance, as the devices can collect data passively without requiring active participation from patients. Furthermore, wearable devices are suitable for prolonged monitoring, capturing subtle changes in behavior or sleep over time that may be missed in short-term clinical assessments. This continuous data collection is vital for tracking the gradual progression of cognitive impairment and provides more consistent insights compared with the episodic data gathered in clinical settings.
The studies listed in
Table 1 employed various types of data collected from patients to identify cognitive impairment. However, their primary focus on model training and enhancing performance often obscures the understanding of how patient behavior influences cognitive impairment. To address this issue, it is essential to identify the key factors associated with cognitive impairment and provide a rationale for predictions. Consequently, this study utilized SHAP, an interpretable AI algorithm, to identify critical factors and elucidate the internal mechanisms of the prediction model. Additionally, the temporal sequence of daily functions can serve as a biomarker for identifying cognitive impairment in the context of diagnosing pre-dementia conditions, necessitating consideration of how temporal data change over time. Hence, this study utilizes the temporal characteristics of sleep states and biological signals collected via wearable devices as input variables for the prediction model. We developed LSTM models to identify cognitive impairment and demonstrated how the input features contribute to the prediction through SHAP analysis.
4. Experimental Results
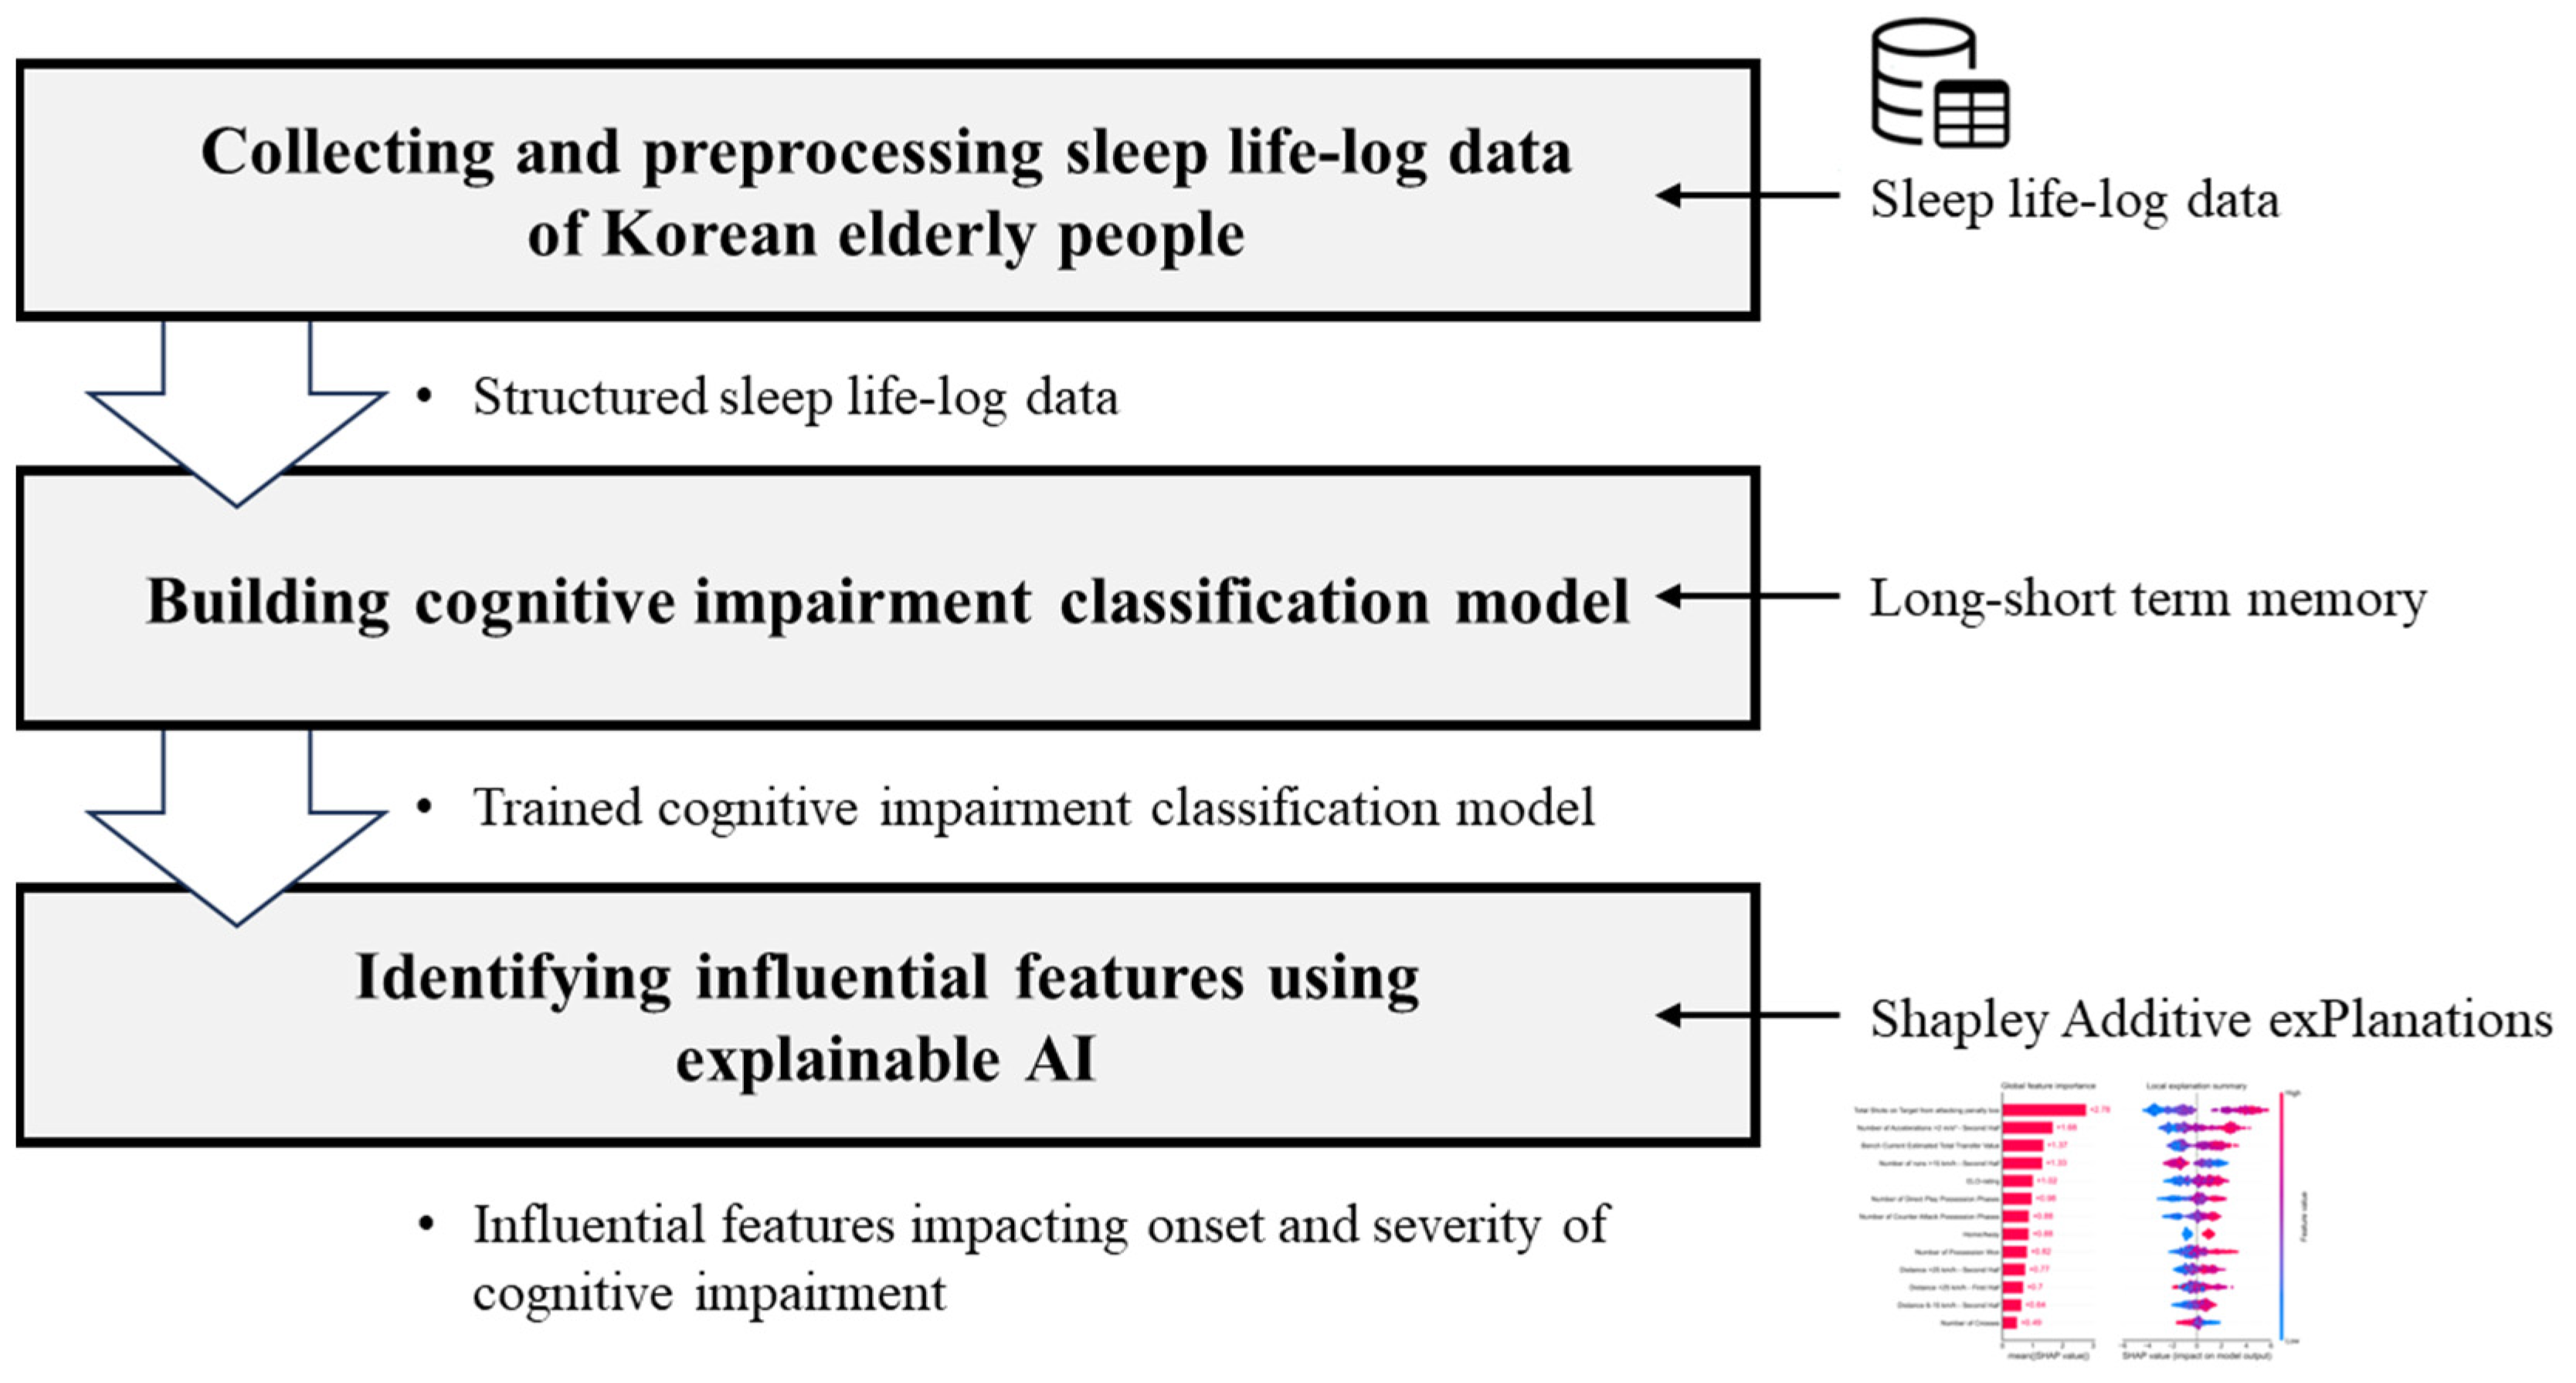
Following the methodology outlined in the previous chapter, a three-step experimental procedure was implemented, as depicted in
Figure 3. First, sleep lifelog data were collected from both healthy individuals and patients, from which sleep metrics were extracted. The data were preprocessed into sequences suitable for model training. Subsequently, LSTM models were developed to predict the presence of cognitive impairment. Finally, an interpretable AI algorithm was applied to identify sleep factors that influence cognitive impairment.
4.1. Data
This study employed the “Wearable Lifelog of Dementia High Risk Group” dataset, provided by AI-Hub (
https://aihub.or.kr/) under the Korea Agency for Intelligence and Information Society. The dataset comprised sleep lifelog data from 300 individuals aged 55 years and older who wore ring-shaped wearable devices. This cohort included healthy individuals as well as patients diagnosed with MCI and dementia, selected based on comprehensive specialist diagnoses. Each entry in the dataset represents a single subject’s sleep data for one day, encompassing sleep information and the corresponding diagnostic labels, as outlined in
Table 2. The dataset includes sleep lifelog information collected over periods ranging from 35 to 122 days, capturing sleep patterns such as duration, blood pressure, heart rate, and breathing. The dataset we received was already cleaned, with all missing data or outliers handled in-house. Consequently, no additional data cleaning was required for data quality control in this study. In total, 12,183 lifelog records from 174 subjects were analyzed in this study, and the final dataset statistics are summarized in
Table 3. A variety of sleep features with potential implications for cognitive impairment was defined, and the final set of sleep features used for model training is presented in
Table 4.
Cognitive impairment is often associated with sleep disturbances, manifesting as day–night reversals, difficulty initiating sleep, and frequent nocturnal awakenings [
29,
30]. Conversely, alterations in sleep patterns can also contribute to cognitive decline, with key physiological parameters indicative of sleep quality including respiratory rate, heart rate, and body movement [
31]. Based on these considerations, 32 sleep factors were selected for model training. As presented in
Table 4, sleep factors were divided into two primary categories. Sleep quality features are indicators that indirectly represent a subject’s sleep experience and include attributes such as sleep efficiency, sleep duration, and sleep latency. Statistical features consist of metrics such as one-minute averages, maximum values, and minimum values for factors such as respiration rate and heart rate. For example, the features ‘start’ and ‘end’ refer to indicators that denote the initiation and cessation of sleep within defined time intervals. Detailed descriptions and respective formats of each feature are presented in
Table A1.
The target variable for diagnostic labeling was redefined into two categories: normal functioning (NC) and cognitively impaired (MCI, DE). To effectively capture sleep patterns from the lifelog data, the dataset was reorganized into a time-series format over a specified number of days. In this study, training sets were constructed by grouping continuous data into sequences of three, four, and five days for each subject.
4.2. Cognitive Impairment Prediction
The constructed training set was used to train the LSTM model. This study utilized all 12,183 data points collected from 174 subjects and transformed them into time-series data with sequences of three, four, and five days to train the LSTM model. To ensure a rigorous evaluation of the model, test data were constructed by isolating the final week of data from each subject within the entire dataset, whereas the remaining data were used for model training. To address class imbalance due to the larger proportion of the normal functioning group compared with the cognitively impaired group, we performed simple undersampling to balance the data distribution across classes in the training set. We employed a grid search to determine the optimal hyperparameters for each model based on the length of the time-series data. During the grid search process, we explored various combinations of LSTM units (64, 128, and 256), dense layer units (32, 64, and 128), and learning rates (0.001 to 0.01) to fine-tune the architecture. The final model comprised an LSTM layer with 128 units, followed by a dense layer with 64 units, and a final dense output layer for binary classification. The Adam optimizer with a learning rate of 0.001 was used to achieve optimal performance, given its adaptability in time-series prediction tasks. The selected hyperparameters provided the best balance between accuracy and validation loss. Additionally, we constructed support vector machine (SVM), logistic regression (LR), random forest (RF), and XGBoost models, which do not reflect time-series characteristics, to objectively compare the performance of the LSTM models presented in this study. We employed H
2O, a Python (H
2O version 3.46.0.1) AutoML library, to determine the optimal hyperparameters for each model based on the length of the time-series data. The final performances of all the trained models are summarized in
Table 5.
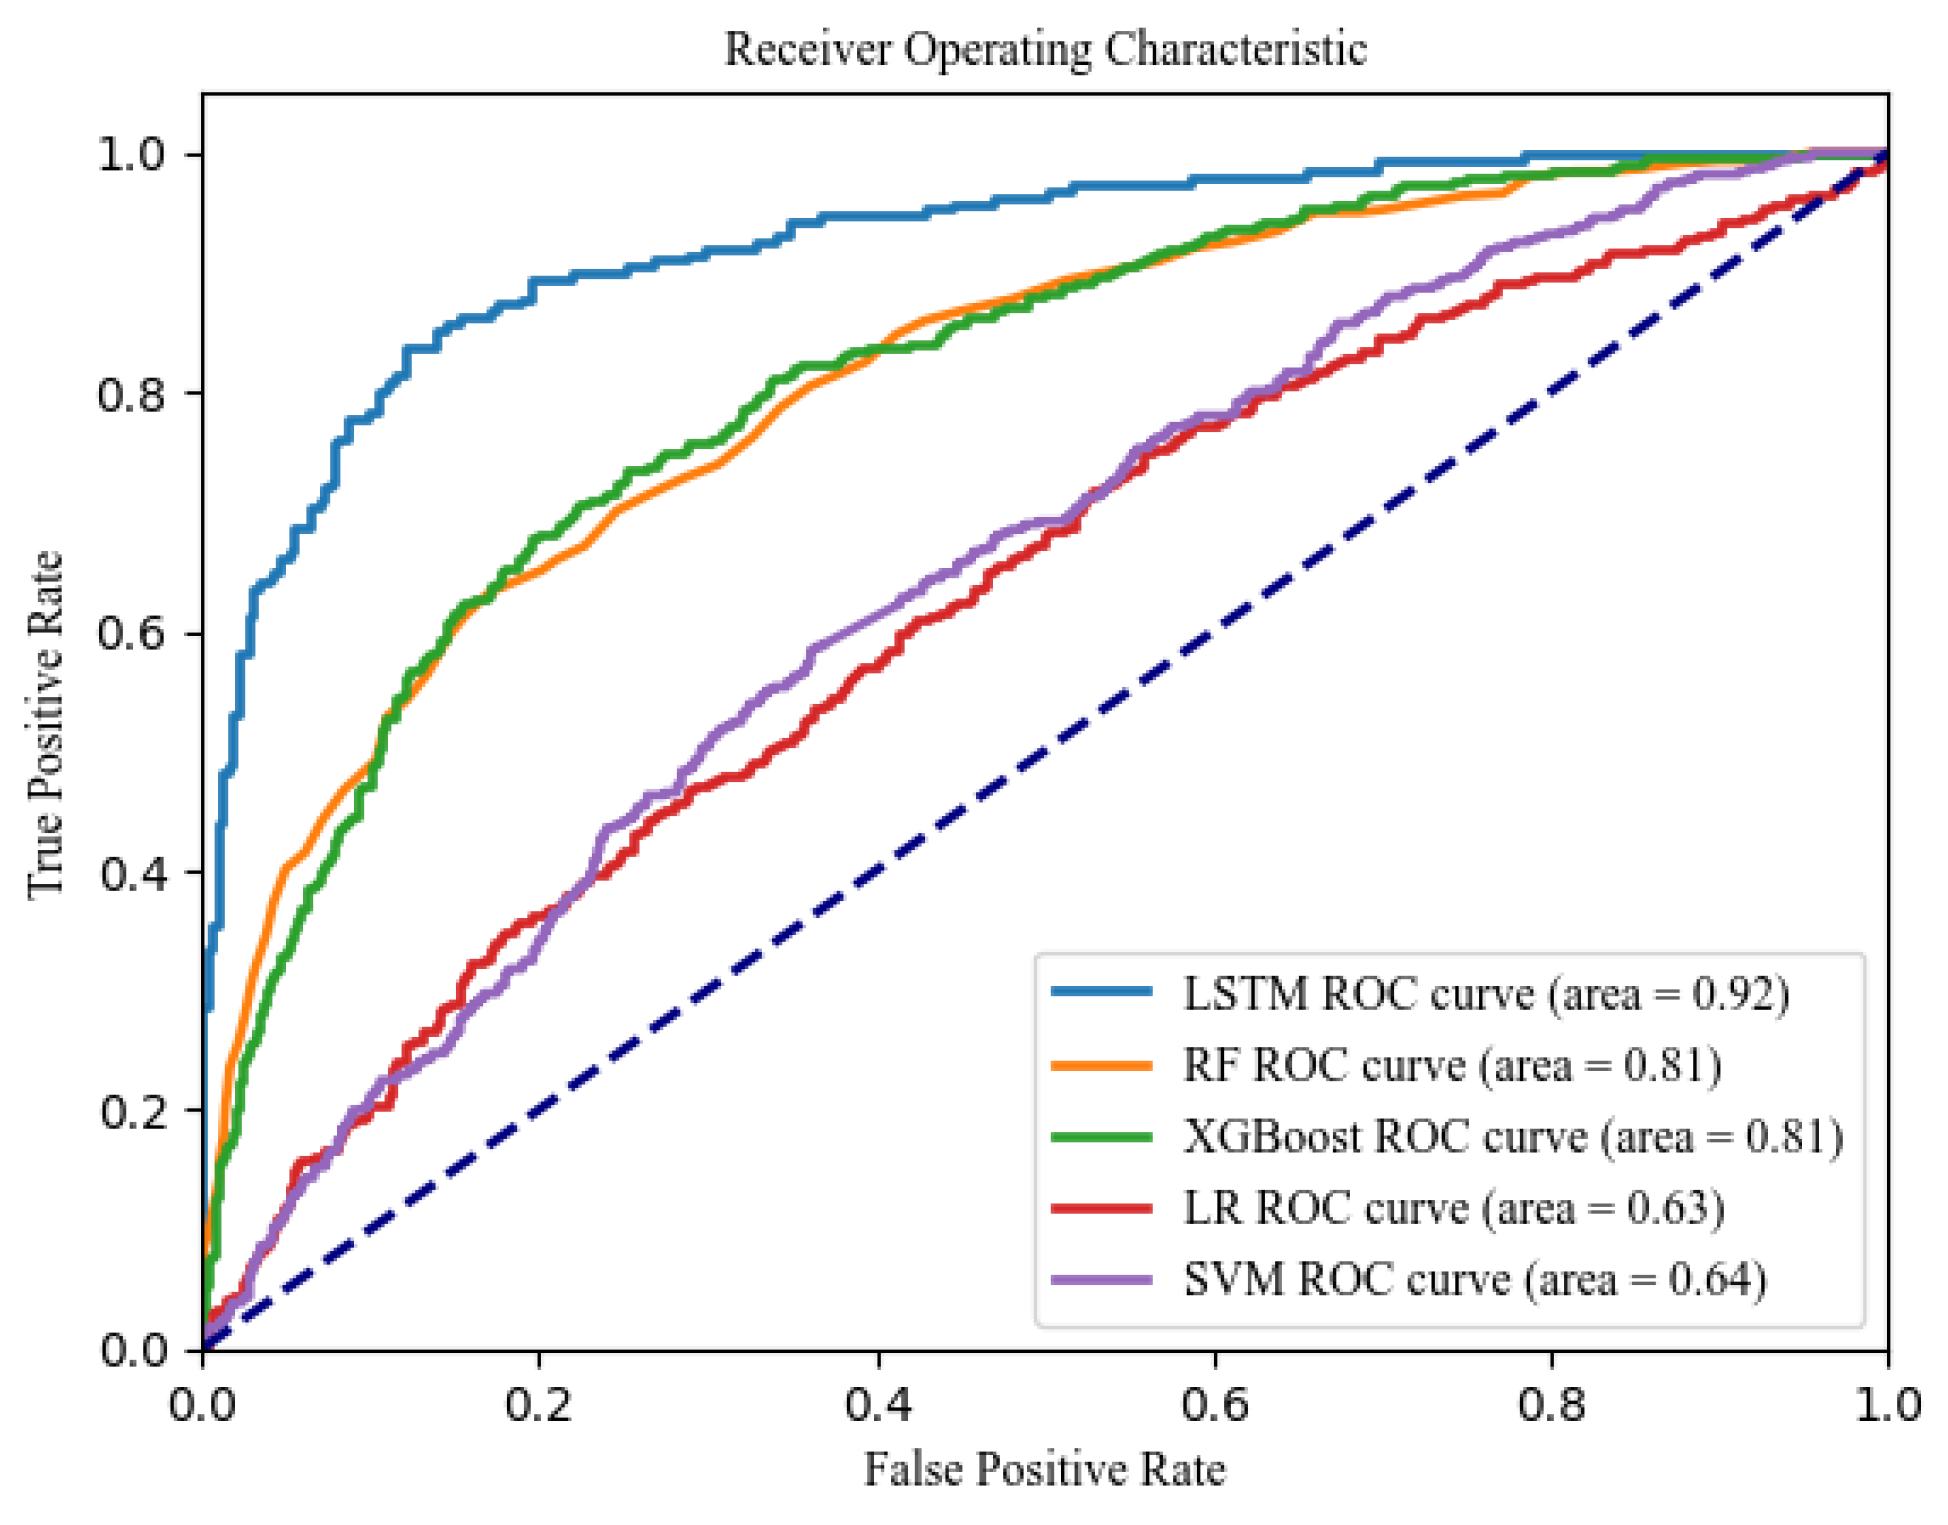
In this study, model performance was evaluated based on sensitivity, specificity, and F1-score. When these values were comparable, we further compared models based on AUC. Sensitivity represents the model’s ability to correctly identify patients with cognitive impairment, while specificity reflects its accuracy in classifying healthy individuals. Overall, the LSTM models demonstrated superior performance compared with other machine learning models. Specifically, the LSTM model trained on the five-day sequence data achieved the highest performance, with a sensitivity of 0.89, a specificity of 0.80, and an AUC of 0.92. Additionally, it achieved an accuracy of 0.85 and an F1-score of 0.85, which are relatively high. As depicted in
Figure 4, the ROC curve for the LSTM model is positioned in the upper left corner, reflecting the largest AUC relative to the other models, thus indicating its superior predictive capability for cognitive impairment.
In
Table 6, the “real value” represents whether the subjects actually have cognitive impairment, while the “predicted value” denotes the outcomes generated by the model, where 0 indicates a normal state without cognitive impairment and 1 signifies the presence of cognitive impairment. The “prediction score” refers to the model’s output value, with the LSTM model employed in this study utilizing a threshold of 0.5. Prediction scores exceeding 0.5 are classified as indicative of the cognitively impaired group, whereas prediction scores below 0.5 are categorized as the normal functioning group.
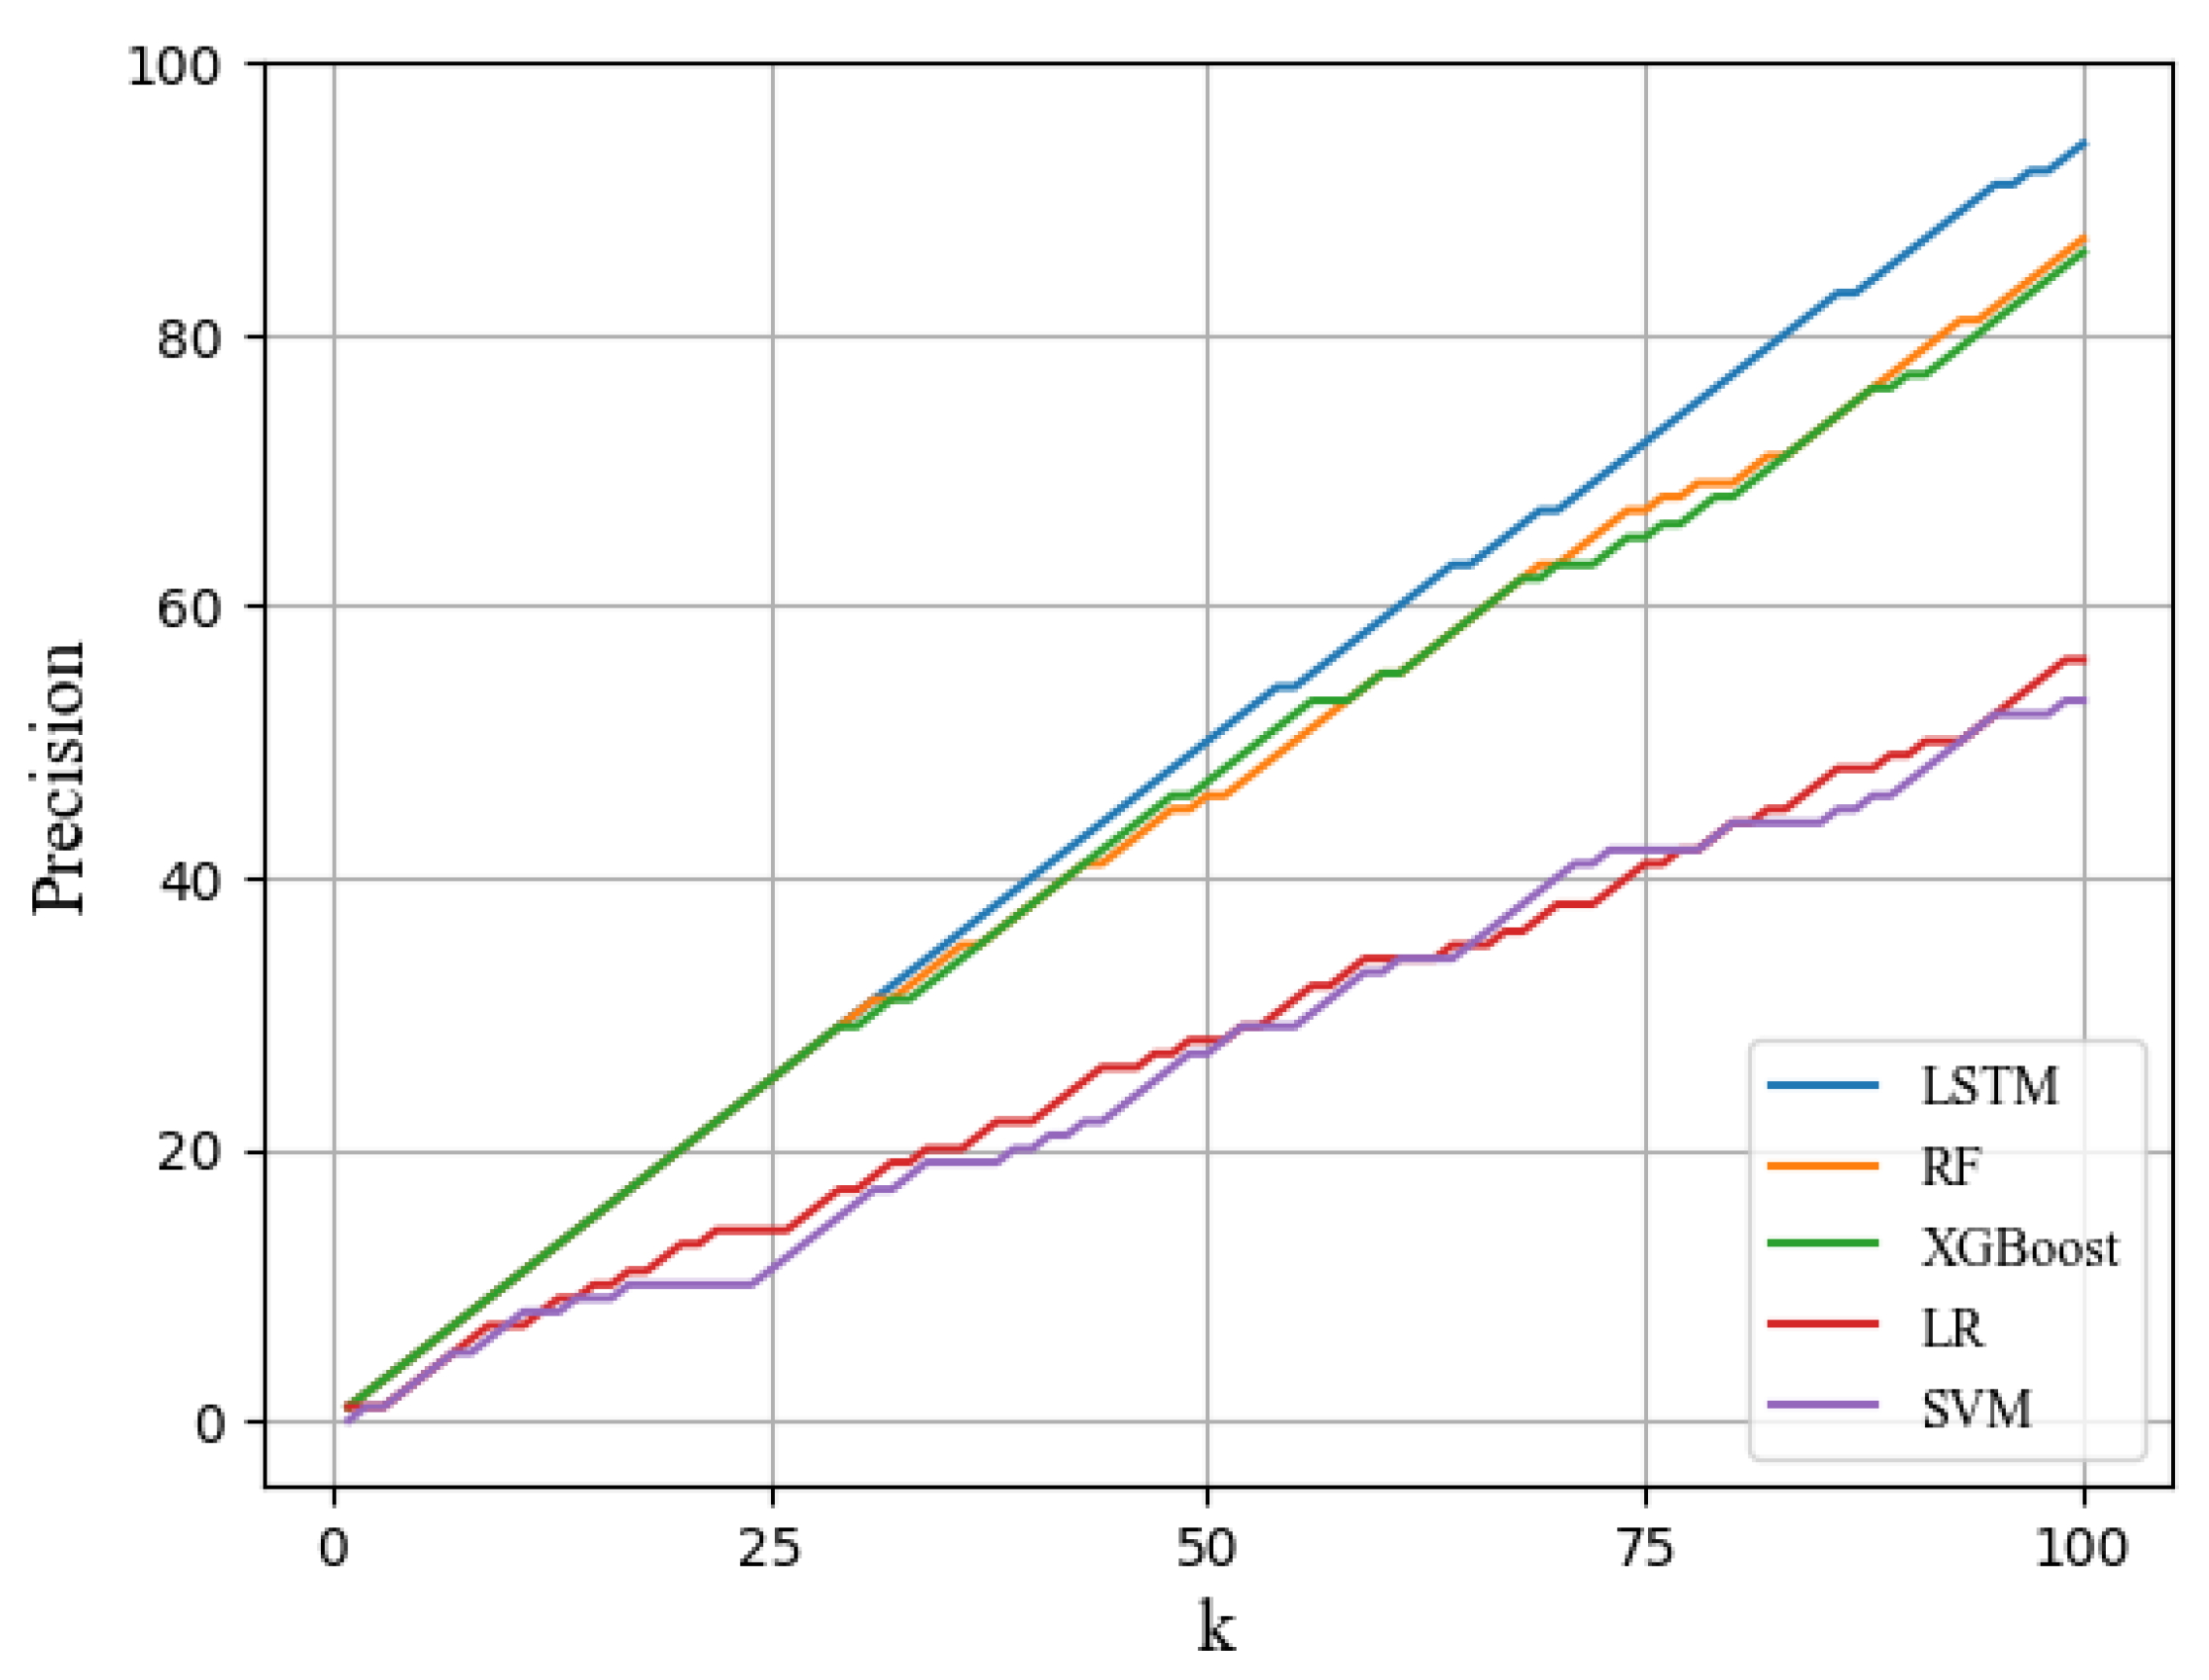
Subsequently, we computed the precision@K score to analyze the practical assessment of the likelihood of developing cognitive impairment. The precision@K score measures the proportion of accurately predicted outcomes among the top k predictions when the model prediction scores are sorted in descending order. In other words, precision@K reflects the proportion of the top k subjects for which the diagnostic labels are correctly predicted and is defined as follows:
As illustrated in
Figure 5, the precision@100 score for the LSTM model was 96%, indicating that 96 of the top 100 predicted patients had cognitive impairment. This result underscores the proficiency of the LSTM model in capturing the characteristics of time-series data and its effectiveness in predicting cognitive impairment. Although the other machine learning models did not utilize time-series data, the RF and XGBoost models performed relatively well in identifying patients with cognitive impairment. Consequently, it can be concluded that the LSTM model is highly suitable for identifying patients with cognitive impairment.
4.3. Identifying Influential Features Using Explainable AI
Finally, the SHAP algorithm was applied to the LSTM model trained with the five-day sequence data, which exhibited the highest predictive performance. To elucidate the model’s predictions and analyze the impact of sleep factors on cognitive impairment, two types of plots (summary and bar) were utilized. The summary plot displays the distribution of the Shapley values for each feature across the entire dataset, providing insights into the influence of each feature on the model’s predictions. The bar plot, on the other hand, presents the average absolute SHAP values, which reflect the overall importance of each feature in the prediction process.
Figure 6 illustrates the summary plot for the LSTM model using five-day sequence data. In the summary plot, the x-axis represents the Shapley value, with a wider distribution to the right indicating a stronger positive influence on cognitive impairment, whereas a wider distribution to the left suggests a stronger negative influence. In this plot, red distributions indicate higher feature values, whereas blue distributions represent lower feature values.
Figure 7 shows the bar plot of the LSTM model, where the length of the bars is the average of the absolute values of the SHAP values for each feature, indicating the global predictive impact.
The most significant factors, in order of importance, were average breaths per minute, heart rate variability, rapid eye movement (REM) sleep duration, deep sleep duration, and the percentage of tossing and turning. These findings indicated an association between sleep factors and cognitive impairment. Specifically, the LSTM model predicted that higher average breaths per minute and greater tossing rates were linked to an increased risk of cognitive impairment, suggesting that individuals with cognitive impairment tend to have poorer sleep quality. This is likely because sleep disorders lead to frequent tossing and turning, which disrupt deep sleep. Furthermore, a shorter duration of REM and deep sleep, along with an extended period of light sleep, was associated with an increased risk of cognitive impairment, revealing a significant relationship between sleep depth and cognitive impairment.
Existing medical research supports the notion that sleep disorders are closely linked to cognitive decline. Clinical studies have demonstrated a significant increase in the influx of red blood cells into the capillaries of the cerebral cortex during REM sleep [
32,
33,
34]. Consequently, it can be inferred that REM sleep facilitates active substance exchange within the cerebral cortex, contributing to brain refreshment. This suggests that REM sleep is vital for maintaining cognitive health, as it supports memory consolidation, and neural maintenance. Thus, the lower percentage of REM sleep in individuals with cognitive impairment, as identified by our model, aligns with previous findings, further supporting the idea that REM sleep deprivation accelerates cognitive decline. Heart rate variability (HRV), another key feature identified by the model, is well-documented in the literature as being closely tied to sleep and overall health [
35,
36,
37]. This study found that reduced HRV was associated with a higher model-predicted risk of cognitive impairment. Hence, the findings of this study underscore the importance of autonomic function and its potential to predict cognitive decline.
Moreover, this study’s findings concerning tossing and turning rates are also consistent with the established literature on sleep disturbances. Frequent night-time awakenings, increased tossing and turning, and extended periods of light sleep are commonly observed in individuals with cognitive impairment or dementia [
38]. This study demonstrates that poor sleep quality, fragmented sleep, and disruptions in circadian rhythms are prevalent neuropsychiatric symptoms in individuals with cognitive impairment, significantly impairing their quality of life. Furthermore, it is well-established that sleep deprivation or disturbances can exacerbate the neurodegenerative process, as highlighted by studies linking increased amyloid-beta levels and elevated non-soluble tau protein to poor sleep quality [
39]. These findings emphasize that sleep disruptions can accelerate the degeneration of neural pathways, contributing to the progression of cognitive decline.
This study revealed that individuals with sleep problems such as poor sleep quality, sleep disturbances, and extended periods of light sleep exhibit a significantly higher likelihood of being diagnosed with cognitive impairment or dementia. Indeed, sleep issues such as night-time awakenings or the reversal of the sleep–wake cycle are among the most prevalent neuropsychiatric symptoms observed in patients with cognitive impairment [
40], which considerably diminish the quality of life of many older adults suffering from cognitive decline. Furthermore, disruptions in sleep mechanisms due to altered sleep patterns may accelerate the degeneration of neural pathways that regulate both somatic and psychiatric comorbidities [
41]. Sleep deprivation resulting from sleep disturbances is associated with increased amyloid levels in the cerebrospinal fluid and elevated levels of non-soluble tau protein, both of which contribute to neurodegeneration. The findings of this study further underscore the significance of sleep characteristics in predicting cognitive impairment and highlight a strong correlation between sleep patterns and cognitive decline in older adults.
In this chapter, we employed SHAP to identify the key variables that significantly contribute to the prediction of cognitive impairment. The SHAP values generated by the model were used to quantitatively assess the contribution of these variables to the model predictions. Our analysis revealed that average breaths per minute, REM sleep duration, tossing and turning rates, and light sleep duration were among the most influential factors affecting the model’s predictions. These findings are consistent with previous research suggesting a strong link between sleep characteristics and cognitive decline, reinforcing the notion that sleep patterns are closely associated with cognitive impairment. Consequently, the prediction process of the model developed in this study was validated as rational, and it is anticipated that it can be effectively utilized by healthcare professionals to identify the early signs of cognitive decline and facilitate the early detection of cognitive impairment.
5. Conclusions
In this study, we employed time-series sleep lifelog data to predict cognitive impairment and utilized SHAP, an interpretable AI algorithm, to elucidate the model’s predictions. We collected sleep lifelog data from both healthy individuals and those with cognitive impairment, transformed them into a time series, and extracted relevant sleep factors indicative of the subjects’ sleep status. Subsequently, we trained seven machine learning models and determined that the LSTM model, utilizing five days of time-series data, achieved the highest performance. Finally, we applied SHAP to interpret the predictions of this model, providing insights into the factors influencing cognitive impairment.
The contributions of this study are summarized as follows: First, the cognitive impairment classification model developed in this study effectively leverages the temporal characteristics of sleep lifelog data, demonstrating superior performance in cognitive disorder classification compared with traditional machine learning models. This approach differentiates itself from existing research that utilizes structured measurement tools and traditional medical data and highlights the potential for incorporating lifelog data in the field of cognitive impairment. The proposed model, when used in conjunction with wearable devices, is expected to reduce both the cost and time associated with testing. Second, this study identified key indicators related to cognitive impairment and demonstrated their significance through empirical analysis. By applying interpretable AI techniques such as SHAP, this study revealed how specific sleep-related variables are linked to cognitive decline, offering valuable medical insights into the interaction between sleep patterns and cognitive health. Finally, on a practical level, this model shows potential for real-world applications in healthcare. When paired with wearable devices, it enables rapid and non-invasive predictions of cognitive impairment, substantially reducing the costs and time typically involved in cognitive impairment diagnosis, thus facilitating more efficient decision-making for medical professionals.
However, this study has several limitations. First, the sample size was limited to 174 participants, thereby constraining the dataset available for model training. Since this small sample size can increase the risk of overfitting, this study applied early stopping in the model training process. Future study should focus on expanding the dataset to enhance the model’s generalization ability and robustness in real-world applications. Additionally, increasing the volume of disease data is expected to address data imbalance and to distinguish effectively between different stages of cognitive impairment. Second, the study utilized only one to two months of lifelog data, which may be insufficient given the time required for progression from mild to severe cognitive impairment. Longer-term data collected over several years can help capture the gradual cognitive decline that occurs over time. In addition, incorporating multiple data sources such as neuroimaging, speech data, or genetic information could provide a more holistic view of cognitive impairment progression, leading to more accurate predictions. Finally, the proposed model was not tested in actual healthcare settings and has not been validated in real-world clinical practice. Future study should focus on validating the model in clinical settings to assess its practical effectiveness. Collaborating with healthcare providers could enable the integration of the model into clinical workflows, providing real-time feedback and facilitating the early detection of cognitive impairment. Additionally, alternative AI models such as gated recurrent units or attention mechanism should be explored to potentially enhance the model’s performance and adaptability in clinical environments.


 ,
, 