
Research on the Vibration Response of High-Rise Buildings under Blasting Load
Abstract
1. Introduction
2. Theory of Blasting Vibration
2.1. Theory of Blasting Seismic Wave Propagation
2.2. Resonance Theory
3. Field Test of Blasting Vibration
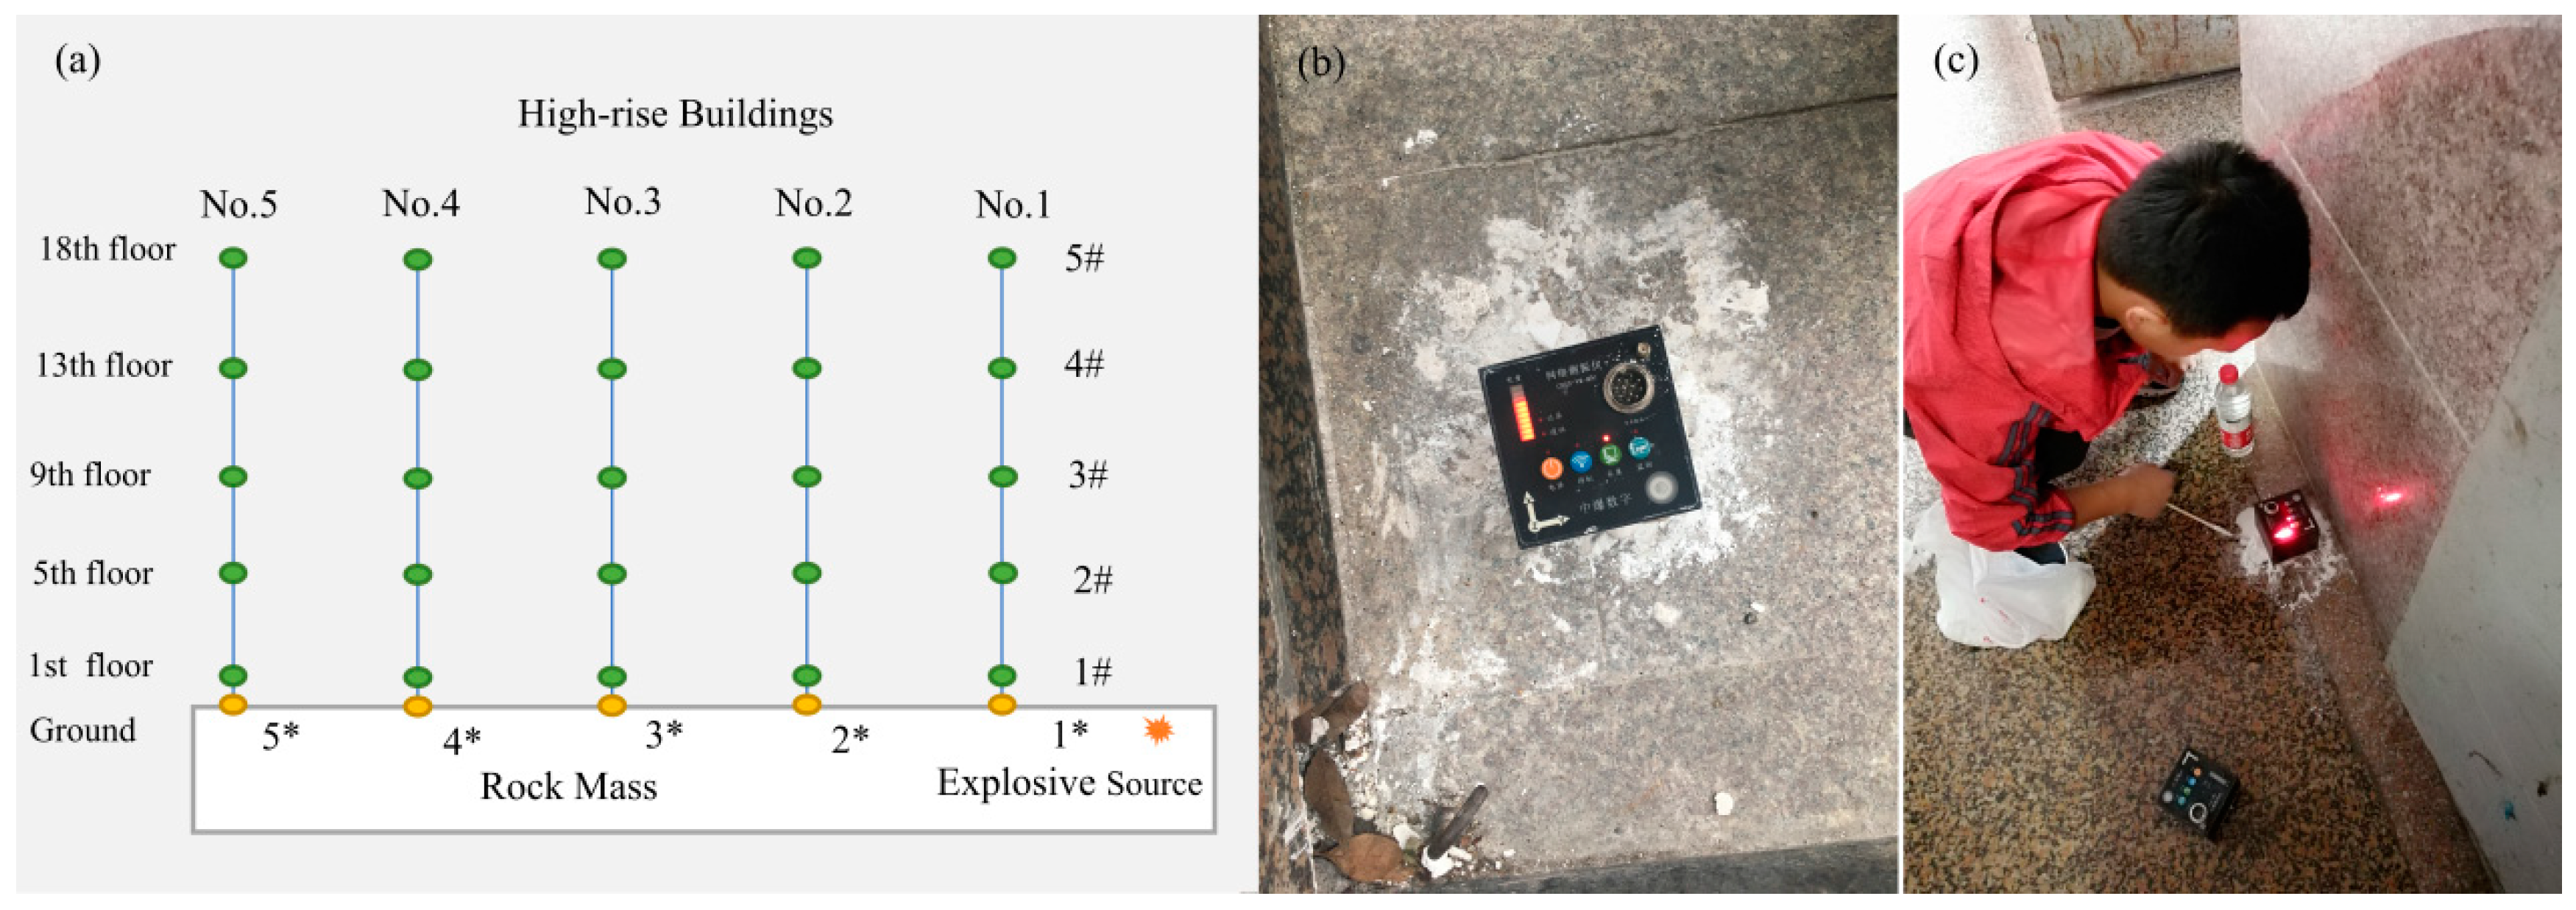
3.1. Overview of the Project
3.2. Monitoring Content and Methods
3.3. Monitoring Results
3.3.1. PPV and Ground Frequency
3.3.2. PPV and Frequency of the Buildings
3.4. Analysis of Monitoring Results
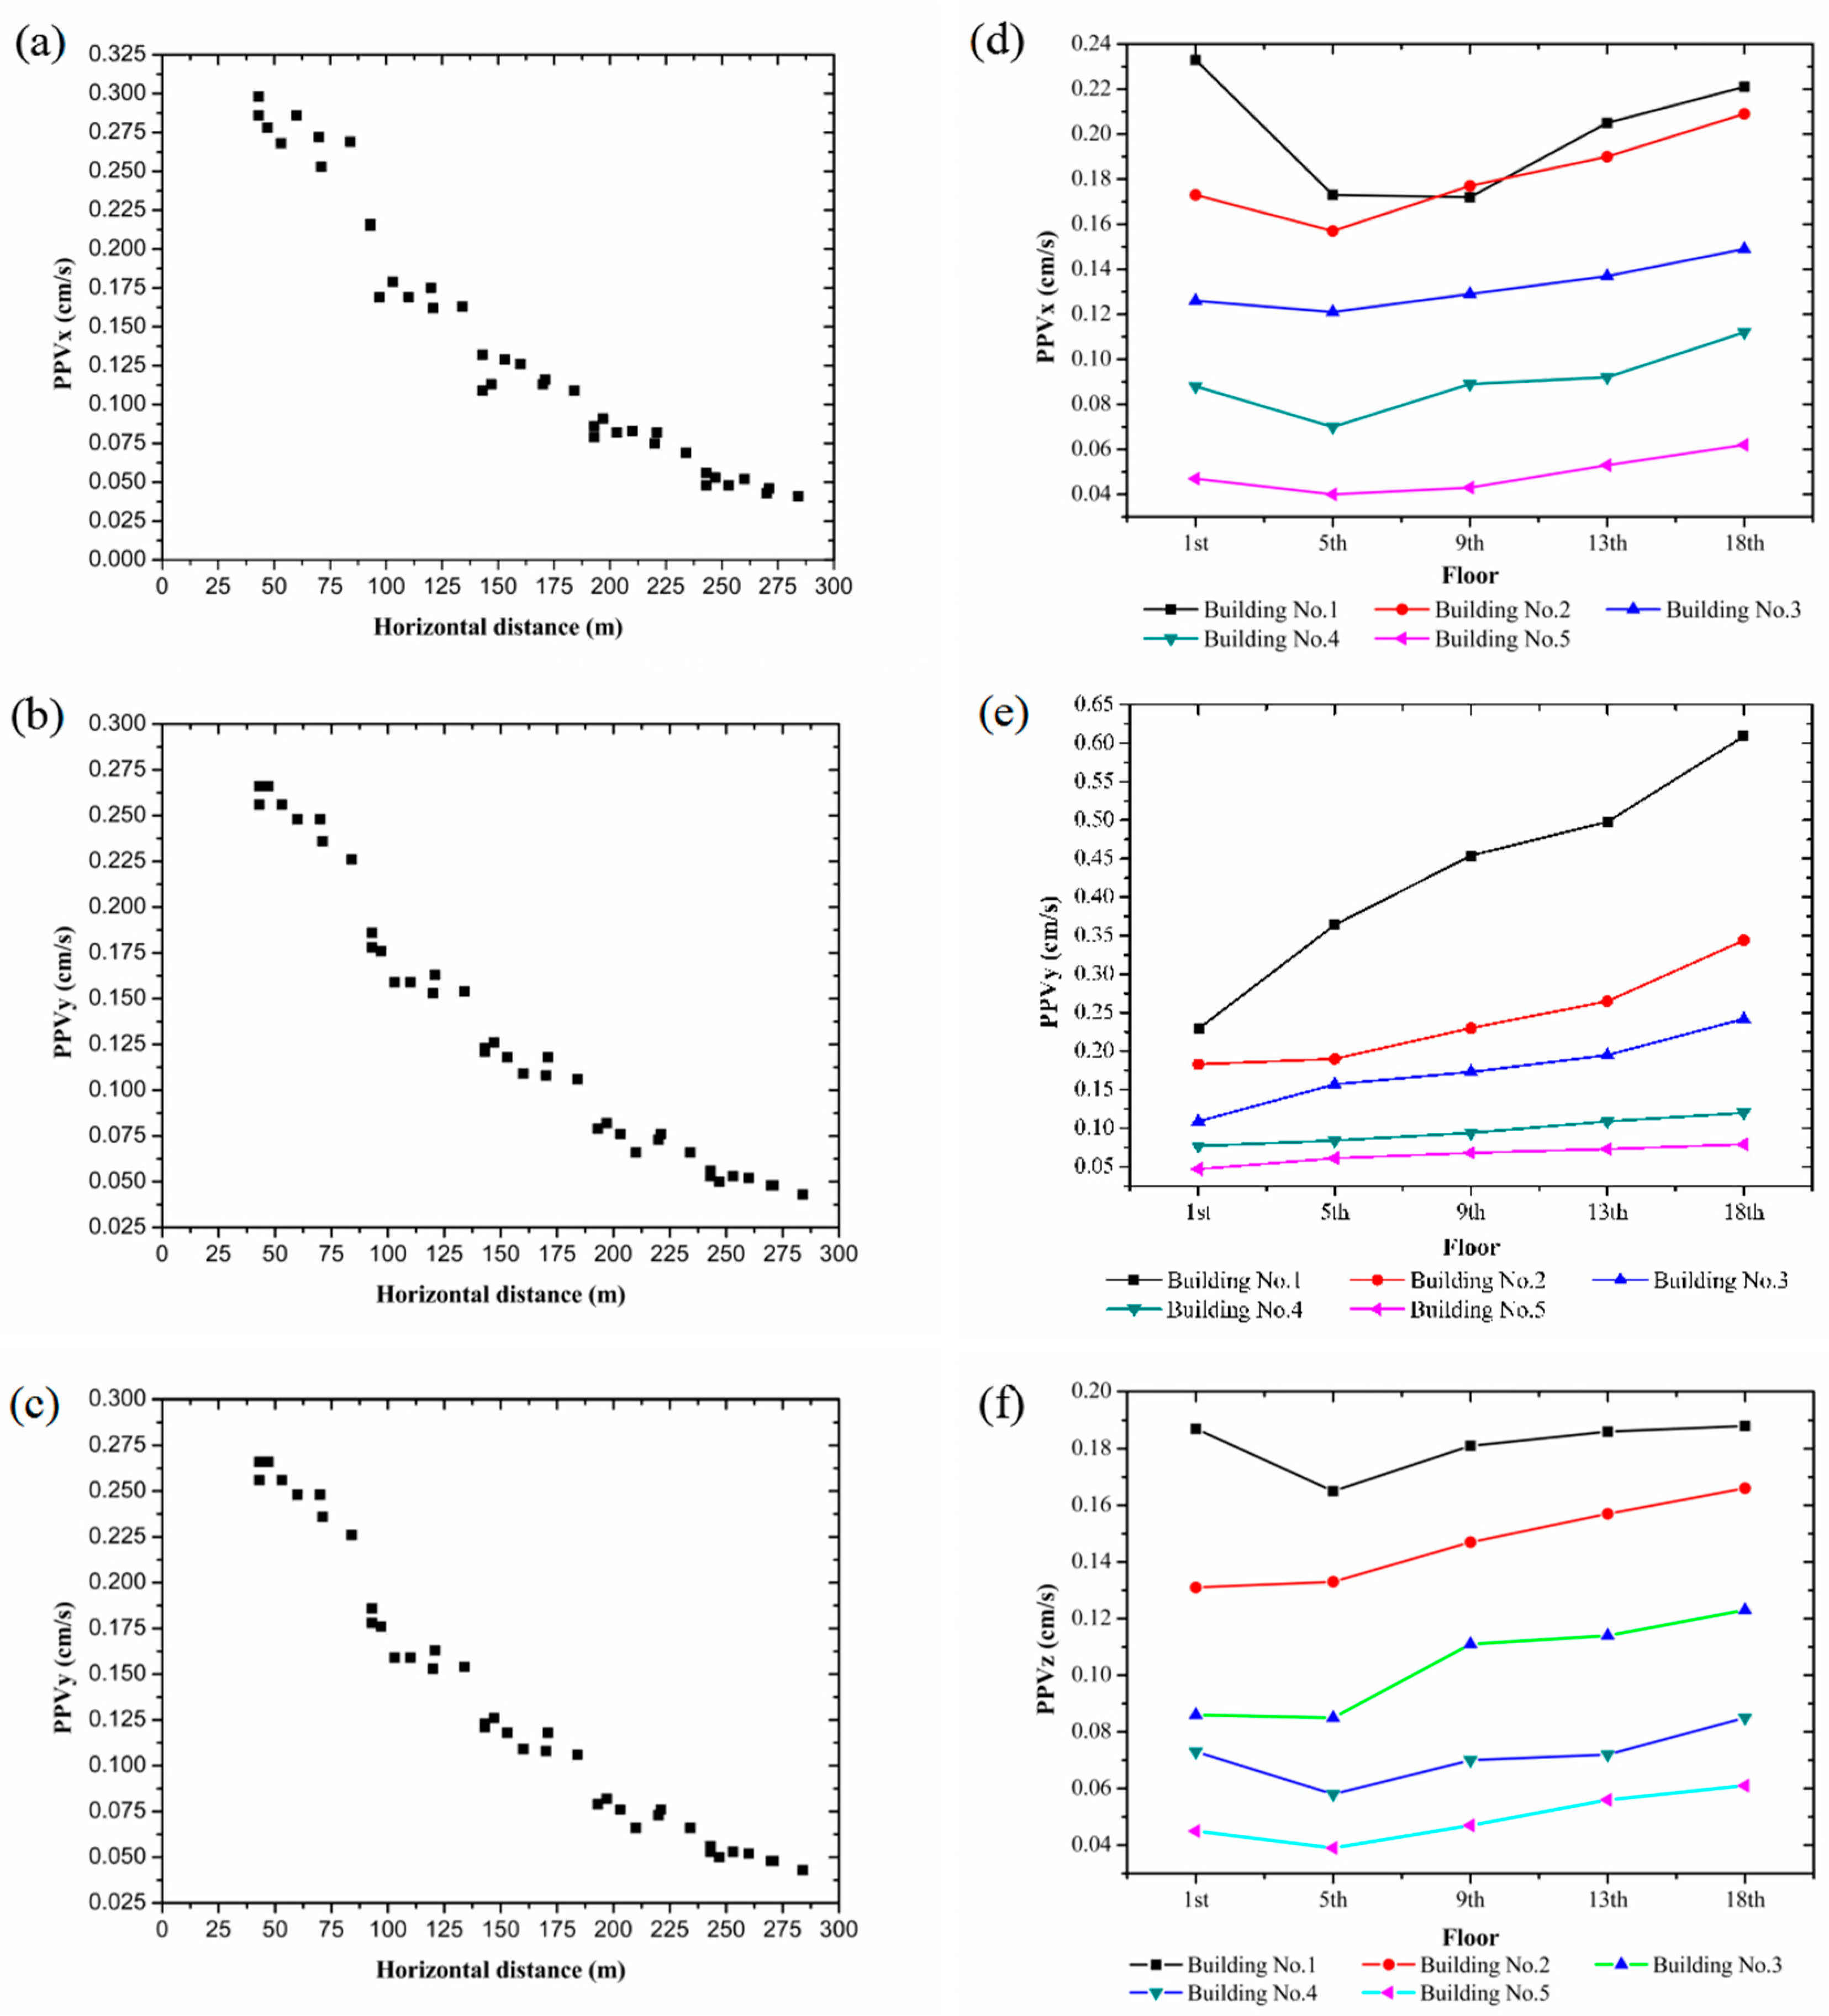
3.4.1. PPV
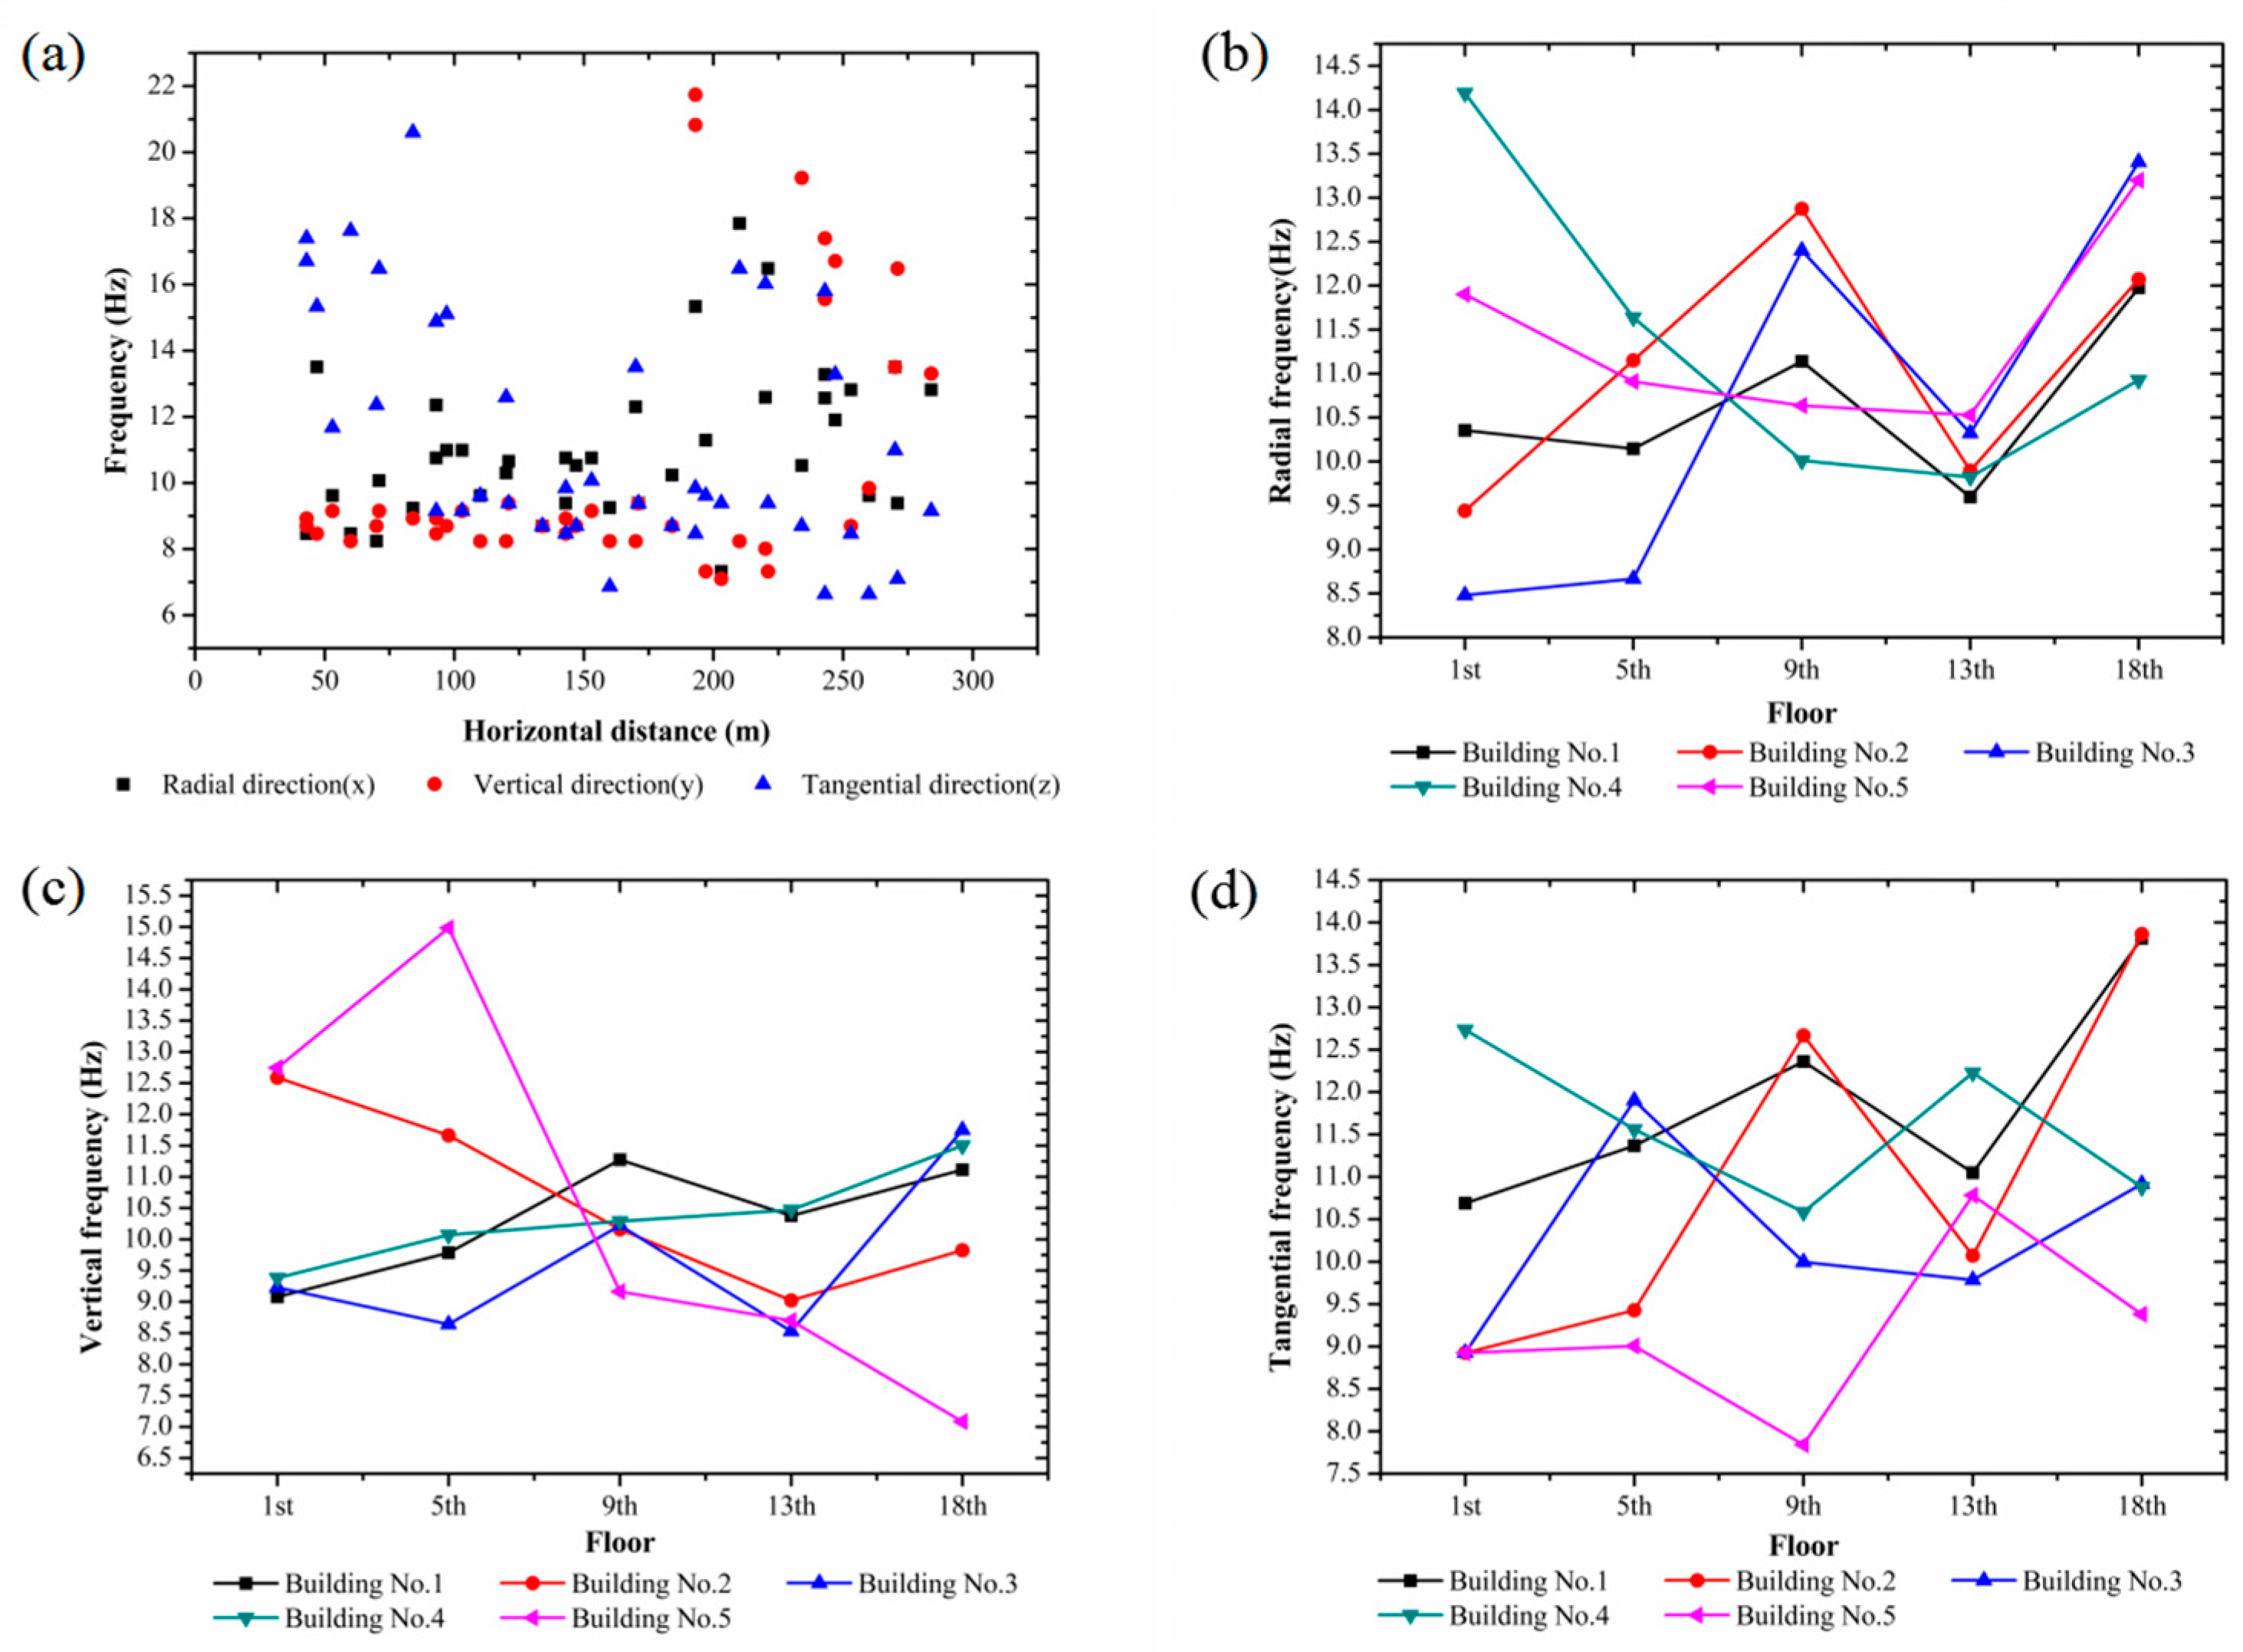
3.4.2. Frequency
4. Numerical Test of Blasting Vibration
4.1. Model and Parameters
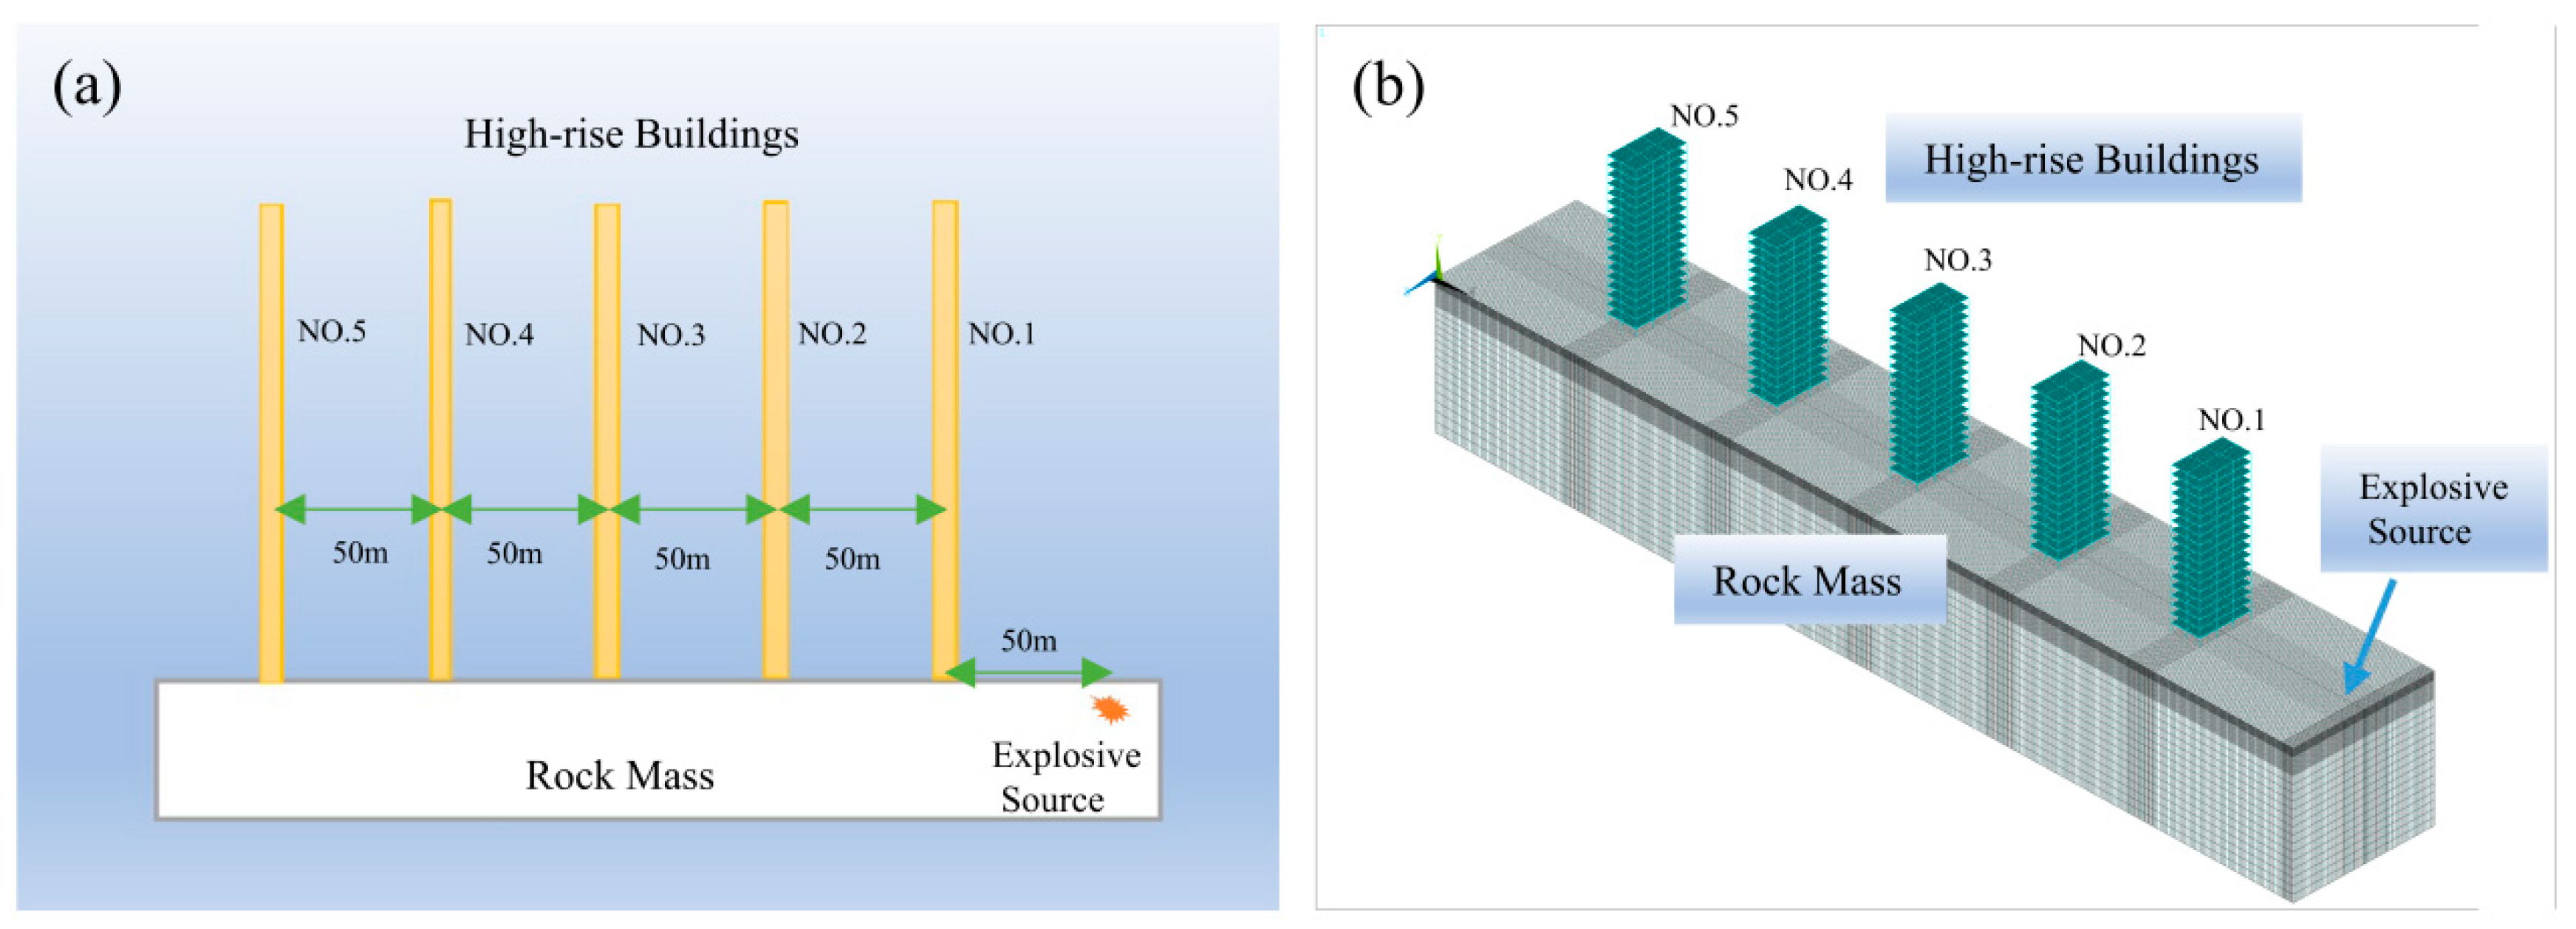
4.1.1. Model
4.1.2. Material Parameters
4.2. Numerical Test Results
4.3. Analysis of Numerical Test Results
4.4. Comparative Analysis of Numerical and Field Tests
4.4.1. Comparison of Ground PPV
4.4.2. Comparison of Building PPV
4.5. Blasting Vibration Tests Considering Different Slope Height Differences
4.5.1. Numerical Model
4.5.2. Numerical Test Results and Analysis
4.6. Relationship between PPV and PPS
5. Discussion
6. Conclusions
- (1)
- In the context of blasting operations, the ground PPV is observed to decline as HDEC increases. This phenomenon is evidenced by the observation that the tangential PPV is less than that of the vertical PPV, which in turn is less than that of the radial PPV. The vertical PPV in high-rise buildings is observed to increase with floor elevation, exhibiting an elevation amplification effect. The magnification factor for an 18-story building with HDEC = 50 m can reach a value of 2.66. The tangential and radial PPVs of the building demonstrate a proclivity for decline and subsequent augmentation with the ascent of the floor height. The vertical vibration velocity of the building is greater than the radial and tangential vibration velocities.
- (2)
- VDEC exerts an influence on PPV. The vertical PPV of the building increases with increasing VDEC. Both the radial and tangential PPVs of the building increase with increasing VDEC, if VDEC has a negative value.
- (3)
- There is no significant pattern in the ground frequency and building frequency, which span a range of 8 Hz to 20 Hz, with a mean value of 10 Hz.
- (4)
- PPS is not proportional to PPV. As the height of a structure increases, PPS tends to decrease and fluctuate, while PPV tends to increase. The highest PPS is observed at the first floor level. It is therefore recommended that buildings be designed with an increased ground floor column section. Meanwhile, it is recommended that PPS of buildings should be included in the blasting vibration safety allowance.
Author Contributions
Funding
Data Availability Statement
Acknowledgments
Conflicts of Interest
References
- Ainalis, D.; Kaufmann, O.; Tshibangu, J.P.; Verlinden, O.; Kouroussis, G. Modelling the source of blasting for the numerical simulation of blast-induced ground vibrations: A review. Rock Mech. Rock Eng. 2017, 50, 171–193. [Google Scholar] [CrossRef]
- Deng, X.; Wang, J.; Wang, R.; Liu, Q. Influence of blasting vibrations generated by tunnel construction on an existing road. Int. J. Civ. Eng. 2020, 18, 1381–1393. [Google Scholar] [CrossRef]
- Jiang, N.; Zhou, C. Blasting vibration safety criterion for a tunnel liner structure. Tunn. Under. Space Technol. 2012, 32, 52–57. [Google Scholar] [CrossRef]
- Ren, Y.; Xi, S.; Yang, Y.; Wan, T.; Wang, H.; Zhao, K. Structural vibration characteristics of the historical building in a nearby blasting test. Front. Earth Sci. 2024, 11, 1304354. [Google Scholar] [CrossRef]
- He, L.; Kong, D.; Lei, Z. Research on vibration propagation law and dynamic effect of bench blasting. Mathematics 2022, 10, 2951. [Google Scholar] [CrossRef]
- Wu, F.; Zhang, X.; Han, M.; Chen, J.; Hu, T.; Zhou, X.; Wang, S.; Zhu, K. Study on the Composition and Characteristics of Seismic Waves Induced by Blasting in Existing Tunnels. J. Cent. South Univ. (Nat. Sci. Ed.) 2024, 55, 1406–1417. (In Chinese) [Google Scholar]
- Qin, Z.; Zhao, Y.; Chen, L.; Cao, H.; Zeng, L.; Jiao, W.; Xu, H. Propagation characteristics and control technology of blasting vibration in neighborhood tunnel. Front. Earth Sci. 2023, 11, 1204450. [Google Scholar] [CrossRef]
- Luo, Y.; Fan, X.; Huang, R.; Wang, Y.; Yunus, A.P.; Havenith, H.B. Topographic and near-surface stratigraphic amplification of the seismic response of a mountain slope revealed by field monitoring and numerical simulations. Eng. Geol. 2020, 271, 105607. [Google Scholar] [CrossRef]
- Huo, R.; Li, S.; Song, Z.; Fujii, Y.; Lei, S.; Mao, J.; Tian, S.; Miao, Z. Analysis of vibration response law of multistory building under tunnel blasting loads. Adv. Civ. Eng. 2019, 2019, 4203137. [Google Scholar] [CrossRef]
- He, L.; Zhong, D.; Liu, Y.; Song, K. Prediction of bench blasting vibration on slope and safety threshold of blasting vibration velocity to undercrossing tunnel. Shock Vib. 2021, 2021, 9939361. [Google Scholar] [CrossRef]
- Xu, S.; Li, Y.; Liu, J.; Zhang, F. Optimization of blasting parameters for an underground mine through prediction of blasting vibration. J. Vib. Control 2019, 25, 1585–1595. [Google Scholar] [CrossRef]
- Yan, Y.; Hou, X.; Fei, H. Review of predicting the blast-induced ground vibrations to reduce impacts on ambient urban communities. J. Clean. Prod. 2020, 260, 121135. [Google Scholar] [CrossRef]
- Lu, W.; Yang, J.; Chen, M.; Zhou, C. An equivalent method for blasting vibration simulation. Simul. Model. Pract. Theory 2011, 19, 2050–2062. [Google Scholar] [CrossRef]
- Yu, C.; Wu, J.; Li, H.; Ma, Y.; Wang, C. Study on the Equivalence Transformation between Blasting Vibration Velocity and Acceleration. Sensors 2024, 24, 1727. [Google Scholar] [CrossRef]
- Wang, L.; Gao, W.; Sun, B. Study of dynamic response of High-Rise buildings under blasting earthquake considering model simplifying. Mech. Adv. Mater. Struct. 2020, 27, 2068–2089. [Google Scholar] [CrossRef]
- Liang, Q.; An, Y.; Zhao, L.; Li, D.; Yan, L. Comparative study on calculation methods of blasting vibration velocity. Rock Mech. Rock Eng. 2011, 44, 93–101. [Google Scholar] [CrossRef]
- Pinzón, L.A.; Pujades, L.G.; Macau, A.; Figueras, S. Increased seismic hazard in Barcelona (Spain) due to soil-building resonance effects. Soil Dyn. Earthq. Eng. 2019, 117, 245–250. [Google Scholar] [CrossRef]
- Li, M.; Fan, Y.; Li, B.; Pan, J.; Wang, Z. Effects of Blasting Vibration on High rise Frame Shear Wall Structures. Eng. Blast. 2021, 27, 26–31. (In Chinese) [Google Scholar]
- Norén-Cosgriff, K.M.; Ramstad, N.; Neby, A.; Madshus, C. Building damage due to vibration from rock blasting. Soil Dyn. Earthq. Eng. 2020, 138, 106331. [Google Scholar] [CrossRef]
- Lu, W.; Luo, Y.; Chen, M.; Shu, D. An introduction to Chinese safety regulations for blasting vibration. Environ. Earth Sci. 2012, 67, 1951–1959. [Google Scholar] [CrossRef]
- Luo, Y.; Gong, H.; Qu, D.; Zhang, X.; Tao, Y.; Li, X. Vibration velocity and frequency characteristics of surrounding rock of adjacent tunnel under blasting excavation. Sci. Rep. 2022, 12, 8453. [Google Scholar] [CrossRef]
- Zhou, Y.; Zuo, Y.; Wei, X.; Chi, E.; He, X. Comparative Experimental Study on Elevation Effect of Blasting Vibration. Min. Res. Dev. 2017, 37, 50–54. (In Chinese) [Google Scholar] [CrossRef]
- Sun, P.; Lu, W.; Zhou, J.; Huang, X.; Chen, M.; Li, Q. Comparison of dominant frequency attenuation of blasting vibration for different charge structures. J. Rock Mech. Geotech. Eng. 2022, 14, 448–459. [Google Scholar] [CrossRef]
- Yang, J.; Lu, W.; Jiang, Q.; Yao, C.; Jiang, S.; Tian, L. A study on the vibration frequency of blasting excavation in highly stressed rock masses. Rock Mech. Rock Eng. 2016, 49, 2825–2843. [Google Scholar] [CrossRef]
- He, R.; Jiang, N.; Li, D.W.; Qi, J.F. Dynamic response characteristic of building structure under blasting vibration of underneath tunnel. Shock Vib. 2022, 2022, 9980665. [Google Scholar] [CrossRef]
- Tian, X.; Song, Z.; Wang, J. Study on the propagation law of tunnel blasting vibration in stratum and blasting vibration reduction technology. Soil Dyn. Earthq. Eng. 2019, 126, 105813. [Google Scholar] [CrossRef]
- Yan, W.M.; Tham, L.G.; Yuen, K.V. Reliability of empirical relation on the attenuation of blast-induced vibrations. Int. J. Rock Mech. Min. Sci. 2013, 59, 160–165. [Google Scholar] [CrossRef]
- Wang, X. Blasting Design and Construction; Metallurgical Industry Press: Beijing, China, 2011; pp. 681–683. (In Chinese) [Google Scholar]
- GB 6722-2014; General Administration of Quality Supervision, Inspection and Quarantine of the People’s Republic of China. Blasting Safety Regulations [S]. China Standard Press: Beijing, China, 2014. (In Chinese)
- Fan, C.; Ge, J. Dynamic calculation method of vibration response of building blasting based on differential equation. Environ. Technol. Innov. 2020, 20, 101178. [Google Scholar] [CrossRef]
- Bao, S. Structural Dynamics, 1st ed.; Wuhan University of Technology Press: Wuhan, China, 2005; pp. 8–84. (In Chinese) [Google Scholar]
- Zhao, Y.; Shan, R.L.; Wang, H. Research on vibration effect of tunnel blasting based on an improved Hilbert–Huang transform. Environ. Earth Sci. 2021, 80, 1–16. [Google Scholar] [CrossRef]
- Hosseini, S.; Khatti, J.; Taiwo, B.O.; Fissha, Y.; Grover, K.S.; Ikeda, H.; Pushkarna, M.; Berhanu, M.; Ali, M. Assessment of the ground vibration during blasting in mining projects using different computational approaches. Sci. Rep. 2023, 13, 18582. [Google Scholar] [CrossRef]
- Pak, T.U.; Jo, G.R.; Han, U.C. Prediction of characteristic blast-induced vibration frequency during underground excavation by using wavelet transform. Front. Struct. Civ. Eng. 2022, 16, 1029–1039. [Google Scholar] [CrossRef]
- Wang, H.; Bai, H.; Zhao, Y.; Wang, D.; Wang, X.; Wang, S. The removal method of the blasting vibration signal trend item and noise. Shock Vib. 2021, 2021, 1645380. [Google Scholar] [CrossRef]
- Zhang, X.; Yan, P.; Lu, W.; Cheng, Y.; Sun, C.; Zhu, J.; Guo, W.; Cheng, X. Frequency spectrum characteristics of blast-induced vibration with electronic detonators in ground blasting. J. Build. Eng. 2023, 74, 106892. [Google Scholar] [CrossRef]
- Gangone, G.; Gallipoli, M.R.; Tragni, N.; Vignola, L.; Caputo, R. Soil-building resonance effect in the urban area of Villa d’Agri (Southern Italy). Bull. Earthq. Eng. 2023, 21, 3273–3296. [Google Scholar] [CrossRef]


| Serial No. | Category of Protection Object | Safe Permissible Particle Vibration Velocity (cm/s) | ||
|---|---|---|---|---|
| f ≤ 10 Hz | 10 Hz < f ≤ 50 Hz | f > 50 Hz | ||
| 1 | Earth kiln caves, adobe houses, and rubble houses | 0.15–0.45 | 0.45–0.9 | 0.9–1.5 |
| 2 | General civil buildings | 1.5–2.0 | 2.0–2.5 | 2.5–3.0 |
| 3 | Industrial and commercial buildings | 2.5–3.5 | 3.5–4.5 | 4.2–5.0 |
| … | … | … | … | … |
| No. of Times | Monitoring Point | HDEC (m) | Radial PPV (cm/s) | Radial Frequency (Hz) | Vertical PPV (cm/s) | Vertical Frequency (Hz) | Tangential PPV (cm/s) | Tangential Frequency (Hz) |
|---|---|---|---|---|---|---|---|---|
| 1 | 1* | 47 | 0.278 | 13.5040 | 0.266 | 8.4686 | 0.212 | 15.3351 |
| 2* | 97 | 0.169 | 10.9863 | 0.176 | 8.6975 | 0.165 | 15.1062 | |
| 3* | 147 | 0.113 | 10.5286 | 0.126 | 8.6975 | 0.113 | 8.6975 | |
| 4* | 197 | 0.091 | 11.9019 | 0.082 | 7.3242 | 0.076 | 9.6130 | |
| 5* | 247 | 0.047 | 11.9019 | 0.055 | 16.7084 | 0.041 | 13.2751 | |
| 2 | 1* | 43 | 0.298 | 8.6975 | 0.266 | 8.9264 | 0.218 | 17.3950 |
| 2* | 93 | 0.216 | 10.7574 | 0.186 | 8.9264 | 0.148 | 9.1553 | |
| 3* | 143 | 0.109 | 9.3842 | 0.121 | 8.9264 | 0.113 | 9.8419 | |
| 4* | 193 | 0.079 | 15.3351 | 0.079 | 20.8282 | 0.075 | 9.8419 | |
| 5* | 243 | 0.048 | 13.5040 | 0.056 | 17.3950 | 0.048 | 6.6376 | |
| 3 | 1* | 71 | 0.253 | 10.0708 | 0.236 | 9.1553 | 0.206 | 16.4759 |
| 2* | 121 | 0.162 | 9.3842 | 0.163 | 9.3842 | 0.146 | 9.3842 | |
| 3* | 171 | 0.116 | 9.3842 | 0.118 | 9.3842 | 0.101 | 9.3842 | |
| 4* | 221 | 0.082 | 16.4795 | 0.076 | 7.3242 | 0.066 | 9.3842 | |
| 5* | 271 | 0.046 | 9.3842 | 0.048 | 16.4795 | 0.046 | 7.0953 | |
| … | … | … | … | … | … | … | … | … |
| No. of Times | Motoring Point | HDEC (m) | Radial PPV (cm/s) | Radial Frequency (Hz) | Vertical PPV (cm/s) | Vertical Frequency (Hz) | Tangential PPV (cm/s) | Tangential Frequency (Hz) |
|---|---|---|---|---|---|---|---|---|
| 1 | 5# | 50 | 0.228 | 9.6130 | 0.602 | 9.1553 | 0.185 | 20.5994 |
| 4# | 50 | 0.215 | 9.6130 | 0.482 | 9.1553 | 0.18 | 11.4441 | |
| 3# | 50 | 0.186 | 9.3842 | 0.464 | 9.1553 | 0.169 | 12.3596 | |
| 2# | 50 | 0.183 | 9.6130 | 0.356 | 9.1553 | 0.164 | 11.4441 | |
| 1# | 50 | 0.243 | 9.3842 | 0.253 | 9.1553 | 0.195 | 10.9863 | |
| 2 | 5# | 50 | 0.235 | 11.2152 | 0.613 | 8.6975 | 0.196 | 11.4441 |
| 4# | 50 | 0.202 | 11.2152 | 0.512 | 8.6975 | 0.196 | 11.4441 | |
| 3# | 50 | 0.182 | 14.6484 | 0.451 | 8.6975 | 0.189 | 12.3596 | |
| 2# | 50 | 0.176 | 11.2152 | 0.382 | 8.6975 | 0.156 | 11.4441 | |
| 1# | 50 | 0.232 | 11.4441 | 0.235 | 8.6975 | 0.185 | 11.2152 | |
| 3 | 5# | 50 | 0.201 | 9.6130 | 0.612 | 9.3842 | 0.183 | 10.9863 |
| 4# | 50 | 0.199 | 9.6130 | 0.501 | 9.3842 | 0.182 | 11.2152 | |
| 3# | 50 | 0.148 | 9.3842 | 0.446 | 9.3842 | 0.186 | 12.3596 | |
| 2# | 50 | 0.16 | 9.6130 | 0.354 | 9.3842 | 0.175 | 11.2152 | |
| 1# | 50 | 0.223 | 9.6130 | 0.198 | 9.3842 | 0.182 | 11.2152 | |
| Mean value | 5# | 50 | 0.221 | 10.147 | 0.609 | 9.079 | 0.188 | 14.343 |
| 4# | 50 | 0.205 | 10.147 | 0.498 | 9.079 | 0.186 | 11.368 | |
| 3# | 50 | 0.172 | 11.139 | 0.454 | 9.079 | 0.181 | 12.360 | |
| 2# | 50 | 0.173 | 10.147 | 0.364 | 9.079 | 0.165 | 11.368 | |
| 1# | 50 | 0.233 | 10.147 | 0.229 | 9.079 | 0.187 | 11.139 |
| Density (kg/m3) | Elastic Modulus (GPa) | Poisson’s Ratio | Yield Strength (MPa) | Tangent Modulus (MPa) |
|---|---|---|---|---|
| 2090 | 23 | 0.22 | 20 | 250 |
| Density (kg/m3) | Detonation Velocity (m/s) | Detonation Pressure (GPa) | A (GPa) | B (GPa) | R1 | R2 | Internal Energy per Unit Volume (GPa) | Relative Volume | |
|---|---|---|---|---|---|---|---|---|---|
| 1200 | 5500 | 10 | 214.4 | 0.182 | 4.2 | 0.9 | 0.15 | 4.19 | 1 |
| Floor | No.1 | No.2 | No.3 | No.4 | No.5 | Floor | No.1 | No.2 | No.3 | No.4 | No.5 |
|---|---|---|---|---|---|---|---|---|---|---|---|
| 18 | 0.562 | 0.326 | 0.223 | 0.112 | 0.076 | 8 | 0.358 | 0.223 | 0.162 | 0.085 | 0.061 |
| 17 | 0.553 | 0.302 | 0.221 | 0.106 | 0.072 | 7 | 0.359 | 0.202 | 0.157 | 0.086 | 0.063 |
| 16 | 0.520 | 0.268 | 0.213 | 0.100 | 0.074 | 6 | 0.356 | 0.186 | 0.156 | 0.085 | 0.063 |
| 15 | 0.501 | 0.268 | 0.201 | 0.105 | 0.072 | 5 | 0.332 | 0.185 | 0.152 | 0.082 | 0.062 |
| 14 | 0.485 | 0.263 | 0.192 | 0.103 | 0.068 | 4 | 0.312 | 0.176 | 0.130 | 0.079 | 0.052 |
| 13 | 0.462 | 0.260 | 0.190 | 0.101 | 0.071 | 3 | 0.302 | 0.172 | 0.136 | 0.078 | 0.056 |
| 12 | 0.452 | 0.265 | 0.182 | 0.096 | 0.068 | 2 | 0.286 | 0.165 | 0.113 | 0.072 | 0.053 |
| 11 | 0.416 | 0.240 | 0.167 | 0.094 | 0.065 | 1 | 0.265 | 0.168 | 0.112 | 0.075 | 0.052 |
| 10 | 0.412 | 0.230 | 0.169 | 0.093 | 0.065 | ground | 0.256 | 0.169 | 0.116 | 0.076 | 0.051 |
| 9 | 0.396 | 0.225 | 0.168 | 0.092 | 0.063 |
| HDEC (m) | Field Test | Numerical Experiment | Relative Error | |||||||||
|---|---|---|---|---|---|---|---|---|---|---|---|---|
| V2 (cm/s) | V1 (cm/s) | |||||||||||
| Radial | Vertical | Tangential | Combined | Radial | Vertical | Tangential | Combined | Radial | Vertical | Tangential | Combined | |
| 50 | 0.274 | 0.247 | 0.203 | 0.421 | 0.292 | 0.256 | 0.218 | 0.445 | 6.2 | 3.5 | 6.9 | 5.5 |
| 100 | 0.185 | 0.165 | 0.148 | 0.289 | 0.189 | 0.169 | 0.156 | 0.298 | 2.1 | 2.4 | 5.1 | 3.0 |
| 150 | 0.121 | 0.116 | 0.104 | 0.197 | 0.123 | 0.116 | 0.102 | 0.197 | 1.6 | 0.0 | 2.0 | 0.1 |
| 200 | 0.082 | 0.074 | 0.071 | 0.131 | 0.085 | 0.076 | 0.069 | 0.133 | 3.5 | 2.6 | 2.9 | 1.5 |
| 250 | 0.048 | 0.050 | 0.045 | 0.083 | 0.053 | 0.051 | 0.048 | 0.088 | 9.4 | 2.0 | 6.3 | 5.9 |
| Building | Floor | Field Test | Numerical Experiment | Relative Error | |||||||||
|---|---|---|---|---|---|---|---|---|---|---|---|---|---|
| V2 (cm/s) | V1 (cm/s) | ||||||||||||
| Radial | Vertical | Tangential | Combined | Radial | Vertical | Tangential | Combined | Radial | Vertical | Tangential | Combined | ||
| NO.1 | 18 | 0.221 | 0.609 | 0.188 | 0.675 | 0.248 | 0.562 | 0.196 | 0.645 | 10.8 | 8.4 | 4.1 | 4.6 |
| 13 | 0.205 | 0.498 | 0.186 | 0.570 | 0.235 | 0.462 | 0.182 | 0.549 | 12.6 | 7.9 | 2.2 | 3.8 | |
| 9 | 0.172 | 0.454 | 0.181 | 0.518 | 0.206 | 0.396 | 0.168 | 0.477 | 16.5 | 14.6 | 7.9 | 8.6 | |
| 5 | 0.173 | 0.364 | 0.165 | 0.435 | 0.203 | 0.332 | 0.175 | 0.427 | 14.8 | 9.6 | 5.7 | 2.1 | |
| 1 | 0.233 | 0.229 | 0.187 | 0.376 | 0.263 | 0.265 | 0.201 | 0.424 | 11.5 | 13.7 | 6.8 | 11.3 | |
| NO.2 | 18 | 0.209 | 0.344 | 0.166 | 0.435 | 0.186 | 0.326 | 0.163 | 0.409 | 12.5 | 5.4 | 1.8 | 6.4 |
| 13 | 0.190 | 0.265 | 0.157 | 0.362 | 0.185 | 0.260 | 0.152 | 0.353 | 2.7 | 1.9 | 3.3 | 2.4 | |
| 9 | 0.177 | 0.230 | 0.147 | 0.325 | 0.172 | 0.225 | 0.142 | 0.317 | 2.9 | 2.2 | 3.5 | 2.7 | |
| 5 | 0.157 | 0.190 | 0.133 | 0.280 | 0.152 | 0.185 | 0.128 | 0.272 | 3.3 | 2.7 | 3.9 | 3.2 | |
| 1 | 0.173 | 0.183 | 0.131 | 0.283 | 0.168 | 0.168 | 0.148 | 0.280 | 3.0 | 8.6 | 11.7 | 1.3 | |
| NO.3 | 18 | 0.149 | 0.242 | 0.123 | 0.310 | 0.136 | 0.223 | 0.118 | 0.287 | 9.8 | 8.7 | 4.5 | 8.2 |
| 13 | 0.137 | 0.195 | 0.114 | 0.264 | 0.132 | 0.190 | 0.109 | 0.256 | 3.5 | 2.5 | 4.9 | 3.2 | |
| 9 | 0.129 | 0.173 | 0.111 | 0.242 | 0.124 | 0.168 | 0.106 | 0.234 | 3.8 | 2.8 | 5.0 | 3.5 | |
| 5 | 0.121 | 0.157 | 0.085 | 0.215 | 0.116 | 0.152 | 0.085 | 0.209 | 4.0 | 3.1 | 0.4 | 2.9 | |
| 1 | 0.126 | 0.109 | 0.086 | 0.187 | 0.119 | 0.112 | 0.102 | 0.193 | 5.6 | 2.7 | 15.4 | 2.7 | |
| … | … | … | … | … | … | … | … | … | … | … | … | … | … |
| Value of PPS (MPa) | |||||||||
|---|---|---|---|---|---|---|---|---|---|
| Floor | 1 | 2 | 3 | 4 | 5 | 6 | 7 | 8 | 9 |
| Value | 21.0 | 17.8 | 11.7 | 10.2 | 14.0 | 12.3 | 15.8 | 20.3 | 13.7 |
| Floor | 10 | 11 | 12 | 13 | 14 | 15 | 16 | 17 | 18 |
| Value | 15.3 | 15.6 | 14.0 | 12.5 | 16.4 | 9.7 | 10.6 | 12.0 | 7.2 |
Disclaimer/Publisher’s Note: The statements, opinions and data contained in all publications are solely those of the individual author(s) and contributor(s) and not of MDPI and/or the editor(s). MDPI and/or the editor(s) disclaim responsibility for any injury to people or property resulting from any ideas, methods, instructions or products referred to in the content. |
© 2024 by the authors. Licensee MDPI, Basel, Switzerland. This article is an open access article distributed under the terms and conditions of the Creative Commons Attribution (CC BY) license (https://creativecommons.org/licenses/by/4.0/).
Share and Cite
Yuan, Y.; Gao, Z.; He, L.; Lei, Z. Research on the Vibration Response of High-Rise Buildings under Blasting Load. Mathematics 2024, 12, 3165. https://doi.org/10.3390/math12203165
Yuan Y, Gao Z, He L, Lei Z. Research on the Vibration Response of High-Rise Buildings under Blasting Load. Mathematics. 2024; 12(20):3165. https://doi.org/10.3390/math12203165
Chicago/Turabian StyleYuan, Yubao, Zhenghua Gao, Lu He, and Zhen Lei. 2024. "Research on the Vibration Response of High-Rise Buildings under Blasting Load" Mathematics 12, no. 20: 3165. https://doi.org/10.3390/math12203165
APA StyleYuan, Y., Gao, Z., He, L., & Lei, Z. (2024). Research on the Vibration Response of High-Rise Buildings under Blasting Load. Mathematics, 12(20), 3165. https://doi.org/10.3390/math12203165