1. Introduction
In data-driven applications, robust and accurate data completion is of great importance [
1]. Data fusion, achieved by combining data from multiple sources, can decrease the uncertainty of results [
2,
3,
4,
5]. For instance, Roy et al. improved vehicle tracking and detection performance under non-line-of-sight (NLOS) image and non-image modalities by combining multiple state-of-the-art fusion strategies [
6]. Moreover, Senel et al. fused data on the object list level from distributed vehicle sensors using multiple sensors cooperatively [
7]. In addition, Chen et al. fused traffic flow, occupancy, and recreational vehicle speed data and dynamically trained the fused data using a dynamic backpropagation (PB) fusion method [
8]. Moreover, Lin et al. improved road traffic speed prediction by fusing traditional speed sensor data with cross-domain novel “sensor” data [
9]. As for Zißner et al., they introduced the data fusion on intelligent traffic system (DataFITS), which collected four data types from seven sources over nine months and fused them in a spatiotemporal domain, leading to significant improvements in road coverage [
10]. The results showed that DataFITS significantly increased the road coverage by 137% and improved the road information quality by up to 40%. Moreover, these studies demonstrated that the multi-source data could provide more information from different dimensions, thereby enhancing the quality of the data analysis.
Considering that traffic data include various multi-source and heterogeneous data, more data-fusion methods are required. Currently, classical data-fusion methods include Kalman filtering, Bayesian networks, Dempster–Shafer (D–S) evidence theory, neural networks (NNs), fuzzy theory, and voting methods. These techniques have already been applied in vehicle positioning, traffic event recognition, traffic event prediction, and traffic guidance in the transport sector. Referring to existing studies, Kalman filtering and D–S evidence theory are more commonly used. In recent years, with the advancement of artificial intelligence (AI), some machine learning methods, such as recurrent neural networks, convolutional neural networks, and graph neural networks, have also been widely applied in traffic analysis, achieving high success rates in predicting traffic flow [
11].
For instance, Ji et al. encoded each feature in the spatial and temporal dimensions and considered data directly related to flow as the inputs for a graph convolutional network (GCN) [
12]. Furthermore, Satish et al. proposed a multidimensional k-means++ data-fusion method, merging attribute values into a single or very few dimensions [
13]. In addition, Zhang et al. introduced a data-fusion method based on Bayesian fusion rules [
14]. Considering the relationships between multiple traffic factors from a system perspective, this method fuses traffic speeds from different data sources, based on prior probabilities, while using the high-order multivariate Markov model. Nevertheless, the long training time of NNs, the model-building complexity, and the dimensionality issues are still difficulties existing within fusion methods [
15].
Moreover, a tensor serves as a natural mathematical representation of high-dimensional data. Drawing inspiration from compressive sensing theory, which considers sparse structures in tensors, accurate recovery of unknown information can be achieved in a small number of observations if the target tensor exhibits a low-rank structure or can be well approximated by a low-rank tensor. Recently, the tensor completion theory has shown promising applications in traffic data completion, serving as a theoretical foundation for the accurate achievement of multidimensional, multimodal, and multi-structured traffic data.
Recently, low-dimensional fusion of multimodal data has attracted great attention. Tensor-based decomposition is able to map multimodal data into a unified low-dimensional subspace, enabling clustering, classification, and other data-fusion analyses within that subspace [
16]. For instance, Pan et al. utilized the tensor nuclear norm, derived from tensor singular value decomposition (t-SVD), to optimally leverage high-dimensional information, thereby improving the precision of multi-view data processing [
17]. Shen et al. introduced a comprehensive method for analyzing and processing multi-source traffic data [
18]. Their method incorporated data-analysis techniques rooted in spatiotemporal regression models and data-fusion methods based on confidence tensors and evidence theory. Moreover, Xing et al. established a novel tensor decomposition data-fusion framework, demonstrating that the method combining license-plate recognition (LPR) data and cellphone location (CL) data yielded significantly better results compared with the interpolation methods using only LPR data [
19]. In addition, Respati et al. proposed an adaptive weight-based fusion technique (ABAFT), deploying data space coverage and quality or confidence as factors for building weights [
20]. The completion methods for the different missing mechanisms demonstrated the superiority of the tensor learning method by effectively characterizing complicated spatiotemporal correlations [
21]. Therefore, in this study, based on the tensor representation of high-dimensional data, subway data and bus data were fused to achieve efficient multi-source data completion.
In summary, the contributions of this study are as follows:
- (1)
Subway inbound passenger flow and bus transfer time-series data were constructed, and the completion performance of single-source data containing only subway data was compared to that of multi-source data containing subway and bus transfer data;
- (2)
A truncated norm optimization model was derived to enhance the non-convex performance of the objective function during the tensor completion process;
- (3)
A multi-source data-fusion tensor completion framework was established, and ADMM was applied to achieve an effective completion algorithm.
3. Low-Rank Completion Model of Truncated
3.1. Truncated Norm (P2TN)
As an alternative approach to solving rank-minimization problems, the truncated
norm incorporates the advantages of the truncated nuclear norm and the
norm. Moreover, it is more compact than a single norm during the approximation process of rank-minimization problems. Therefore, the truncated
norm preserves the complete features of large singular values in a truncated manner and applies
contraction only to the singular values of
after achieving the truncation. During the contraction, smaller singular values incur larger threshold penalties, ensuring the retention of a sufficient amount of internal strong correlation information to the maximum extent. Thus, the
norm is defined as follows [
22]:
Given a matrix
, for any
,
where
refers to the
norm of the matrix. Assuming that the singular value decomposition of matrix
X is
, then one can write
, where
represents the singular value of the matrix, i.e., the nuclear norm of the matrix. Moreover, the singular values are ranked in descending order as
, and
p indicates the contraction parameter.
Then, the
norm is expanded to the tensor mode. For a given
,
can be expressed as follows [
23]:
According to the tensor singular value decomposition principle, a Fourier transform is performed for X along the third dimension, . In more detail, refers to the forward slice after transformation in matrix form, while indicates the singular value obtained by singular value decomposition for the forward slice , e.g., the tensor nuclear norm.
The truncated nuclear norm of the tensor is defined as follows [
24]:
Given a third-order tensor
and a positive integer
, the truncated nuclear norm represents the sum of the minimum singular values of the tensor:
where
refers to the truncated nuclear norm of the tensor,
refers to the
i-th singular value of
, and the following constraint is to be respected:
.
Combining both tensor norm definitions, the truncated
norm (P2TNN) of the tensor is defined as follows:
where
refers to the truncated
norm, and in the tensor mode, for any given
,
,
, and
.
In the context of a given parameter
, for a tensor
, the tensor singular value decomposition (t-SVD) can be expressed as
. The singular value threshold for the tensor
is consequently defined.
The contraction threshold operator is defined for the truncated
as
. Then, the following equation is obtained:
According to the t-SVD theorem,
represents the solution to the
optimization problem,
denotes the threshold parameter for singular value thresholding decomposition, and
indicates the contraction parameter. When
, the larger the truncated
contraction threshold, the smaller the received penalty. Moreover,
refers to the Frobenius norm. Regarding
, we have
; therefore, one can write
For any value , the addition function is defined as .
3.2. LRTC-P2TN Model
The NWLRTC model [
25] was further optimized using the
norm to develop the LRTC-P2TN model:
where
,
, and
refer to the spatiotemporal traffic data input in three different directions, whereas the truncated nuclear norm of the tensor is introduced to avoid dependencies on the input direction. Moreover,
,
, and
represent the weights of each direction.
Equation (8) denotes a convex optimization problem that incorporates equality constraints. To convert this problem into one without such constraints, the augmented Lagrangian function is employed. The definition of the augmented Lagrangian function, which takes into account only the
constraint conditions, is formulated as follows:
where
are the defined Lagrange multipliers and
is the penalty parameter. The Frobenius norm is an added regularization term that can enhance the convergence of the function.
The Frobenius norm of tensor
is defined as follows:
Equation (9) is addressed using the alternating direction method of multipliers (ADMM), an algorithm that simplifies multiparameter optimization challenges by reducing them to problems concerning a single optimization variable. By leveraging the ADMM approach, the objective function of the primary problem can be divided into a set of manageable sub-problems, which may then be simultaneously solved. The resolution of these sub-problems subsequently converges through coordination, yielding the comprehensive solution to the initial problem.
When solving the model via the ADMM algorithm, it updates one variable at a time, maintaining the others as constants. Specifically, for Equation (9), it sequentially employs gradient descent to update the variables , , , , and in an alternating fashion.
Step 1: Updating
. Keeping
,
,
, and
fixed, let
; the update is as follows:
According to the definition of tensor singular value thresholding, it can be inferred that is the threshold applied to truncate the tensor after performing singular value decomposition, with the threshold .
Step 2: Updating
. Keeping
,
,
, and
fixed, let
; the update is as follows:
Step 3: Updating
. Keeping
,
,
, and
fixed, let
; the update is as follows:
Step 4: Updating
. Keeping
,
,
, and
fixed, let
; the update is as follows:
Moreover, the remaining constraint
is added. Thus,
can be expressed as follows:
Consequently, the constraint is removed, and elements at the positions of the observation points in the completion tensor are replaced by elements at the positions of the original observation points:
Step 4: Updating
. Keeping
,
,
, and
fixed, the value
is updated based on the following process:
The number of iterations is set and updated for each iteration according to the above steps. Moreover, the optimal solution for the model is computed. The steps of the LRTC- P2TN algorithm are defined as follows (Algorithm 1):
| Algorithm 1 LRTC-P2TN |
| Input: ≥ 0, A,, , , , λ |
| Output: the recovered tensor |
| Calculate W using Formula (1) |
| for to |
| Update using Formula (11) |
| Update using Formula (12) |
| Update using Formula (13) |
| Update using Formula (16) |
| Update using Formula (17) |
| If then break |
| end for |
During the construction and solution process of the entire mathematical model, the influence of noise was not considered. In more detail, the LRTC-P2TNN algorithm only considered the reconstruction accuracy of the given data.
3.3. Multi-Source Data-Fusion Tensor Completion Framework
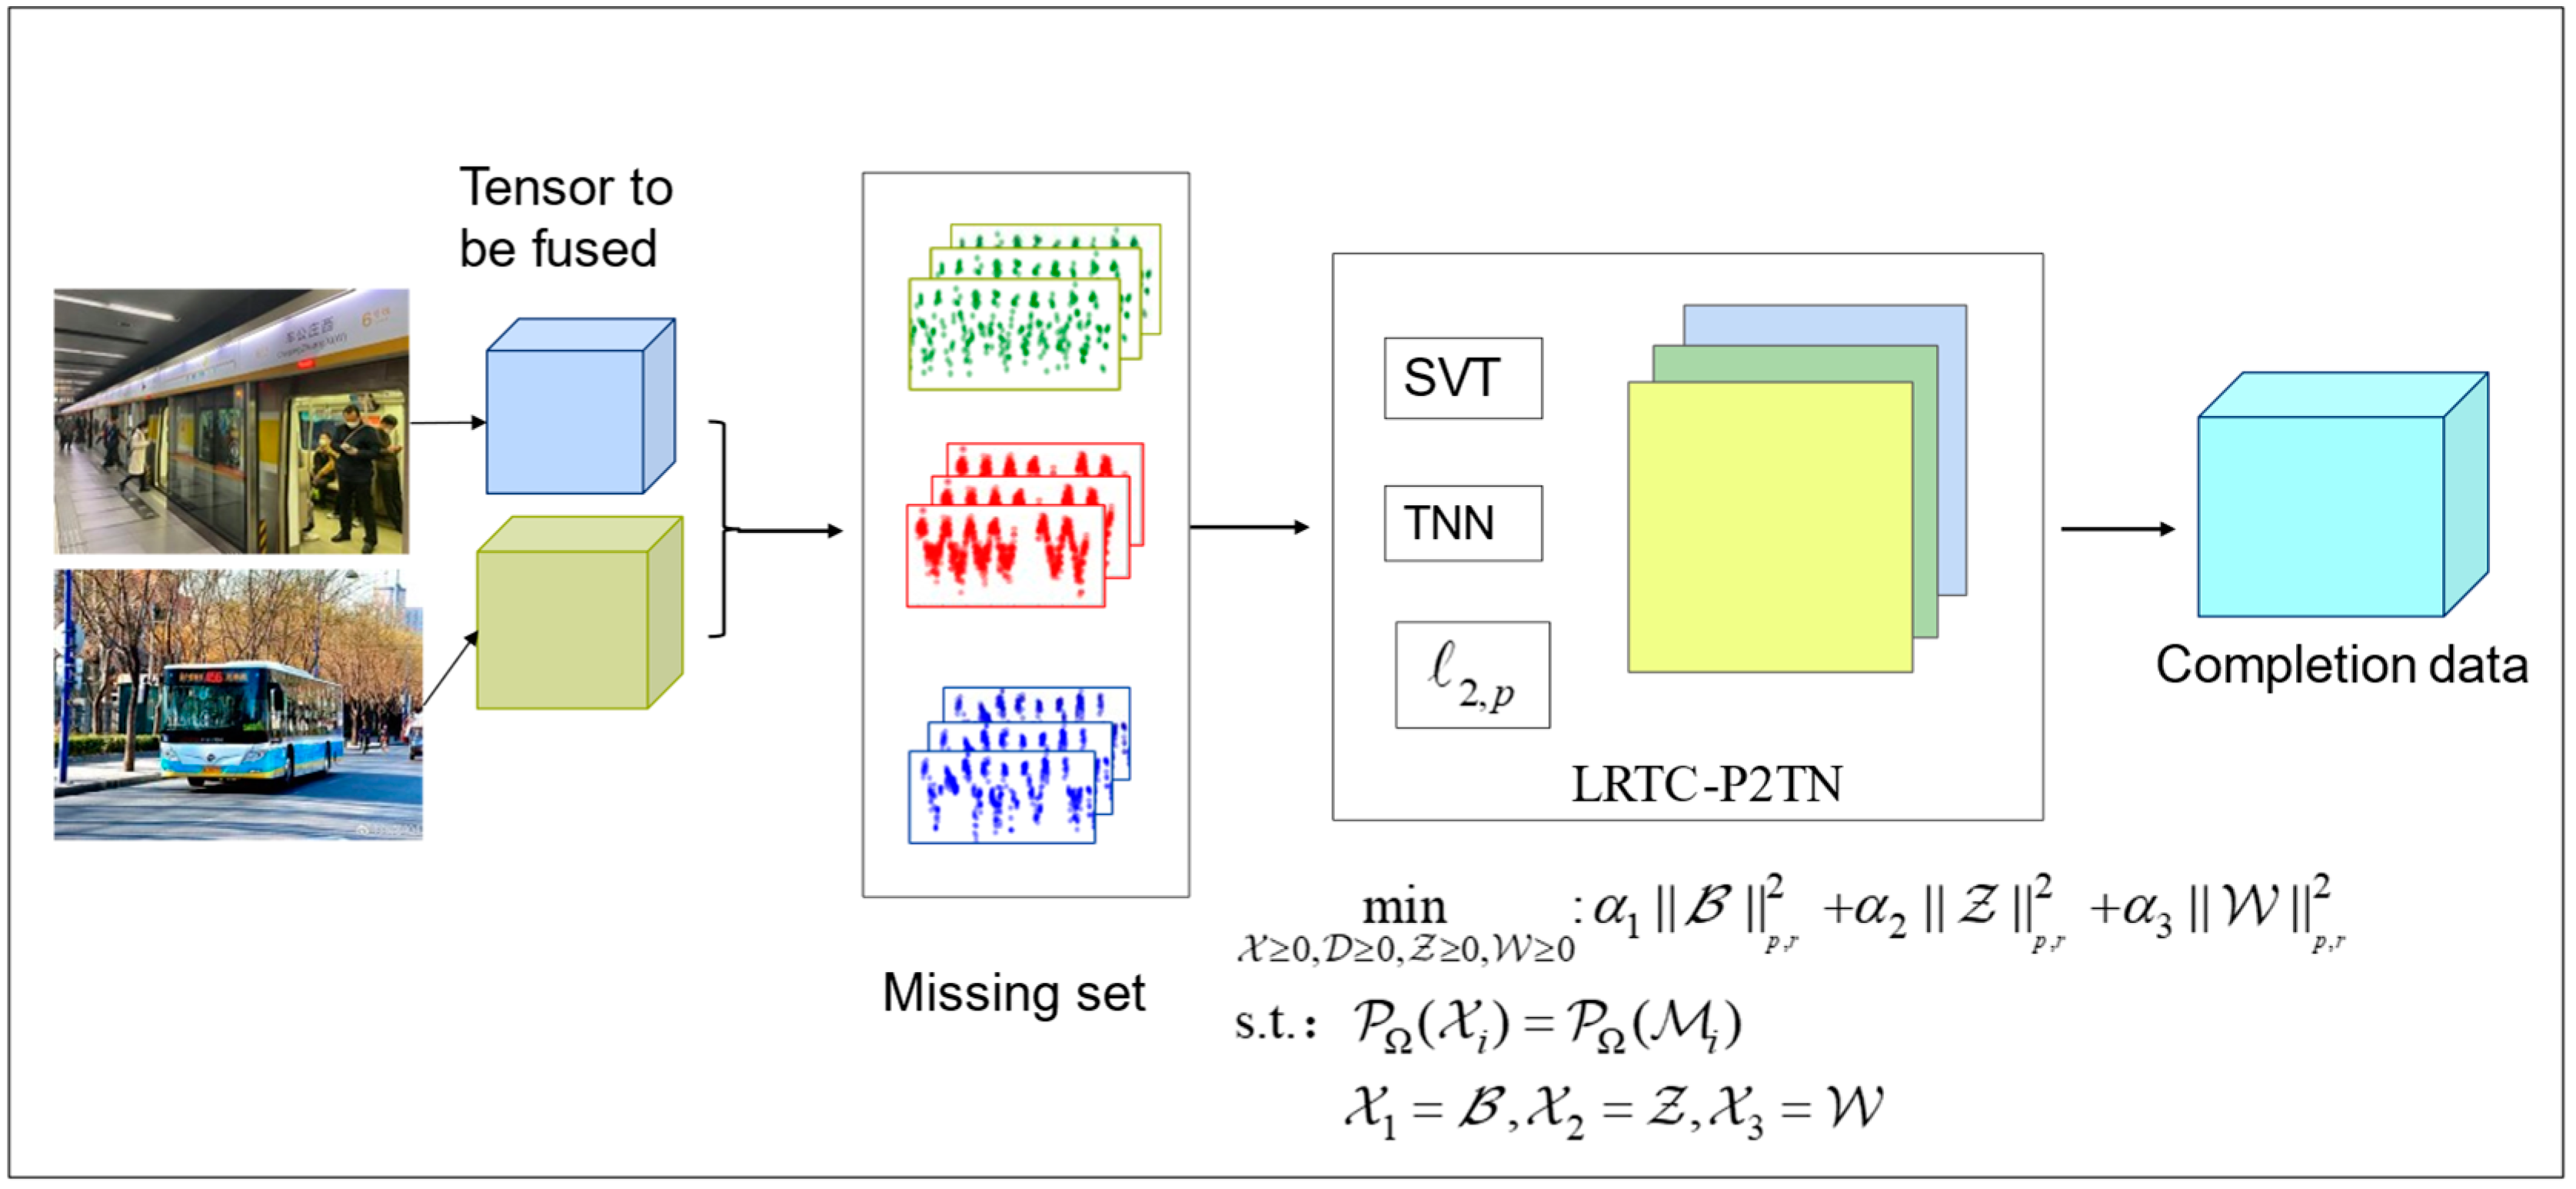
The core of the multi-source data-fusion completion framework represents the LRTC-P2TN module. As depicted in
Figure 1, the correlated data, gathered from different sources, were represented as tensors and were set with different deletion rates. After completion with the LRTC-P2TN module, the final completion data were acquired. The truncated
norm integrated into the model played a crucial role in ensuring the convergence of the algorithm during the completion process.
4. Results and Discussion
4.1. Data Preparation
The experimental data included two datasets: one set of Shenzhen Tong data, referred to as SZ, and one set of Beijing Transportation Smart Card data, known as BJ.
The Shenzhen Tong dataset contained Shenzhen Tong Smart Card data for 22 October 2013, covering data gathered from 117 bus and subway stations. The methodology included both single-source and multi-source data completion techniques. Single-source data adopted a three-dimensional array formulated as day × time interval × subway station, whereas multi-source data extended to a four-dimensional array featuring passenger flow type × day × time interval × station. Analysis of bus flows at subway stations leveraged user ID sequencing to unravel transfer dynamics, with subway flows exclusively accounting for entry volumes, tallied at five-minute intervals. Shenzhen’s data footprint for a single day manifested as a three-dimensional array (1 × 288 × 117) and a four-dimensional array (2 × 1 × 288 × 117) for single-source and multi-source contexts, respectively. By examining RMSE and MAPE metrics, we evaluated the augmentation of subway data completion accuracy via the incorporation of bus data.
Conversely, the BJ dataset encompassed entries from 239 stations, spanning 1 and 10 May 2019. It mirrored the SZ data’s analytical approach, yielding a four-dimensional structure of day × passenger flow type × time interval × station, quantified in five-minute intervals. The resulting dataset, encapsulating a ten-day span, consisted of a sizably expansive array at 2 × 10 × 288 × 239.
4.2. Single-Source Data Completion
During this experiment, we used Beijing subway data for 7 May 2019 and Shenzhen smart card data for 22 October 2013.
Figure 2 and
Figure 3 illustrate the visualization results of both datasets, where the horizontal axis represents the station and the vertical axis is the passenger flow at each time interval. Based on these figures, it can be observed that the Beijing subway data for 7 May showed a more obvious periodicity, with clearer peaks in the morning and evening.
Moreover, the single-source data experiments were considered for subway flow data. The experimental data used three-dimensional data consisting of station × time interval × subway flow (data can be downloaded from the address). The truncation value was set to 4.5, and
represents the iteration step size. The initial iteration step size
was set to 1.15, and the maximum value
of
was equal to 1 × 10
−5. In each iteration,
was updated through the equation
, and the number of iterations was set to 150. For convenience of recording and accuracy, the MAPE values in the table below were multiplied by ten. Moreover,
Table 2 illustrates the completion results under deletion rates of 10%, 30%, 50%, and 70%, using LRTC-P2TN.
4.3. Multi-Source Data Completion
In this study, we used the Beijing subway and bus data for 7 May 2019 and Shenzhen smart card data for 22 October 2013. The experimental data were constructed as a four-dimensional tensor dataset of subway station name, time, subway station passenger flow, and bus station passenger flow. For missing data processing, deletion rates were only set for the subway flow data, while the bus flow data were complete. The experimental parameters were the same as those specified for the single-source data completion.
According to
Table 2 and
Table 3, the completion performance with the fusion of multi-source data of buses led to better behavior compared to the single-source subway data completion.
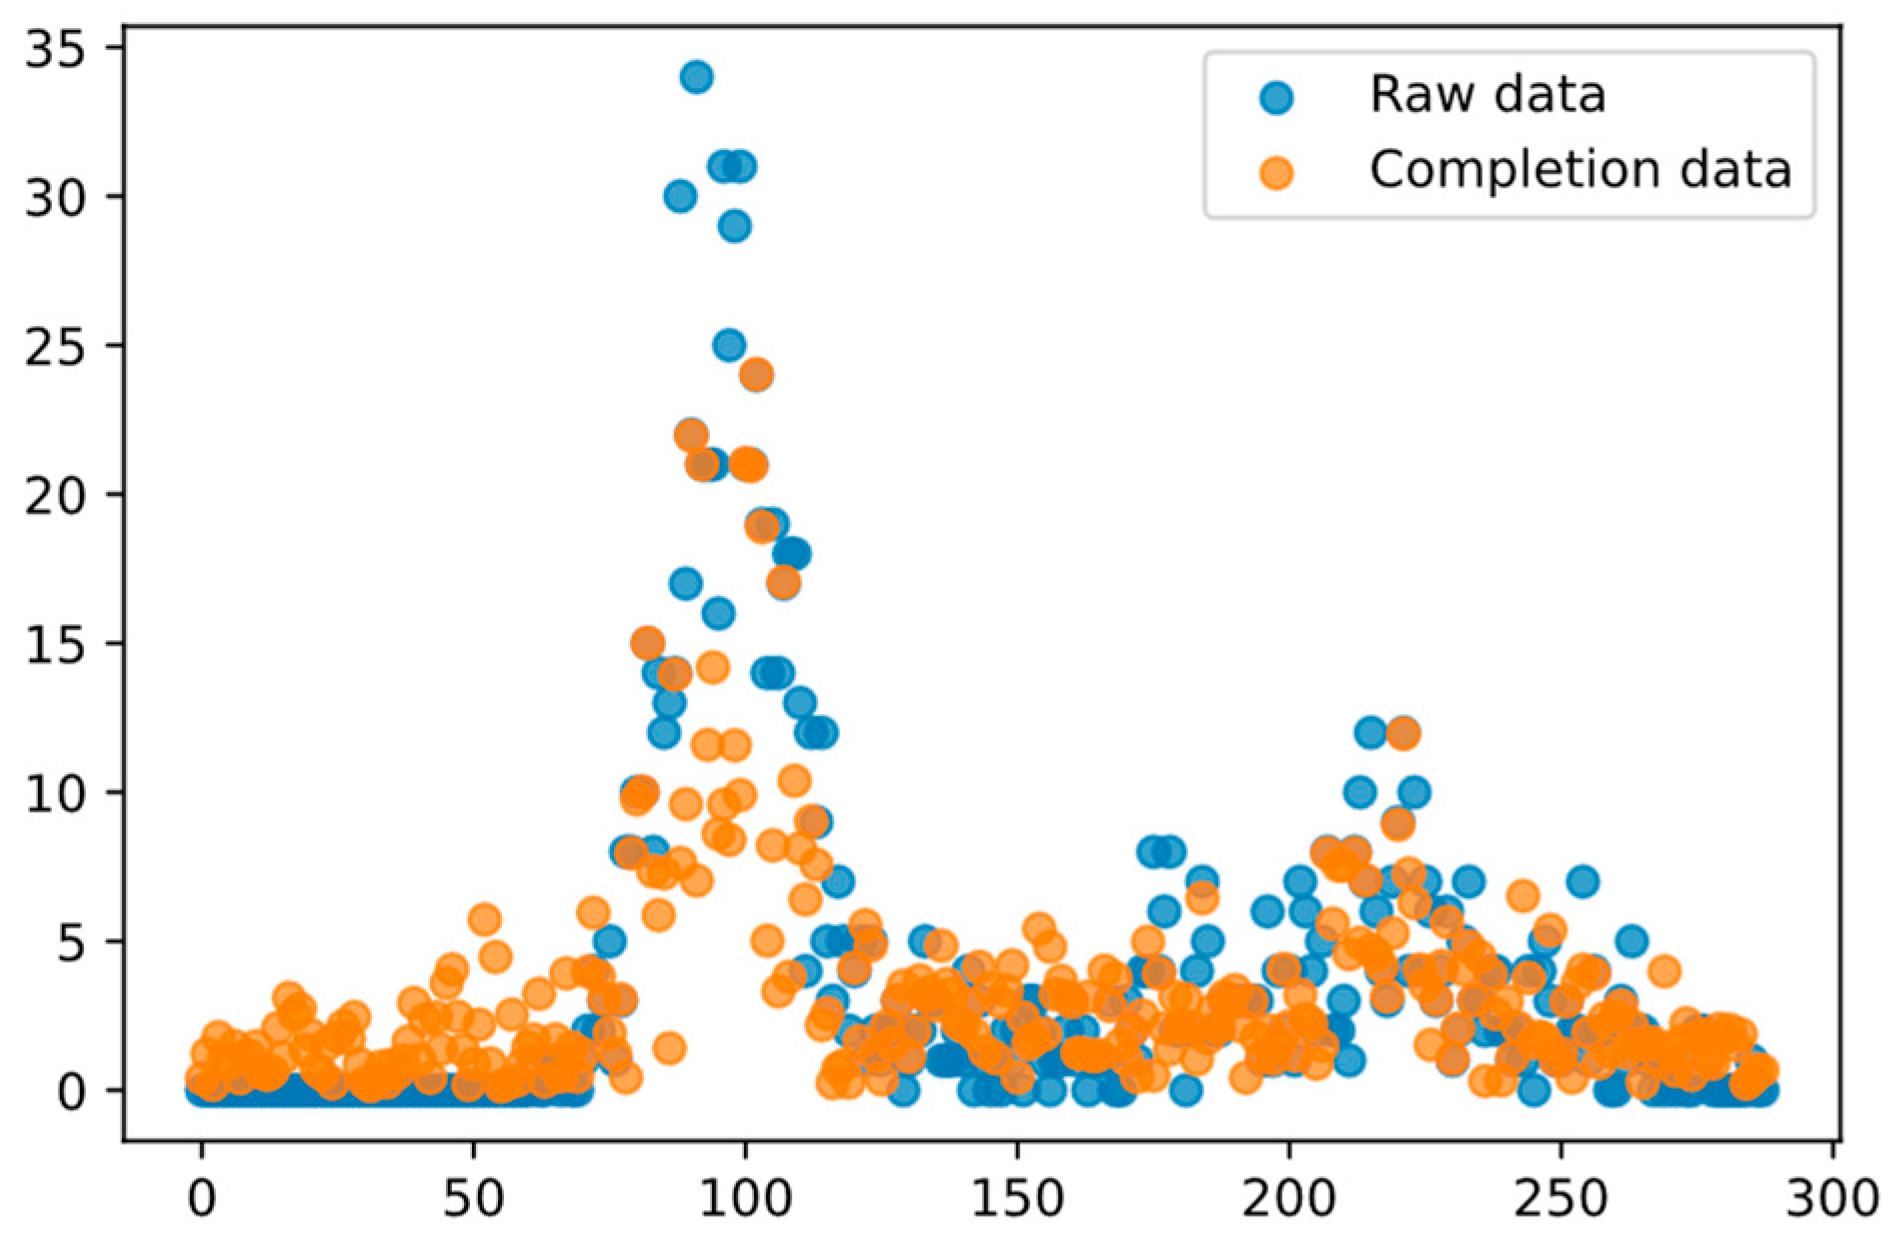
Furthermore,
Figure 4 and
Figure 5 display the data completion effects of single- and multi-source data on Route No. 7 at a deletion rate of 0.5. As indicated, the fusion of bus transfer data enhanced the algorithm’s capability to capture the overall trend of the data.
4.4. Comparison of the LRTC-P2TN Model with Other Models
The proposed LRTC-P2TN model was compared to the LATC [
26], BGCP [
27], NWLRTC [
25], and BTTF [
28] models. In more detail, LATC is an autoregressive low-rank tensor completion algorithm, whereas BGCP is a Bayesian tensor decomposition model that learns latent factor matrices (i.e., low-rank structures) using the Markov chain Monte Carlo method. Moreover, the Bayesian temporal tensor factorization (BTTF) method merges low-rank matrix/tensor decomposition with vector autoregressive (VAR) processes within a probabilistic graphical model framework to facilitate problem-solving. Finally, NWLRTC is a non-negative multidirectional weighted low-rank tensor completion method.
On the BJ dataset, each baseline algorithm was executed. The deletion rate was set to 20%, 30%, 40%, 50%, 60%, 70%, and 80%;
represents the iteration step size, which was initially set to 1 × 10
−5 and updated by
, while
is the convergence accuracy, which was initially set to 1. The experimental results showed that, under random deficiency, setting
= 1 and
= 1 could achieve higher convergence speed and completion accuracy. Moreover,
Figure 6 shows the RMSE values for the different algorithms at various deletion rates under random deficiency. A comparison of the computed results indicates that, compared to the LATC, BGCP, NWLRTC, and BTTF models, the LRTC-P2TN model achieved better imputation accuracy at deletion rates between 20% and 60%. Furthermore, at deletion rates of 70% and 80%, its MAPE values surpassed those of the other algorithms, although the RMSE values yielded higher values (as depicted in
Table 4). Additionally, the LRTC-P2TN model achieved higher completion accuracy than LATC, BGCP, NWLRTC, and BTTF at deletion rates of 20–60%; when the deletion rates were 70% and 80%, our model achieved higher MAPE values than the other algorithms, but its RMSE values were relatively higher (see
Table 4).
Table 4 displays the RMSE and MAPE values for a range of algorithms using the BJ data with an input orientation of 1 × 288 × 239. A minimal variation can be observed in the RMSE and MAPE metrics for the LATC, BGCP, NWLRTC, and BTTF algorithms when the input orientation shifted to 239 × 288 × 1. The incorporation of directional weighting factors in the LRTC-P2TN and NWLRTC algorithms resulted in negligible changes to their RMSE and MAPE values.


