Abstract
The consensus protocol plays a vital role in the performance and security of a specific Distributed Ledger Technology (DLT) solution. Currently, the traditional classification of consensus algorithms relies on subjective criteria, such as protocol families (Proof of Work, Proof of Stake, etc.) or other protocol features. However, such classifications often result in representatives with strongly different characteristics belonging to the same category. To address this challenge, a quantitative data-driven classification methodology that leverages machine learning—specifically, clustering—is introduced here to achieve unbiased grouping of analyzed consensus protocols implemented in various platforms. When different clustering techniques were used on the analyzed DLT dataset, an average consistency of was achieved, while some instances exhibited a match of , and the lowest consistency observed was .
MSC:
68T99; 62H30
1. Introduction
The wide field of DLT has received interest from different subjects, such as academics and businesses, and a plethora of articles and developed platforms have been produced over the past decade (see, e.g., [,,,,,,] and references therein). Blockchain technology, which is a subset of DLT, has generated considerable excitement, particularly in the realms of finance and cryptocurrencies. However, note that while finance is a major area of application for DLT and blockchain, these technologies also find utility in numerous other fields. As an example, DLT has found practical use in healthcare [,], supply chains [,], and the Internet of Things (IoT) [,].
A consensus protocol plays a vital role in the performance and security of a specific DLT solution [,]. Undoubtedly, a notable challenge is the task of classifying the protocols used to establish consensus among network participants to select the most suitable one. This academic challenge arises from the fast-paced development of new proposals and implementations from variegated sources, inducing a non-uniform and accepted standardization, and thus categorization, of the state-of-the-art. A major source of non-alignment in the classification of consensus protocols comes from the subjective study methodologies applied to the analysis of these protocols. Consensus protocols are typically proposed and developed with certain internal structures, such as utilizing a Proof of Stake (PoS) scheme instead of a Proof of Work (PoW) one or being based on the Byzantine Fault Tolerance (BFT) paradigm. However, this categorization is only helpful when considering the type of data submission and validation that is implemented.
In fact, a wealth of literature has been produced on the attempts to classify consensus protocols used in DLT [,,,,,,,]. These works (see Section 2 for an extended presentation) focus on searching different relations and connections between the features of the analyzed protocols to classify them. This requires non-negligible effort from decision makers to find the proper criteria to be employed and data to be analyzed and then interpreted. In particular, the work in [] introduces a quantitative approach to the classification of consensus protocols but requires a set of experts in the field to define the weights to be used by a decision maker for analysis and classification.
To have a clearer understanding of the objectives and limitations of intent for this study, the research questions at the base of this work can be expressed as:
- Can consensus protocols for DLT be consistently classified using a quantitative approach such as machine learning?
- What criteria are essential to effectively characterize the features of a consensus protocol?
- Do the results obtained from this analysis align with those established in the existing literature, or do they reveal new connections and patterns?
Therefore, from these questions, the objective of this research is to develop a methodology that leverages quantifiable data and machine learning techniques to classify consensus protocols utilized in DLT platforms. This approach eliminates the need for investigators to find relations in complex and high-dimensional data, making it unnecessary to involve experts in the initial analysis. It is important to note that a comparable concept was introduced in a previous study [], but the analysis was based solely on categorical variables. On the contrary, this work combines both quantitative and categorical data to standardize the definitions and performance levels of various features that are otherwise vague. Therefore, once the criteria are established and the data are collected, the idea is to cluster the DLT platforms that utilize various consensus protocols. The choice to employ clustering as a machine learning approach is driven by the inherent characteristics of the problem under investigation in this research. In fact, the primary goal is to reduce subjectivity in categorization and reduce dependence on expert evaluations. To achieve this goal, it is essential that categories are extracted directly from the data through unsupervised learning rather than being trained on a predefined set of labels in supervised learning. For instance, results derived from the methodology presented here can reveal connections and similarities not accounted for by classification frameworks leveraging other characteristics, such as the consensus protocol family, i.e., PoW, PoS, BFT, etc. This means that the results obtained from this approach offer a more nuanced understanding, potentially revealing insights not captured by traditional classification methods based on predetermined labels.
The novelty of our approach is to be found in the application of machine learning to consensus protocol clusterization, which is, thus, a novel multi-paradigm protocol classification. To sum up, the main contributions of this work are:
- It reviews the state-of-the-art in terms of consensus protocol classification.
- It analyzes the criteria necessary to build a classification tool based on qualitative and quantitative data on the DLT consensus protocols.
- It proposes a novel data-driven machine-learning-based classification methodology to effectively classify consensus protocols using data available from DLT platforms.
The remainder of the paper is organized as follows. A review of the literature on classification methods for consensus protocols used in DLT is presented in Section 2. The methodology and features used to develop a data-driven consensus protocol classification tool are introduced in Section 3. Afterwards, Section 4 shows how this methodology, applied to a set of 19 popular protocols, gives consistent results and provides novel insight into data-based classification. Finally, Section 5 discusses the results obtained and concludes the work.
2. Related Work
This section presents a brief overview of efforts to classify consensus protocols for DLT. It is a crucial part because it delimits the gap covered by this work, and the criteria used for the clustering in this research are selected based on the information retrieved from the analyzed literature. Indeed, from the study of the criteria used to characterize consensus protocols in different works, it is possible to find a suitable set of criteria to quantitatively describe an arbitrary consensus protocol.
In order to design a classification, the authors of [] compared the main consensus categories and highlighted the potential of vote-based protocols for consortium and private blockchains. The work in [] presented a comparison and classification of consensus protocols based on 16 criteria. They found that most protocols are designed for cryptocurrency systems and smart contract transactions. In [], three design categories of blockchain consensus protocols are analyzed: PoW-based, PoX-based, and hybrid protocols. The authors evaluated the protocols based on 12 criteria and identified research gaps and challenges for future development. The authors of [] conducted a comprehensive review of 11 permissionless PoX schemes, analyzed their characteristics, and investigated the compatibility of incentives and applications in different areas. Based on seven criteria, a taxonomy of 19 consensus methods is provided in []. It is a complete analysis of connections, similarities and differences between consensus protocols. The article in [] reported a review and comparison of 22 consensus protocols based on performance metrics and provided information on their differences, application scenarios, fault tolerances, scalability, drawbacks, and trade-offs. The work [] analyzed 17 consensus protocols from the main body, classified them into mode groups, and evaluated them based on effectiveness, decentralization, and security. The authors also provided recommendations for different scenarios for blockchain applications. The research in [] presents a Multi-Criteria Decision-Making (MCDM) framework to select the best consensus protocols among 18 analyzed for any custom DLT platform according to predefined criteria. This framework provides a quantitative tool to analyze DLT platforms and create a ranking for any arbitrary scenario. Finally, the work in [] uses a concept similar to the one explored in this study. However, the authors employ 14 qualitative criteria (the same as in []), leading to a clustering classification; however, the process was similar to analyzing the data using a benchmarking technique.
In summary, all the reviewed works (see Table 1 for a concise presentation of the literature) proposed different methodologies to classify the existing consensus protocols used in DLT. They mostly classify protocols based on platform analysis and comparison, particularly with regard to existing knowledge of the underlying algorithms (benchmarking). Only in the work [] is the clustering approach considered. However, the cluster analysis was limited. It tended to replicate other classifications from the literature, e.g., [,].

Table 1.
The summary of the literature on consensus protocol classification reviewed for this study. The first column reports the source referred to, the second column indicates the technique used to conduct the analysis, the third column shows the number of protocols/categories analyzed, the fourth column shows the number of criteria, while the last column lists the criteria used in the selected source.
Therefore, our objective is to provide a deeper clustering analysis and explore the suitability of selected clustering algorithms for the available data while attempting quantitative classification of the consensus protocols used in DLT.
3. Methods
In this section, the methodology developed to classify consensus protocols is presented. There are several steps that must be followed to achieve the intended objective of the investigation, which are expressed graphically in Figure 1. However, the main points that the methodology entails are:
- Defining the criteria for evaluating the features used in the analysis;
- Collecting data associated with predetermined features from a chosen set of DLT platforms;
- Implementing machine learning techniques to cluster selected protocols.
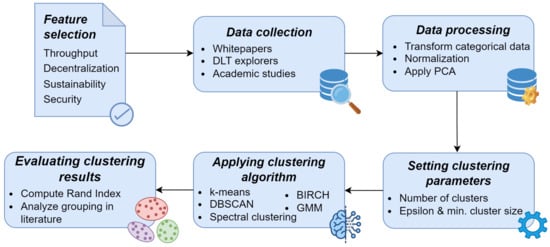
Figure 1.
Representation of the methodology used to conduct this study.
In the following, a more detailed discussion of the steps involved is presented. The selection of features (or criteria) is reported in Section 3.1, where each criterion is defined and described; then, data collection and processing (Section 3.2) are explained; lastly, a presentation of the clustering techniques employed is given (Section 3.3).
3.1. Feature Selection
To effectively describe a DLT platform according to its characteristics, some features must be determined. Using the knowledge acquired from study of the related works, it is possible to determine which criteria might be used to quantitatively describe the features of a consensus protocol. In particular, even when called differently, the selected criteria and metrics are applied in the majority of the considered literature. These features, except for Transaction fees and Reward, were also used in [] as criteria for the definition of an MCDM framework. Therefore, for this work, we consider the criteria (metrics) discussed in the literature and categorized them into four criteria groups: throughput, decentralization, sustainability, and security. For each group, the corresponding metrics are presented briefly below.
- Throughput includes the metrics that are associated with the performance of a distributed system, such as the number of transactions that the system can handle and the response time. In this case, the criteria are defined as:
- Transactions per second (TPS): Number of transactions processed by the DLT platform in a second. This criterion can be computed in different ways, but normally requires an average over a determined range of time.
- Transaction latency: The time that elapses from the submission of a transaction to the ledger and its finalization/validation.
- Finality: Finalization of the consensus (deterministic or probabilistic) that determines the presence of forks in the ledger.
- Decentralization is the group of criteria that measures how much the consensus protocol and the network in which it is used are prone to centralization; it also provides hints about the performance of the system due to the number of participants in the consensus. Specifically, there are two criteria:
- Number of consensus nodes: The number of servers participating in the consensus process;
- Number of network nodes: The number of nodes maintaining an updated copy of the ledger in their own memory.
- Sustainability establishes whether the consensus protocol is energy demanding or requires/prefers some hardware to complete the intended task faster/more efficiently. This is described by the following:
- Power consumption: The level of electric power usage to maintain and run the network;
- Hardware dependency: A Boolean report on the advantages of specialized hardware (e.g., ASICs, GPUs, etc.) in consensus participation.
- Security states the levels of the characteristics associated with safety and fault tolerance. It encompasses the following criteria:
- Fault-tolerance: The maximum percentage of faulty nodes allowed in the network;
- 51% attack: Vulnerability level of a consensus protocol to powerful adversary attacks;
- Double spending: The level of vulnerability of a consensus protocol to the spending of the same tokens several times by acting maliciously.
3.2. Data Collection and Processing
Data collection is a multi-step process that gathers information from various online sources such as whitepapers, DLT explorers, and academic studies [,,]. Sources have been selected according to their relevance and reliability; therefore, the data obtained were compared and analyzed to ensure consistency. In some cases where data were unavailable from primary sources, we had to make estimates based on indirect information or by making an educated guess. The hierarchy utilized as a blueprint to select values related to criteria includes the following sources (in order of importance):
- Whitepaper(s) related to the platform/consensus protocol;
- Review articles in the literature;
- Benchmarks in the literature;
- Mean values from DLT explorers;
- Computation of the mean by using collected instantaneous values from DLT explorer;
- Educated guess by interpolating other information/similarities with other protocols.
Although for most criteria, for example, TPS, latency, number of nodes, etc., the sources listed 1–4 were used, the last point was extensively used to estimate the level of power consumption, resistance to attack, and double spending. Although it is important for data validation to have reliable and referenced data, it would be pedantic and out-of-scope to give the provenience of each value registered in the dataset. This research focuses primarily on establishing and testing a methodology on a sample dataset with the intention of potentially applying it to a larger, more thoroughly referenced dataset.
For this article, data from 19 DLT platforms have been collected (see Table 2): Bitcoin, Ethereum, Ripple, Cardano, Solana, Tron, Avalanche, Cosmos, Monero, Ethereum Classic, Stellar, Hedera Hashgraph, Algorand, EOS, NEO, IOTA, Zilliqa, Arbitrum One, and Polygon. Note that Arbitrum One and Polygon are not DLT platforms on their own, but they are layer-two solutions, which are schemes designed to increase the scalability and security of a main DLT. In this case, both Arbitrum One and Polygon are built on top of Ethereum. The main rationale behind the choice of these 19 DLT platforms is their financial relevance (mainly in terms of the market cap value of their associated cryptocurrency), such that the probability of retrieving relevant data might be bolstered by the abundance of interest in these selected platforms, which, in turn, should lead to studies, tools, and estimations made for the metrics of interest according to the criteria selected for this research.
Table 2.
The set of collected data for the selected DLT platforms.
To reduce the dimensionality of the 10-dimensional dataset, a technique called Principal Component Analysis (PCA) [] is applied to the data. In fact, PCA is a statistical tool used to reduce the dimensionality of a dataset. The main idea is to apply an orthogonal linear transformation that rewrites the data to a new coordinate system in which the variance is preserved. However, because the components of the transformed data are arranged in increasing value of the explained variance of the original dataset, a subset of these components (principal) is enough to describe the features expressed by the data. In this work, for better data visualization, two components in the PCA are considered: resulting in an explained variance of ≈65%.
Due to the sensitivity of PCA to variance deviation, the data in Table 2 must be standardized. In this work, for each feature, a transformation is applied such that the vector of new points, , has a mean of zero and a variance of one, i.e., , where x is a point in the original dataset, the mean of the feature analyzed, and is its standard deviation. Note that some features are categorical or level-based. In these cases, before applying PCA and normalization, the data are mapped to a scale 1–9 and then adjusted according to the data that have to be described, e.g., deterministic and probabilistic finality are mapped onto 1 and 9, respectively, while low, medium, and high for energy consumption are mapped into 1, 5, and 9, respectively.
3.3. Clustering
Cluster analysis can be considered to be an unsupervised machine learning technique to explore data, possibly without prior knowledge. The panorama of data clustering is extensive and rich, with plenty of algorithms [,,,,,,]. Therefore, it is important to choose the tools to use appropriately according to the characteristics of the data of interest.
The dataset employed in this work (see Table 2) has 10 features with a limited number of entries (19 DLT platforms). Some of the features are categorical and their values are not variegated. These observations lead to a few considerations: the dataset is high-dimensional, meaning that some distance metrics (e.g., Euclidean) may behave poorly; all the selected platforms have to be clustered, especially since there is a limited number of data points. Thus, the clustering algorithm cannot discriminate outliers/noise and categorical data, and, in general, homogeneity of the values populating the dataset may lead to zones of high densities of data points, making the clustering susceptible to outliers and a sharp decrease in the density of data.
For instance, five distinct categories of clustering algorithms, each featuring a representative algorithm, were chosen to align with the characteristics of the dataset, as recommended in the relevant literature for high-dimensional data [,]. These algorithmic categories were selected not only for their alignment with the characteristics of the dataset but also as integral components of a comprehensive evaluation of our approach’s feasibility. This research serves as a testbed to assess the suitability of the applied clustering algorithms for the dataset in question. Below is a brief description of the algorithms considered in this study, accompanied by some relevant mathematical details.
- Partitional clustering:
- -means []: This algorithm aims to partition the observations i (where ) into K sets, minimizing the intra-class variance. In other words, once K points are randomly selected in the space as centers of the clusters (centroid), the algorithm computes the distance between each data point and all the centroids, assigning the data point to a cluster when the distance to its centroid is the minimum:Here, is the Euclidean distance, is the i-th data point in S, and is the centroid of the k-th cluster. Furthermore, is a vector with 1s at the positions of points belonging to the cluster k. Then, once all data points have been clustered, there is a recomputing of the cluster centroid. Informally, it is like calculating the center of mass of the cluster:The process iterates until there is no change in the position of the centroids of the clusters or until a maximum number of iterations is reached.
- Hierarchical clustering:
- BIRCH []: This algorithm realizes the clustering result by constructing a clustering feature tree, which is built as a height-balanced-tree data structure. The clustering feature, , is the triple , which summarizes the information maintained on the data. Here, N is the number of data points (); the linear sum of the N data points, i.e., ; and is the square sum of the N data points; i.e., . In this implementation of BIRCH, agglomerative clustering is used to create the actual clusters and label the data points.
- Distribution-based clustering:
- Gaussian Mixture Model (GMM) []: The dataset is modeled using a fixed number of randomly initialized Gaussian distributions, which are iteratively optimized to improve the fit of the dataset.
- Graph-based clustering:
- Spectral clustering []: Clustering is treated as the analysis of a graph represented by the data points using the spectrum of the associated similarity matrix. The idea is to transform the matrix containing the Euclidean distances among points, D, into a similarity matrix by applying a Gaussian kernel of the formwhere is a parameter that is the width of the Gaussian kernel. Then, clustering becomes an eigenvalues/eigenvectors problem, where the first n eigenvectors (n being the number of clusters) of the affinity matrix are a low-dimension embedding of the data features. Clustering is thus done on these features by means of another algorithm, e.g., k-means clustering.
- Density-based clustering:
- DBSCAN []: This algorithm discerns between high- and low-density data points. It clusters together data points that are considered neighbors of the center (called core) of a high-density area, and it detects the presence of noise/outliers. The underlying principle relies on counting the nearby neighbors of each point to determine whether data points in a certain area of the feature plane are to be considered a cluster. Two parameters regulated this selection: (maximum distance in arbitrary metrics at which other points are considered neighbors) and the minimum number of points to be considered a cluster.
It should be noted that all the chosen algorithms except DBSCAN require as input parameters the desired number of clusters or components. Although there are several techniques to determine the optimal number of clusters/components to employ, this specific choice of parameter is often discretionary and subjective. For this study, an estimation of optimal parameters was performed using the silhouette score [,,]. However, it is important to note that this information serves as a guideline rather than a strict rule for selecting the number of clusters/components. Since each clustering algorithm exhibits its unique silhouette score trend by varying the number of clusters, the clustering results were obtained by analyzing a range of clusters (specifically, three, four, and five clusters). As depicted in Figure 2, the silhouette score trend for each clustering algorithm is quite erratic, making it challenging to identify a clear “knee/elbow” point in the plot. The “knee/elbow” signifies a specific point in the silhouette score plot after which the plot is significantly bent (there is a marked variation in the slope). Therefore, the selection of three, four, and five clusters was made for the “number of clusters” parameter to explore the behavior of the clustering algorithms within an interval where potential knees could be observed in the silhouette score plot.
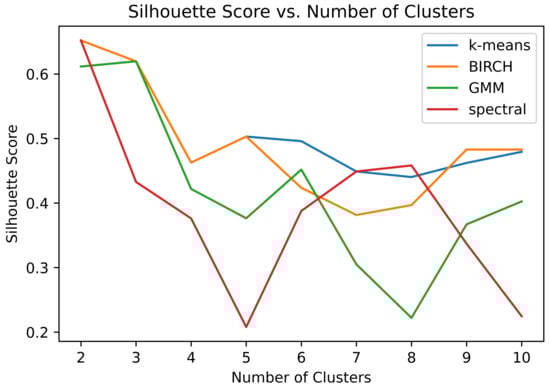
Figure 2.
Silhouette scores for each clustering algorithm using different numbers of clusters. The range of the silhouette scores is from −1 (bad clustering) to 1 (optimal clustering).
Note that the silhouette score is the average over all the data points of the measure
where for each data point, a is the mean intra-cluster distance, and b is the mean nearest-cluster distance. In this way, the silhouette analysis presented in Figure 2 also measures the performance of clustering in terms of minimization of the intra-cluster distance and maximization of the nearest-cluster distance.
For DBSCAN, it instead requires two input parameters: (maximum distance to be considered a neighbor of a core) and the minimum number of elements to be considered a cluster, which is set to 1. To estimate an appropriate value of , the distance between any pair of data points is calculated, the closest neighbor is found for each point, and this collection of distances is sorted. By plotting these values, it might be possible to identify a knee, i.e., a point where the plot changes its behavior abruptly. From the plot (see Figure 3) made with the data in this work, a marked knee is observable at . Using these parameters, the number of clusters determined by the algorithm is three. Note that, in general, DBSCAN indicates points that are considered noise for the dataset. However, in this context, the algorithm did not classify any point as noise; therefore, all the conditions expected for a candidate clustering algorithm are fulfilled.
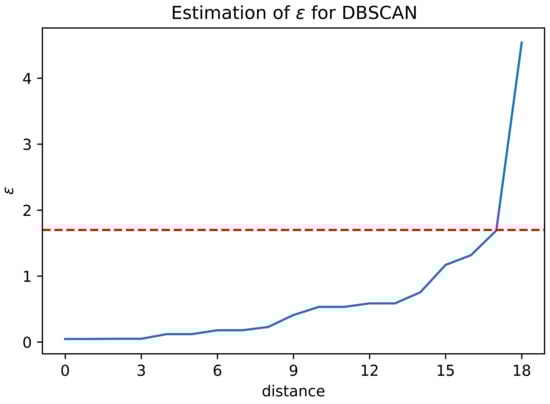
Figure 3.
Estimation of the parameter for DBSCAN. The red dashed line represents the value , which is considered to be a knee in the plot.
Lastly, k-means, GMM, and spectral clustering are sensitive to random initialization of the centers for clustering. To mitigate this and for more consistent results, the initial cluster centers are the average taken over 100 random initialization.
4. Results
This section presents the results of applying clustering in the dataset of DLT platforms using the prescribed methodology. Figure 4, Figure 5, and Figure 6 provide a summary of the clustering results of the consensus protocol with three, four, and five clusters, respectively. Furthermore, Figure 7 illustrates the clustering achieved through the DBSCAN approach, which does not require a predefined number of clusters.
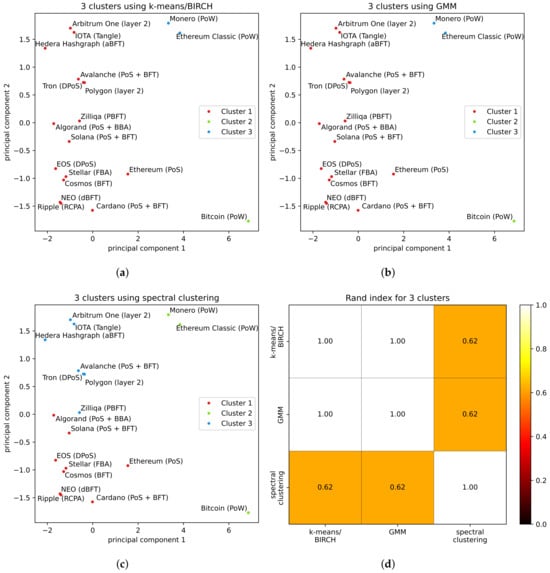
Figure 4.
Clustering of DLT platforms in 3 clusters: (a–c) are results for each clustering algorithm, and (d) is the RI to test the agreement of results among methods.
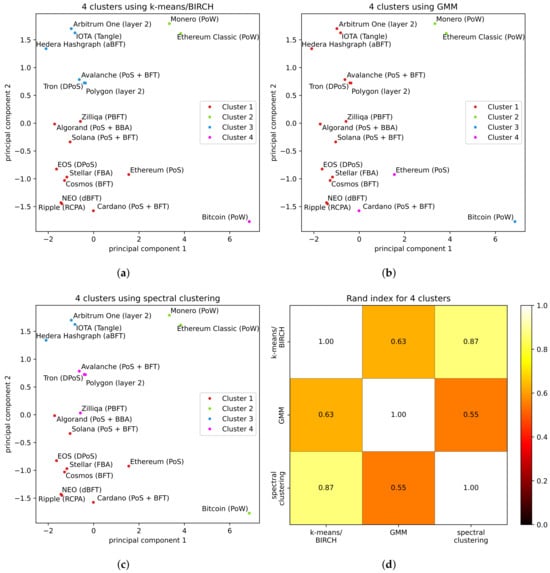
Figure 5.
Clustering of DLT platforms in 4 clusters: (a–c) are results for each clustering algorithm, and (d) is the RI to test the agreement of results among methods.
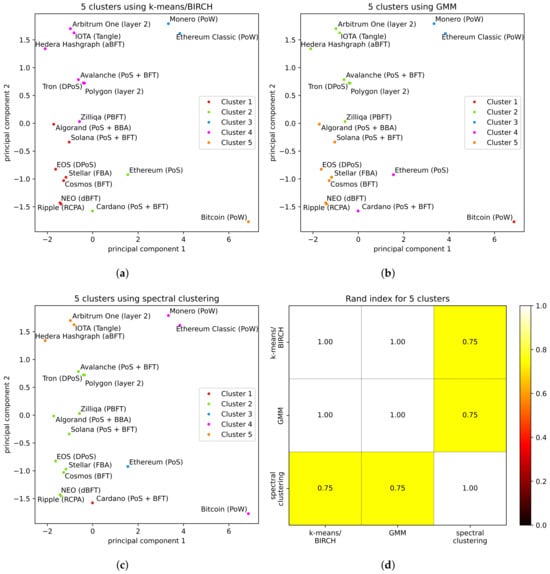
Figure 6.
Clustering of DLT platforms in 5 clusters. (a–c) are results for each clustering algorithm and (d) the to test the agreement of results among methods.
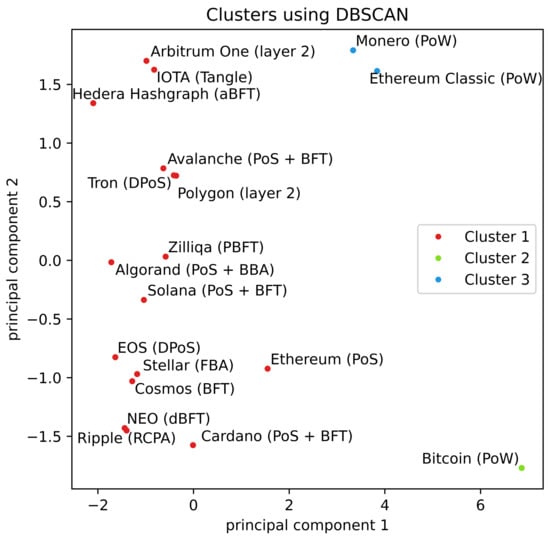
Figure 7.
Clustering of DLT platforms using DBSCAN. The algorithm determined 3 clusters when the parameters were and the minimum number of points to define a cluster was 1.
In the case of Figure 4, we applied four distinct techniques as previously described: k-means, BIRCH, GMM, and spectral clustering. For the other two sets of results, (Figure 5 and Figure 6), the same four techniques—k-means, BIRCH, GMM, and spectral clustering—were utilized in the process. It is worth noting that the clustering results obtained from the application of k-means and BIRCH consistently align, and as such, they are presented together.
The results presented in this study demonstrate consistency when the number of clusters varies and the clustering algorithm remains the same. It must be noted that increasing the number of clusters primarily leads to fragmentation rather than a complete reorganization of the clusters.
Similarly, in terms of comparing results between different clustering algorithms, the clusters obtained from the techniques used exhibit some level of similarity. For instance, in Figure 4, k-means/BIRCH (Figure 4a) and GMM (Figure 4b) give the same three clusters, while spectral clustering (Figure 4c) divides the dataset into one cluster containing platforms implementing PoW (Bitcoin, Monero, and Ethereum Classic) and two other clusters of roughly the same size but without immediate correlation.
However, to quantitatively compare the agreement between the results of different clustering techniques, the Rand Index () [,] can be used. The measures the agreement between different partitions of a set, and it is defined as
The ranges from 0 to 1, where 0 denotes a complete mismatch in the clustering, and 1 indicates that the two partitions are identical. For each number of clusters analyzed, is reported along with the number of actual clusters, specifically: Figure 4d for three clusters, Figure 5d for four clusters, and Figure 6d for five clusters. Note that since the is symmetric with respect to the order of the partitions, the matrices/plots are symmetric. Using the , it is indeed possible to confirm the qualitative observation made beforehand. For example, for each pairwise comparison; therefore, there is at least agreement by using different clustering techniques. Moreover, on average, the agreement among the results from the different clustering algorithms is 78%.
In the scenario with three clusters, the results from the k-means/BIRCH techniques exhibit complete alignment with those of GMM and DBSCAN (). However, spectral clustering results significantly deviate from all other techniques: registering an of .
For the case of four clusters, discrepancies emerge among the results obtained from each technique. In particular, the most considerable difference is observed between spectral clustering and GMM (). In contrast, the least difference is noted between k-means/BIRCH and spectral clustering techniques (), while the index between k-means/BIRCH and GMM is .
Extending to five clusters, the results from the k-means/BIRCH techniques once again align perfectly with GMM (). However, the results of spectral clustering continue to differ from those obtained by all other techniques, with an of .
Finally, clustering using DBSCAN was implemented to test an approach in which the number of clusters should not be known (or guessed) a priori. In fact, as explained in Section 3, DBSCAN does not require investigators to indicate as an input parameter the number of clusters. Rather, it requires the parameters and the minimum number of elements required to create a cluster. In the case of the examined dataset, DBSCAN produced three clusters (see Figure 7). Furthermore, the results are identical to those generated by k-means/BRINCH (Figure 4a) and GMM (Figure 4b). It is important to note that with a larger dataset and greater variability in values, DBSCAN may potentially yield a higher number of clusters.
Lastly, analysis of the performance of the tested clustering algorithms on the presented dataset (see Table 3) shows that spectral clustering leads to weak results (it is, indeed, the algorithm that has the lowest performance in all the cases), while the other algorithms cluster the data reasonably well [].
Table 3.
A compact visualization of the performance (measured as silhouette score) achieved by clustering algorithms for each number of clusters, i.e., 3, 4, and 5 clusters.
An interpretation of the results shown in this article may be related to the type of consensus protocol implemented in the DLT platform. For example, as in the literature, platforms are clustered according to the family of their consensus protocol. Mostly, clustering distinguishes PoW platforms very well (that is, Bitcoin, Monero, and Ethereum Classic) from the rest, as found in other state-of-the-art research where different benchmarking methods are considered, e.g., [,]. At the same time, it is more complicated to clearly determine to which class of consensus protocols the members of the other clusters might belong. Indeed, for cases in which there were three clusters (see Figure 4), it is not possible to distinguish any classification other than PoW against other consensus protocols. Moreover, in the case of spectral clustering, all the PoW entries are clustered together, while in the case of k-means/BIRCH, GMM, and DBSCAN, Bitcoin was assigned to a single-element cluster. This tendency is also confirmed for the cases with four or five clusters (see Figure 5 and Figure 6). However, some other tendencies in the results can be highlighted. Protocols based on Directed Acyclic Graph (IOTA, Avalanche, and Hedera Hashgraph) and layer-two solutions (Arbitrum One and Polygon) are clustered together by k-means, BIRCH, and GMM techniques in all the cases (three, four, and five clusters), while this is true for spectral clustering only in the case with three clusters. Interestingly, in scenarios with four and five clusters, spectral clustering diverges by separating both Directed Acyclic Graph platforms and layer-two solutions into distinct clusters.
Additionally, in the cases with four and five clusters, layer-two solutions are not clustered with their underlying blockchain (Ethereum), meaning that they possess characteristics different from Ethereum’s. This divergence is inherently logical, as these solutions are specifically engineered to enhance Ethereum’s scalability. It is worth noting that as the number of clusters increases, particularly in the case with five clusters, both PoS-based Ethereum and Cardano platforms tend to separate from the other clusters. Lastly, the results obtained by all the techniques examined in all the analyzed cases do not establish clear clustering that distinctively separates protocols implementing BFT-like consensus and PoS, as suggested in the reviewed literature [,,]. This limitation may depend on some factors such as hybrid implementations combining BFT and PoS or network and consensus committee sizes.
It is essential to acknowledge the sensitivity of the proposed methodology to factors such as the number and selection of DLT platforms, rigor in data collection, choice of clustering method, and number of features. In fact, all of these aspects dramatically affect the outcome of the clustering. Specifically, spectral analysis techniques yield divergent results in all analyzed cases, with the quality of these results being lower (see Table 3) compared to other techniques.
Although high sensitivity to these factors could be interpreted as a weakness in the data-driven classification process of consensus protocols, this aspect may actually be an advantage offered by the proposed methodology. The procedure described in this article allows, for instance, full customization and tuning of each component so that different relations between parameters may be discovered.
Regarding the limitations and potential biases associated with this research, we identify two primary sources of bias. First, there is a limitation arising from the scarcity of data in certain criteria, e.g., within the security group. This scarcity introduces subjectivity, requiring expert knowledge to fill data gaps through estimations. The second bias arises from the conversion of qualitative metrics into quantitative values, which is based on the chosen mapping of qualities to numerical representations. This process introduces a potential source of bias based on the selected conversion methodology.
5. Conclusions
This work introduces a machine learning methodology for clustering DLT platforms based on diverse underlying consensus protocols. By incorporating quantifiable criteria and categorical features, the methodology aims to minimize subjective evaluations in the clustering process and automate the classification of consensus protocols to reduce subjectivity. The results demonstrate the methodology’s effectiveness at classifying DLT platforms: revealing patterns such as consistent clustering of protocols with similar characteristics, like their families (e.g., PoW and PoS). Notably, it successfully distinguishes Ethereum from second-layer scalability solutions. Moreover, in instances where the same consensus protocol is employed across platforms for different purposes, as seen with PoS-based Ethereum and its second-layer solutions (Arbitrum One and Polygon), the methodology effectively separates and distinguishes them.
Future developments include the extension of the dataset to a wider number of platforms, deeper analysis and comparison with other cluster algorithms, and alternative machine learning approaches. However, the main goal is the development of an automated tool based on the proposed methodology to cluster and classify novel consensus protocols without the intervention of an investigator. The applications for such an automatic consensus protocol classification are diverse, including helping in the selection of optimal algorithms for blockchain, cryptocurrency, IoT, and financial projects and thus streamlining decision-making processes across various domains. To enhance and expand the utility of the proposed methodology, specific directions could involve refining the tool for industry-specific requirements, incorporating real-time data for more dynamic decision making, and exploring collaborative opportunities with stakeholders in different contexts for tailored applications.
Author Contributions
Conceptualization, M.M., E.F., L.S. and R.P.; methodology, M.M., E.F., L.S. and R.P.; software, M.M.; validation, M.M., E.F., L.S. and R.P.; formal analysis, M.M., E.F., L.S. and R.P.; investigation, M.M., E.F., L.S. and R.P.; resources, E.F., L.S. and R.P.; data curation, M.M.; writing—original draft preparation, M.M.; writing—review and editing, M.M., E.F., L.S. and R.P.; visualization, M.M.; supervision, E.F. and R.P. All authors have read and agreed to the published version of the manuscript.
Funding
This research received funding from the Research Council of Lithuania (LMTLT), agreement No. S-MIP-21-53.
Data Availability Statement
Data underlying this article can be accessed at https://github.com/blockchain-group/CPCML (accessed on 29 November 2023) and used under the Creative Commons Attribution license. The results presented here can be replicated following the prescribed methodology and by means of Python scripts using the scikit-learn library.
Conflicts of Interest
The authors declare no conflicts of interest.
References
- Paulavičius, R.; Grigaitis, S.; Igumenov, A.; Filatovas, E. A Decade of Blockchain: Review of the Current Status, Challenges, and Future Directions. Informatica 2019, 30, 729–748. [Google Scholar] [CrossRef]
- Sunyaev, A. Distributed Ledger Technology. In Internet Computing: Principles of Distributed Systems and Emerging Internet-Based Technologies; Springer International Publishing: Cham, Switzerland, 2020; pp. 265–299. [Google Scholar] [CrossRef]
- Perdana, A.; Robb, A.; Balachandran, V.; Rohde, F. Distributed Ledger Technology: Its evolutionary path and the road ahead. Inf. Manag. 2021, 58, 103316. [Google Scholar] [CrossRef]
- Antal, C.; Cioara, T.; Anghel, I.; Antal, M.; Salomie, I. Distributed Ledger Technology Review and Decentralized Applications Development Guidelines. Future Internet 2021, 13, 62. [Google Scholar] [CrossRef]
- Kannengießer, N.; Lins, S.; Dehling, T.; Sunyaev, A. Trade-Offs between Distributed Ledger Technology Characteristics. ACM Comput. Surv. 2020, 53, 42. [Google Scholar] [CrossRef]
- Lashkari, B.; Musilek, P. A Comprehensive Review of Blockchain Consensus Mechanisms. IEEE Access 2021, 9, 43620–43652. [Google Scholar] [CrossRef]
- Bao, Q.; Li, B.; Hu, T.; Sun, X. A survey of blockchain consensus safety and security: State-of-the-art, challenges, and future work. J. Syst. Softw. 2023, 196, 111555. [Google Scholar] [CrossRef]
- Agbo, C.C.; Mahmoud, Q.H.; Eklund, J.M. Blockchain technology in healthcare: A systematic review. Healthcare 2019, 7, 56. [Google Scholar] [CrossRef]
- Houtan, B.; Hafid, A.S.; Makrakis, D. A Survey on Blockchain-Based Self-Sovereign Patient Identity in Healthcare. IEEE Access 2020, 8, 90478–90494. [Google Scholar] [CrossRef]
- Roeck, D.; Sternberg, H.; Hofmann, E. Distributed ledger technology in supply chains: A transaction cost perspective. Int. J. Prod. Res. 2020, 58, 2124–2141. [Google Scholar] [CrossRef]
- Benčić, F.M.; Skočir, P.; Žarko, I.P. DL-Tags: DLT and smart tags for decentralized, privacy-preserving, and verifiable supply chain management. IEEE Access 2019, 7, 46198–46209. [Google Scholar] [CrossRef]
- Zhu, Q.; Loke, S.W.; Trujillo-Rasua, R.; Jiang, F.; Xiang, Y. Applications of Distributed Ledger Technologies to the Internet of Things: A survey. ACM Comput. Surv. (CSUR) 2019, 52, 1–34. [Google Scholar] [CrossRef]
- Farahani, B.; Firouzi, F.; Luecking, M. The convergence of IoT and distributed ledger technologies (DLT): Opportunities, challenges, and solutions. J. Netw. Comput. Appl. 2021, 177, 102936. [Google Scholar] [CrossRef]
- Singh, A.; Kumar, G.; Saha, R.; Conti, M.; Alazab, M.; Thomas, R. A survey and taxonomy of consensus protocols for blockchains. J. Syst. Archit. 2022, 127, 102503. [Google Scholar] [CrossRef]
- Nguyen, G.T.; Kim, K. A survey about consensus algorithms used in Blockchain. J. Inf. Process. Syst. 2018, 14, 101–128. [Google Scholar] [CrossRef]
- Alsunaidi, S.J.; Alhaidari, F.A. A survey of consensus algorithms for blockchain technology. In Proceedings of the 2019 International Conference on Computer and Information Sciences (ICCIS), Sakaka, Saudi Arabia, 3–4 April 2019; pp. 2–7. [Google Scholar] [CrossRef]
- Bano, S.; Sonnino, A.; Al-Bassam, M.; Azouvi, S.; McCorry, P.; Meiklejohn, S.; Danezis, G. SoK: Consensus in the Age of Blockchains. In Proceedings of the 1st ACM Conference on Advances in Financial Technologies, New York, NY, USA, 21–23 October 2019; pp. 183–198. [Google Scholar] [CrossRef]
- Wang, W.; Hoang, D.T.; Hu, P.; Xiong, Z.; Niyato, D.; Wang, P.; Wen, Y.; Kim, D.I. A Survey on Consensus Mechanisms and Mining Strategy Management in Blockchain Networks. IEEE Access 2019, 7, 22328–22370. [Google Scholar] [CrossRef]
- Nijsse, J.; Litchfield, A. A Taxonomy of Blockchain Consensus Methods. Cryptography 2020, 4, 32. [Google Scholar] [CrossRef]
- Xiao, Y.; Zhang, N.; Lou, W.; Hou, Y.T. A Survey of Distributed Consensus Protocols for Blockchain Networks. IEEE Commun. Surv. Tutor. 2020, 22, 1432–1465. [Google Scholar] [CrossRef]
- Fu, X.; Wang, H.; Shi, P. A survey of Blockchain consensus algorithms: Mechanism, design and applications. Sci. China Inf. Sci. 2021, 64, 121101. [Google Scholar] [CrossRef]
- Filatovas, E.; Marcozzi, M.; Mostarda, L.; Paulavičius, R. A MCDM-based framework for blockchain consensus protocol selection. Expert Syst. Appl. 2022, 204, 117609. [Google Scholar] [CrossRef]
- Aponte, F.; Gutierrez, L.; Pineda, M.; Meriño, I.; Salazar, A.; Wightman, P. Cluster-Based Classification of Blockchain Consensus Algorithms. IEEE Lat. Am. Trans. 2021, 19, 688–696. [Google Scholar] [CrossRef]
- Wold, S.; Esbensen, K.; Geladi, P. Principal component analysis. Chemom. Intell. Lab. Syst. 1987, 2, 37–52. [Google Scholar] [CrossRef]
- Cao, L.; Zhao, Z.; Wang, D. Clustering algorithms. In Target Recognition and Tracking for Millimeter Wave Radar in Intelligent Transportation; Springer: Berlin/Heidelberg, Germany, 2023; pp. 97–122. [Google Scholar]
- Xu, R.; Wunsch, D. Survey of clustering algorithms. IEEE Trans. Neural Networks 2005, 16, 645–678. [Google Scholar] [CrossRef]
- Abbas, O.A. Comparisons between data clustering algorithms. Int. Arab. J. Inf. Technol. (IAJIT) 2008, 5, 320–325. [Google Scholar]
- Rokach, L. A survey of clustering algorithms. In Data Mining and Knowledge Discovery Handbook; Springer: Berlin/Heidelberg, Germany, 2010; pp. 269–298. [Google Scholar]
- Celebi, M.E. (Ed.) Partitional Clustering Algorithms; Springer International Publishing: Cham, Switzerland, 2015. [Google Scholar] [CrossRef]
- Rodriguez, M.Z.; Comin, C.H.; Casanova, D.; Bruno, O.M.; Amancio, D.R.; Costa, L.d.F.; Rodrigues, F.A. Clustering algorithms: A comparative approach. PLoS ONE 2019, 14, e0210236. [Google Scholar] [CrossRef] [PubMed]
- Xu, D.; Tian, Y. A comprehensive survey of clustering algorithms. Ann. Data Sci. 2015, 2, 165–193. [Google Scholar] [CrossRef]
- Mittal, M.; Goyal, L.M.; Hemanth, D.J.; Sethi, J.K. Clustering approaches for high-dimensional databases: A review. Wiley Interdiscip. Rev. Data Min. Knowl. Discov. 2019, 9, e1300. [Google Scholar] [CrossRef]
- Alam, A.; Muqeem, M.; Ahmad, S. Comprehensive review on Clustering Techniques and its application on High Dimensional Data. Int. J. Comput. Sci. Netw. Secur. 2021, 21, 237–244. [Google Scholar]
- MacQueen, J. Some methods for classification and analysis of multivariate observations. In Proceedings of the Fifth Berkeley Symposium on Mathematical Statistics and Probability; University of California: Oakland, CA, USA, 1967; Volume 1, pp. 281–297. [Google Scholar]
- Zhang, T.; Ramakrishnan, R.; Livny, M. BIRCH: An efficient data clustering method for very large databases. ACM Sigmod Rec. 1996, 25, 103–114. [Google Scholar] [CrossRef]
- Rasmussen, C. The infinite Gaussian mixture model. In Advances in Neural Information Processing Systems 12 (NIPS 1999); The MIT Press: Cambridge, MA, USA, 2020. [Google Scholar]
- Ng, A.; Jordan, M.; Weiss, Y. On spectral clustering: Analysis and an algorithm. In Advances in Neural Information Processing Systems 14 (NIPS 2001); The MIT Press: Cambridge, MA, USA, 2002. [Google Scholar]
- Ester, M.; Kriegel, H.P.; Sander, J.; Xu, X. A Density-Based Algorithm for Discovering Clusters in Large Spatial Databases with Noise. In Proceedings of the Second International Conference on Knowledge Discovery and Data Mining, Portland, OR, USA, 2–4 August 1996; AAAI Press: Washington, DC, USA, 1996; pp. 226–231. [Google Scholar]
- Rousseeuw, P.J. Silhouettes: A graphical aid to the interpretation and validation of cluster analysis. J. Comput. Appl. Math. 1987, 20, 53–65. [Google Scholar] [CrossRef]
- Shutaywi, M.; Kachouie, N.N. Silhouette analysis for performance evaluation in machine learning with applications to clustering. Entropy 2021, 23, 759. [Google Scholar] [CrossRef]
- Shahapure, K.R.; Nicholas, C. Cluster quality analysis using silhouette score. In Proceedings of the 2020 IEEE 7th International Conference on Data Science and Advanced Analytics (DSAA), Sydney, NSW, Australia, 6–9 October 2020; pp. 747–748. [Google Scholar]
- Rand, W.M. Objective criteria for the evaluation of clustering methods. J. Am. Stat. Assoc. 1971, 66, 846–850. [Google Scholar] [CrossRef]
- Hubert, L.; Arabie, P. Comparing partitions. J. Classif. 1985, 2, 193–218. [Google Scholar] [CrossRef]
- Struyf, A.; Hubert, M.; Rousseeuw, P. Clustering in an Object-Oriented Environment. J. Stat. Softw. 1997, 1, 1–30. [Google Scholar] [CrossRef]
Disclaimer/Publisher’s Note: The statements, opinions and data contained in all publications are solely those of the individual author(s) and contributor(s) and not of MDPI and/or the editor(s). MDPI and/or the editor(s) disclaim responsibility for any injury to people or property resulting from any ideas, methods, instructions or products referred to in the content. |
© 2024 by the authors. Licensee MDPI, Basel, Switzerland. This article is an open access article distributed under the terms and conditions of the Creative Commons Attribution (CC BY) license (https://creativecommons.org/licenses/by/4.0/).