Abstract
In this paper, we suggest using a partial randomized response model using Poisson distribution to efficiently estimate a rare sensitive attribute by applying the probability proportional to size (PPS) sampling method when the population is composed of several different and sensitive clusters. We have obtained estimators for a rare and sensitive attribute and their variances and variance estimates by applying PPS sampling and two-stage equal probability sampling. We compare the efficiency between the estimators of the rare sensitive attribute, one obtained via PPS sampling with replacement and the other obtained using the two-stage equal probability sampling with replacement. As a result, it is confirmed that the estimate obtained via the PPS sampling with replacement is more efficient than the estimate provided by the two-stage equal probability sampling with replacement when the cluster sizes are different.
Keywords:
Poisson distribution; partial randomized response model; rare sensitive attribute; cluster sampling; probability proportional to size (PPS) sampling MSC:
62D05
1. Introduction
In a socially and personally very sensitive survey, if you directly ask a question to the respondents, they tend to refuse to answer or give a false answer. To solve this problem, ref. [1] proposed a randomized response model (RRM) that could obtain sensitive information while protecting the identity or confidentiality of the respondent through an indirect response using a randomization device. Since then, many researchers have suggested various randomized response models to improve the quality of estimation.
Subsequently, refs. [2,3,4] organized, summarized and systematized the randomized response models, ref. [5] applied two-stage cluster sampling to a randomized response model, and ref. [6] researched improving the practicality of randomized response model by suggesting a randomized response model using PPS sampling. Meanwhile, the authors of [7] suggested a unrelated question randomized response method to estimate the mean number of participants with a rare sensitive attribute using Poisson distribution. Examples of rare sensitive attributes include the proportion of people with AIDS who have persistent relationships with strangers, the proportion of people who witnessed murders, and the number of girls raped by their own fathers, etc. and examples of rare unrelated attributes include the proportion of people born correctly at 12 o’clock, the proportion of babies born blind, and the proportion of triplets delivered by women [8,9] suggested a stratified two-stage randomized response models for estimating a rare sensitive attribute under Poisson distribution.
Furthermore, ref. [10] proposed a partial randomized response model using Poisson distribution, providing an alternative approach to estimating rare sensitive attributes through simple random estimation and stratified estimation. Their model demonstrated higher efficiency compared to Suman and Singh’s model. However, this research also faces limitations when applied to actual surveys if the population is clustered. Therefore, when the population is clustered, it is expected that applying Narjis and Shabbir’s model, which is more efficient than Suman and Singh’s model, could offer a practical solution for estimating rare sensitive attributes in real surveys.
In this study, we proposed a method for estimating rare sensitive attributes when the survey question is highly sensitive, and the population is composed of clusters with varying sizes. We applied the probability proportional to the size sampling method, which assigns sampling probabilities in proportion to the size of the clusters, to the partial randomized response model of [10]. In Section 2, we first introduced the partial randomized response model and proposed estimation methods using Probability Proportional to Size (PPS) with replacement, PPS without replacement, and two-stage equal probability sampling. In Section 3, we compared the efficiency of the estimation methods, and finally, in Section 4, we presented conclusions and implications of the study.
2. PPS Estimation for a Rare Sensitive Attribute by Partial Randomized Response Model
In Section 2, when the survey questions are very sensitive and the population is composed of N clusters that each contains sub-units, a two-stage selection method is used, in which n clusters are selected with PPS or with equal probability from the population, and then survey units are selected through simple random sampling in each selected cluster, which is applied to the partial randomized response model using the Poisson distribution proposed by [10] to deal with the method of estimating a rare sensitive attribute.
In Section 2.1, we reviewed Narjis and Shabbir’s Partial randomized response model and then we considered the sampling method for the clusters via PPS sampling with replacements in Section 2.2. Clusters by PPS sampling without replacement are considered in Section 2.3, and clusters by equal probability sampling are examined in Section 2.4.
2.1. Narjis, Shabbir’s Partial Randomized Response Model
In the partial randomized response model, a sample of size n is selected via simple random sampling with replacement from the population. An individual is selected from the sample using two randomization devices and is requested to report his/her response as per following outcomes of the devices.
The first-stage randomization device consists of the following statements:
- (1)
- I have the sensitive attribute A with probability T.
- (2)
- Go to the randomization device with probability T.
The second-stage randomization device consists of the following statements:
- (1)
- I have the sensitive attribute A.
- (2)
- Forced to say No.
- (3)
- Draw one more card.
With probabilities , and respectively, .
If the statement (3) appears on the card of the respondent, then it is necessary to carry out the process without replacing the card. In the second draw, if statement (3) reappears, then the respondent is suggested to report his/her actual status. The respondent should answer the question with s “Yes” (or “No”), if his/her actual status matches (un-matches) with the statement on the card.
The probability of getting a “Yes” from the respondent is given by:
where k is the total number of cards in the randomization device .
As before, assuming that and , then (finite). Equation (1) can be rewritten as
Let be a random sample of n observations from the Poisson distribution with parameter .
The maximum-likelihood estimator of is given by:
The variance of the estimator is given by:
2.2. Estimation by PPS When PSUs Are Selected with Replacement
Suppose n primary sampling units (PSUs) of size have been selected from the population of N clusters with selection probability with replacement and the secondary sampling units (SSUs) of size are selected from each chosen primary unit using SRSWR. We apply the two-stage sampling procedure to Narjis and Shabbir’s partial randomized response model to estimate a rare sensitive attribute. Each person selected via the two-stage sampling procedure is requested to answer “Yes” or “No” using Narjis and Shabbir’s randomization device such as Table 1 and Table 2 for each First and Second randomization device in ith cluster.

Table 1.
First stage randomization device .
Table 2.
Second stage randomization device .
If Question 3 in randomization device appears on the card of the respondent, then it is necessary to select a card repeatedly in without replacing the card. In the second draw, if Question 3 reappears, then the respondent is suggested to report his/her “Yes” or “No”, according to his/her true response to the sensitive question.
From First and Second randomization devices, is the selection probability of a rare sensitive question in randomization device for the ith cluster, is the population proportion of a rare sensitive attribute for the ith cluster, and is the selection probability of a rare sensitive question in randomization device for the ith cluster. And is the selection probability of the forced answer “No” in randomization device , is the selection probability of the statement “Draw one more cards” in randomization device for the ith cluster, and is the number of cards in the card deck of randomization device for the ith cluster.
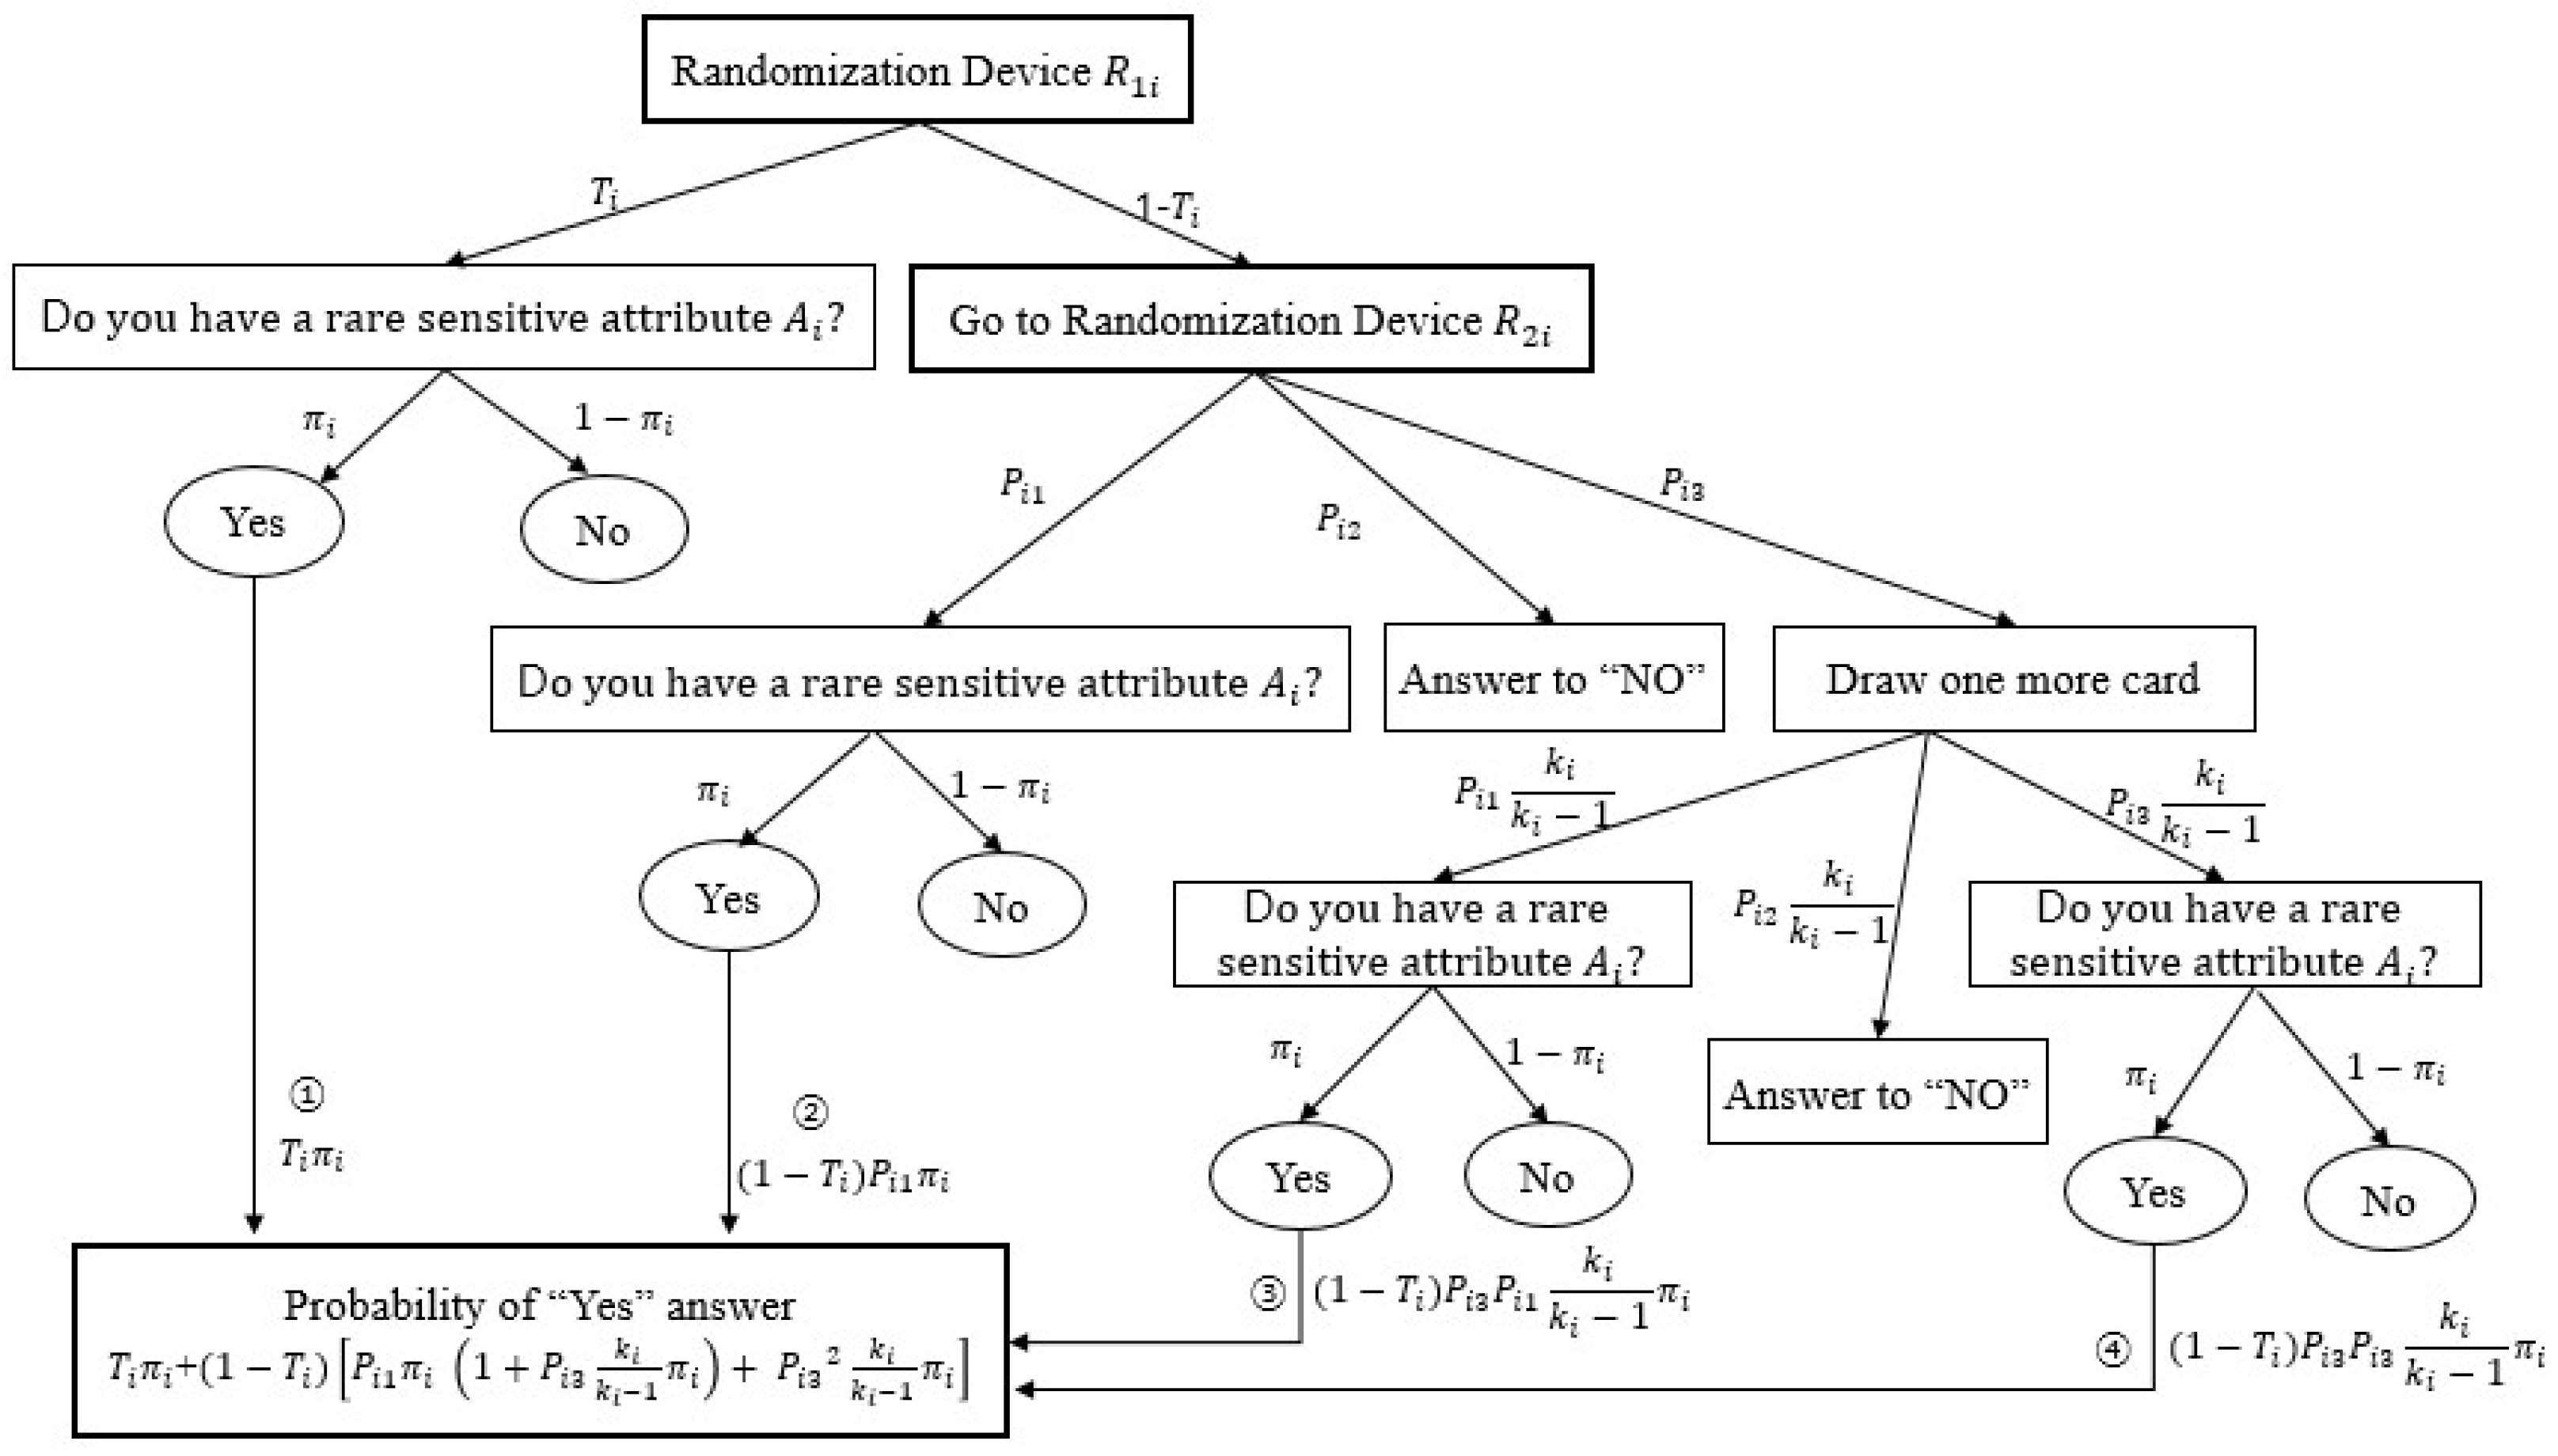
The probability of answering “Yes” from the respondent in cluster i is given by
To clarify the response process, we presented a flow chart for the probability of answering “Yes” for ith cluster in Figure 1.
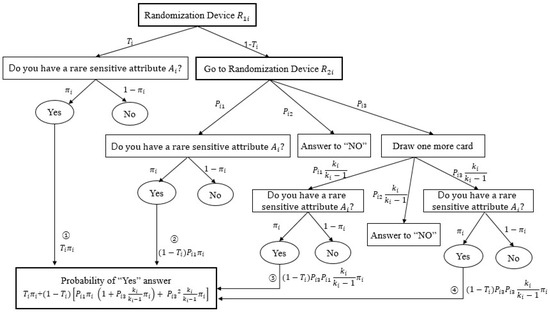
Figure 1.
Response flow using partial randomization device for the ith cluster.
Since the attribute in cluster i is very rare in the population, if we assume and , then (finite).
Let be a random sample of observations from the Poisson distribution with parameter in cluster i, then the estimator of , the parameter of a rare sensitive attribute of cluster i, is given by
When respondents are selected via simple random sampling with replacement from the ith cluster, which was selected with replacement using sampling probability for the estimator of , the parameter of a rare sensitive attribute is given by:
where .
Theorem 1.
The estimator is an unbiased estimator of the parameter λ.
Proof.
Since for each cluster and
We have
where
we can obtain
□
Theorem 2.
The variance of is given by
Proof.
By [11], we have
where
and
Because , we have
Thus, we determine the variance of as shown in (8). □
Also, the estimator of is given by
On the other hand, when the sampling probabilities of n PSUs are proportional to each cluster size , then , which is called PPS sampling. When a sample of n PSUs are selected via PPS sampling with replacement and SSUs are selected using simple random sampling with replacement from each PSU, the estimator of is as follows
And the variance of and its estimator are, respectively,
and
2.3. Estimation by PPS When PSUs Are Selected without Replacement
Suppose n PSUs of size have been selected from the population of N clusters with selection probability without replacement and the SSUs of size are selected from each chosen primary unit via SRSWR. We apply the two-stage sampling procedure to Narjis and Shabbir’s RRT to estimate a rare sensitive attribute.
The estimator of , the parameter of a rare sensitive attribute obtained using the above sampling procedure is given by
where is the inclusion probability of survey unit i.
And the variance of is given by:
where is the joint inclusion probability of survey units i and j.
Also, the estimator of is given by
2.4. Estimation via Two-Stage Equal Probability Sampling
Suppose n PSUs of size have been selected from the population of N clusters by SRSWR and the SSUs of size are selected again from each chosen PSU via SRSWR. We consider the two-stage equal probability sampling procedure for Narjis and Shabbir’s RRT for estimating a rare sensitive attribute. The estimator of , the parameter of a rare sensitive attribute, obtained using the above procedure is given by
where .
and
where .
3. Efficiency Comparisons for the PPS vs. Equal Probability Sampling
Narjis and Shabbir’s RRT model was developed under the assumption of simple random sampling and stratified random sampling, and the efficiency thereof was compared with that of the estimators [9]. Therefore, it is reasonable to compare the existing estimator with the estimator proposed in this paper using Narjis and Shabbir’s model. However, in the case of cluster sampling, the increase in variance compared to that obtained using simple random sampling or stratified sampling has already been dealt with in the typical sampling textbooks, so in this paper, as described above, when the population consists of N clusters, we consider the case the PPS with replacement estimator and two-stage equal probability estimator.
Now, the difference between the variance (17) of two-stage equal probability sampling and the variance (11) of PPS with replacement sampling is given as follows under
In (19), if then . In other words, if the cluster sizes are equal, the selection probability of PPS sampling with replacement becomes and is equal to that of two-stage equal probability sampling with replacement. Hence, they have the same efficiency.
If each cluster size is unequal, the values of first term of the right-hand side in (19) are much increased, and the values of the second term of the right-hand side in (19) have relatively small ones. Hence, the estimation using PPS sampling with replacement is more efficient than that of two-stage equal probability sampling with replacement.
We tabulate to summarize the relationship for each estimator in a cluster sampling design as follows.
Now, we compare the efficiency by calculating relative efficiencies (RE) between different sampling methods, such as simple random sampling with replacement (:ppzwr), PPS sampling with replacement (:ppswr) and two-stage equal probability sampling with replacement (:wr) according to varying parameter combinations by numerical example.
The values of greater than one means that unequal probability sampling with replacement (:ppzwr) is more efficient than two-stage equal probability sampling with replacement (:wr), greater than one means that PPS sampling with replacement (:ppswr) is more efficient than unequal probability sampling with replacement(:ppzwr), and greater than one means that PPS sampling with replacement (:ppswr) is more efficient than two-stage equal probability sampling with replacement(:wr).
In calculating REs, we set parameters for ith cluster as follows.
- 10,000; ; ; ; ,
- ; ; ; ; ,
- ;
- , , , ;
- ;
- , , .
We also assume the selection probabilities for ith cluster as follows.
- ;
- ,
varying from 0.2 to 0.8 by 0.2.
In order to compare the efficiency of the proposed estimators from numerical examples, we summarized the relative efficiencies according to various parameter values with their mean values.
From Table 3, it can be seen that for all the parametric combinations, the mean values of are greater than one, which indicates that the unequal probability sampling with replacement estimator is more efficient than the two-stage estimator, , as the sensitive attribute value decreases, and in contrast, if sensitive attribute increases, then the efficiency of decreases. In addition, the variation in with respect to indicates that the increases as the values of selection probability increase.
Table 3.
The relationship between different estimators for cluster sampling.
As shown in Table 4, the probability proportional to size estimator, , is more efficient than the unequal probability sampling with replacement estimator, . As the sensitive attribute value increases, and in contrast, as decreases, the probability proportional estimator decreases in efficiency.
Table 4.
The mean values of for vs. .
As shown in Table 5, the probability proportional to size estimator, , is more efficient than the two-stage sampling with replacement estimator, . As the sensitive attribute value decreases, and in contrast, as decreases, the probability proportional estimator decreases in efficiency.
Table 5.
The mean values of for vs. .
In summary, an examination of the efficiency of a partial randomized response model for rare sensitive attributes based on a cluster sampling design with numerical examples shows the following trends:
- (1)
- Between and , efficiency decreases as a rare sensitive attribute increases (refer to Table 4).
- (2)
- Between and , efficiency increases as increases, and efficiency is relatively low at specific values of (refer to Table 5).
- (3)
- Between and , efficiency increases as decreases, similar to the relation between and , where efficiency sharply increases at specific values of (refer to Table 6).
Table 6. The mean values of for vs. .
- (4)
- The number of cards does not significantly impact efficiency.
4. Conclusions
In this paper, when the population is composed of several different and sensitive clusters, we suggest a randomized method for efficiently estimating a rare sensitive attribute by applying the PPS sampling method to the partial randomized response model of [10]. And by applying PPS sampling and two-stage equal probability sampling, estimators for a rare and sensitive attribute and its variance and variance estimates are obtained. We compare the efficiency between the estimators of the rare sensitive attribute, one obtained using the PPS with replacement sampling method and the other obtained using the two-stage equal probability sampling with replacement method when the cluster sizes are different. As a result, it was confirmed that the estimation obtained using the PPS sampling with replacement is more efficient than the estimation obtained based on the two-stage equal probability sampling with replacement when the cluster sizes are different from each other.
Author Contributions
Conceptualization, G.-S.L.; methodology, C.-K.S.; writing—original draft preparation, K.-H.H.; writing—review and editing, C.-K.S.; project administration and funding acquisition, G.-S.L. All authors have read and agreed to the published version of the manuscript.
Funding
This paper was supported by Woosuk University.
Data Availability Statement
Data are contained within the article.
Acknowledgments
We would like to thank the anonymous reviewers for their very careful reading and valuable comments/suggestions.
Conflicts of Interest
The authors declare no conflicts of interest.
References
- Warner, S.L. Randomized response: A survey technique for eliminating evasive answer bias. J. Am. Stat. Assoc. 1965, 60, 63–69. [Google Scholar] [CrossRef] [PubMed]
- Fox, J.A.; Tracy, P.E. Randomized Response: A Method for Sensitive Survey; Sage Publications: Newbury Park, CA, USA, 1986. [Google Scholar]
- Chaudhuri, A.; Mukerjee, R. Randomized Response: Theory and Techniques; Marcel Dekker, Inc.: New York, NY, USA, 1988. [Google Scholar]
- Ryu, J.B.; Hong, K.H.; Lee, G.S. Randomized Response Model; Freedom Academy: Seoul, Republic of Korea, 1993. [Google Scholar]
- Lee, G.S.; Hong, K.H. Randomized response model by two-stage cluster sampling. Korean Commun. Stat. 1998, 5, 99–105. [Google Scholar]
- Lee, G.S. A Study on the Randomized Response Technique by PPS Sampling. Korean J. Appl. Stat. 2006, 19, 69–80. [Google Scholar]
- Land, M.; Singh, S.; Sedory, S.A. Estimation of a rare sensitive attribute using Poisson distribution. Statistics 1965, 46, 351–360. [Google Scholar] [CrossRef]
- Lee, G.S.; Hong, K.H.; Son, C.K. A stratified two-stage unrelated randomized response model for estimating a rare sensitive attribute based on the Poisson distribution. J. Stat. Theory Pract. 2016, 10, 239–262. [Google Scholar] [CrossRef]
- Suman, S.; Singh, G.N. An ameliorated stratified two-stage randomized response model for estimating the rare sensitive parameter under Poisson distribution. Statistics 2019, 53, 395–416. [Google Scholar] [CrossRef]
- Narjis, G.; Shabbir, J. An efficient partial randomized response model for estimating a rare sensitive attribute using Poisson distribution. Commun. Stat. Theory Methods 2021, 50, 1–17. [Google Scholar] [CrossRef]
- Cochran, W.G. Sampling Techniques, 3rd ed.; John Wiley and Sons: New York, NY, USA, 1977. [Google Scholar]
Disclaimer/Publisher’s Note: The statements, opinions and data contained in all publications are solely those of the individual author(s) and contributor(s) and not of MDPI and/or the editor(s). MDPI and/or the editor(s) disclaim responsibility for any injury to people or property resulting from any ideas, methods, instructions or products referred to in the content. |
© 2024 by the authors. Licensee MDPI, Basel, Switzerland. This article is an open access article distributed under the terms and conditions of the Creative Commons Attribution (CC BY) license (https://creativecommons.org/licenses/by/4.0/).