Abstract
Competition in China’s electric vehicle industry has intensified significantly in recent years. The production mode of power batteries, serving as the pivotal component in these vehicles, has emerged as a critical challenge for electric vehicle manufacturers. We considered a system comprising an electric vehicle (EV) manufacturer with power battery production technology and another EV manufacturer lacking power battery production technology. In the context of carbon trading policy, we constructed and solved Cournot competitive game models and asymmetric Nash negotiation game models in the CC, PC, and WC modes. We examined the decision-making process of electric vehicle manufacturers regarding power battery production modes and carbon emission reduction strategies. Our research indicates the following: (1) The reasonable patent fee for power batteries and the wholesale price of power batteries can not only compensate power battery production technology manufacturers for the losses caused by market competition but can also strengthen the cooperative relationship between manufacturers. (2) EV manufacturers equipped with power battery production technology exhibit higher profitability within the framework of a perfectly competitive power battery production mode. Conversely, manufacturers lacking power cell production technology demonstrate greater profitability when operating under a more collaborative power cell production mode. (3) Refraining from blindly persisting with and advocating for carbon emission reduction measures is advisable for manufacturers amidst rising carbon trading prices.
MSC:
91-10
1. Introduction
To address both the oil energy crisis and mitigate the greenhouse effect, nations worldwide are actively engaged in promoting and developing electric vehicles. China has consistently maintained its position as the global leader in electric vehicle sales for six consecutive years, with projections surpassing 80 million units by 2030 [1]. However, power batteries, which constitute a vital component of electric vehicles, account for approximately 30–40% of the overall vehicle cost. The primary reason for the excessive production costs lies in the limited mastery of battery manufacturing core technology by most electric vehicle (EV) manufacturers. The substantial production costs not only erode manufacturers’ profit margins but also present significant impediments to the advancement of the electric vehicle industry chain [2]. Therefore, it is imperative to establish a comprehensive and efficient power battery production model in order to effectively achieve cost reduction and efficiency enhancement in the manufacturing sector of electric vehicles.
In order to address the aforementioned issues, certain electric vehicle manufacturers choose to procure power batteries from reputable suppliers such as Ningde Times and LG Chemical. For instance, car manufacturers, such as Honda and Ford, procure power batteries from Ningde Times, an independent supplier that has seen its market share experience a rapid surge. The intensification of competition within the electric vehicle industry value chain has significantly impacted the market share of BYD, prompting them to revise their initial strategy of vertically integrating power battery production and marketing. Since 2021, BYD has been extensively supplying power batteries to its competitors [3]. The power battery supply strategy of BYD encompasses two primary approaches: Firstly, BYD engages in wholesale price contracts to provide power batteries to rival electric vehicle manufacturers such as Tesla, Ford, Changan, and FAW Hongqi. Furthermore, BYD indirectly supplies power batteries to automakers such as Ssangyong Motor and Toyota [4]. This strategic shift in the power battery supply approach of BYD signifies a heightened diversification of power battery production modes within the electric vehicle industry. Consequently, the relationship between different automotive companies has transitioned from mere competition to a symbiotic blend of collaboration in power battery supply and rivalry within the terminal market. This intricate interplay adds complexity to decision-making processes and raises an inquiry into the optimal battery production modes that should be adopted by electric vehicle manufacturers. From an intuitive standpoint, while electric vehicle manufacturers may implement competitive strategies around power batteries, for new energy vehicle manufacturers (such as BYD) that sell power batteries and license power battery technology patents, cooperation on power batteries can increase profits for electric vehicle manufacturers and reduce R&D costs. However, when two competitive EV manufacturers cooperate on power batteries, decision making becomes more complex. It is worth exploring what kind of cooperative production mode of power batteries (patent cooperation/wholesale cooperation) should be adopted. The collaboration among EV manufacturers in power batteries can enhance enterprise competitiveness through increased revenue and reduced costs. However, when competitors seize market share from EV manufacturers, different modes of power battery cooperation will have varying impacts on EV manufacturers. Therefore, it is crucial to explore the choice of production mode for EV manufacturers’ power batteries.
By 2023, Tesla’s revenue from the sale of credits reached nearly USD 9 billion, with its sales of carbon credits in China alone amounting to USD 390 million, surpassing more than half of its net profit recorded last year [5]. With the rapid expansion of the global economy, there has been a substantial surge in carbon emissions. In order to facilitate the transition towards cleaner transportation, nations are implementing market-based mechanisms to provide subsidies for new energy vehicle enterprises. Consequently, a global carbon emission trading system has gradually emerged [6], enabling enterprises to freely engage in the exchange of government-established carbon emission quotas [7]. Manufacturers that surpass their allocated emissions limit must either procure credits from companies possessing surplus allowances, such as Tesla, or face substantial penalties. As China continues to witness persistent growth in the production and sales of new energy vehicles, the sustainability of large-scale financial subsidy policies has become questionable. The proposed plan underscores the primacy of market forces in resource allocation and proposes exploring effective integration between financial subsidies and the carbon trading market [8]. Consequently, the Chinese government has consistently adjusted its policies and will phase out the subsidy program for new energy vehicles by 2023, implementing a market-driven “dual carbon credits management system” instead. This statement indicates a transition in China’s new energy vehicle development from being policy-driven to market-driven. In this context, automakers are compelled to invest in clean technologies and enhance processes such as production, inventory management, and transportation with the aim of reducing carbon emissions. By doing so, enterprises can not only benefit from savings in carbon credits but also face increased operational costs. Therefore, determining how to strategically invest in carbon reduction technology to maximize benefits has become an essential factor influencing enterprises’ operational decisions.
The implementation of carbon trading policies will exert a significant influence on the production decisions of electric vehicle manufacturers, as power batteries play a pivotal role in the manufacturing and production process of electric vehicles. Therefore, it is crucial for electric vehicle manufacturers to meticulously consider their choice of power battery production mode and make well-informed decisions regarding carbon emission reduction strategies in light of the impact of carbon trading policies.
- In the face of a complex, competitive landscape, electric vehicle manufacturers must meticulously evaluate their choice of power battery production mode;
- What influence will carbon trading policies exert on electric vehicle manufacturers’ decisions regarding power battery production?
- How do electric vehicle manufacturers optimize profit by making decisions about carbon reduction strategies and power battery production modes?
To investigate these practical issues, we analyzed three power cell production modes employed by two competing electric vehicle (EV) manufacturers. In CC mode, Manufacturer 1 independently produces power batteries while Manufacturer 2 procures them from third-party vendors. Both manufacturers solely compete in the EV end market. Under the PC mode, the two manufacturers collaborate upstream through patent licensing contracts for power battery technology and compete in the electric vehicle end market. In WC mode, manufacturers cooperate through wholesale price contracts for power batteries and also compete in the EV end market. By constructing a Cournot competition model and an asymmetric Nash negotiation model, we derived the equilibrium solutions for each mode and investigated the impact of different production modes on the equilibrium outcomes. Furthermore, we examined how electric vehicle manufacturers’ negotiation power, degree of vehicle substitution, and differences in power battery costs influence their choices regarding power battery production strategies and carbon emission reduction strategies within the context of a carbon trading policy. Several interesting results were obtained.
Firstly, in terms of power battery production mode, manufacturers equipped with power cell production technology are more profitable within the CC mode, while those lacking this technology benefit most from the PC mode. In PC mode, manufacturers possessing power battery production capabilities will increase their royalty fees as vehicle substitution intensifies. The impact of vehicle substitution on patent entry fees depends on the manufacturer’s bargaining power. Within the WC mode, manufacturers with power battery production technology experience a decrease in wholesale prices as vehicle substitution increases. Furthermore, regarding the competition in the electric vehicle market. Under the CC mode, competing manufacturers will engage in a price war by reducing the prices of electric vehicles. Following their collaboration on power batteries, both manufacturers will subsequently increase the prices of electric vehicles, resulting in both having the highest price under the WC mode. As vehicle substitution intensifies, manufacturer profits are expected to decline across different modes. Thirdly, the impact of carbon trading policy: Within the coopetition framework (PC and WC modes), manufacturers employing power cell production technology exhibit higher reductions in carbon emissions, with the highest level achieved under the WC mode. Conversely, manufacturers lacking power battery production capabilities experience greater carbon emission reductions under the CC mode.
Compared to the existing body of research, this paper presents the following novel contributions: (1) We introduce a coopetition approach to patent licensing in the field of power battery technology, thereby expanding the production mode for electric vehicle manufacturers. Previous studies primarily focused on inter-manufacturer competition and the selection of wholesale competitive and cooperative strategies. (2) This paper investigates the collaboration among competitive electric vehicle manufacturers in the upstream sector, with a specific focus on the power battery production mode. However, within conventional supply chains, coopetition primarily takes place between middle and downstream enterprises across different supply chains. (3) The existing literature primarily examines the impact of power battery recycling modes on manufacturers’ efforts to reduce emissions. However, there is limited research available regarding the influence of electric vehicle manufacturers’ battery production modes on carbon emission reduction strategies within the context of carbon trading policies.
The subsequent sections of this paper are organized as follows: Section 2 provides a comprehensive review of the literature; in Section 3, a description of the problem and the model hypothesis are presented. The research modes, namely Mode CC, Mode PC, and Mode WC, are expounded upon and analyzed in Section 4. Furthermore, the equilibrium solutions are deduced and analyzed. Section 5 presents quantitative analyses of the carbon trading price, extent of vehicle substitution, and manufacturers’ bargaining power. Finally, Section 6 discusses the managerial implications and draws conclusions.
2. Literature Review
This paper is mainly related to three streams of research in the literature: (1) research on power batteries within the supply chain, (2) the selection of a manufacturer’s coopetition strategy, and (3) the influence of carbon trading policies on carbon emission reduction. In this section, we review the related research in each stream.
2.1. Research on Power Batteries within the Supply Chain
In the realm of power battery supply chain research, the predominant focus among scholars lies in the selection of power battery recycling modes and their consequential impact. For instance, Zhang et al. [9] developed six recycling models and incorporated a reward and punishment mechanism, encompassing the recycling activities of electric vehicle manufacturers, electric vehicle retailers, and third-party enterprises, as well as their pairwise cooperation. The findings revealed that the partnership between manufacturers and retailers yielded the highest actual recycling rate and overall welfare. The optimal pricing and recycling decisions of three dual-channel recycling modes were compared by Li [10]: EV manufacturer and EV retailer recycling, EV manufacturer and third-party recycling, and EV retailer and third-party recycling. It was found that the dual-channel recycling mode of an EV retailer and a third party is optimal when there is a high intensity of recycling competition and significant economies of scale effects for third parties. Sun et al. [11] developed three recycling models, namely manufacturer recycling, retailer recycling, and mixed recycling, demonstrating that different recycling channels do not exert any influence on the wholesale price, retail price, and market demand of power batteries in the forward supply chain. In terms of the echelon utilization of power batteries, the influence of government subsidies on the echelon utilization of retired power batteries was investigated by Gu et al. [12], who constructed a two-stage supply chain model for battery echelon utilization, comprising battery manufacturers, echelon users, and the government. Ioakimidis et al. [13] conducted a scenario analysis to investigate the environmental benefits of cascade utilization in intelligent buildings for lithium iron phosphate battery applications, revealing significant advantages in terms of battery production alternatives. Based on the scenario model and market data, Jiang et al. [14] projected the quantity and economic benefits of discarded power batteries in China over the next two decades. Through analysis, it was determined that the disassembly and recycling of these metal raw materials following echelon energy storage would yield greater economic advantages.
Through a comprehensive review of the relevant literature, the majority of scholars have directed their attention towards the recycling and utilization of power batteries. However, a limited number of studies have begun to explore the production mode of power batteries within the supply chain. For instance, Wang et al. [15] investigated the optimal decision-making process for supply chain members in two different production modes of power batteries while considering the impact of R&D subsidies on suppliers’ technological innovation. To further advance research in this field, this study investigates the power battery production mode choice of electric vehicle manufacturers under the influence of carbon trading policies.
2.2. The Selection of a Manufacturer’s Coopetition Strategy
Regarding research on the selection of manufacturers’ competition and cooperation strategy, some scholars concentrate on the vertical competition and cooperation relationship between manufacturers and upstream and downstream enterprises. For instance, Liu et al. [16] investigated the choice of OEM sales formats by considering a supply chain consisting of original equipment manufacturers (OEMs), contract manufacturers, and online platforms. Yang et al. [17] employed the concept of concurrence and the Cournot competition model to analyze the optimal distribution strategy of suppliers with limited supply capacity. By establishing a Cournot competition model, Wang et al. [18] investigated the strategic choices of original equipment manufacturers and contract manufacturers under three different game scenarios.
Some other scholars have examined the competitive and cooperative relationship among horizontally competing manufacturers. For instance, Zhang et al. [19] investigated the impact of a carbon tax mechanism on the business and product strategies of two competing manufacturers. Dong et al. [20] discovered that both wholesale competition–cooperation and self-development strategies can benefit manufacturers facing competitive disadvantages, while those with a competitive advantage are more inclined to choose the competition–cooperation strategy. Lin et al. [21] examined how manufacturers select competition and cooperation strategies in two competitive supply chains comprising suppliers, manufacturers, and retailers, respectively.
The existing literature primarily focuses on the coopetition strategy of downstream enterprises in the supply chain, whereas this paper specifically examines the strategic decision-making process regarding the production modes of power batteries among competing EV manufacturers situated upstream in the supply chain.
2.3. The Influence of Carbon Trading Policies on Carbon Emission Reduction
Researchers have examined the impact of carbon policies on carbon emission reduction, taking into account consumers’ environmental consciousness in relation to carbon quota trading. For instance, Wang et al. [18] employed a differential game analysis to examine the strategies and contracts of supply chain members, considering factors such as carbon quota trading and consumers’ inclination towards low-carbon products. In a longitudinal study, Xia et al. [22] investigated the decision-making processes and performance outcomes of a manufacturer and retailer under three different scenarios, incorporating consumers’ awareness of sustainable practices and social preferences.
Moreover, other scholars have directed their attention towards devising emission reduction strategies specifically tailored for manufacturing enterprises operating within carbon cap trading systems. For instance, Yang et al. [23] investigated remanufacturing supply chains supervised by carbon cap trading mechanisms, wherein recycling operations are conducted by manufacturers, retailers, or third-party entities. Their findings demonstrated that remanufacturing effectively enhances the level of carbon reduction. Wang and Wu [1] proposed an integrated decision-making model that combines centralized and decentralized approaches, aiming to optimize carbon trading strategies by considering investments in carbon emission reduction and three distinct recycling modes. The findings suggest that the active involvement of manufacturers in recycling initiatives leads to the most effective reduction in emissions outcomes. Shi et al. [24] employed a differential approach to investigate the influence of carbon quotas and trading prices on emission reduction, revealing that historical emissions yield optimal outcomes. The objective of Zhao et al. [25] was to examine an equilibrium strategy by considering carbon emissions allocation within the framework of carbon trading.
2.4. Research Gaps
The existing literature primarily investigates the decision making of manufacturers engaged in downstream coopetition within the supply chain, whereas this paper examines the selection of coopetition strategies among electric vehicle manufacturers in their upstream activities pertaining to power battery production. While numerous studies have explored power batteries within the realm of supply chain research, most of the cited literature predominantly focuses on recycling and cascade utilization, with a limited investigation into power battery production mode strategies. The literature closely related to this paper is Zhu’s [2] research, which primarily examines whether EV manufacturers capable of producing power batteries supply them to their competitors. However, this paper not only considers the scenario where competitive EV manufacturers engage in wholesale coopetition based on wholesale price contracts for power batteries but also explores the situation where these two manufacturers engage in patent coopetition based on patent licensing agreements for power batteries.
Furthermore, despite the extensive research conducted on the impact of carbon trading policy on carbon emission reduction by numerous scholars, there is a scarcity within the literature of material that considers both power batteries and carbon trading in the supply chain. The existing literature primarily focuses on carbon trading and battery recycling [26,27,28]. This paper contributes to the field by incorporating manufacturer behavior towards reducing carbon emissions under the carbon trading policy into the selection of their optimal production strategy, thereby significantly enhancing research on power batteries within the supply chain. Table 1 provides an overview of the novelty of this work.

Table 1.
The novelty of this work.
3. Problem Description and Assumptions
Given the high technical barriers in power battery production and the limited number of electric vehicle manufacturers possessing this technology [29,30], as well as the complexity of the real situation, this study considers a supply chain system consisting of two competing electric vehicle (EV) manufacturers, where “Manufacturer 1” has power battery production technology and “Manufacturer 2” lacks power battery technology. Under the carbon cap and trade policy, manufacturers first receive carbon allowances from the government and later reduce carbon emissions by implementing green technologies during the operational phase. If there is a surplus of carbon credits, the manufacturer can sell additional credits on the carbon exchange for a profit; otherwise, it needs to buy additional carbon credits.
We propose three production modes of power batteries: (1) The two manufacturers only have a competitive relationship in the electric vehicle market, in which Manufacturer 2 purchases power batteries at from non-competitive battery suppliers, Manufacturer 1 produces power batteries at , and the two manufacturers independently select carbon emission reduction level, , and vehicle output, (i.e., Mode CC). The relationship structure is depicted in Figure 1a. (2) The two manufacturers have a cooperative relationship in the form of a patent license contract for power battery technology in upstream activities, and there is a competitive relationship in the electric vehicle market. Specifically, Manufacturer 2 obtains the license of power battery technology from Manufacturer 1 by paying a patent entry fee, , and patent royalty fee, , to Manufacturer 1. Both manufacturers independently produce power batteries at , while selecting their respective carbon emission reduction level, , and vehicle output, (i.e., Mode PC). The relationship structure is depicted in Figure 1b. (3) The two manufacturers have a cooperative relationship in the form of a power battery wholesale price contract in upstream activities, and there is a competitive relationship in the electric vehicle market. Specifically, Manufacturer 2 procures power batteries from Manufacturer 1 at wholesale price , while Manufacturer 1 produces power batteries at . Additionally, both manufacturers independently determine the carbon emission reduction level, , and their respective vehicle output, (i.e., Mode WC). The relationship structure is depicted in Figure 1c.
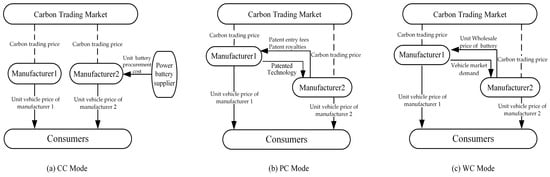
Figure 1.
Structure diagram of the supply chain modes.
Assumption 1.
Let the initial carbon emission of the manufacturer be assumed as , and let represent the total carbon emission of manufacturer after implementing measures to reduce carbon emissions. The manufacturer’s total income, which is derived from the carbon trading market, is denoted as , where represents the carbon quota of the electric vehicle manufacturer and signifies the carbon trading price. Given the primary focus of this study on the role of carbon emission reduction levels within the carbon trading market, for the sake of brevity and clarity, it is assumed in this paper that [31]. The manufacturer ’s carbon abatement investment cost is a quadratic function of the carbon abatement level, specifically [32].
Assumption 2.
The overall cost of an electric vehicle comprises two components: the power battery cost (denoted as ) and other associated costs (referred to as ). Given Manufacturer 1‘s autonomous expertise in battery production technology, it is postulated that [33]. Furthermore, given the focus of this paper on the influence of disparities in battery costs on decision-making processes within the electric vehicle (EV) industry, it is assumed that all other expenses associated with manufacturing the vehicles by both manufacturers remain constant.
Assumption 3.
The electric vehicles (EVs) produced by Manufacturer 1 and Manufacturer 2 are considered as perfect substitutes, implying that the prices of their respective vehicles are jointly determined by their EV output [34]. The manufacturer’s inverse demand function [35] is as follows:
where and . In this study, denotes the highest market price for electric vehicles (EVs). denotes the level of substitution between the electric vehicles manufactured by the two companies, with reflecting their degree of product substitution in terms of features and specifications [36]. An increased degree of substitution often leads to heightened market competition.
4. Model Developments and Analysis
4.1. The Model
4.1.1. Mode CC
In Mode CC, Manufacturer 1 produces its own power batteries and Manufacturer 2 purchases its batteries from a third-party merchant. Manufacturers 1 and 2 only compete in the electric vehicle market and maximize their own profits by independently and simultaneously selecting the carbon emission reduction level , and vehicle output . The Cournot competition model is constructed. Manufacturer 1’s and Manufacturer 2’s profits are calculated as follows:
where denotes the overall benefit accrued by manufacturer through carbon emission reduction measures under the carbon trading policy. represents the investment cost associated with their efforts to reduce carbon emissions.
Because the Hessian matrix is negative definite, we can obtain as a concave function with respect to and . According to the first-order derivative condition, we can obtain the optimal , , , and .
Proposition 1.
In Mode CC, the optimal equilibrium solutions of manufacturers are shown as follows (see Appendix A for proof):
Substituting the optimal solutions into the Equations (1)–(3) derives the optimal vehicle prices and profits of the manufacturers:
The presence of the optimal solution of the model is ensured, and . The optimal solutions need to meet , and .
4.1.2. Mode PC
In Mode PC, manufacturers cooperate in the form of a patent license contract for power battery technology in upstream activities (that is, Manufacturer 1 licenses the battery production technology to Manufacturer 2) and compete in the electric vehicle market. The decision sequence of manufacturers 1 and 2 is as follows: (1) The two manufacturers first determine the patent entry fee and patent royalty fee of power battery technology through negotiation; (2) the manufacturers then independently and simultaneously select vehicle output and carbon reduction level to maximize their own profits. Manufacturer 1’s and Manufacturer 2’s profits are calculated as follows:
We consider that the manufacturer’s bargaining power varies due to the supply and demand relationship in the power battery market and the difference in production capacity. Following the literature [37], we introduced parameter to measure the bargaining power of Manufacturer 1, and we constructed an asymmetric Nash negotiation game model. Therefore, the Cournot competition game and the asymmetric Nash negotiation game were used to construct the multi-stage game model in Mode PC as follows:
Because the Hessian matrix is negative definite, we can obtain the expression of , through optimizing Formulas (8) and (9). Then, we substitute the expression into Formula (10). Again, because the Hessian matrix is negative definite, we can obtain as a concave function with respect to , . Finally, we can obtain the optimal solutions , , , , and .
Proposition 2.
In Mode PC, the optimal equilibrium solutions of manufacturers are shown as follows (see Appendix A for proof):
Substituting the optimal solutions into Equations (1), (8) and (9) derives the optimal vehicle prices and profits of manufacturers.
4.1.3. Mode WC
In Mode WC, manufacturers contract the wholesale price of power batteries in the upstream production activities of the supply chain (that is, Manufacturer 2 purchases power batteries from rival Manufacturer 1). There is a competitive relationship in the electric vehicle market. The decision sequence of Manufacturer 1 and 2 is as follows: (1) the two manufacturers determine the wholesale price of power batteries through negotiation; (2) Manufacturer 2 sets its vehicle production and carbon reduction levels according to the number of power batteries purchased from Manufacturer 1 to maximize its own profits; (3) Manufacturer 1 sets vehicle output and carbon emission reduction level according to Manufacturer 2‘ s decision to maximize its own profit. Manufacturer 1’s profit is calculated as follows:
Similarly, Manufacturer 2’s profit is calculated as follows:
Assuming that Manufacturer 1’s negotiation power is , we can model the negotiation process of the wholesale price for the Mode WC as follows:
In reality, the wholesale price of power batteries being higher than their production cost is one of the necessary conditions for the two manufacturers to carry out Mode WC. To ensure , Manufacturer 1‘s bargaining power needs to meet and .
By using backward induction, we can obtain the expression of , through optimizing Formula (16). Because the Hessian matrix is negative definite, we can obtain the expression of , through optimizing Formula (17). Then, we substitute the expression into , . Again, because the Hessian matrix is negative definite, we can obtain as a concave function with respect to . Finally, we can obtain the optimal solutions , , , and .
Proposition 3.
In Mode WC, the optimal equilibrium solutions of the manufacturers are shown as follows (see Appendix A for proof):
Substituting the optimal solutions into the Equations (1), (16) and (17) derives the optimal vehicle prices and profits of the manufacturers:
4.2. Equilibrium Analysis
Corollary 1.
For the different modes, the impact of parameter (i.e., ) on price is as follows (see Appendix A for proof):
(i) Mode CC:
If , then ; if , then ; ;
(ii) Mode PC:
If , then ; if , then ;
(iii) Mode WC:
If when , then ; when , then ; If when , then ; when , then .
Corollary 1(i) demonstrates that in CC Mode, when the disparity in battery costs among manufacturers falls below a certain threshold, the vehicle price of Manufacturer 1 decreases as the degree of substitution increases. In highly competitive market environments, manufacturers with advantages in power battery production often resort to price reductions if their cost advantage is not significant. As a less dominant power battery producer, Manufacturer 2 consistently lowers its vehicle price as the level of substitution intensifies. When the manufacturer possesses a clear cost advantage in battery production, it can partially mitigate the pressure of price wars resulting from market competition. The power battery serves as the cornerstone of electric vehicle manufacturing; thus, manufacturers should focus on discerning the disparities in power cell production costs among competitive merchants and their impact on market competition. Furthermore, manufacturers ought to enhance control over power battery production costs.
Corollary 1(ii) demonstrates that, within the PC mode, when the carbon trading price falls below the threshold, Manufacturer 1’s car price becomes directly proportional to the extent of EV substitution. Manufacturer 1 possesses autonomous capability in power battery production, thereby indirectly reducing its EV manufacturing costs. Furthermore, leveraging patented technology associated with power cell production supplied to Manufacturer 2 can yield certain advantages for Manufacturer 1. Even amidst intensified competition and appropriate adjustments made to vehicle sales prices, Manufacturer 1 still maintains a competitive edge over Manufacturer 2. Manufacturer 2 strategically adjusts its pricing strategy to minimize losses and ensure basic market survival by reducing prices when the carbon trading price is low, owing to the high production cost of its vehicles. Consequently, variations in both the carbon trading price and the extent of vehicle substitution significantly impact the manufacturer’s chosen pricing approach. Corollary 1(iii) demonstrates that the influence of EV substitution on the manufacturer’s vehicle price in Mode WC is contingent upon the bargaining power of Manufacturer 1. When Manufacturer 1’s bargaining power falls below a certain threshold, its vehicle price will decrease proportionally to the level of vehicle replacement. Therefore, within the WC mode, EV manufacturers should consider factors such as market competition levels, the dynamics of bargaining power, and inter-manufacturer cooperation to appropriately adjust overall vehicle pricing.
The aforementioned analysis underscores the imperative for manufacturers to bolster their research and development efforts in power battery technology, aiming to establish a competitive edge in production. Conversely, electric vehicle manufacturers should actively foster distinctive brand characteristics and enhance their premium capabilities to mitigate any substitution risks arising from competing products. Huawei’s collaboration with automotive companies, coupled with Jihu 360’s research on smart vehicle safety, has significantly propelled the implementation of intelligent connected vehicles across diverse scenarios. Furthermore, the introduction of the “Look Up” series by BYD effectively bridges the existing gap in the domestic high-end luxury electric vehicle market.
Corollary 2.
For Mode WC, the impact of parameters (i.e., ) on the wholesale price of power batteries is as follows (see Appendix A for proof): .
Corollary 2 demonstrates a negative relationship between Manufacturer 1’s wholesale price of power batteries and the extent of EV substitution. This finding can be easily comprehended as an adaptive strategy employed by Manufacturer 1 to mitigate competitive pressures and sustain cooperative relationships amidst intensified market competition. Consequently, manufacturers possessing power battery production technology have the ability to manipulate inter-manufacturer cooperation through adjustments in the wholesale price of power batteries.
Corollary 3.
For different modes, the impact of parameters (i.e., ) on carbon reduction level is as follows (see Appendix A for proof):
(i) Mode CC:
; .
(ii) Mode PC:
, .
(iii) Mode WC:
If , then ; when , if , then ; if , then .
Corollary 3(i) and (ii) demonstrate that in the CC and PC modes, both manufacturers experience an increase in carbon emission reduction levels as the carbon trading price rises. This conclusion can be comprehended easily. As active participants in the carbon trading process, new energy vehicle enterprises tend to enhance their profitability by selling carbon emission allowances. With a surge in carbon prices, manufacturers will allocate more resources toward implementing strategies for reducing emissions to pursue greater financial gains.
Corollary 3(iii) indicates that the carbon emission reduction level of Manufacturer 1 increases with the carbon trading price when it falls below a certain threshold. In WC Mode, Manufacturer 1 produces more high-carbon emission component-power batteries. It is noteworthy that EV manufacturers, as new energy enterprises, possess advantages in carbon trading and can earn substantial returns even if deep carbon abatement measures are not implemented, but only when the carbon trading price reaches a sufficiently high level. When Manufacturer 2 possesses limited bargaining power, it faces a disadvantage in co-sourcing battery production from Manufacturer 1, and the cost of carbon abatement investment for Manufacturer 2 outweighs the benefits derived from an increase in carbon trading prices. According to the aforementioned analysis, although electric vehicle (EV) manufacturers enjoy advantages in the realm of carbon trading, this does not imply that an increase in carbon trading prices will inevitably result in a continuous promotion of efforts towards carbon emissions reduction. Manufacturers need to integrate both the carbon trading price and their bargaining power to facilitate informed judgments regarding the necessity for the further implementation of carbon emission reduction measures.
Corollary 4.
For the different modes, the impact of parameters (i.e., ) on the aggregate production of vehicles and the equilibrium outcomes of the two manufacturers (compared) are as follows (see Appendix A for proof):
(i) Mode CC:
; if , then ; if , then ; .
(ii) Mode PC:
; ; .
(iii) Mode WC:
If when , then when , then ; if , then ; if , then . If , then ; if , then .
The negative correlation between Manufacturer 1’s EV output and the degree of whole-vehicle substitution, as demonstrated by Corollary 4(i), leads to a definitive conclusion. The continuous erosion of Manufacturer 1’s market share can be attributed to intensifying market competition. When the disparity in power cell production costs surpasses a specific threshold, there will be proportional variations in Manufacturer 2’s output based on the level of substitution and vice versa. Manufacturer 1 possesses core technological advantages in the realm of power battery production. In CC Mode, Manufacturer 1 consistently outperforms Manufacturer 2 in terms of electric vehicle (EV) output. Given the variations in power battery production costs within the EV industry, EV manufacturers must promptly adjust their output and enhance marketing strategies and after-sales services to mitigate industry homogeneity. Corollary 4(ii) demonstrates that an increase in the degree of vehicle substitution in PC Mode leads to a corresponding decrease in the output of the EV manufacturer. Manufacturer 1 consistently surpasses Manufacturer 2 regarding total vehicle production.
The impact of the degree of whole-vehicle substitution on the manufacturer’s EV output under Mode WC, as demonstrated by Corollary 4(iii), is contingent upon the manufacturer’s bargaining power. This implies that enhancing manufacturers’ bargaining power can partially mitigate the decline in vehicle production resulting from intense market competition. Furthermore, the magnitude of EV production among competing manufacturers also hinges on their respective levels of bargaining power. If the bargaining power of Manufacturer 1 exceeds the threshold, its EV output will surpass that of Manufacturer 2. Conversely, if the bargaining power of Manufacturer 1 falls below the threshold, Manufacturer 2 will exhibit a higher level of EV output. The aforementioned analysis suggests that manufacturers with greater bargaining power are more likely to dominate the electric vehicle market. To enhance their bargaining power, EV manufacturers should optimize the production processes within the supply chain, such as power cell manufacturing.
Corollary 5.
For Mode PC, the impact of parameters (i.e., ) on the patent entry fee and royalty fee of power battery technology are as follows (see Appendix A for proof):
(i) If , then ; if , then ;
(ii) .
The findings of Corollary 5 demonstrate that the impact of substitution degree on patent entry fees for power battery technology is contingent upon the bargaining power of Manufacturer 1. When Manufacturer 1 possesses bargaining power above a critical threshold, an increase in EV substitution degree results in a decrease in patent entry fees for battery technology. In scenarios where Manufacturer 1 wields strong bargaining power and competition among EV manufacturers intensifies, there will be a moderate reduction in patent entry fees. The rationale behind this is that in the face of intense market competition and Manufacturer 1’s strong bargaining power, Manufacturer 2 finds itself at a disadvantage. To ensure that Manufacturer 2 continues to opt for this power battery production mode and pays the patent fee to Manufacturer 1, the latter reduces the patent entry fee. Consequently, this fosters a consolidated cooperative relationship between manufacturers. Concurrently, the patent royalty of Manufacturer 1 will escalate in proportion to the degree of substitution by electric vehicles. As competition among electric vehicle manufacturers intensifies, Manufacturer 1 will moderately augment its patent royalty fee to compensate for profits lost due to rivalry with Manufacturer 2.
The aforementioned analysis demonstrates that both patent entry fees and royalty fees not only enhance the profitability of patent providers, but also foster a more stable collaborative relationship among manufacturers.
5. Numerical Analysis
5.1. Optimal Solutions and Comparative Analysis
By consulting relevant works in the literature, we set and let vary from 1 to 5 with an increment of 2 in different . The impact of parameter changes on the carbon emission reduction level and the manufacturer’s vehicle price are presented in Table 2 and Table 3.
Table 2.
Impact of parameter changes on the carbon emission reduction level.
Table 3.
Impact of parameter changes on the manufacturer’s vehicle price.
By comparing the carbon emission reduction levels of manufacturers under different modes (refer to Table 2), it is evident that the coopetition modes (Mode PC and Mode WC) exhibits a propensity for enhancing the carbon emission reduction level of Manufacturer 1, with Mode WC yielding the highest level of carbon emission reduction among all other modes for Manufacturer 1. The coopetition modes, however, may impede the extent of carbon emission reduction by Manufacturer 2. The rationale behind this is that Manufacturer 1 can frequently enhance its revenue through the coopetition modes, thereby enabling greater financial resources for investment in carbon emission reduction and anticipating higher returns from the carbon trading market. However, in the coopetition modes, Manufacturer 2 is obligated to remunerate Manufacturer 1 for patent rights or procure power batteries in bulk, thereby augmenting its financial burden to a certain extent. Consequently, Manufacturer 2 anticipates optimizing expenditure by reducing the magnitude of carbon emission reduction and its corresponding investment in carbon emission mitigation.
Based on the aforementioned analysis, manufacturers can strive to enhance their bargaining power to proactively navigate market competition and collaboration. Manufacturers should not blindly pursue carbon emission reduction solely for the purpose of maximizing profits in the carbon trading market. Instead, they should holistically consider their own financial circumstances to mitigate the potential risks of financial strain. Particularly for manufacturers lacking power battery production technology, it is advisable to curtail the implementation of carbon emission reduction measures within the coopetition production mode.
By comparing the vehicle prices of manufacturers across different modes (as shown in Table 3), it becomes evident that the coopetition strategy (Mode PC and Mode WC) induces all manufacturers to opt for price increases, with Mode WC resulting in the highest respective vehicle prices among manufacturers . In Mode CC, manufacturers engage in a purely competitive relationship where they strategically initiate price reductions to maximize their individual profits and gain market share. After the implementation of the coopetition strategy, manufacturers engage in collaborative production processes for power batteries, thereby mitigating the competitive dynamics among them to a certain extent. The increase in the selling price of both parties positively impacts the marginal revenue of power batteries, thereby highlighting that the benefits derived from cooperation surpass those attained through competition. Specifically, Manufacturer 1 generates higher revenue through patent licensing fees or power cell sales, while Manufacturer 2 can utilize power cells employing the same technology as Manufacturer 1 albeit incurring certain costs.
Based on the aforementioned analysis, an increase in the selling price of the manufacturer’s vehicle can effectively enhance the overall profitability, thereby promoting a mutually beneficial outcome for electric vehicle manufacturers. The increase in vehicle prices, however, poses a detrimental impact on consumers and is likely to exert a negative influence on the market demand for electric vehicles.
By comparing the manufacturer’s profit under different modes (refer to Table 4), it is evident that the coopetition strategy (Mode PC and Mode WC) exerts an inhibitory impact on the profit of Manufacturer 1, while Mode CC yields the highest profit for Manufacturer 1. As previously mentioned, Manufacturer 1 exhibits the lowest carbon emission reduction level in CC mode, indicating a comparatively lower investment cost for carbon emission reduction within this framework. Furthermore, only Manufacturer 1 possesses power battery production technology in CC mode, resulting in its least expensive power battery production costs and product homogeneity levels. Consequently, Manufacturer 1 attains the highest profit margin under CC mode. The profit of Manufacturer 2, however, surpasses that of other manufacturers in Mode PC . Through Mode PC, Manufacturer 2 can achieve cost parity with Manufacturer 1 in the production of power batteries, thereby enhancing the market competitiveness of electric vehicles manufactured by Manufacturer 2. However, this entails payment of a certain patent fee.
Table 4.
Impact of parameter changes on manufacturer profits.
Based on the aforementioned analysis, electric vehicle (EV) manufacturers lacking power cell production technology exhibit superior profits within a cooperative competitive environment, whereas those possessing power cell production technology attain maximum profits in a state of perfect competition. The optimal battery production strategy varies between these two manufacturers. In order to achieve a “win-win” situation among EV manufacturers, it is imperative to establish a well-designed battery production cooperation mechanism among manufacturers. From the perspective of production mode, electric vehicle (EV) manufacturers equipped with power cell production technology tend to achieve higher profitability in a perfectly competitive power cell production mode. Conversely, manufacturers lacking power cell production technology may experience greater profitability within a more collaborative power cell production framework.
5.2. Effects of Carbon Trading Price on Vehicle Pricing
By consulting relevant works in the literature, we set and let vary from 1 to 5. The impact of parameter changes on the manufacturer’s vehicle price are presented in Figure 2.
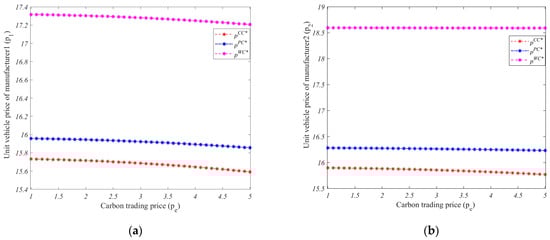
Figure 2.
The influence of carbon trading prices on the pricing of vehicles manufactured. (a) Manufacturer 1. (b) Manufacturer 2.
The findings indicate that, in general, the influence of carbon trading prices on vehicle prices for manufacturers is not statistically significant. However, a slight decrease in manufacturer vehicle price can be observed when the carbon trading price is high. Given the potential advantages of carbon trading for manufacturers, they may opt to pass on these benefits to consumers through appropriate reductions in vehicle prices, thereby maximizing their market gains. Compared to Manufacturer 2, the influence of carbon trading prices on the product pricing of Manufacturer 1 is more pronounced. This disparity primarily stems from Manufacturer 1‘s advantageous position in power battery production, as power batteries constitute a major source of carbon emissions during electric vehicle manufacturing. Consequently, Manufacturer 1 has made concerted efforts in decision making regarding carbon emission reduction and, thus, possesses a competitive edge in carbon trading. When Manufacturer 1 engages in a greater extent of power battery manufacturing under Mode WC, there is a more pronounced reduction in the overall vehicle price, thereby providing strong support for the aforementioned analysis. Therefore, manufacturers may promptly adopt a rational product pricing strategy based on their own carbon emission requirements and the prevailing conditions of the carbon trading market.
5.3. Effects of the Degree of Vehicle Substitution on the Manufacturers’ Profit
By consulting relevant works in the literature, we set and let vary from 1 to 5. The impact of parameter changes on the manufacturer’s profit are presented in Figure 3.
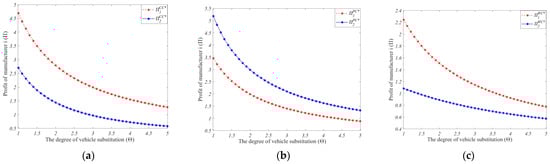
Figure 3.
The impact of the extent of vehicle substitution on the manufacturer’s profitability. (a) Mode CC. (b) Mode PC. (c) Mode WC.
The findings indicate that as the degree of vehicle substitution increases, the manufacturer’s profits decline across different modes. As the degree of substitution increases, the disparity in profits between the two manufacturers will diminish across different modes. Moreover, the rate at which the manufacturer’s profit decreases slows down with an increase in the degree of substitution. By taking Corollary 1 and Corollary 4 into account, it can be observed that factors such as variations in battery production cost, carbon trading price, and manufacturer’s bargaining power may influence the impact of vehicle substitution on vehicle price and output. However, the manufacturer’s total revenue consistently declines with an increase in vehicle substitution. A high degree of vehicle substitution intensifies market competition, which has a significantly adverse effect on all market participants.
The aforementioned analysis demonstrates that in the fiercely competitive market environment, the disparity in overall returns between the two manufacturers is gradually diminishing. Electric vehicle (EV) manufacturers should prioritize developing distinctive product features and advantages during their collaborative efforts focused on power batteries. However, when facing a less competitive market, manufacturers need to remain vigilant, as even minor changes in market conditions can have substantial implications for overall profitability.
6. Conclusions and Suggestions
6.1. Conclusions
This paper focuses on the supply chain of two competing electric vehicle manufacturers, with a specific emphasis on their strategic choices in power battery production modes and carbon emission reduction decisions under the carbon trading policy. A game-theoretic model was constructed to analyze three distinct production modes: Mode CC, Mode PC, and Mode WC. The equilibrium solution was derived by considering factors such as product substitutability, differences in power battery costs, and negotiation capabilities.
(1) The entry fees for patents, patent royalties, and the wholesale prices of power batteries will be influenced by the extent of electric vehicle substitution and the bargaining power of manufacturers. Among these factors, patent royalties and power battery wholesale prices not only serve as a means for manufacturers to generate profits but also act as a “facilitator” in mitigating competitive relationships among manufacturers.
(2) The price of electric vehicles is influenced by various factors, including the degree of substitution, manufacturers’ bargaining power, disparities in power battery production costs, and carbon trading prices. However, it should be noted that an increase in the degree of substitution does not necessarily result in a reduction in vehicle prices due to other variables. In Mode PC, when the carbon trading price falls below a certain threshold, Manufacturer 1‘s selling price for electric vehicles increases with intensified competition. In Mode CC, if the production cost of power batteries exceeds a specific threshold, Manufacturer 1 gains a significant advantage in battery production, and increasing competition intensity leads to higher product prices. In Mode WC, if Manufacturer 1 possesses stronger bargaining power than a predetermined level, it chooses to raise the price of electric vehicles, aiming for higher profits within a competitive market environment. Coopetition modes (Mode PC and Mode WC) can result in escalated prices for electric vehicles from both manufacturers 1 and 2. However, Mode WC tends to demonstrate relatively higher pricing.
(3) Electric vehicle manufacturers exert a significant influence on the carbon trading process. With rising prices for carbon emissions, manufacturers are compelled to invest further in strategies aimed at reducing their environmental impact while maximizing financial gains. Nevertheless, this dynamic is also shaped by factors such as carbon trading price and negotiation power under Mode WC. Both coopetition modes (Mode PC and Mode WC) have the potential to elevate Manufacturer 1‘s commitment toward achieving lower levels of greenhouse gas emissions. However, it is observed that Mode WC exhibits superior effectiveness in driving substantial reductions. Conversely, coopetition modes might impede Manufacturer 2‘s progress towards attaining desired levels of emission cuts.
(4) Manufacturer 1 exhibits the highest profitability in CC mode owing to its cost advantage in power cell production. In PC mode, Manufacturer 2 can leverage identical battery technology as Manufacturer 1, thereby emerging as the most profitable player in this mode. The intensification of market competition will adversely affect manufacturers’ profits across all production modes. Within the coopetition framework, Manufacturer 1 will persistently pursue investments for carbon emission reduction, which may temporarily impede its profit margins.
6.2. Management Insights
Based on the aforementioned findings, the following managerial insights can be inferred:
(1) Regarding power battery production, a collaborative approach between the two manufacturers can lead to a mutually beneficial outcome, necessitating electric vehicle manufacturers to establish an effective cooperation mechanism. It is imperative for electric vehicle manufacturers to engage in negotiations and establish reasonable power battery patent fees and wholesale prices, not only compensating for the potential losses resulting from market competition among technology-driven battery producers but also strengthening the cooperative relationship among manufacturers. Electric vehicle manufacturers equipped with battery production technology exhibit higher profitability within a perfectly competitive battery production mode, while manufacturers lacking power cell production technology demonstrate greater profitability within a more collaborative power cell production mode.
(2) In terms of competition in the electric vehicle market, manufacturers need to comprehensively consider factors such as market competitiveness, bargaining power, and carbon trading prices during power battery production cooperation. They should also make reasonable adjustments to the pricing of electric vehicles. All manufacturers must continue to develop unique brand and technical features in order to reduce the homogeneity of electric vehicles. It is particularly important to note that EV manufacturers need to be vigilant when facing a weak market competition environment, as even small changes in the market can have a significant negative impact on overall profits.
(3) In terms of carbon reduction, electric vehicle manufacturers possess a comparative advantage in carbon trading over traditional gas-powered car manufacturers. However, it is crucial for manufacturers to exercise caution and not blindly pursue carbon emission reduction measures amidst the escalating prices of carbon trading. Electric vehicle manufacturers should holistically consider the power dynamics between enterprises and the investment costs associated with reducing carbon emissions to mitigate potential financial strain. Particularly for manufacturers lacking power battery production technology, it is advisable to curtail the implementation of carbon emission reduction measures within the coopetition production mode.
6.3. Future Studies
This study initiates an investigation into mode selection and carbon reduction strategies for power battery production by electric vehicle manufacturers operating under a carbon trading policy through their collaboration in the EV market. Nevertheless, it is imperative to acknowledge the frequent presence of information asymmetry within real supply chains and incorporate this aspect into future modeling discussions. Moreover, this study exclusively focuses on the competition between dual enterprises, which is commonly observed in the electric vehicle (EV) market. However, revisiting the impact of multiple electric vehicle (EV) manufacturers on decision making regarding power battery production would be a valuable avenue for future research.
Author Contributions
Conceptualization, Y.S.; methodology, Z.H.; writing—review and editing, X.W. and S.Y. All authors have read and agreed to the published version of the manuscript.
Funding
The work described in this paper is supported by the National Natural Science Foundation of China (No. 71904043); Jiangsu Province Social Science Foundation Project (No. 23GLD003); Jiangsu University Philosophy and Social Science Research Project (No. 2022SJYB2243); Jiangsu Province Social Science Late Key Project (No. 22HQA1).
Data Availability Statement
Data are contained within the article.
Conflicts of Interest
The authors declare no conflicts of interest.
Nomenclature
| Carbon trading price | |
| Carbon reduction level of manufacturer , | |
| Carbon reduction investment cost factor | |
| Highest market price for electric vehicles | |
| The degree of substitution between electric vehicles produced by manufacturers | |
| Other costs of unit vehicle | |
| Unit power battery production cost of Manufacturer 1 | |
| Unit power battery procurement cost of Manufacturer 2 in Mode CC, | |
| Difference in battery cost per unit of power between two manufacturers in Mode CC, | |
| Wholesale price of power battery of Manufacturer 1 in Mode WC, | |
| Patent royalties for power battery technology, | |
| Patent entry fees for power battery technology, | |
| Vehicle market demand of manufacturer , | |
| Unit vehicle price of manufacturer , | |
| Unit vehicle margin profit of manufacturer , | |
| Profit of manufacturer , | |
| Bargaining power of Manufacturer 1, |
Appendix A
Proof of Proposition 1.
Substitute Equation (1) into Equations (2) and (3). To establish the Hessian matrix, the derivatives of to and are calculated as follows:
As , we obtain as a concave function of and . Let , showing that
By introducing and into Equations (1)–(3), we obtain and . □
Proof of Proposition 2.
Substitute Equation (1) into Equations (8) and (9). To establish the Hessian matrix, the derivatives of to and are calculated as follows:
We easily obtain as a concave function of and . Let , showing that
Replace and in (10); then, let so that we obtain
By substituting and into and , we obtain , , , and . □
Proof of Proposition 3.
Substitute Equation (1) into Equation (16). To establish the Hessian matrix, the derivatives of to and are calculated as follows:
As , we obtain as a concave function of and . Let , showing that
Substitute (1), , into Equation (17). To establish the Hessian matrix, the derivatives of to and are calculated as follows:
As , we obtain as a concave function of and . Let , showing that
Substitute (1), and into Equation (18). Let , showing that
By substituting into and , we obtain , , and . □
Proof of Corollary 1.
(i) Since , increases in . Let ; we obtain If and , then ; if , then ; .
(ii) Since , recall that , when and ; if , then ; since , if , then .
(iii) Since , recall that , , increases in . If , we obtain , If when , then ; when , then ; since and , increases in . If , we obtain . If when , then ; when , then . □
Proof of Corollary 2.
Since , recall that ; we obtain . □
Proof of Corollary 3.
(i) Since , increases in . Let ; we obtain and ; then, ; similarly, .
(ii) Since , recall that , then ; since , , there is one root for , , . As , , then .
(iii) Since , , increases in . Let ; we obtain ; if and , namely , then , ; Since , when and , then ; when , then . □
Proof of Corollary 4.
(i) Since , then ; since , if , then , if , then . Since . Recall that ; then, , .
(ii) Since . Recall that ; then, ; ; then, . Since . Recall that ; then, , .
(iii) Since when , decreases in . If , we obtain . When , then ; when , then . Since , if , then ; if , then . . If , then ; if , then . □
Proof of Corollary 5.
(i) Since , decreases in . We obtain this when ; then, . If , then ; if , then , where .
(ii) Recall that ; then, , . □
References
- Wang, Z.; Wu, Q. Carbon emission reduction and product collection decisions in the closed-loop supply chain with cap-and-trade regulation. Int. J. Prod. Res. 2021, 59, 4359–4383. [Google Scholar] [CrossRef]
- Zhu, M.; Liu, Z.; Li, J.; Zhu, S.-X. Electric vehicle battery capacity allocation and recycling with downstream competition. Eur. J. Oper. Res. 2020, 283, 365–379. [Google Scholar] [CrossRef]
- Qudrat-Ullah, H. Adoption and Growth of Fuel Cell Vehicles in China: The Case of BYD. Sustainability 2022, 14, 12695. [Google Scholar] [CrossRef]
- JustAuto. Ssangyong to Buy EV Battery Tech from BYD. Available online: https://www.just-auto.com/news/ssangyong-to-buy-ev-battery-tech-from-byd/ (accessed on 21 March 2024).
- Lin, L. Opportunities and Challenges of New Energy Vehicles in Carbon Neutrality and Financial Investment Banking. Highlights Bus. Econ. Manag. 2024, 24, 984–989. [Google Scholar] [CrossRef]
- Shen, J.; Tang, P.; Zeng, H.; Cheng, J.; Liu, X. Does emission trading system reduce mining cities’ pollution emissions? A quasi-natural experiment based on Chinese prefecture-level cities. Resour. Policy 2023, 81, 103293. [Google Scholar] [CrossRef]
- Lu, C.J.; Ge, M.; Lee, T. Impact of carbon emission policy combinations on the optimal production-inventory decisions for deteriorating items. Expert Syst. Appl. 2022, 201, 117234. [Google Scholar] [CrossRef]
- The State Council. Notice of The General Office of the State Council on Issuing the Development Plan for the New Energy Automobile Industry (2021–2035). Available online: https://www.gov.cn/zhengce/zhengceku/2020-11/02/content_5556716.htm (accessed on 12 March 2024).
- Zhang, Q.; Tang, Y.; Bunn, D.; Li, H.; Li, Y. Comparative evaluation and policy analysis for recycling retired EV batteries with different collection modes. Appl. Energy 2021, 303, 117614. [Google Scholar] [CrossRef]
- Li, X. Collection mode choice of spent electric vehicle batteries: Considering collection competition and third-party economies of scale. Sci. Rep. 2022, 12, 6691. [Google Scholar] [CrossRef] [PubMed]
- Sun, Q.; Chen, H.; Long, R.; Li, Q.; Huang, H. Comparative evaluation for recycling waste power batteries with different collection modes based on Stackelberg game. J. Environ. Manag. 2022, 312, 114892. [Google Scholar] [CrossRef]
- Gu, X.; Zhou, L.; Huang, H.; Shi, X.; Ieromonachou, P. Electric vehicle battery secondary use under government subsidy: A closed-loop supply chain perspective. Int. J. Prod. Econ. 2021, 234, 108035. [Google Scholar] [CrossRef]
- Ioakimidis, C.S.; Murillo-Marrodán, A.; Bagheri, A.; Thomas, D.; Genikomsakis, K.N. Life cycle assessment of a lithium iron phosphate (LFP) electric vehicle battery in second life application scenarios. Sustainability 2019, 11, 2527. [Google Scholar] [CrossRef]
- Jiang, S.; Zhang, L.; Hua, H.; Liu, X.; Wu, H.; Yuan, Z. Assessment of end-of-life electric vehicle batteries in China: Future scenarios and economic benefits. Waste Manag. 2021, 135, 70–78. [Google Scholar] [CrossRef] [PubMed]
- Wang, Y.; Zhang, X.; Cheng, T.C.E.; Wu, T.H. Choice of the co-opetition model for a new energy vehicle supply chain under government subsidies. Transp. Res. Part E Logist. Transp. Rev. 2023, 179, 103326. [Google Scholar] [CrossRef]
- Liu, P.; Yang, X.; Zhang, R.; Liu, B. OEM’s sales formats under e-commerce platform’s private-label brand outsourcing strategies. Comput. Ind. Eng. 2022, 173, 108708. [Google Scholar] [CrossRef]
- Yang, Z.; Hu, X.; Gurnani, H.; Guan, H. Multichannel distribution strategy: Selling to a competing buyer with limited supplier capacity. Manag. Sci. 2018, 64, 1975–2471. [Google Scholar] [CrossRef]
- Wang, Y.; Xu, X.; Zhu, Q. Carbon emission reduction decisions of supply chain members under cap and-trade regulations: A differential game analysis. Comput. Ind. Eng. 2021, 162, 107711. [Google Scholar] [CrossRef]
- Zhang, H.; Li, P.; Zheng, H.; Zhang, Y. Impact of carbon tax on enterprise operation and production strategy for low-carbon products in a co-opetition supply chain. J. Clean. Prod. 2021, 287, 125058. [Google Scholar] [CrossRef]
- Dong, R.; Guan, X.; Liu, B.; Chen, S. Coopetition strategy in an imbalanced competitive environment. Int. J. Prod. Res. 2023, 61, 910–938. [Google Scholar] [CrossRef]
- Lin, Y.-T.; Parlaktürk, A.-K.; Swaminathan, J.-M. Vertical integration under competition: Forward, backward, or no integration? Prod. Oper. Manag. 2014, 23, 19–35. [Google Scholar] [CrossRef]
- Xia, L.; Bai, Y.; Ghose, S.; Qin, J. Differential game analysis of carbon emissions reduction and promotion in a sustainable supply chain considering social preferences. Ann. Oper. Res. 2022, 310, 257–292. [Google Scholar] [CrossRef]
- Yang, L.; Hu, Y.; Huang, L. Collecting mode selection in a remanufacturing supply chain under cap-and-trade regulation. Eur. J. Oper. Res. 2022, 287, 480–496. [Google Scholar] [CrossRef]
- Shi, B.; Li, N.; Gao, Q.; Li, G. Market incentives, carbon quota allocation and carbon emission reduction: Evidence from China’s carbon trading pilot policy. J. Environ. Manag. 2022, 319, 115650. [Google Scholar] [CrossRef] [PubMed]
- Zhao, S.; Shi, Y.; Xu, J. Carbon emissions quota allocation based equilibrium strategy toward carbon reduction and economic benefits in China’s building materials industry. J. Clean. Prod. 2018, 189, 307–325. [Google Scholar] [CrossRef]
- Zhang, C.; Chen, Y.X.; Tian, Y.X. Collection and recycling decisions for electric vehicle end-of-life power batteries in the context of carbon emissions reduction. Comput. Ind. Eng. 2023, 175, 108869. [Google Scholar] [CrossRef]
- Zhang, C.; Tian, Y.X.; Han, M.H. Recycling mode selection and carbon emission reduction decisions for a multi-channel closed-loop supply chain of electric vehicle power battery under cap-and-trade policy. J. Clean. Prod. 2022, 375, 134060. [Google Scholar] [CrossRef]
- Feng, Z.; Luo, N.; Shalpegin, T.; Cui, H. The influence of carbon emission reduction instruments on blockchain technology adoption in recycling batteries of the new energy vehicles. Int. J. Prod. Res. 2024, 62, 891–908. [Google Scholar] [CrossRef]
- Liu, H.; Baumann, M.; Dou, X.; Klemens, J.; Schneider, L.; Wurba, A.K.; Weil, M. Tracing the technology development and trends of hard carbon anode materials-A market and patent analysis. J. Energy Storage 2022, 56, 105964. [Google Scholar] [CrossRef]
- Liu, Y.; Zhang, R.; Wang, J.; Wang, Y. Current and future lithium-ion battery manufacturing. IScience 2021, 24, 102332. [Google Scholar] [CrossRef]
- Savaskan, R.-C.; Bhattacharya, S.; Van Wassenhove, L.-N. Closed-loop supply chain models with product remanufacturing. Manag. Sci. 2004, 50, 239–252. [Google Scholar] [CrossRef]
- Jones, R.; Mendelson, H. Information goods vs. industrial goods: Cost structure and competition. Manag. Sci. 2011, 57, 164–176. [Google Scholar] [CrossRef]
- Energy Metal News. World No 2 Electric Carmaker Goes Entirely Nickel, Cobalt Free. Available online: https://energymetalnews.com/2021/04/09/world-no-2-electric-carmaker-goes-entirely-nickel-cobalt-free/ (accessed on 10 March 2024).
- Singh, N.; Vives, X. Price and quantity competition in a differentiated duopoly. Rand J. Econ. 1984, 15, 546–554. Available online: https://www.jstor.org/stable/2555525 (accessed on 10 March 2024). [CrossRef]
- Chen, X.; Wang, X.; Xia, Y. Production co-opetition strategies for competing manufacturers that produce partially substitutable products. Prod. Oper. Manag. 2019, 28, 1446–1464. [Google Scholar] [CrossRef]
- Qing, Q.; Deng, T.; Wang, H. Capacity allocation under downstream competition and bargaining. Eur. J. Oper. Res. 2017, 261, 97–107. [Google Scholar] [CrossRef]
- Nagarajan, M.; Bassok, Y. A bargaining framework in supply chains: The assembly problem. Manag. Sci. 2008, 54, 1482–1496. [Google Scholar] [CrossRef]
Disclaimer/Publisher’s Note: The statements, opinions and data contained in all publications are solely those of the individual author(s) and contributor(s) and not of MDPI and/or the editor(s). MDPI and/or the editor(s) disclaim responsibility for any injury to people or property resulting from any ideas, methods, instructions or products referred to in the content. |
© 2024 by the authors. Licensee MDPI, Basel, Switzerland. This article is an open access article distributed under the terms and conditions of the Creative Commons Attribution (CC BY) license (https://creativecommons.org/licenses/by/4.0/).