
Towards Automatic ICD Coding via Label Graph Generation


Abstract
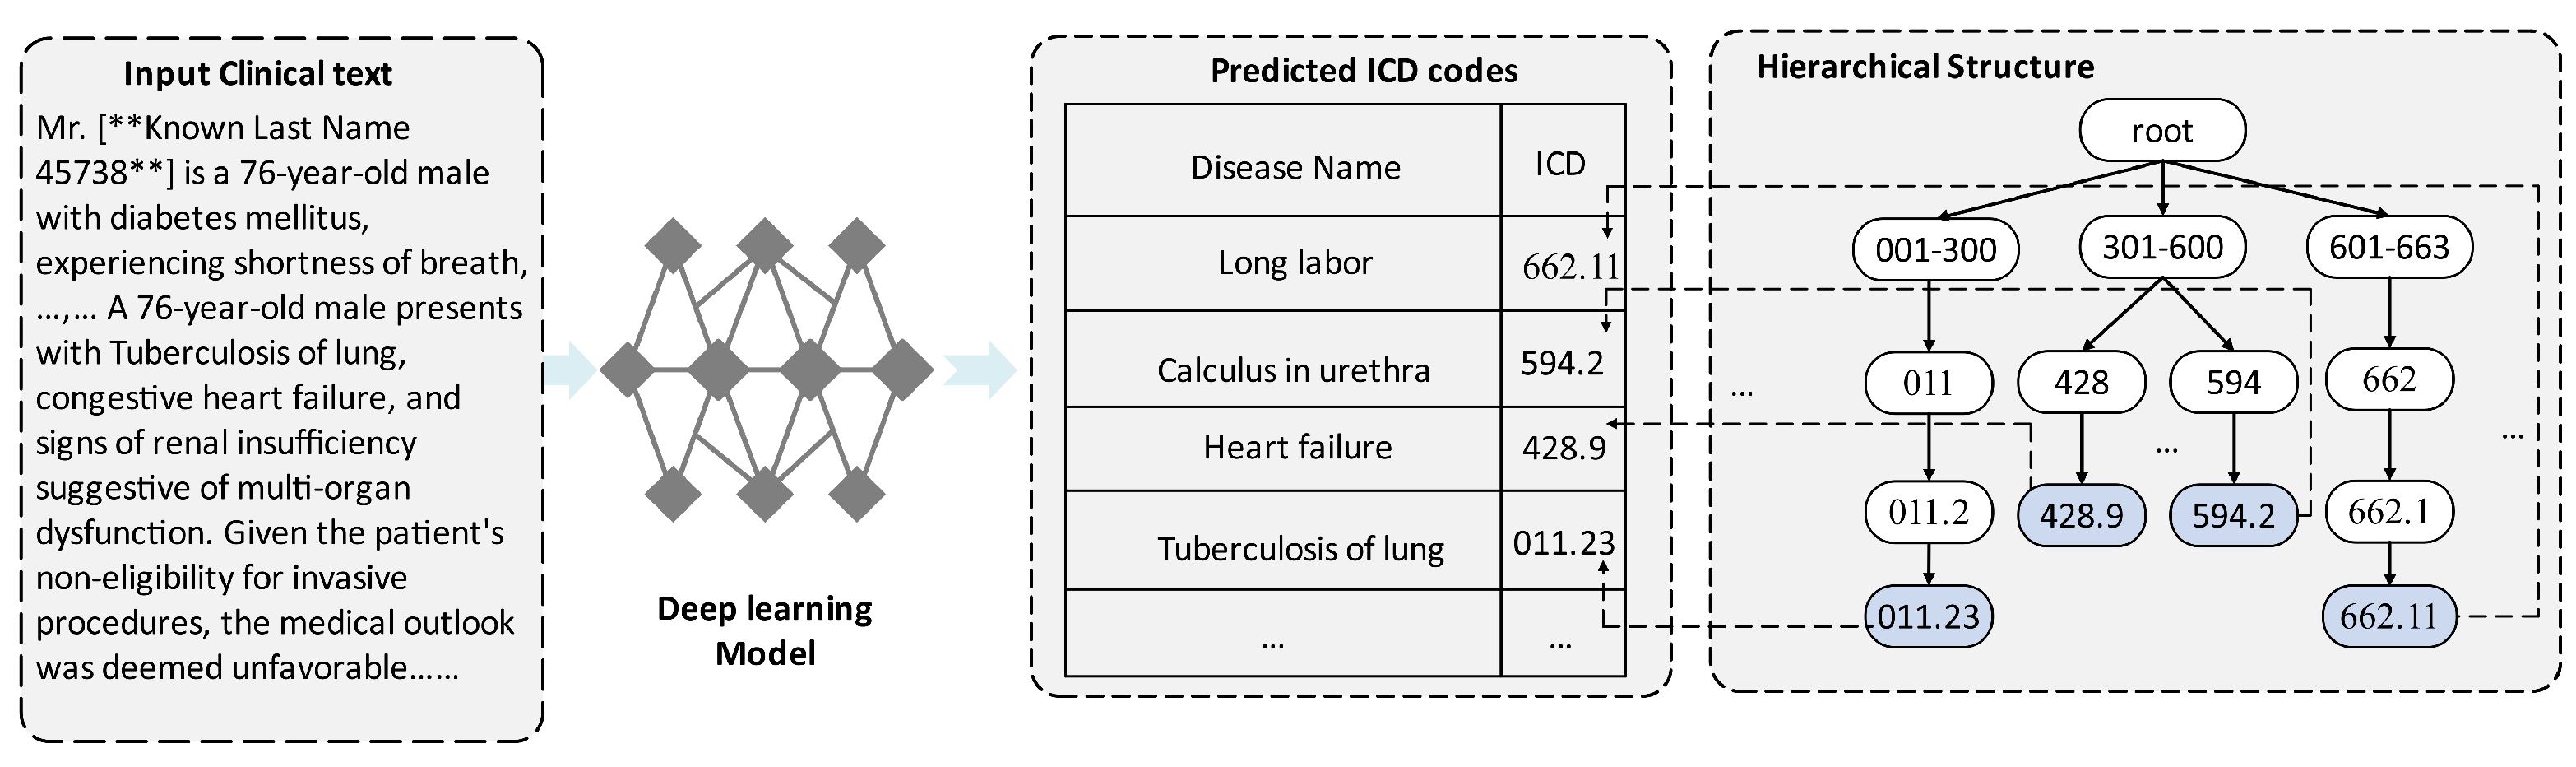
1. Introduction
- •
- We first considered automatic electronic health record (EHR) coding as a labeled graph generation challenge and then developed a multi-algorithm model LabGraph for automatic ICD coding.
- •
- We proposed a message integration module (MIM) that simulates the parent–child, sibling, and mutually exclusive relationships.
- •
- We initially applied four training methods based on reinforcement learning in ICD coding.
- •
- We developed a label graph discriminator (LGD) with an adversarial reward to assess intermediate rewards as supervision signals for LabGraph.
- •
- We conducted comprehensive experiments on a frequently utilized dataset to validate and evaluate the efficacy of LabGraph.
2. Method and Theoretical Analysis
2.1. Meta-Parameter Learning
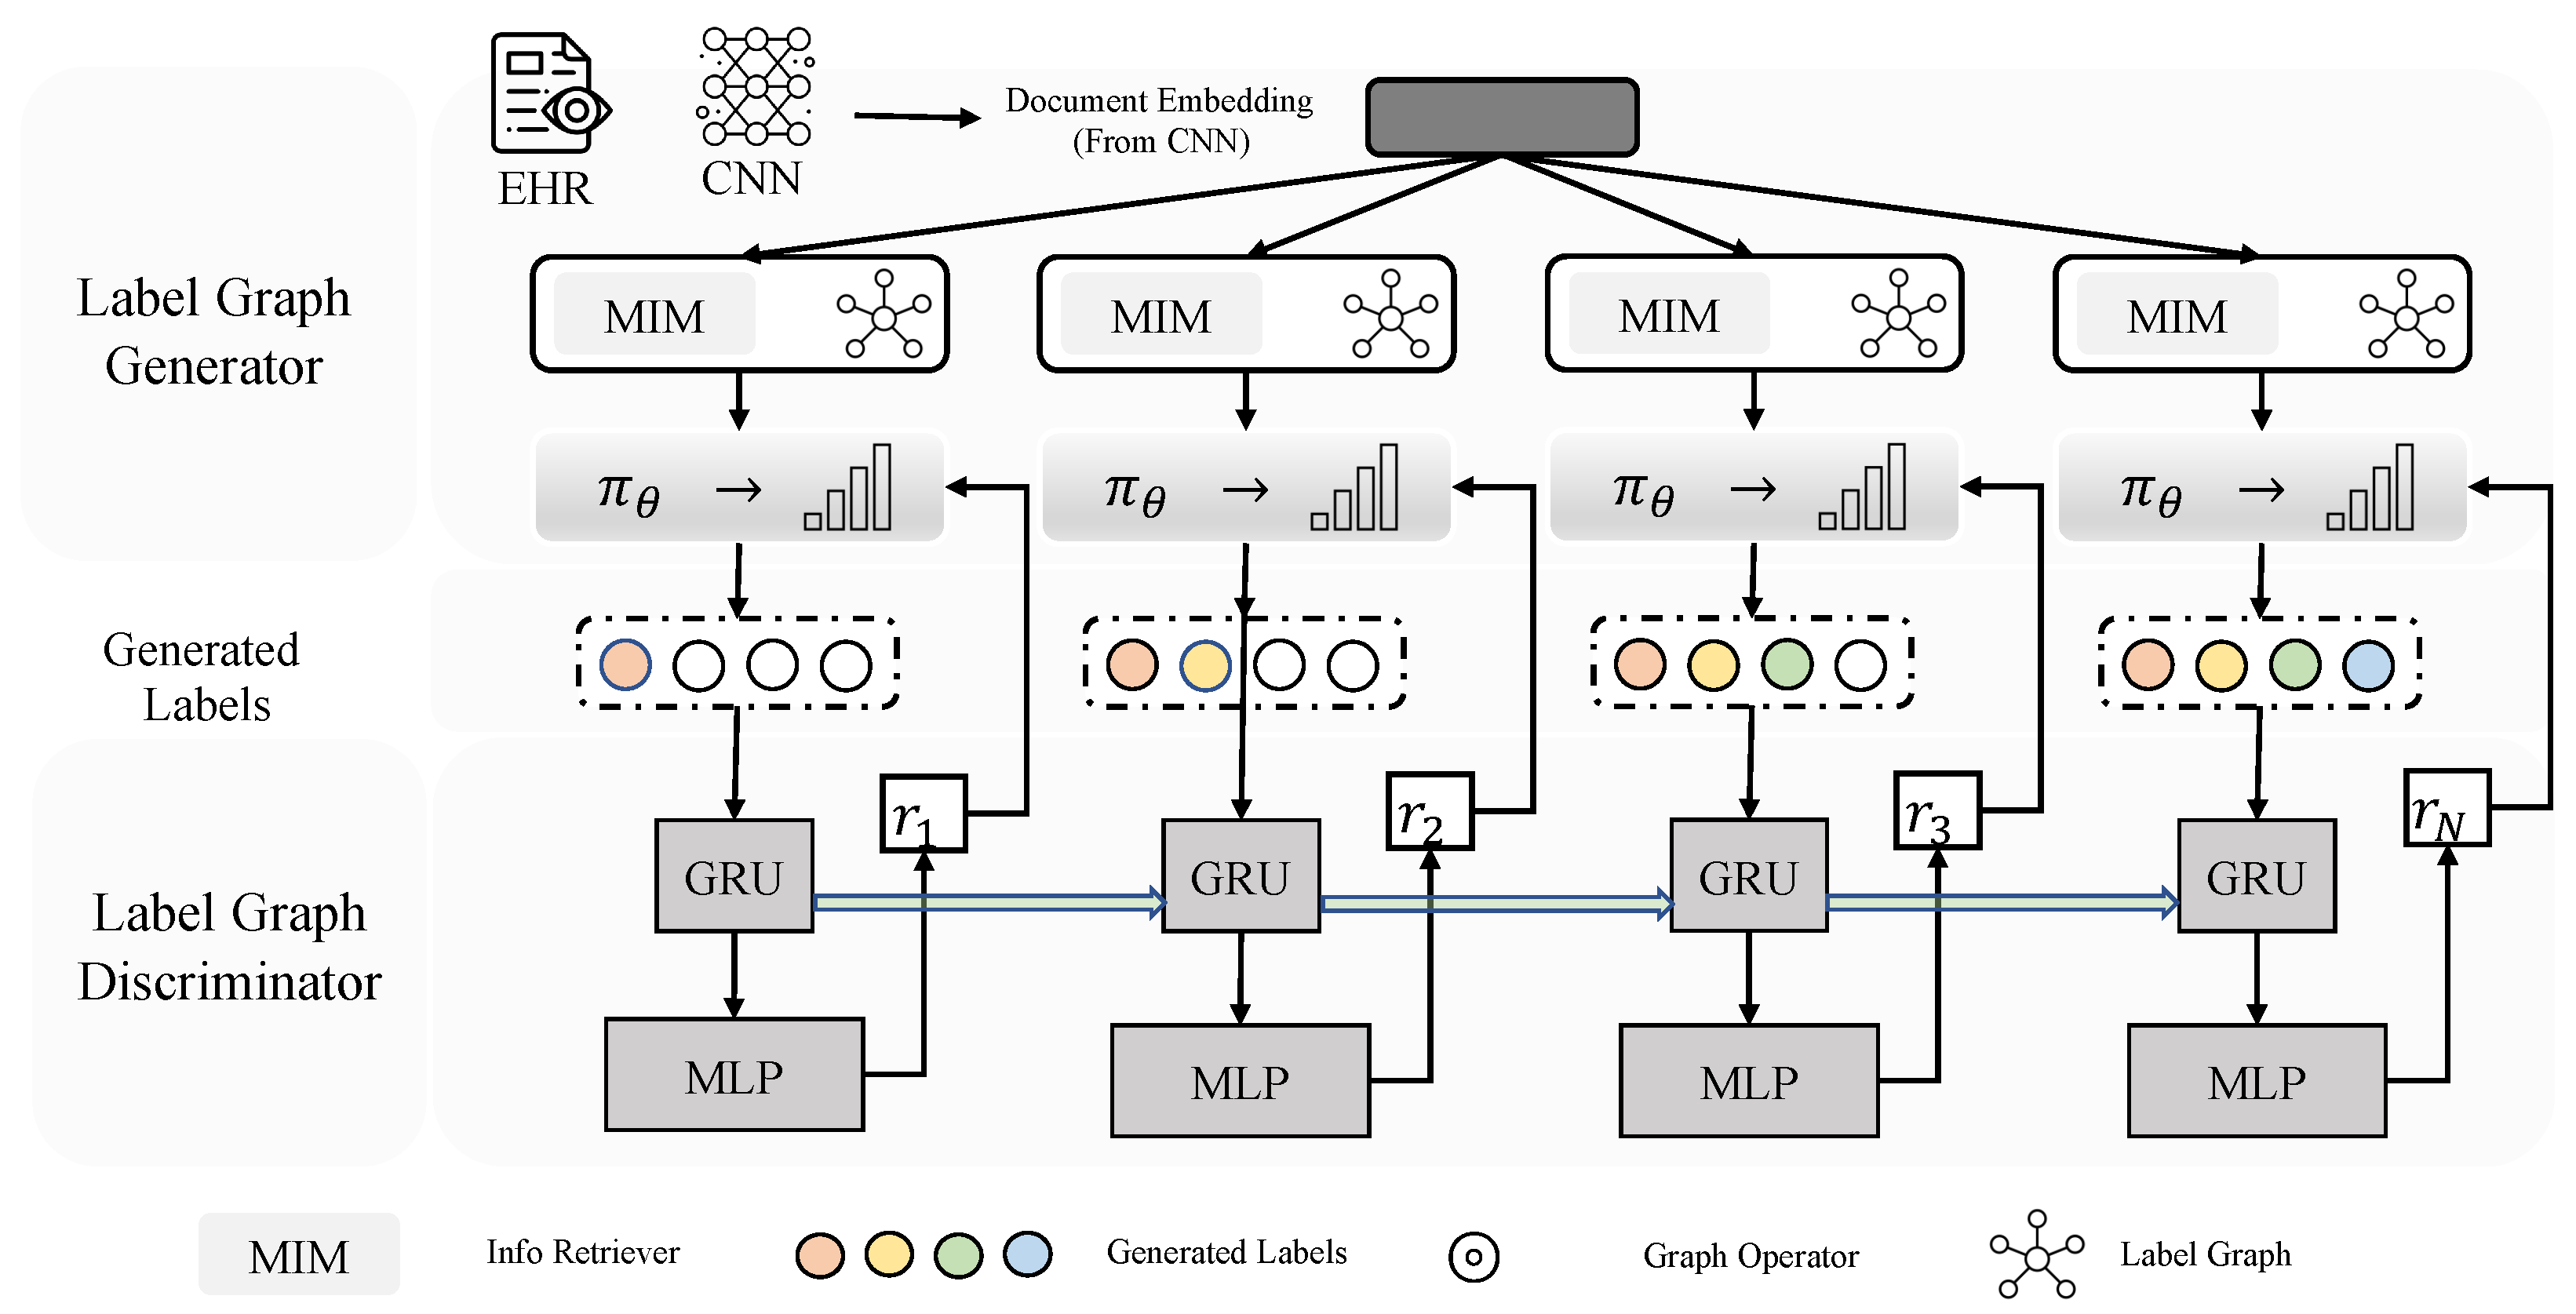
2.2. Label Graph Generator
2.3. Label Graph Discriminator
Multi-Hop Model Integration (MHMI)
2.4. Adversarial Adaptative Training (AAT)
3. Experimental Setup
- RQ1: How does LabGraph compare to existing automatic ICD coding systems in terms of ICD code prediction?
- RQ2: How can the label graph generation network be trained so that it has better generalization, robustness, and effectiveness?
- RQ3: What are the influences of different model configurations?
- RQ4: Is the improved graph representation learning algorithm effective on multi-relational medical graph data?
3.1. Dataset
- MIMIC-III [11]
- Cora [17]
- FB15k-237 [18]
3.2. Metrics
3.3. Baselines
- Hierarchy-SVM and Flat-SVM [22]
- CAML and DR-CAML [2]
- LAAT and JointLAAT [6]
4. Results and Analysis
4.1. Comparison with Baselines (RQ1)
4.2. LABGRAPH Ablation (RQ2)
4.3. Graphical Representation Model Experiment (RQ3)
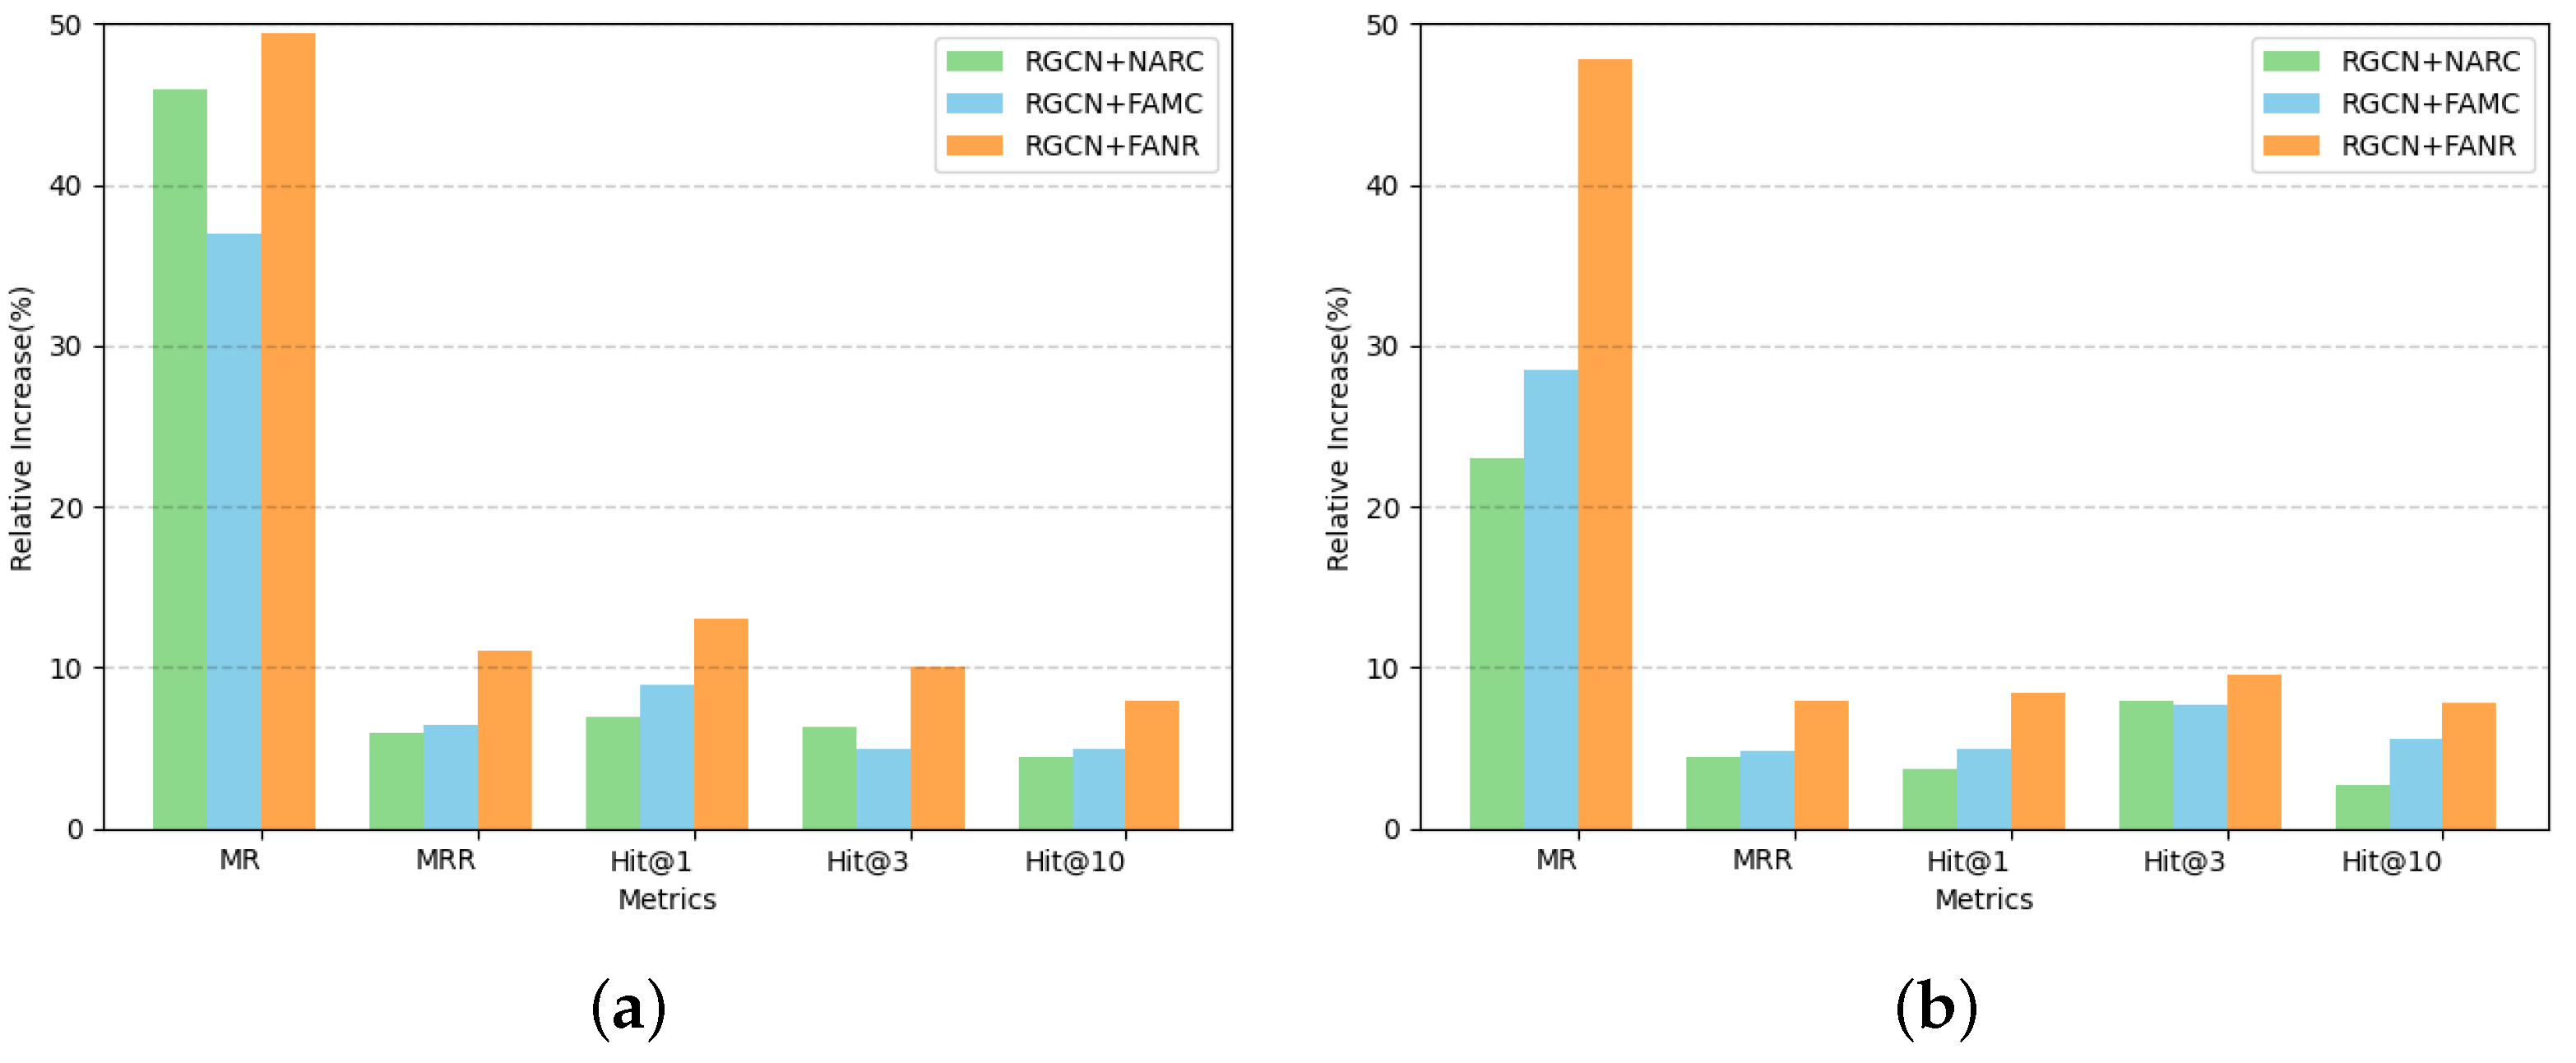
4.3.1. A Comparison of One-Hop Neighbor Attention Optimization Graph Representation
- Baseline RGCN Model: This initial experiment established our control setup with a learning rate of 0.005, batch size of 256, initial node feature dimension of 128, and a hidden layer dimension of 300 in the GCN convolutional layers. The model achieved optimal performance after 247 epochs.
- RGCN+NARC: This variant integrated the GAT model’s attention mechanism directly into the one-hop neighbor nodes upon model convergence. Parameters remained consistent with the baseline, achieving optimal performance after 281 epochs.
- RGCN+FAMC: Similar to the previous experiment, this experiment added an enhanced GAT attention mechanism to the one-hop neighbors at convergence. It mirrored the RGCN+NARC in terms of parameters, with convergence after 265 epochs.
- RGCN+FANR: This model extended the improved GAT attention to include both one-hop neighbor nodes and their relationships. It followed the same parameter setup as the previous experiments, converging after 239 epochs.
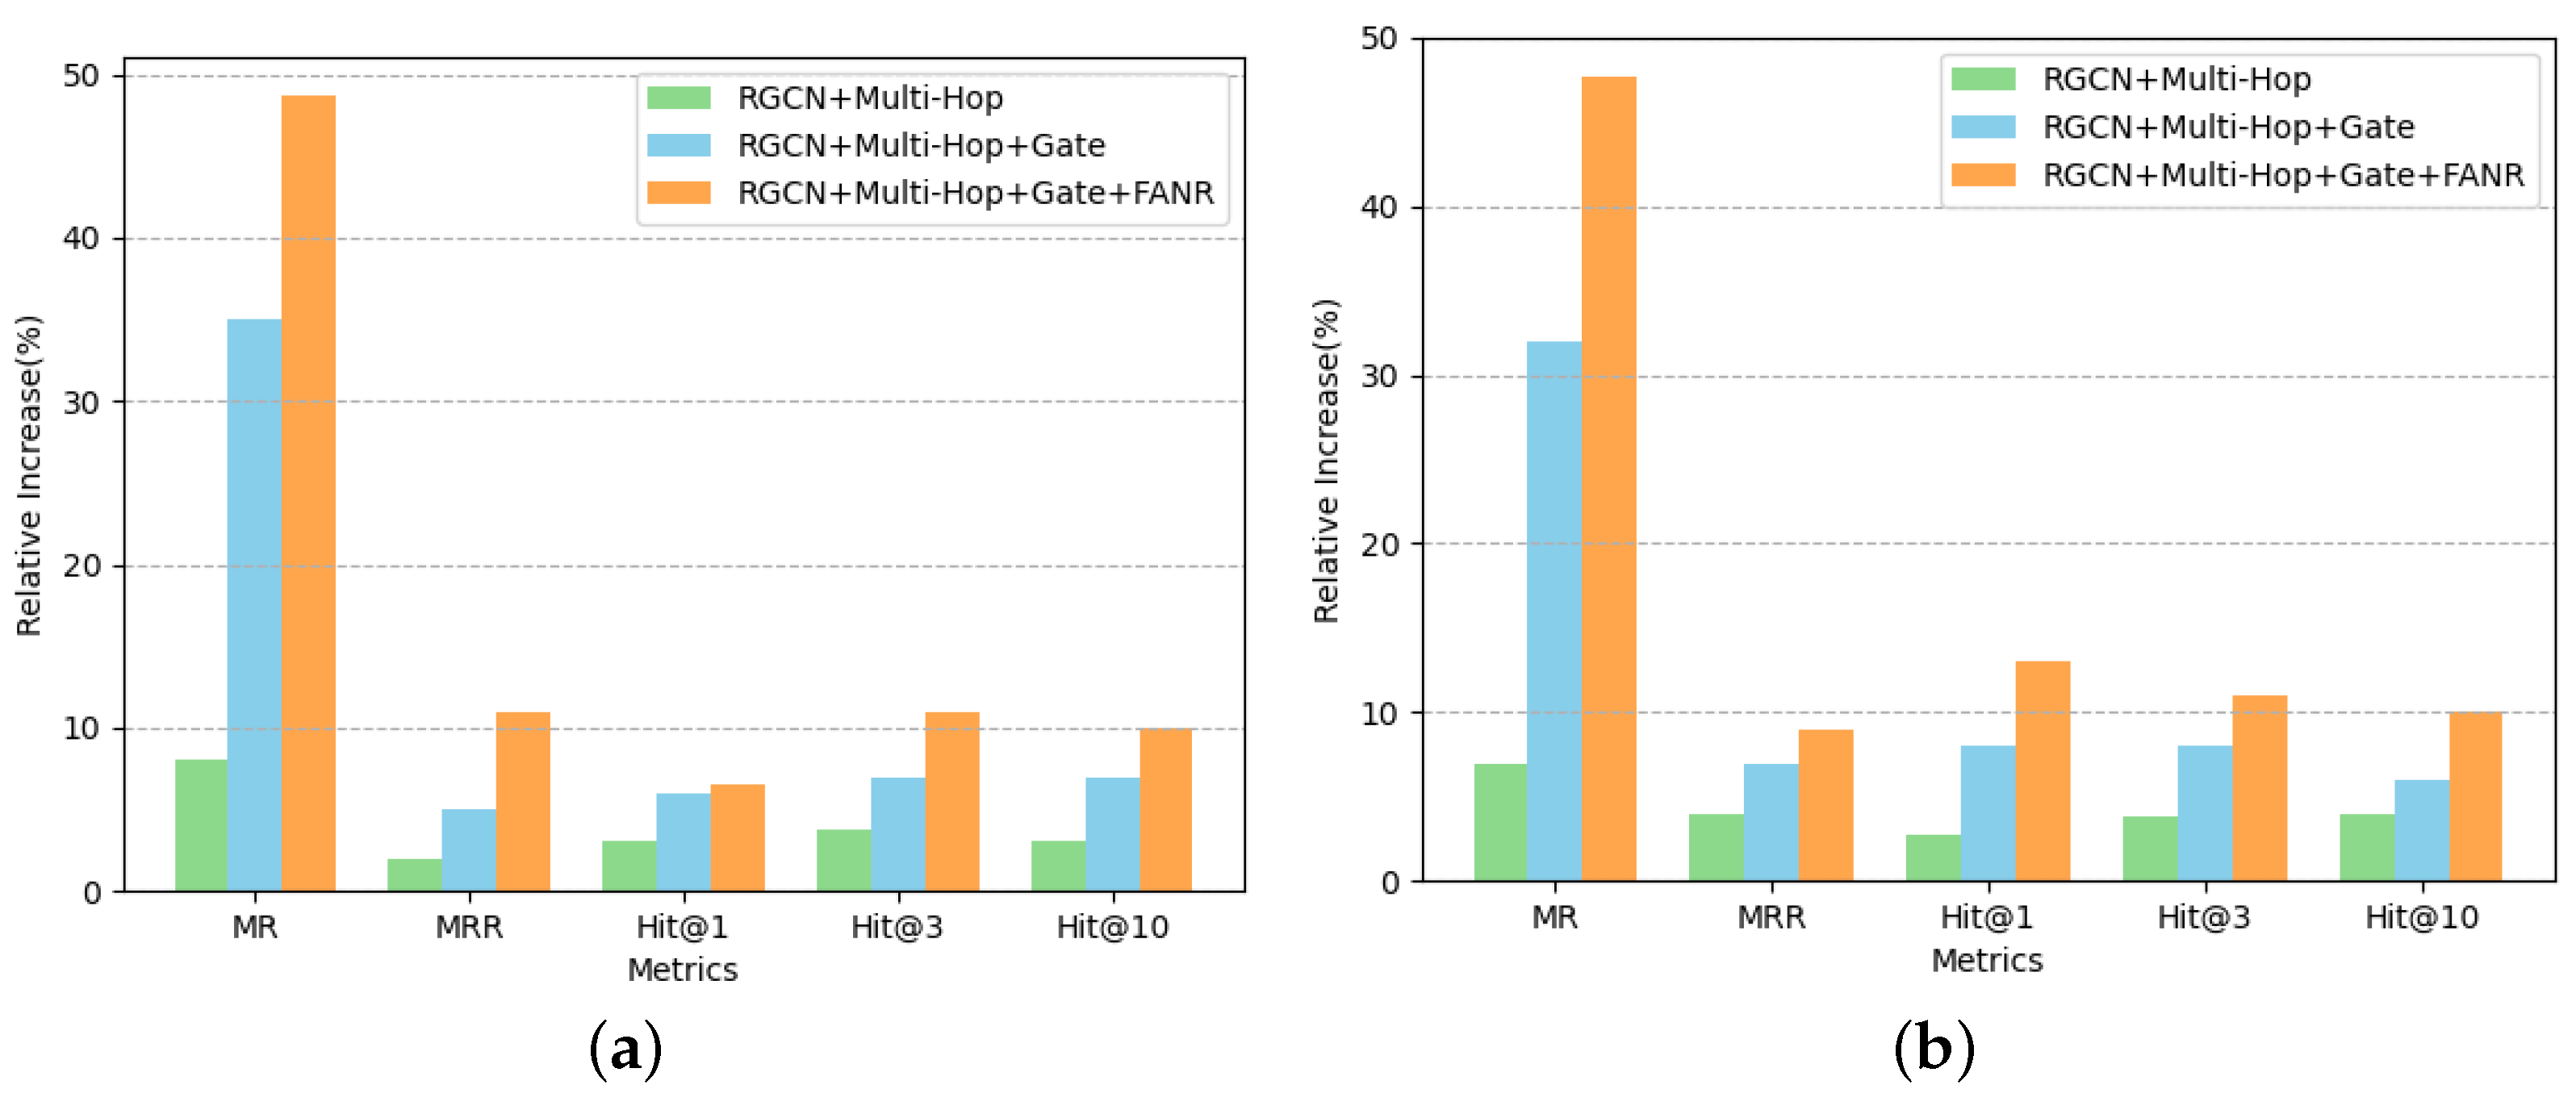
4.3.2. Experiments on Gate Mechanism for Multi-Hop Aggregation
5. Conclusions and Future Work
Author Contributions
Funding
Data Availability Statement
Conflicts of Interest
References
- Nadathur, S.G. Maximising the value of hospital administrative datasets. Aust. Health Rev. 2010, 34, 216–223. [Google Scholar] [CrossRef] [PubMed]
- Mullenbach, J.; Wiegreffe, S.; Duke, J.; Sun, J.; Eisenstein, J. Explainable Prediction of Medical Codes from Clinical Text. In Proceedings of the 2018 Conference of the North American Chapter of the Association for Computational Linguistics: Human Language Technologies, Volume 1 (Long Papers), New Orleans, LA, USA, 1–6 June 2018; pp. 1101–1111. [Google Scholar] [CrossRef]
- Cao, P.; Chen, Y.; Liu, K.; Zhao, J.; Liu, S.; Chong, W. HyperCore: Hyperbolic and Co-graph Representation for Automatic ICD Coding. In Proceedings of the 58th Annual Meeting of the Association for Computational Linguistics, Online, 5–10 July 2020; pp. 3105–3114. [Google Scholar] [CrossRef]
- Xie, P.; Xing, E. A Neural Architecture for Automated ICD Coding. In Proceedings of the 56th Annual Meeting of the Association for Computational Linguistics (Volume 1: Long Papers), Melbourne, Australia, 15–20 July 2018; pp. 1066–1076. [Google Scholar] [CrossRef]
- Wang, S.; Ren, P.; Chen, Z.; Ren, Z.; Nie, J.Y.; Ma, J.; de Rijke, M. Coding Electronic Health Records with Adversarial Reinforcement Path Generation. In Proceedings of the 43rd International ACM SIGIR Conference on Research and Development in Information Retrieval, Virtual, 25–30 July 2020; pp. 801–810. [Google Scholar]
- Vu, T.; Nguyen, D.Q.; Nguyen, A. A Label Attention Model for ICD Coding from Clinical Text. arXiv 2020, arXiv:2007.06351. [Google Scholar]
- Ji, S.; Cambria, E.; Marttinen, P. Dilated Convolutional Attention Network for Medical Code Assignment from Clinical Text. arXiv 2020, arXiv:2009.14578. [Google Scholar]
- Auer, S.; Bizer, C.; Kobilarov, G.; Lehmann, J.; Cyganiak, R.; Ives, Z. Dbpedia: A nucleus for a web of open data. In The Semantic Web; Springer: Berlin/Heidelberg, Germany, 2007; pp. 722–735. [Google Scholar]
- Song, Y.H.; Kwon, S.B.; Jung, M.K.; Park, W.K.; Yoo, J.H.; Lee, C.W.; Kang, B.K.; Yang, W.S.; Yoon, D.H. Fabrication design for a high-quality laser diode-based ceramic converter for a laser headlamp application. Ceram. Int. 2018, 44, 1182–1186. [Google Scholar] [CrossRef]
- Färber, M.; Bartscherer, F.; Menne, C.; Rettinger, A. Linked data quality of dbpedia, freebase, opencyc, wikidata, and yago. Semant. Web 2018, 9, 77–129. [Google Scholar] [CrossRef]
- Johnson, A.E.; Pollard, T.J.; Shen, L.; Li-Wei, H.L.; Feng, M.; Ghassemi, M.; Moody, B.; Szolovits, P.; Celi, L.A.; Mark, R.G. MIMIC-III, a freely accessible critical care database. Sci. Data 2016, 3, 1–9. [Google Scholar] [CrossRef] [PubMed]
- Mikolov, T.; Sutskever, I.; Chen, K.; Corrado, G.S.; Dean, J. Distributed representations of words and phrases and their compositionality. Adv. Neural Inf. Process. Syst. 2013, 26, 3111–3119. [Google Scholar]
- Kim, Y. Convolutional Neural Networks for Sentence Classification. In Proceedings of the 2014 Conference on Empirical Methods in Natural Language Processing, EMNLP 2014, Doha, Qatar, 25–29 October 2014; Doha, Qatar, A meeting of SIGDAT, a Special Interest Group of the ACL. Moschitti, A., Pang, B., Daelemans, W., Eds.; ACL: Kerrville, TX, USA, 2014; pp. 1746–1751. [Google Scholar] [CrossRef]
- Bennett, C.C.; Hauser, K. Artificial intelligence framework for simulating clinical decision-making: A Markov decision process approach. Artif. Intell. Med. 2013, 57, 9–19. [Google Scholar] [CrossRef]
- Williams, R.J. Simple statistical gradient-following algorithms for connectionist reinforcement learning. Mach. Learn. 1992, 8, 229–256. [Google Scholar] [CrossRef]
- Jiang, H.; He, P.; Chen, W.; Liu, X.; Gao, J.; Zhao, T. Smart: Robust and efficient fine-tuning for pre-trained natural language models through principled regularized optimization. arXiv 2019, arXiv:1911.03437. [Google Scholar]
- Veličković, P.; Cucurull, G.; Casanova, A.; Romero, A.; Lio, P.; Bengio, Y. Graph attention networks. arXiv 2017, arXiv:1710.10903. [Google Scholar]
- Schlichtkrull, M.; Kipf, T.N.; Bloem, P.; Van Den Berg, R.; Titov, I.; Welling, M. Modeling relational data with graph convolutional networks. In Proceedings of the European Semantic Web Conference, Crete, Greece, 3–7 June 2018; Springer: Berlin/Heidelberg, Germany, 2018; pp. 593–607. [Google Scholar]
- Chah, N. Freebase-triples: A methodology for processing the freebase data dumps. arXiv 2017, arXiv:1712.08707. [Google Scholar]
- Stephany, F.; Braesemann, F. An exploration of wikipedia data as a measure of regional knowledge distribution. In Proceedings of the International Conference on Social Informatics, Oxford, UK, 13–15 September 2017; Springer: Berlin/Heidelberg, Germany, 2017; pp. 31–40. [Google Scholar]
- Wang, Z.; Li, X. Hybrid-TE: Hybrid translation-based temporal knowledge graph embedding. In Proceedings of the 2019 IEEE 31st International Conference on Tools with Artificial Intelligence (ICTAI), Portland, OR, USA, 4–6 November 2019; IEEE: New York, NY, USA, 2019; pp. 1446–1451. [Google Scholar]
- Perotte, A.; Pivovarov, R.; Natarajan, K.; Weiskopf, N.; Wood, F.; Elhadad, N. Diagnosis code assignment: Models and evaluation metrics. J. Am. Med. Informatics Assoc. 2014, 21, 231–237. [Google Scholar] [CrossRef]
- Prakash, A.; Zhao, S.; Hasan, S.A.; Datla, V.; Lee, K.; Qadir, A.; Liu, J.; Farri, O. Condensed memory networks for clinical diagnostic inferencing. In Proceedings of the Thirty-First AAAI Conference on Artificial Intelligence, San Francisco, CA, USA, 4–9 February 2017. [Google Scholar]
- Shi, H.; Xie, P.; Hu, Z.; Zhang, M.; Xing, E.P. Towards automated ICD coding using deep learning. arXiv 2017, arXiv:1711.04075. [Google Scholar]
- Zhou, P.; Shi, W.; Tian, J.; Qi, Z.; Li, B.; Hao, H.; Xu, B. Attention-based bidirectional long short-term memory networks for relation classification. In Proceedings of the 54th Annual Meeting of the Association for Computational Linguistics (Volume 2: Short Papers), Berlin, Germany, 7–12 August 2016; pp. 207–212. [Google Scholar]
- Baumel, T.; Nassour-Kassis, J.; Cohen, R.; Elhadad, M.; Elhadad, N. Multi-label classification of patient notes: Case study on ICD code assignment. In Proceedings of the Workshops at the Thirty-Second AAAI Conference on Artificial Intelligence, New Orleans, LA, USA, 2–7 February 2018. [Google Scholar]
- Zhou, T.; Cao, P.; Chen, Y.; Liu, K.; Zhao, J.; Niu, K.; Chong, W.; Liu, S. Automatic icd coding via interactive shared representation networks with self-distillation mechanism. In Proceedings of the 59th Annual Meeting of the Association for Computational Linguistics and the 11th International Joint Conference on Natural Language Processing (Volume 1: Long Papers), Virtual, 1–6 August 2021; pp. 5948–5957. [Google Scholar]
- Yuan, Z.; Tan, C.; Huang, S. Code Synonyms Do Matter: Multiple Synonyms Matching Network for Automatic ICD Coding. arXiv 2022, arXiv:2203.01515. [Google Scholar]
- Luo, J.; Xiao, C.; Glass, L.; Sun, J.; Ma, F. Fusion: Towards Automated ICD Coding via Feature Compression. In Proceedings of the Findings of the Association for Computational Linguistics: ACL-IJCNLP 2021, Virtual, 1–6 August 2021; pp. 2096–2101. [Google Scholar]
- Sun, Z.; Wang, C.; Hu, W.; Chen, M.; Dai, J.; Zhang, W.; Qu, Y. Knowledge graph alignment network with gated multi-hop neighborhood aggregation. In Proceedings of the AAAI Conference on Artificial Intelligence, New York, NY, USA, 7–12 February 2020; Volume 34, pp. 222–229. [Google Scholar]
- Devlin, J.; Chang, M.W.; Lee, K.; Toutanova, K. Bert: Pre-training of deep bidirectional transformers for language understanding. arXiv 2018, arXiv:1810.04805. [Google Scholar]
- Qiu, J.; Chen, Q.; Dong, Y.; Zhang, J.; Yang, H.; Ding, M.; Wang, K.; Tang, J. Gcc: Graph contrastive coding for graph neural network pre-training. In Proceedings of the 26th ACM SIGKDD International Conference on Knowledge Discovery & Data Mining, San Diego, CA, USA, 23–27 August 2020; pp. 1150–1160. [Google Scholar]
- Hu, Z.; Dong, Y.; Wang, K.; Chang, K.W.; Sun, Y. Gpt-gnn: Generative pre-training of graph neural networks. In Proceedings of the 26th ACM SIGKDD International Conference on Knowledge Discovery & Data Mining, San Diego, CA, USA, 23–27 August 2020; pp. 1857–1867. [Google Scholar]


| Model | MIMIC-III Full | MIMIC-III Top 50 | ||||||||
|---|---|---|---|---|---|---|---|---|---|---|
| AUC | F1 | P@8 | AUC | F1 | P@5 | |||||
| Macro | Micro | Macro | Micro | Macro | Micro | Macro | Micro | |||
| Hierarchy-SVM | 0.456 | 0.438 | 0.009 | 0.001 | 0.202 | 0.376 | 0.368 | 0.041 | 0.079 | 0.144 |
| Flat-SVMs | 0.482 | 0.467 | 0.011 | 0.002 | 0.242 | 0.439 | 0.401 | 0.048 | 0.093 | 0.179 |
| C-MemNN | 0.833 | 0.913 | 0.082 | 0.514 | 0.695 | 0.824 | 0.896 | 0.509 | 0.588 | 0.596 |
| C-LSTM-Att | 0.831 | 0.908 | 0.079 | 0.511 | 0.687 | 0.816 | 0.892 | 0.501 | 0.575 | 0.574 |
| BI-GRU | 0.500 | 0.547 | 0.002 | 0.140 | 0.317 | 0.501 | 0.594 | 0.035 | 0.268 | 0.228 |
| HA-GRU | 0.501 | 0.509 | 0.017 | 0.004 | 0.296 | 0.500 | 0.436 | 0.072 | 0.124 | 0.205 |
| CAML | 0.895 | 0.959 | 0.088 | 0.539 | 0.709 | 0.875 | 0.909 | 0.532 | 0.614 | 0.609 |
| DR-CAML | 0.897 | 0.961 | 0.086 | 0.529 | 0.609 | 0.884 | 0.916 | 0.576 | 0.633 | 0.618 |
| LAAT | 0.919 | 0.963 | 0.099 | 0.575 | 0.738 | 0.925 | 0.946 | 0.666 | 0.715 | 0.675 |
| JointLAAT | 0.941 | 0.965 | 0.107 | 0.577 | 0.735 | 0.925 | 0.946 | 0.661 | 0.716 | 0.671 |
| ISD | 0.938 | 0.967 | 0.119 | 0.559 | 0.745 | 0.935 | 0.949 | 0.679 | 0.717 | 0.682 |
| MSMN | 0.943 | 0.965 | 0.103 | 0.584 | 0.752 | 0.928 | 0.947 | 0.683 | 0.725 | 0.680 |
| FUSION | 0.915 | 0.964 | 0.088 | 0.636 | 0.736 | 0.909 | 0.933 | 0.619 | 0.674 | 0.647 |
| LabGraph | 0.991 | 0.998 | 0.136 | 0.791 | 0.799 | 0.985 | 0.992 | 0.765 | 0.789 | 0.776 |
| (+4.8%) | (+3.1%) | (+1.7%) | (+15.5%) | (+4.7%) | (+4.9%) | (+4.3%) | (+8.2%) | (+6.4%) | (+9.3%) | |
| ±0.002 | ±0.003 | ±0.001 | ±0.002 | ±0.001 | ±0.002 | ±0.003 | ±0.001 | ±0.001 | ±0.002 | |
| Model | MIMIC-III Full | MIMIC-III Top 50 | ||||||||
|---|---|---|---|---|---|---|---|---|---|---|
| AUC | F1 | P@8 | AUC | F1 | P@5 | |||||
| Macro | Micro | Macro | Micro | Macro | Micro | Macro | Micro | |||
| LabGraph | 0.991 | 0.998 | 0.136 | 0.791 | 0.799 | 0.985 | 0.992 | 0.765 | 0.789 | 0.776 |
| No ARCL | 0.835 | 0.872 | 0.097 | 0.513 | 0.651 | 0.811 | 0.869 | 0.607 | 0.632 | 0.537 |
| No MIM | 0.846 | 0.882 | 0.096 | 0.502 | 0.631 | 0.835 | 0.879 | 0.641 | 0.652 | 0.619 |
| No MHR-CNN | 0.839 | 0.902 | 0.098 | 0.512 | 0.668 | 0.827 | 0.891 | 0.635 | 0.631 | 0.576 |
| No ATT | 0.937 | 0.946 | 0.101 | 0.632 | 0.687 | 0.832 | 0.895 | 0.667 | 0.672 | 0.576 |
Disclaimer/Publisher’s Note: The statements, opinions and data contained in all publications are solely those of the individual author(s) and contributor(s) and not of MDPI and/or the editor(s). MDPI and/or the editor(s) disclaim responsibility for any injury to people or property resulting from any ideas, methods, instructions or products referred to in the content. |
© 2024 by the authors. Licensee MDPI, Basel, Switzerland. This article is an open access article distributed under the terms and conditions of the Creative Commons Attribution (CC BY) license (https://creativecommons.org/licenses/by/4.0/).
Share and Cite
Nie, P.; Wu, H.; Cai, Z. Towards Automatic ICD Coding via Label Graph Generation. Mathematics 2024, 12, 2398. https://doi.org/10.3390/math12152398
Nie P, Wu H, Cai Z. Towards Automatic ICD Coding via Label Graph Generation. Mathematics. 2024; 12(15):2398. https://doi.org/10.3390/math12152398
Chicago/Turabian StyleNie, Peng, Huanqin Wu, and Zhanchuan Cai. 2024. "Towards Automatic ICD Coding via Label Graph Generation" Mathematics 12, no. 15: 2398. https://doi.org/10.3390/math12152398
APA StyleNie, P., Wu, H., & Cai, Z. (2024). Towards Automatic ICD Coding via Label Graph Generation. Mathematics, 12(15), 2398. https://doi.org/10.3390/math12152398