Article

Dynamic Responses of U-Shaped Caverns under Transient Stress Waves in Deep Rock Engineering

by
Lisha Liang
,
Xibing Li
,
Zhixiang Liu
and
Siyu Peng
*
School of Resources and Safety Engineering, Central South University, Changsha 410083, China
*
Author to whom correspondence should be addressed.
Mathematics 2024, 12(12), 1836; https://doi.org/10.3390/math12121836
Submission received: 6 May 2024 / Revised: 11 June 2024 / Accepted: 11 June 2024 / Published: 13 June 2024

Abstract

Deep caverns are frequently subjected to transient loading, resulting in different failure characteristics in the surrounding rock compared to those in shallow caverns. Previous research has rarely focused on the transient responses of non-circular caverns. To address this gap, a theoretical solution for the dynamic stress concentration factor around a U-shaped cavern under transient stress waves was derived based on elasto-dynamic theory and conformal mapping. The theoretical results were validated through simulations using the discrete element software PFC2D 7.0 (Particle Flow Code in two dimensions). Additionally, the energy evolution and failure pattern of the surrounding rock under coupled static–dynamic loading were investigated. The results indicated that, when the stress wave was horizontally incident, rockburst failure was more likely to be observed in the cavern floor, while dynamic tensile failure was prone to occur in the incident sidewall. Furthermore, when the incident direction of the stress wave aligned with the maximum principal stress, more violent rockburst occurred. Moreover, when the rising time of the stress wave was greater than 6.0 ms, the peak dynamic stress concentration factor converged to a stable value, and the surrounding rock could be considered to be in a quasi-static loading state. These findings provide insight into the failure mechanisms of deep caverns and could guide the design of cavern supporting structures.

1. Introduction

Over the past few decades, the construction of deep-buried caverns has become commonplace [1,2,3]. Deep rock engineering is subjected to high in situ stress and frequent dynamic disturbances such as earthquakes, blasting, and rockbursts, which are important factors affecting the stability of caverns. The coupled static–dynamic loading causes different failure characteristics in the surrounding rock compared to those in shallow caverns [4,5]. Investigating the dynamic responses of deep caverns under dynamic disturbances can provide valuable insights into the failure mechanisms of the surrounding rock.
When the dynamic disturbances propagate into the cavern boundary, stress wave scattering occurs, which results in the concentration of dynamic stress around the cavern. Based on the method of wave function expansion, Pao and Mow [6] summarized analytical solutions for the scattering of harmonic plane P, SV, and SH waves around a circular opening. Utilizing complex variable theory, Liu et al. [7] proposed a new analytical method to calculate the dynamic stress concentration factors around non-circular caverns under harmonic waves. On this basis, Bouare et al. [8] compared the stress and displacement fields induced by harmonic plane waves around cavities with different cross-sectional shapes. Their results showed that the steady-state responses of circular and elliptical openings are symmetrical with respect to the horizontal axis, while the responses of U-shaped openings are asymmetrical. Moreover, Liu et al. [9] and Zhang et al. [10] investigated the dynamic responses of cavities under harmonic waves in anisotropic rock masses. They found that incident angle, wave frequency, and cavity size have a considerable influence on the dynamic stress concentration factor around the underground structures. Yi et al. [11] and Fang et al. [12,13] obtained the steady-state response characteristics of lined tunnels through mapping the tunnel into an annular region, and analyzed the effects of bonding conditions and distance of the wave source on the distribution of dynamic stress around the tunnel.
The mentioned studies mainly focused on the dynamic response of the surrounding rock under harmonic waves. In fact, the dynamic disturbances induced by blasting, rockburst, and other activities in practical engineering should be considered as transient loads. These aperiodic disturbances suddenly act on the underground structures with short duration, resulting in non-periodic transient responses of the surrounding rock.
Numerous works have been conducted to investigate the dynamic responses around deep caverns subjected to transient loads. Li et al. [14] obtained a theoretical solution for the dynamic stress concentration factor around circular openings under blasting loads. The results showed that the dynamic stress concentration factors in the roof and floor are much larger than those in the sidewall when the blasting load arrives horizontally, while the dynamic amplification factors in the sidewalls are significantly greater than those in the roof and floor. Mei et al. [15,16] analytically investigated the time-domain responses around a circular cavity subjected to a transient P-wave, and noted that the wavelength of stress waves, the direction of disturbance, and the buried depth significantly affect the dynamic stress concentration factor and peak particle velocity of the surrounding rock. To investigate the influence of incident wavefront curvature, Tao et al. [17] and Lu et al. [18] calculated the dynamic tangential stress and particle velocity response of circular cavities under cylindrical P-waves. Their findings indicated that the cylindrical P-wave could be treated as a plane P-wave when the distance between the wave source and cavity was fifteen times larger than the radius of the cavity.
In addition, the failure characteristics of caverns subjected to dynamic disturbances have been investigated through laboratory experiments and numerical simulations. Wu et al. [19] carried out SHPB (split Hopkinson pressure bar) impact loading tests on sandstone samples containing differently shaped holes. It was observed that the occurrence of spalling cracks in samples with a circular opening was more severe, when compared to samples with a non-circular opening. Wang and Cai [20] utilized the spectral-element package (SPECFEM2D) to simulate seismic wave diffraction around U-shaped caverns, and discovered amplification and shielding PPV (peak particle velocity) zones around the caverns. Zhu et al. [21] reproduced the dynamic failure process of deep caverns under dynamic disturbance using RFPA (rock failure process analysis), and found that the magnitude and duration of disturbance had a positive correlation with dynamic responses. Li et al. [22] used the particle-based numerical manifold method (PNMM) to simulate the spalling and rockburst processes of a cavern under dynamic disturbances, and pointed out that the in situ stress field is a key factor affecting the failure degree of the surrounding rock.
According to the reviewed literature, it can be seen that the dynamic responses of non-circular caverns significantly differ from those of circular caverns. In practical engineering, caverns are usually designed with a U-shaped cross-section [23,24]; however, previous theoretical analyses have primarily concerned the transient response of circular openings, while limited studies have focused on the transient response of non-circular caverns. In addition, the failure characteristics of non-circular caverns have been primarily qualitatively analyzed based on laboratory experiments and numerical simulations. Therefore, additional research on the failure mechanisms of non-circular caverns subjected to transient loading is still necessary.
To further investigate the failure mechanisms of deep U-shaped caverns subjected to transient loading, the theoretical solution of the dynamic stress concentration factor around a U-shaped cavern subjected to a transient P-wave was calculated based on the wave function expansion method, the conformal mapping theorem, and the Fourier transform in this study. Subsequently, a two-dimensional numerical model was established using the discrete element software PFC2D (Particle Flow Code), in order to validate the theoretical results. The energy evolution laws and the failure characteristics around U-shaped caverns under coupled static–dynamic loading were investigated systematically. These findings are essential for understanding the dynamic stress concentration and disaster mechanisms induced by dynamic disturbances of deep underground caverns.

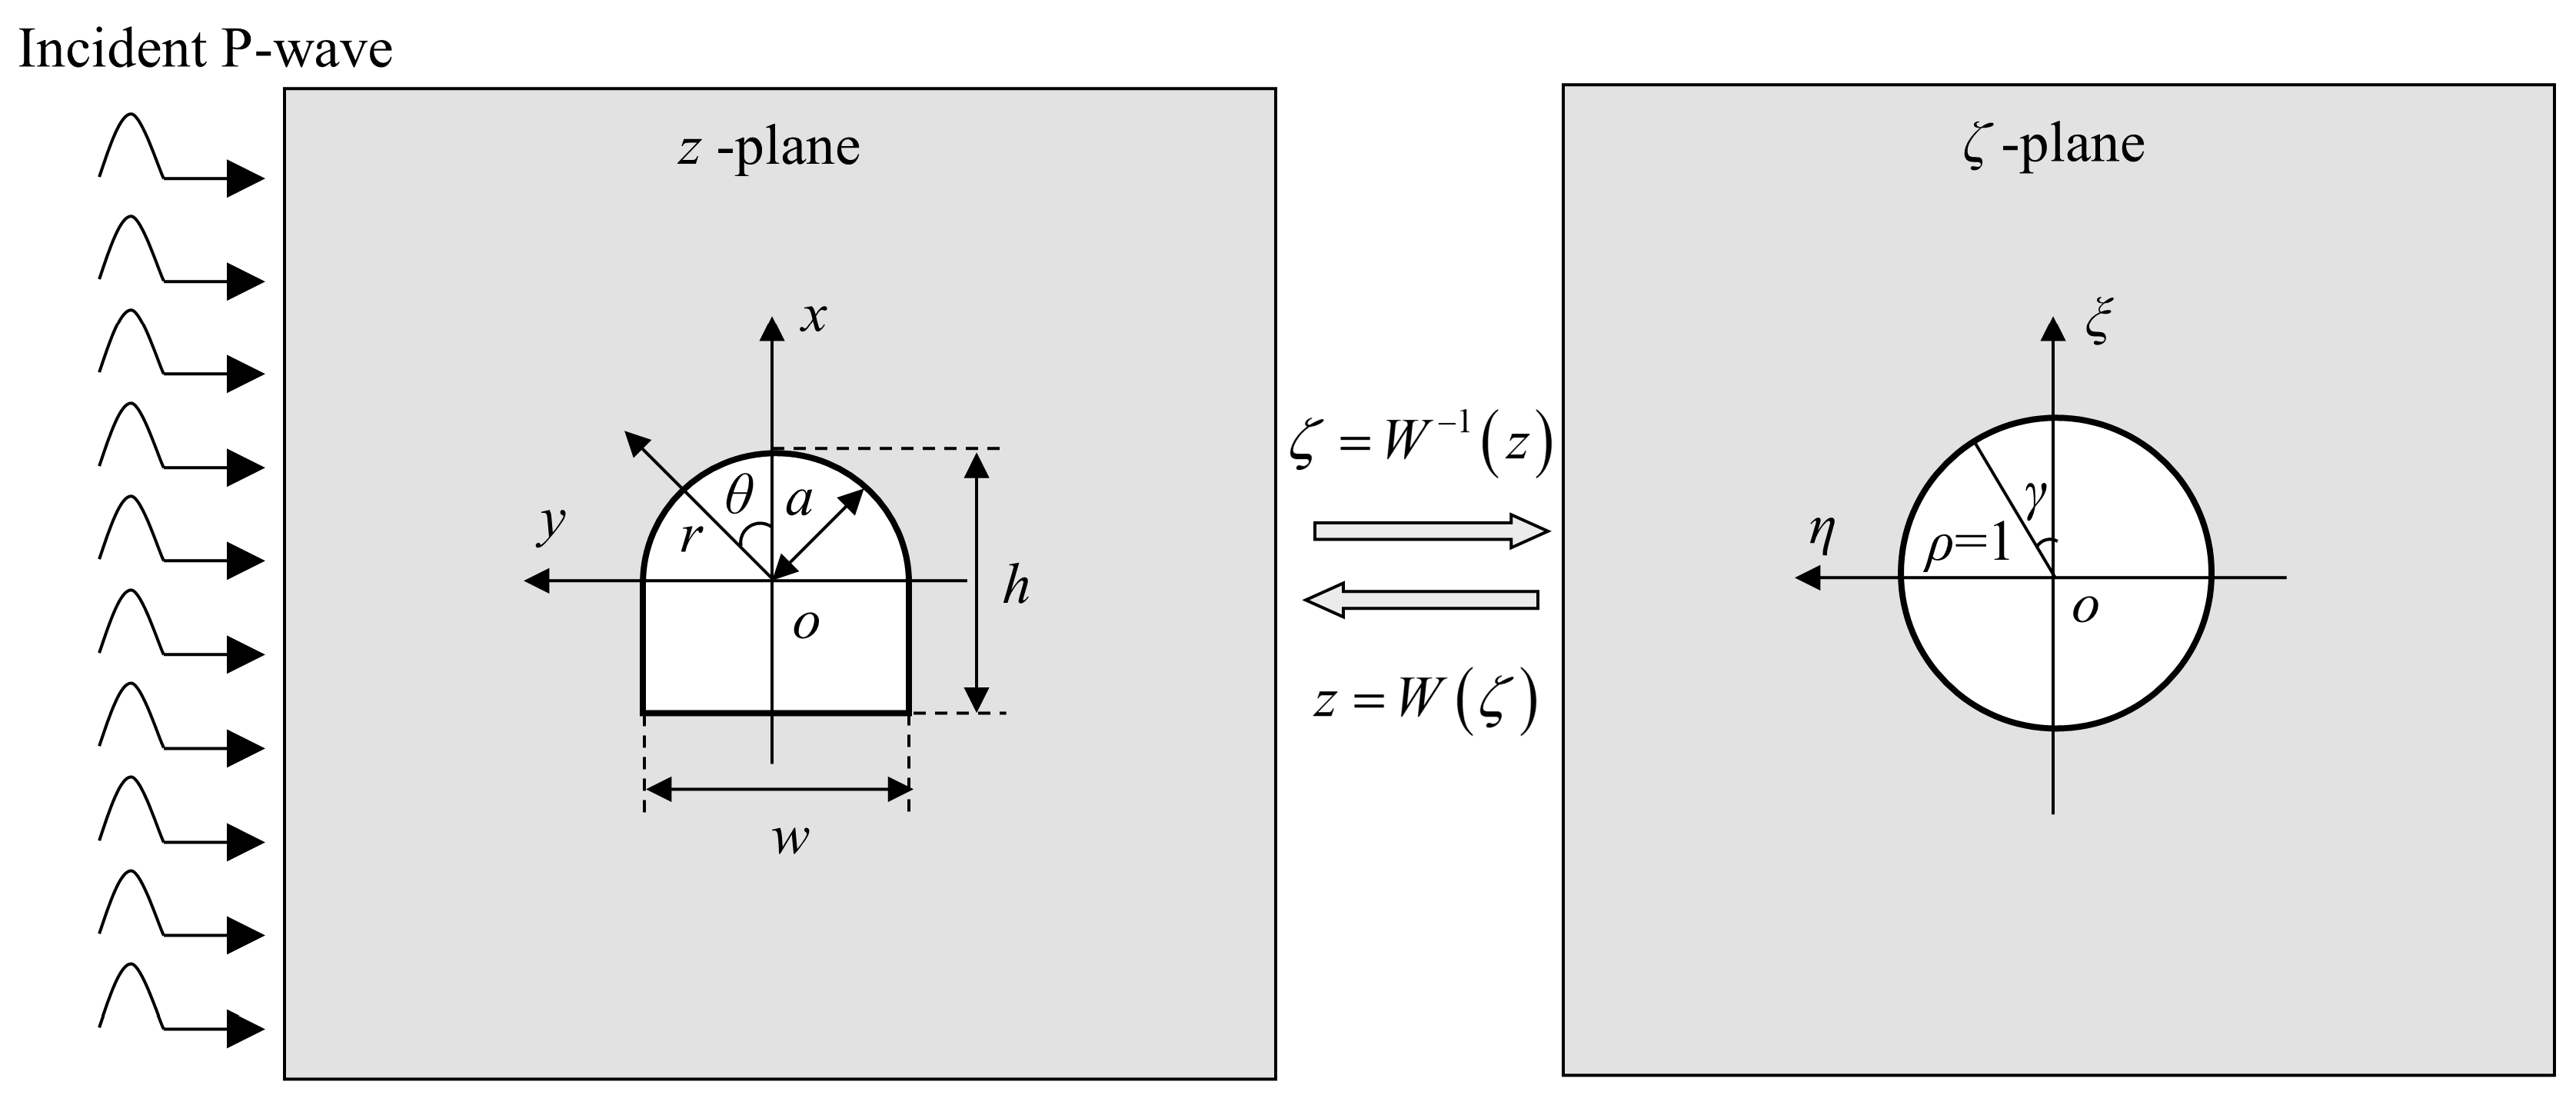
2. Theoretical Analyses for the Dynamic Responses of U-Shaped Caverns

Deep U-shaped caverns under dynamic disturbances are subjected to coupled static–dynamic loading, and the mechanical response of the surrounding rock can be decomposed into static and dynamic responses. The stress distribution around a U-shaped cavern under initial static loading can be calculated using the theory of complex variables. This section derives the theoretical solution for the dynamic responses of U-shaped caverns subjected to transient disturbances.
In the theoretical analysis, it is assumed that the cavern is located in an infinitely homogeneous rock mass. The conformal mapping method can be used to solve the scattering problem of stress waves around U-shaped caverns [7,25,26]. As shown in Figure 1, the exterior of the cavern section in the z-plane ( z = x + i y , z ¯ = x i y ) can be transformed into the exterior of a unit circle in the ζ-plane ( ζ = ρ e i γ ) using the mapping function z = W ( ζ ) . When the disturbance source is far away from the cavern, the dynamic disturbance can be simplified to a plane stress wave [17,18]. In this study, the plane P-wave is incident from the left side of the model. The x-axis is set along the axis of symmetry of the cavern (i.e., along the vertical direction) in order to simplify the calculations.

2.1. Dynamic Responses of U-Shaped Cavern under the Harmonic Wave

As shown in Figure 1, when harmonic P-waves are horizontally incident from the left side of the cavern, this incident wave can be expressed as follows [6]:
φ ( i ) = φ 0 e 0.5 α ( W ( ζ ) W ( ζ ) ¯ ) i ω t ,
where φ 0 is the amplitude, ω is the circular frequency, α = ω / c p is the P-wave number, c p is the P-wave velocity, t denotes the time, and i = 1 .
When a plane P-wave propagates to the boundary of the cavern, the scattered P-waves φ ( r ) and SV-waves ψ ( r ) are generated from the cavern boundary. Based on the wave function expansion method, the scattered wave can be expressed as follows [7]:
φ ( r ) = n = a n H n ( 1 ) ( α | W ( ζ ) | ) [ W ( ζ ) | W ( ζ ) | ] n e i ω t ,
ψ ( r ) = n = b n H n ( 1 ) ( β | W ( ζ ) | ) [ W ( ζ ) | W ( ζ ) | ] n e i ω t ,
where β = ω / c s is the S-wave number, c s is the S-wave velocity, H n ( 1 ) is the first Hankel function, and an and bn are undetermined coefficients.
According to the superposition principle of stress waves, the total wave field in the surrounding rock can be expressed as
φ = φ ( i ) + φ ( r ) = φ 0 e 0.5 α ( W ( ζ ) W ( ζ ) ¯ ) i ω t + n = a n H n ( 1 ) ( α | W ( ζ ) | ) [ W ( ζ ) | W ( ζ ) | ] n e i ω t
ψ = ψ ( r ) = n = b n H n ( 1 ) ( β | W ( ζ ) | ) [ W ( ζ ) | W ( ζ ) | ] n e i ω t .
The corresponding stress field around the cavern is
σ r = ( λ + μ ) α 2 φ + 2 μ [ ζ 2 ρ 2 W ( ζ ) ¯ ζ ( 1 W ( ζ ) ζ ( φ + i ψ ) ) + ζ ¯ 2 ρ 2 W ( ζ ) ζ ¯ ( 1 W ( ζ ) ¯ ζ ¯ ( φ i ψ ) ) ]
σ θ = ( λ + μ ) α 2 φ 2 μ [ ζ 2 ρ 2 W ( ζ ) ¯ ζ ( 1 W ( ζ ) ζ ( φ + i ψ ) ) + ζ ¯ 2 ρ 2 W ( ζ ) ζ ¯ ( 1 W ( ζ ) ¯ ζ ¯ ( φ i ψ ) ) ]
τ r θ = 2 i μ [ ζ 2 ρ 2 W ( ζ ) ¯ ζ ( 1 W ( ζ ) ζ ( φ + i ψ ) ) ζ ¯ 2 ρ 2 W ( ζ ) ζ ¯ ( 1 W ( ζ ) ¯ ζ ¯ ( φ i ψ ) ) ]
where σ r , σ θ , and τ r θ are radial, tangential, and shear stress components, respectively, and λ and μ are the Lame constants of the surrounding rock.
The boundary condition at ρ = 1 is
σ r + i τ r θ = 0 σ r i τ r θ = 0 } .
Substituting Equations (6) and (8) into Equation (9), the numerical solutions of the undetermined coefficients an and bn can be obtained through Fourier expansion.
According to Equation (1), the stress amplitude of the incident wave is
σ 0 = μ β 2 φ 0 .
Only tangential stress exists on the cavern boundary, which can be expressed as
σ θ = 2 ( λ + μ ) α 2 φ .
Thus, the dynamic stress concentration factor can be defined as the ratio of the tangential stress to the stress amplitude of the incident wave:
σ θ * = σ θ σ 0 = 2 ( λ + μ ) α 2 φ μ β 2 φ 0

2.2. Dynamic Responses of U-Shaped Cavern under the Transient Wave

In practical engineering, most dynamic disturbances are non-periodic loads, which are suddenly applied to the surrounding rock at a certain moment and gradually decrease to zero after a period of action. To obtain the transient response around the U-shaped cavern, the Fourier transform was conducted on the incident wave. Superimposing all frequency components of the steady-state response, the transient response of the surrounding rock mass can be calculated as
g ( t ) = 1 2 π p ( ω ) χ ( ω ) e i ω t d ω ,
where χ ( ω ) is the admittance function of the steady-state response and p ( ω ) is the Fourier transform of the incident wave P ( t ) .
To simplify the calculation, the transient load can be discretized into a series of pulse functions, and the transient response caused by the unit pulse function is
g δ ( t ) = 2 π 0 R ( ω ) cos ω t d ω ,
where R ( ω ) is the real part of the admittance function.
According to the Duhamel integral, the dynamic response around the U-shaped cavern under a transient load can be expressed as
g ( t ) = 0 t P ( τ ) g δ ( t τ ) d τ .
The blasting load is a typical transient disturbance in deep rock engineering, which can be simplified as a triangular wave [27,28,29]:
P ( t ) = { 0 , ( t < 0 ) t t r P d , ( 0 t < t r ) t s t t s t r P d , ( t r t < t s ) 0 , ( t t s ) ,
where Pd is the amplitude of the incident wave, and tr and ts are the rising time and total time of the incident wave, respectively. When t < t r , it is the incident wave loading stage, and when t r < t < t s , it is the incident wave unloading stage.
Substituting Equation (16) into Equation (15), the dynamic response of the U-shaped cavern under the transient stress waves can be obtained according to the following equations:
g ( r , θ , t ) = { 2 P d π t r 0 R ( ω ) ( 1 cos ω t ) ω 2 d ω , ( 0 < t < t r ) 2 P d π { 1 t r 0 R ( ω ) [ cos ω ( t t r ) cos ω t ] ω 2 d ω 1 t s t r 0 R ( ω ) [ 1 cos ω ( t t r ) ] ω 2 d ω } , ( t r < t < t s ) 2 P d π { 1 t r 0 R ( ω ) [ cos ω ( t t r ) cos ω t ] ω 2 d ω 1 t s t r 0 R ( ω ) [ cos ω ( t t s ) cos ω ( t t r ) ] ω 2 d ω } , ( t > t s )
The conformal mapping of the U-shaped cavern causes huge computational complexity when obtaining a theoretical expression for R ( ω ) . Therefore, the numerical solutions of transient responses were calculated using the trapezoidal integration method.

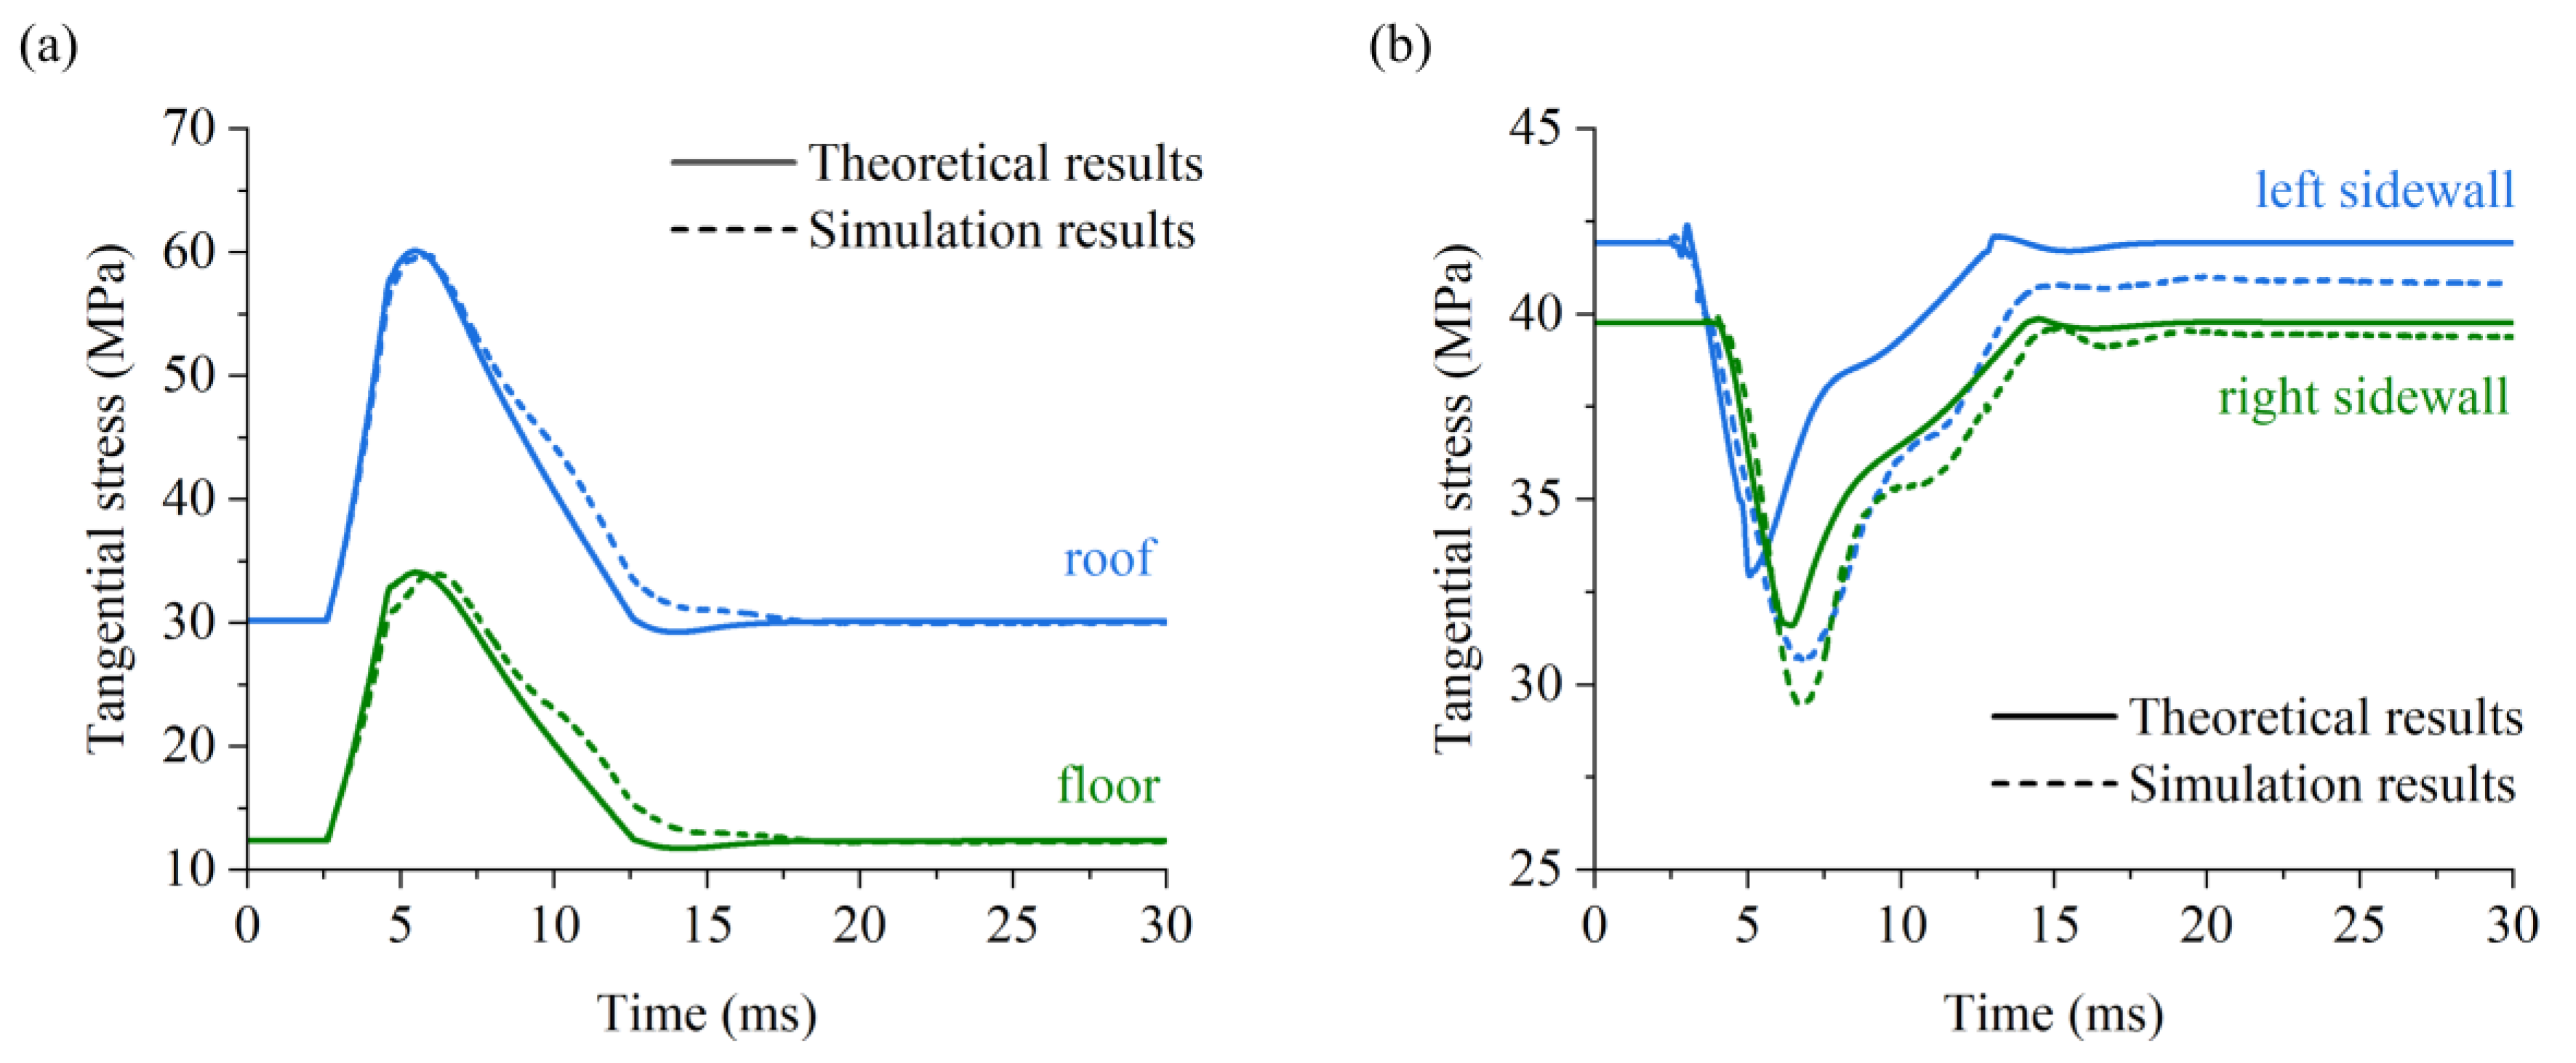
3. Theoretical Solutions and Analysis

In this study, the geometric dimensions of the U-shaped cavern were set as h = w = 2.5 m. According to previous work [30], the corresponding mapping function can be described as
z = W ( ζ ) = 1.348 ζ 0.141 0.008 ζ 1 + 0.114 ζ 2 0.108 ζ 3 + 0.038 ζ 4 + 0.010 ζ 5 .
The physical parameters of the surrounding rock were derived from the red sandstone in Linyi, Shandong, China. The corresponding density, elastic modulus, and Poisson’s ratio were 2440 kg/m3, 18.60 GPa, and 0.21, respectively. The time-varying dynamic stress concentration factors around the cavern boundary are shown in Figure 2 for when a plane P-wave is horizontally incident from the left of the model and the ratio of the total time to the rising time is ts/tr = 5.
It can be seen that the compressive stress concentration occurred in the roof and floor of the cavern. The dynamic stress concentration factor increased first and then decreased, resembling the waveform of the incident stress wave. The peak dynamic stress concentration factors in the roof and floor were considerably larger than the amplitude of the incident stress wave. Under the same stress wave, the peak value of the dynamic stress concentration factor in the roof was larger than that in the floor. Specifically, when the rising time of the stress wave was 4.0 ms, the peak value of tangential stress in the roof was 2.98 times the amplitude of the incident stress wave. However, the peak value at the midpoint of the floor was only 1.55 times the amplitude of the incident stress wave. When the incident stress wave was unloaded to zero, the dynamic compressive stresses in the roof and floor decreased, and the tangential stress may be converted to tensile stress in the roof and floor due to the fast unloading rate of the stress wave. With increasing rising time of the stress wave (and decreasing unloading rate), the unloading effect on the roof and floor gradually diminished.
As shown in Figure 2c,d, dynamic tensile stress concentration occurred in both sidewalls of the cavern, but the peak value of dynamic tensile stress was significantly lower than the peak value of dynamic compressive stress in the roof and floor. When tr = 0.5 ms, two negative peaks appeared on the evolution curves of the dynamic stress concentration factor of the sidewalls. As the incident stress wave was unloaded to zero, the dynamic stress concentration factors of the sidewalls increased to a positive peak first, then decreased to zero.
In addition, the numerical results show that the peak dynamic stress concentration factor σθp* of the surrounding rock was affected by the duration (wavelength) of the incident stress waves. The correlations between the peak dynamic stress concentration factor and the rising time of the stress wave at the midpoints of the roof, floor, and incident sidewall are illustrated in Figure 3. It can be seen that the σθp* values at the midpoints of the roof and floor increased first, then tended to remain steady as tr increased from 0.1 ms to 10.0 ms, while the opposite trend was observed at the midpoint of the incident sidewall. Moreover, the σθp* value at the midpoint of the roof was always larger than that for the floor. When the rising time of the incident stress wave was above 6.0 ms, the σθp* converged to a specific value. This indicates that the loading condition of the surrounding rock can be considered to be in a quasi-static loading state when the wavelength of the incident stress wave is much greater than the dimension of the cavern [31,32].

4. Failure Behaviors of Deep U-Shaped Caverns under Dynamic Disturbances

The theoretical results for the dynamic stress concentration factor around the U-shaped cavern induced by a plane P-wave were calculated. However, the in situ stress should also be taken into consideration for a deep-buried cavern. PFC2D is a discrete element software which is capable of simulating the cracking process of rock-like materials in two dimensions [33]. To further investigate the dynamic responses and failure characteristics of the deep U-shaped cavern under dynamic disturbances, a numerical model was established in PFC2D.

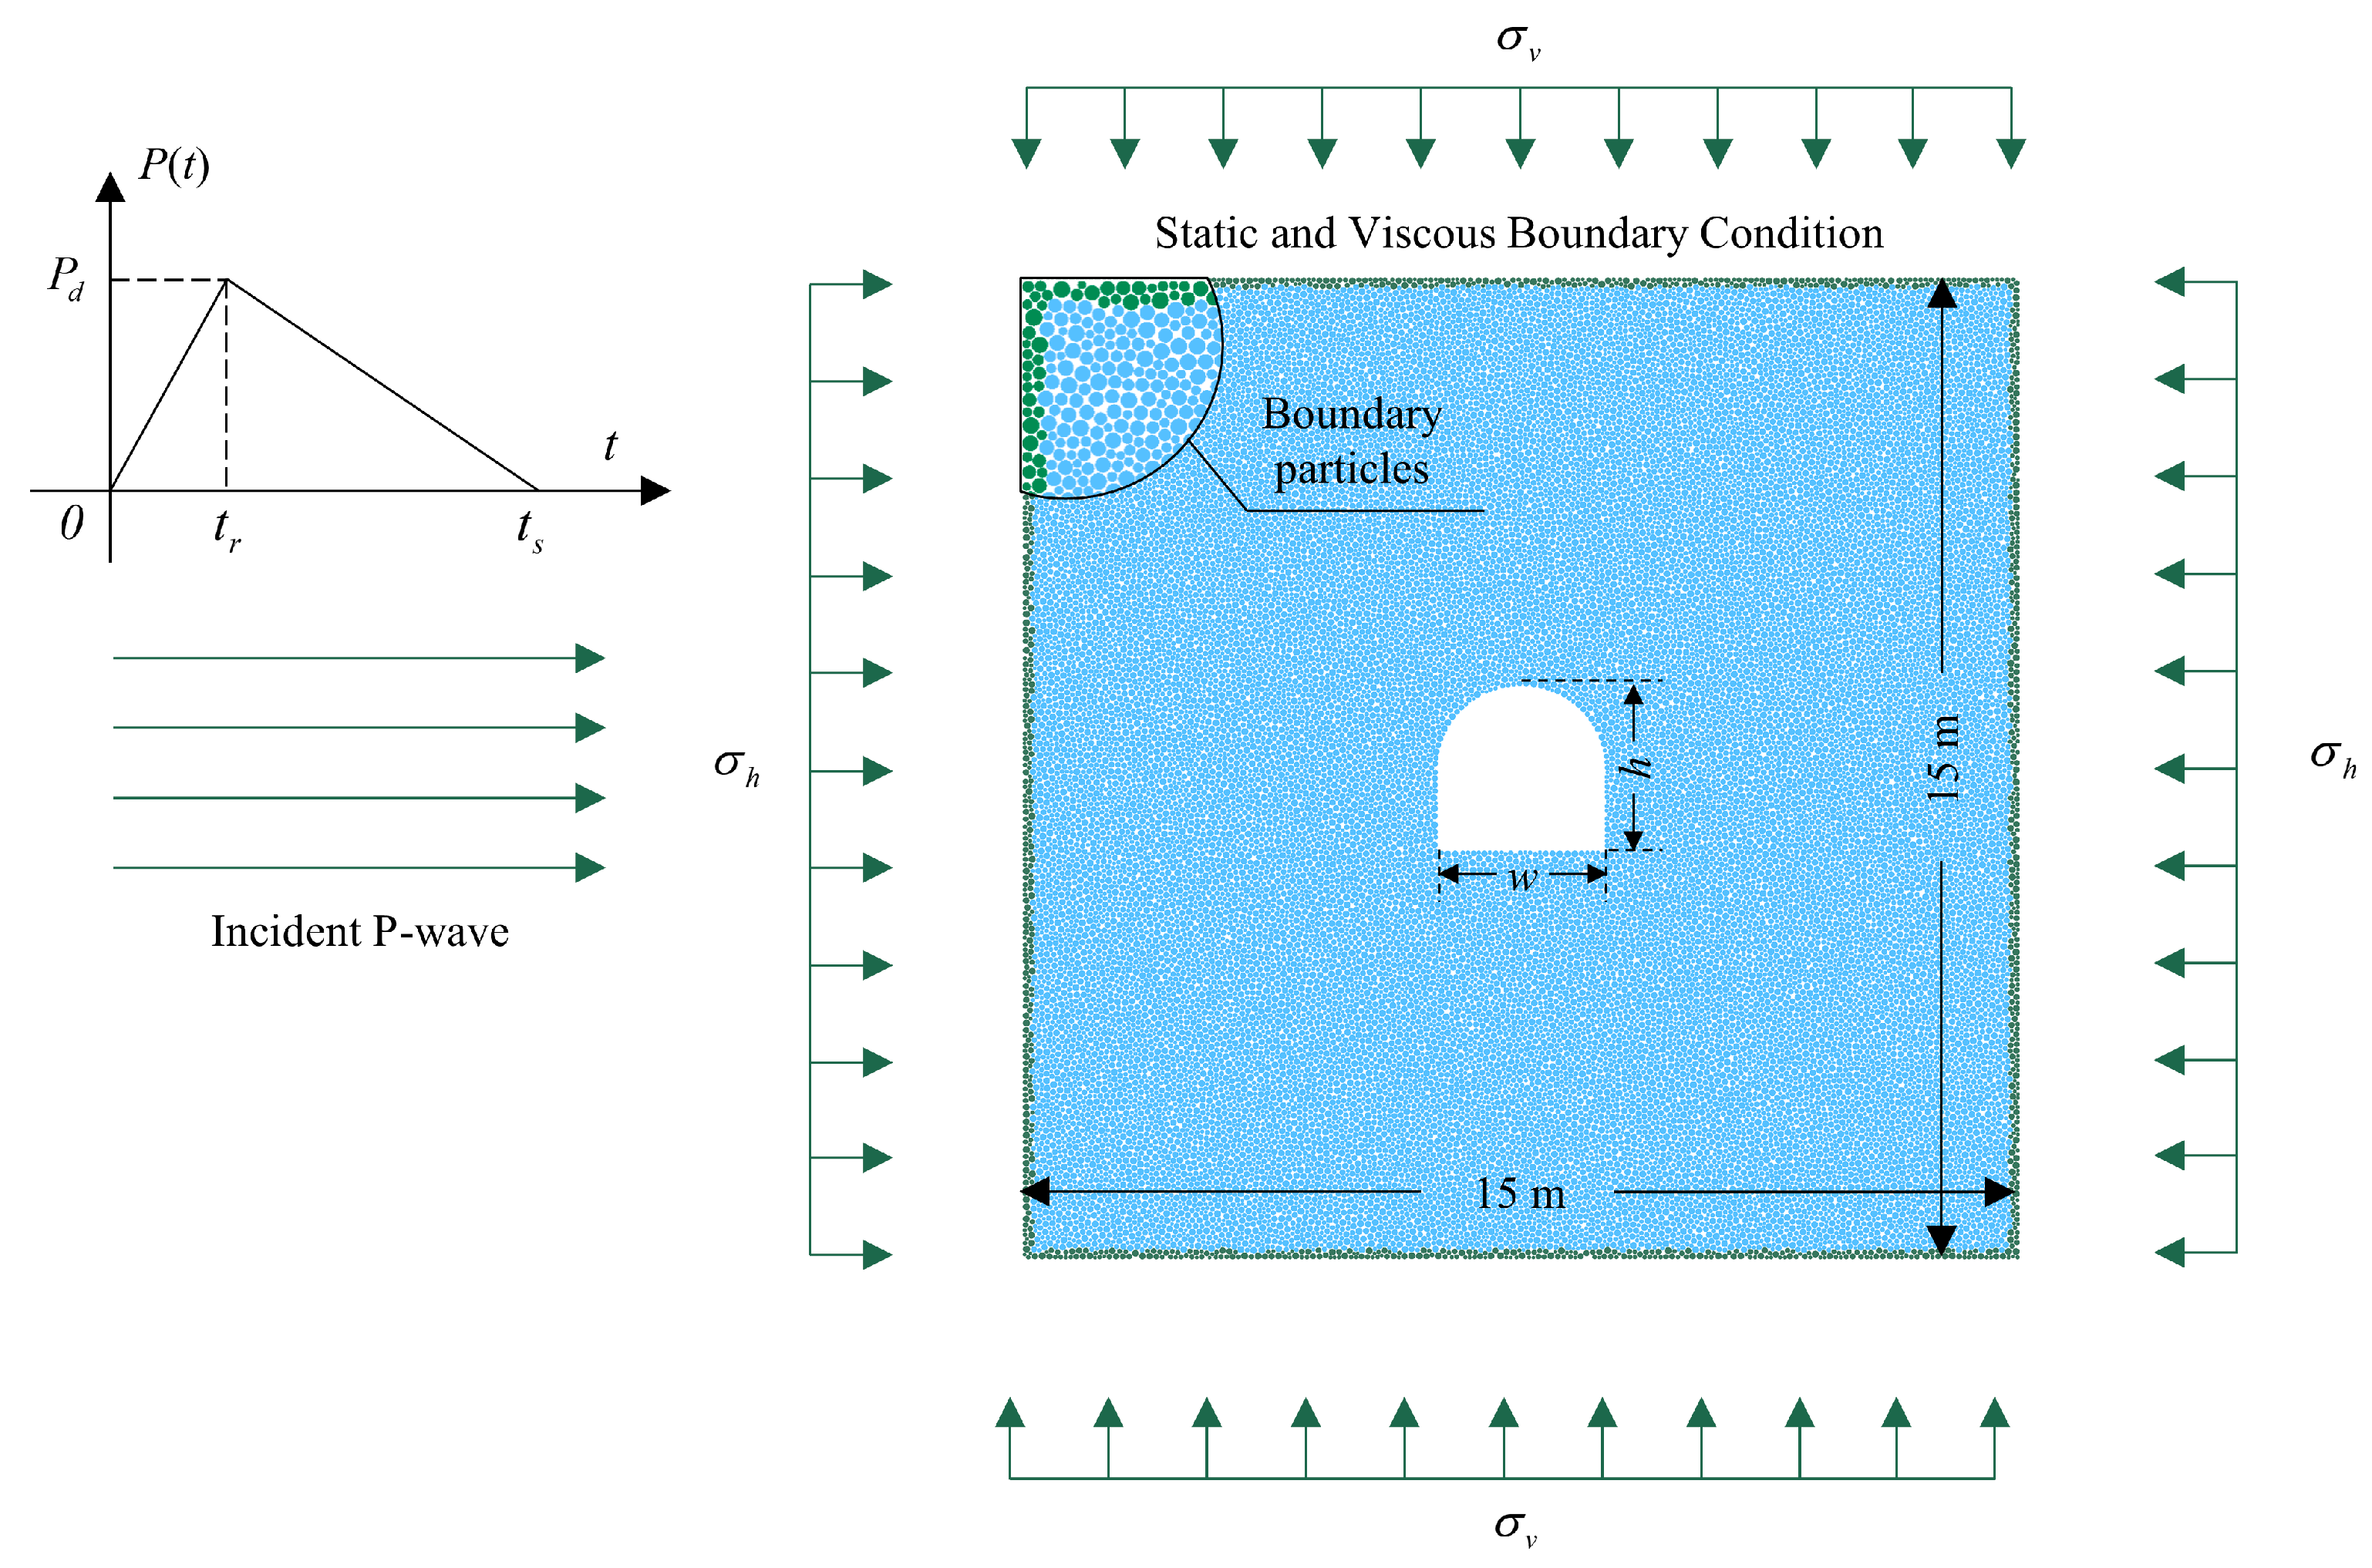
4.1. Numerical Model

As shown in Figure 4, a numerical model of a deep U-shaped cavern under coupled static and dynamic loading was constructed using the discrete element software PFC2D. It was assumed that the cavern was located in a homogenous and isotropic infinite rock mass. The dimensions of the model were 15 × 15 m, and the height and width of the U-shaped cavern were h = w = 2.5 m, respectively. The model contained about 30,000 particles. The radii of particles ranged from 0.03 to 0.06 m and followed a uniform distribution. Compared with the contact-bond model and the parallel-bond model, the flat-joint model could simulate the interlocking of the polygonal grain structure and match the mechanical parameters and cracking behavior of real rock well. Therefore, the flat-jointed model was employed in the numerical model. When the contact stress between two particles exceeded the tensile or shear strength of the contact element, a corresponding tensile microcrack or shear microcrack was generated. With the coalescence of these microcracks, macroscopic failure occurred in the surrounding rock. The mechanical parameters of the model are listed in Table 1 and Table 2, which have been validated through uniaxial compression and Brazilian tests in previous work [30]. According to the testing results, the wave velocity of the model was cp = 2781 m/s. The confining stress and dynamic disturbance were loaded at the particle boundary. To avoid the generation of reflected waves from the model boundary, the viscous boundary condition was employed [14]. At first, the in situ stress was loaded at a loading rate of 5.5 × 10⁻⁴ MPa/step. Subsequently, a triangular plane P-wave was applied on the left side of the model, in order to investigate the energy evolution law and the failure characteristics around the U-shaped cavern.

4.2. Evolution Processes of Dynamic Responses of Deep U-Shaped Caverns under Coupled Static–Dynamic Loading
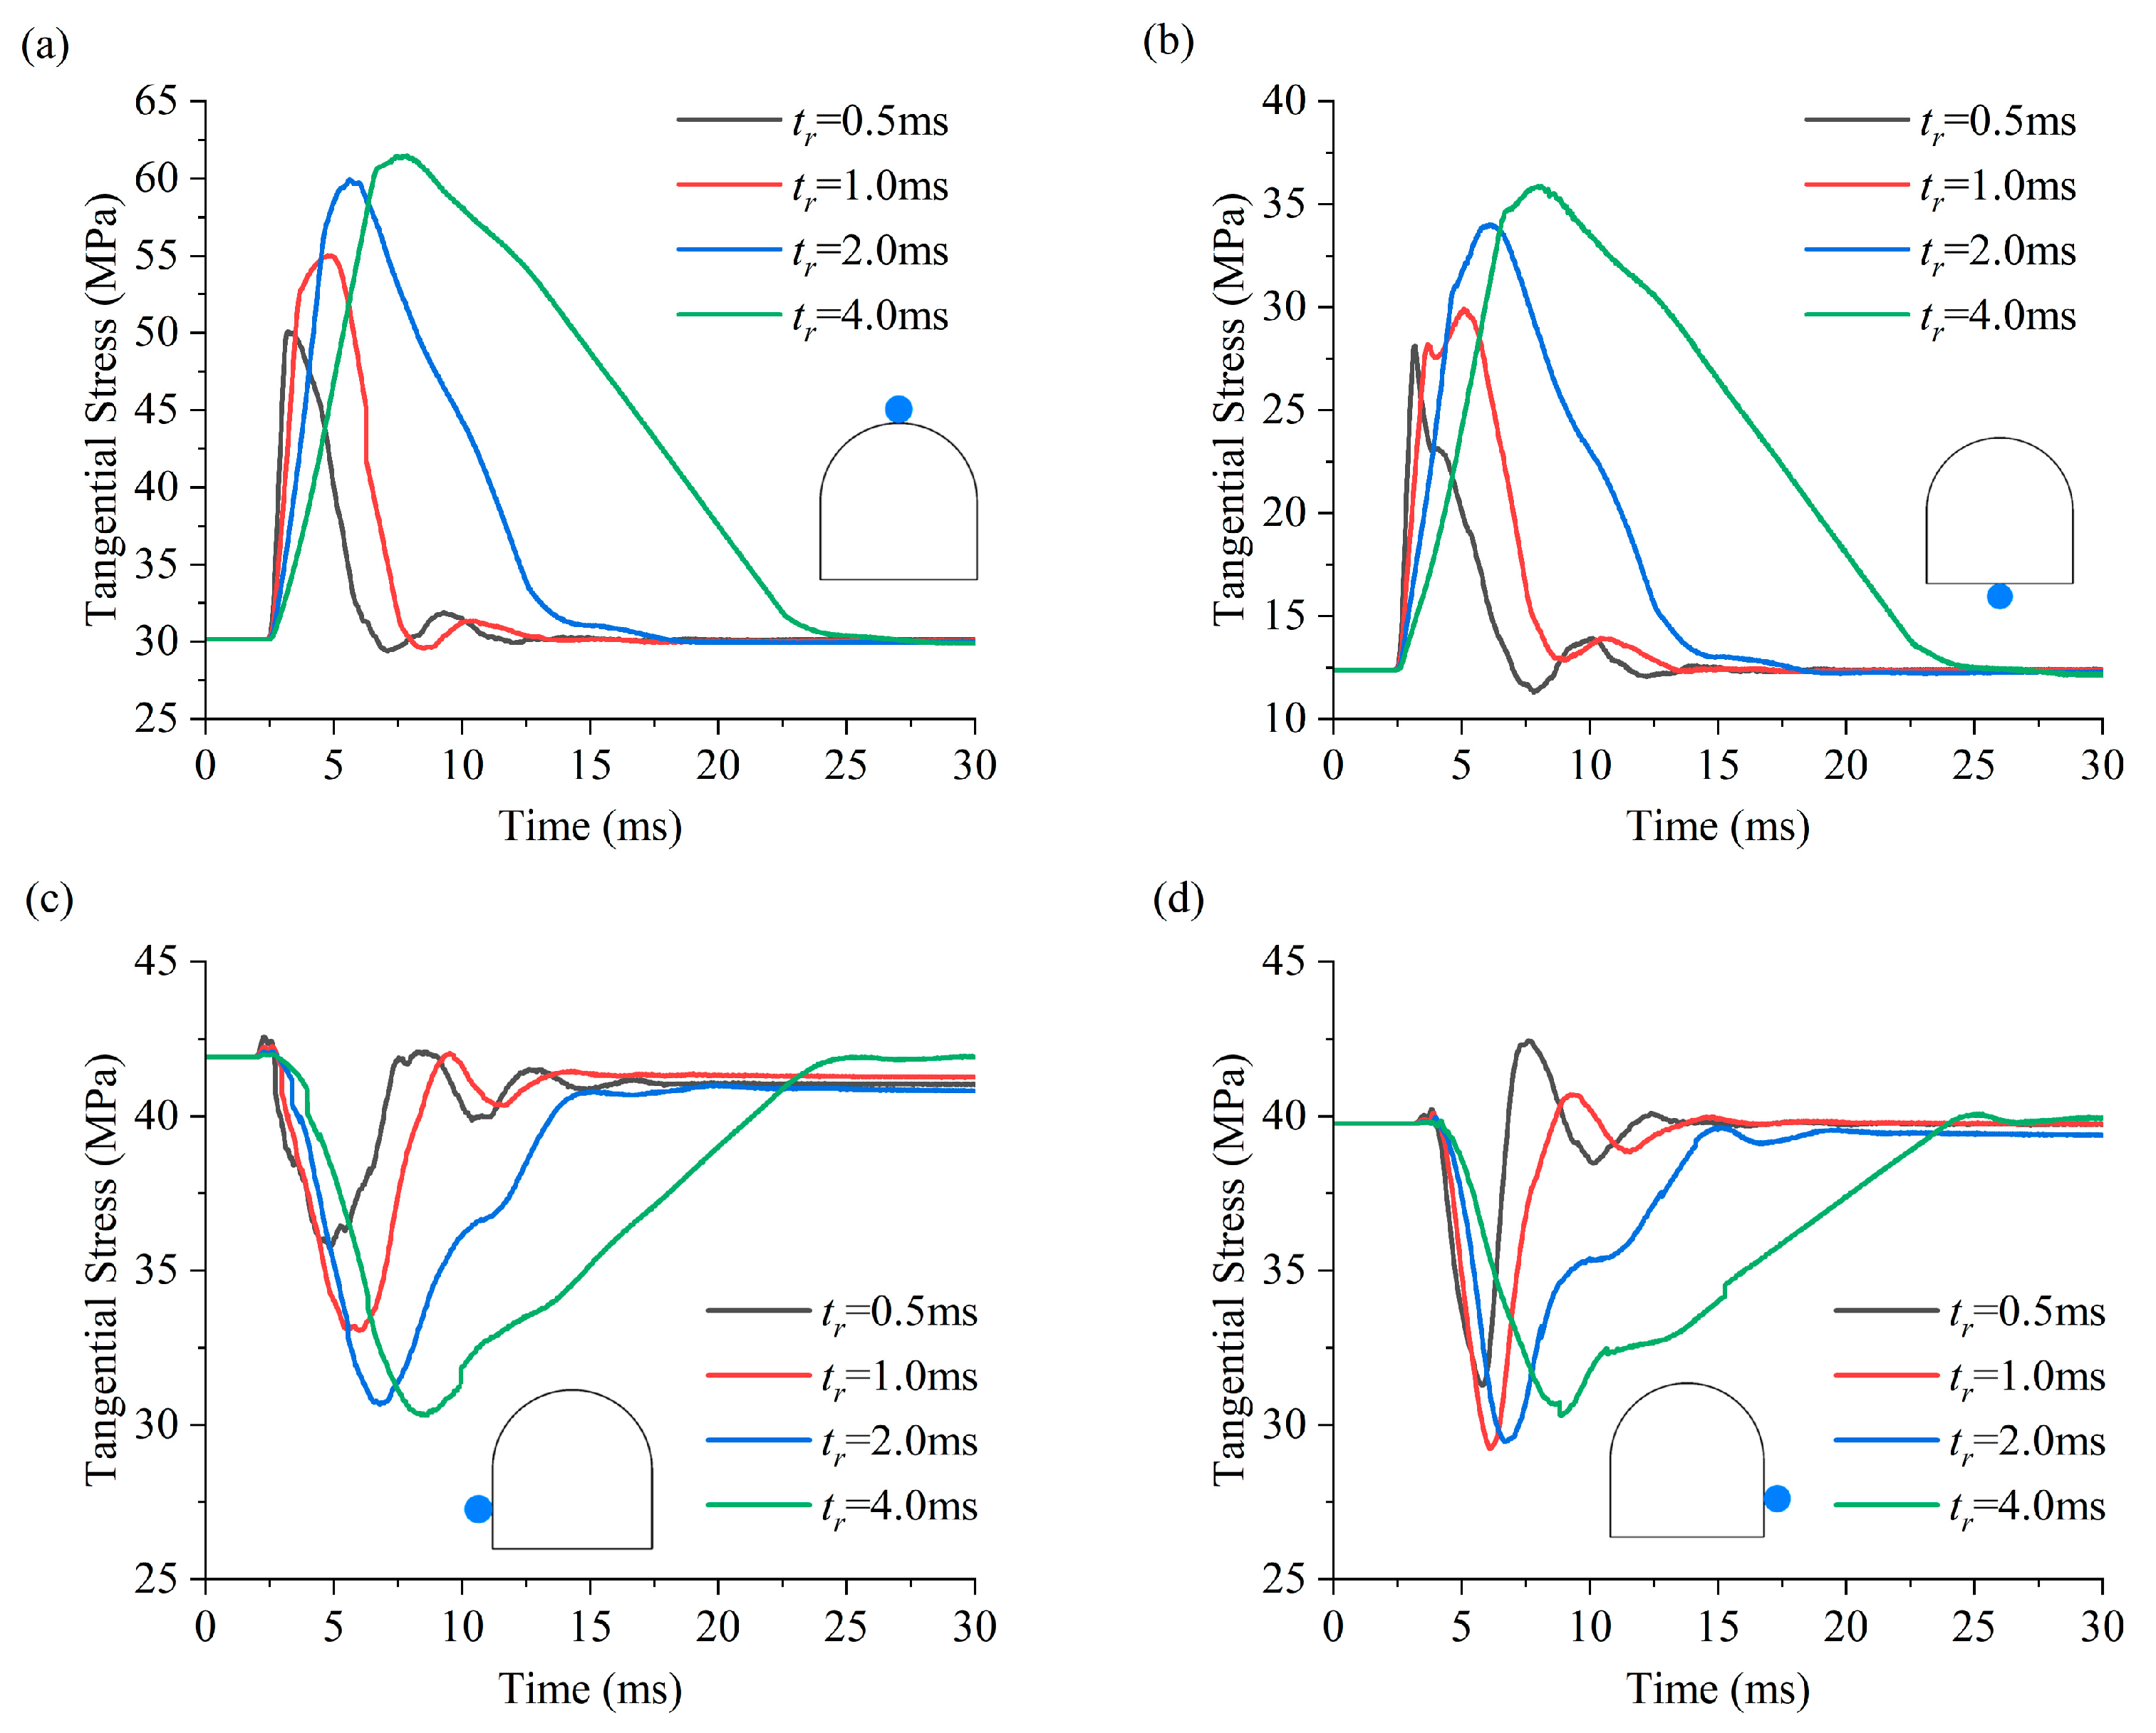
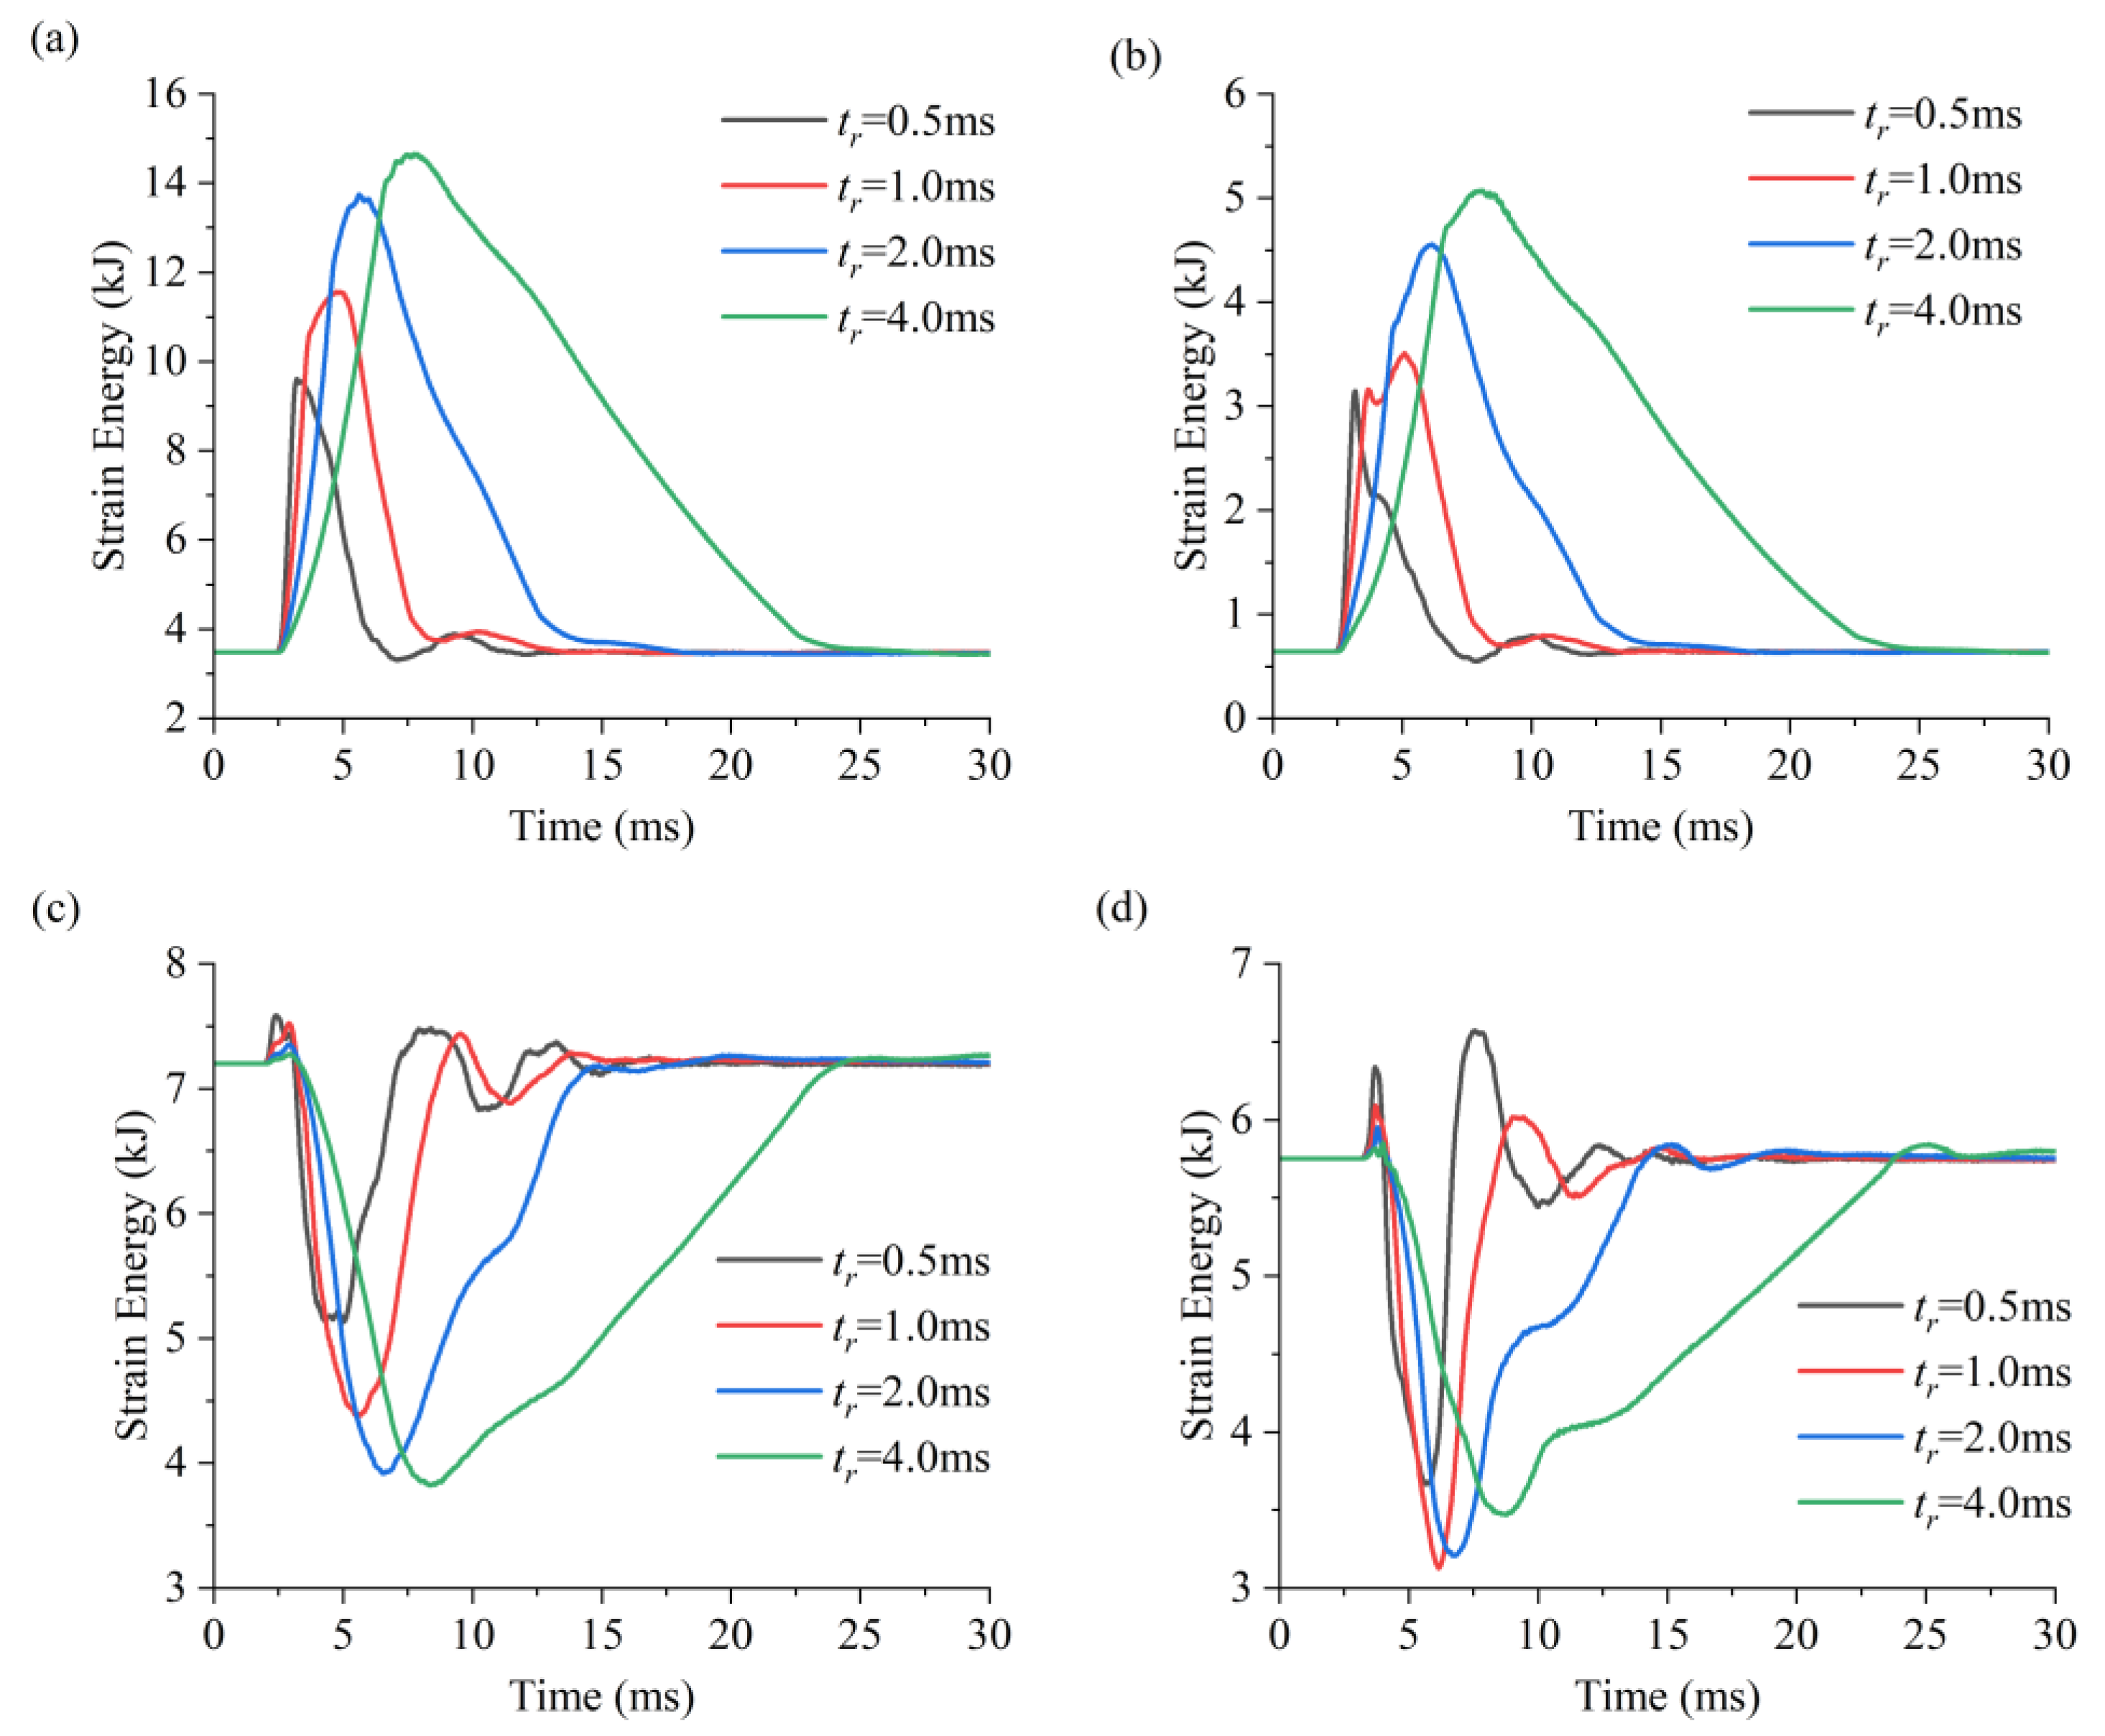
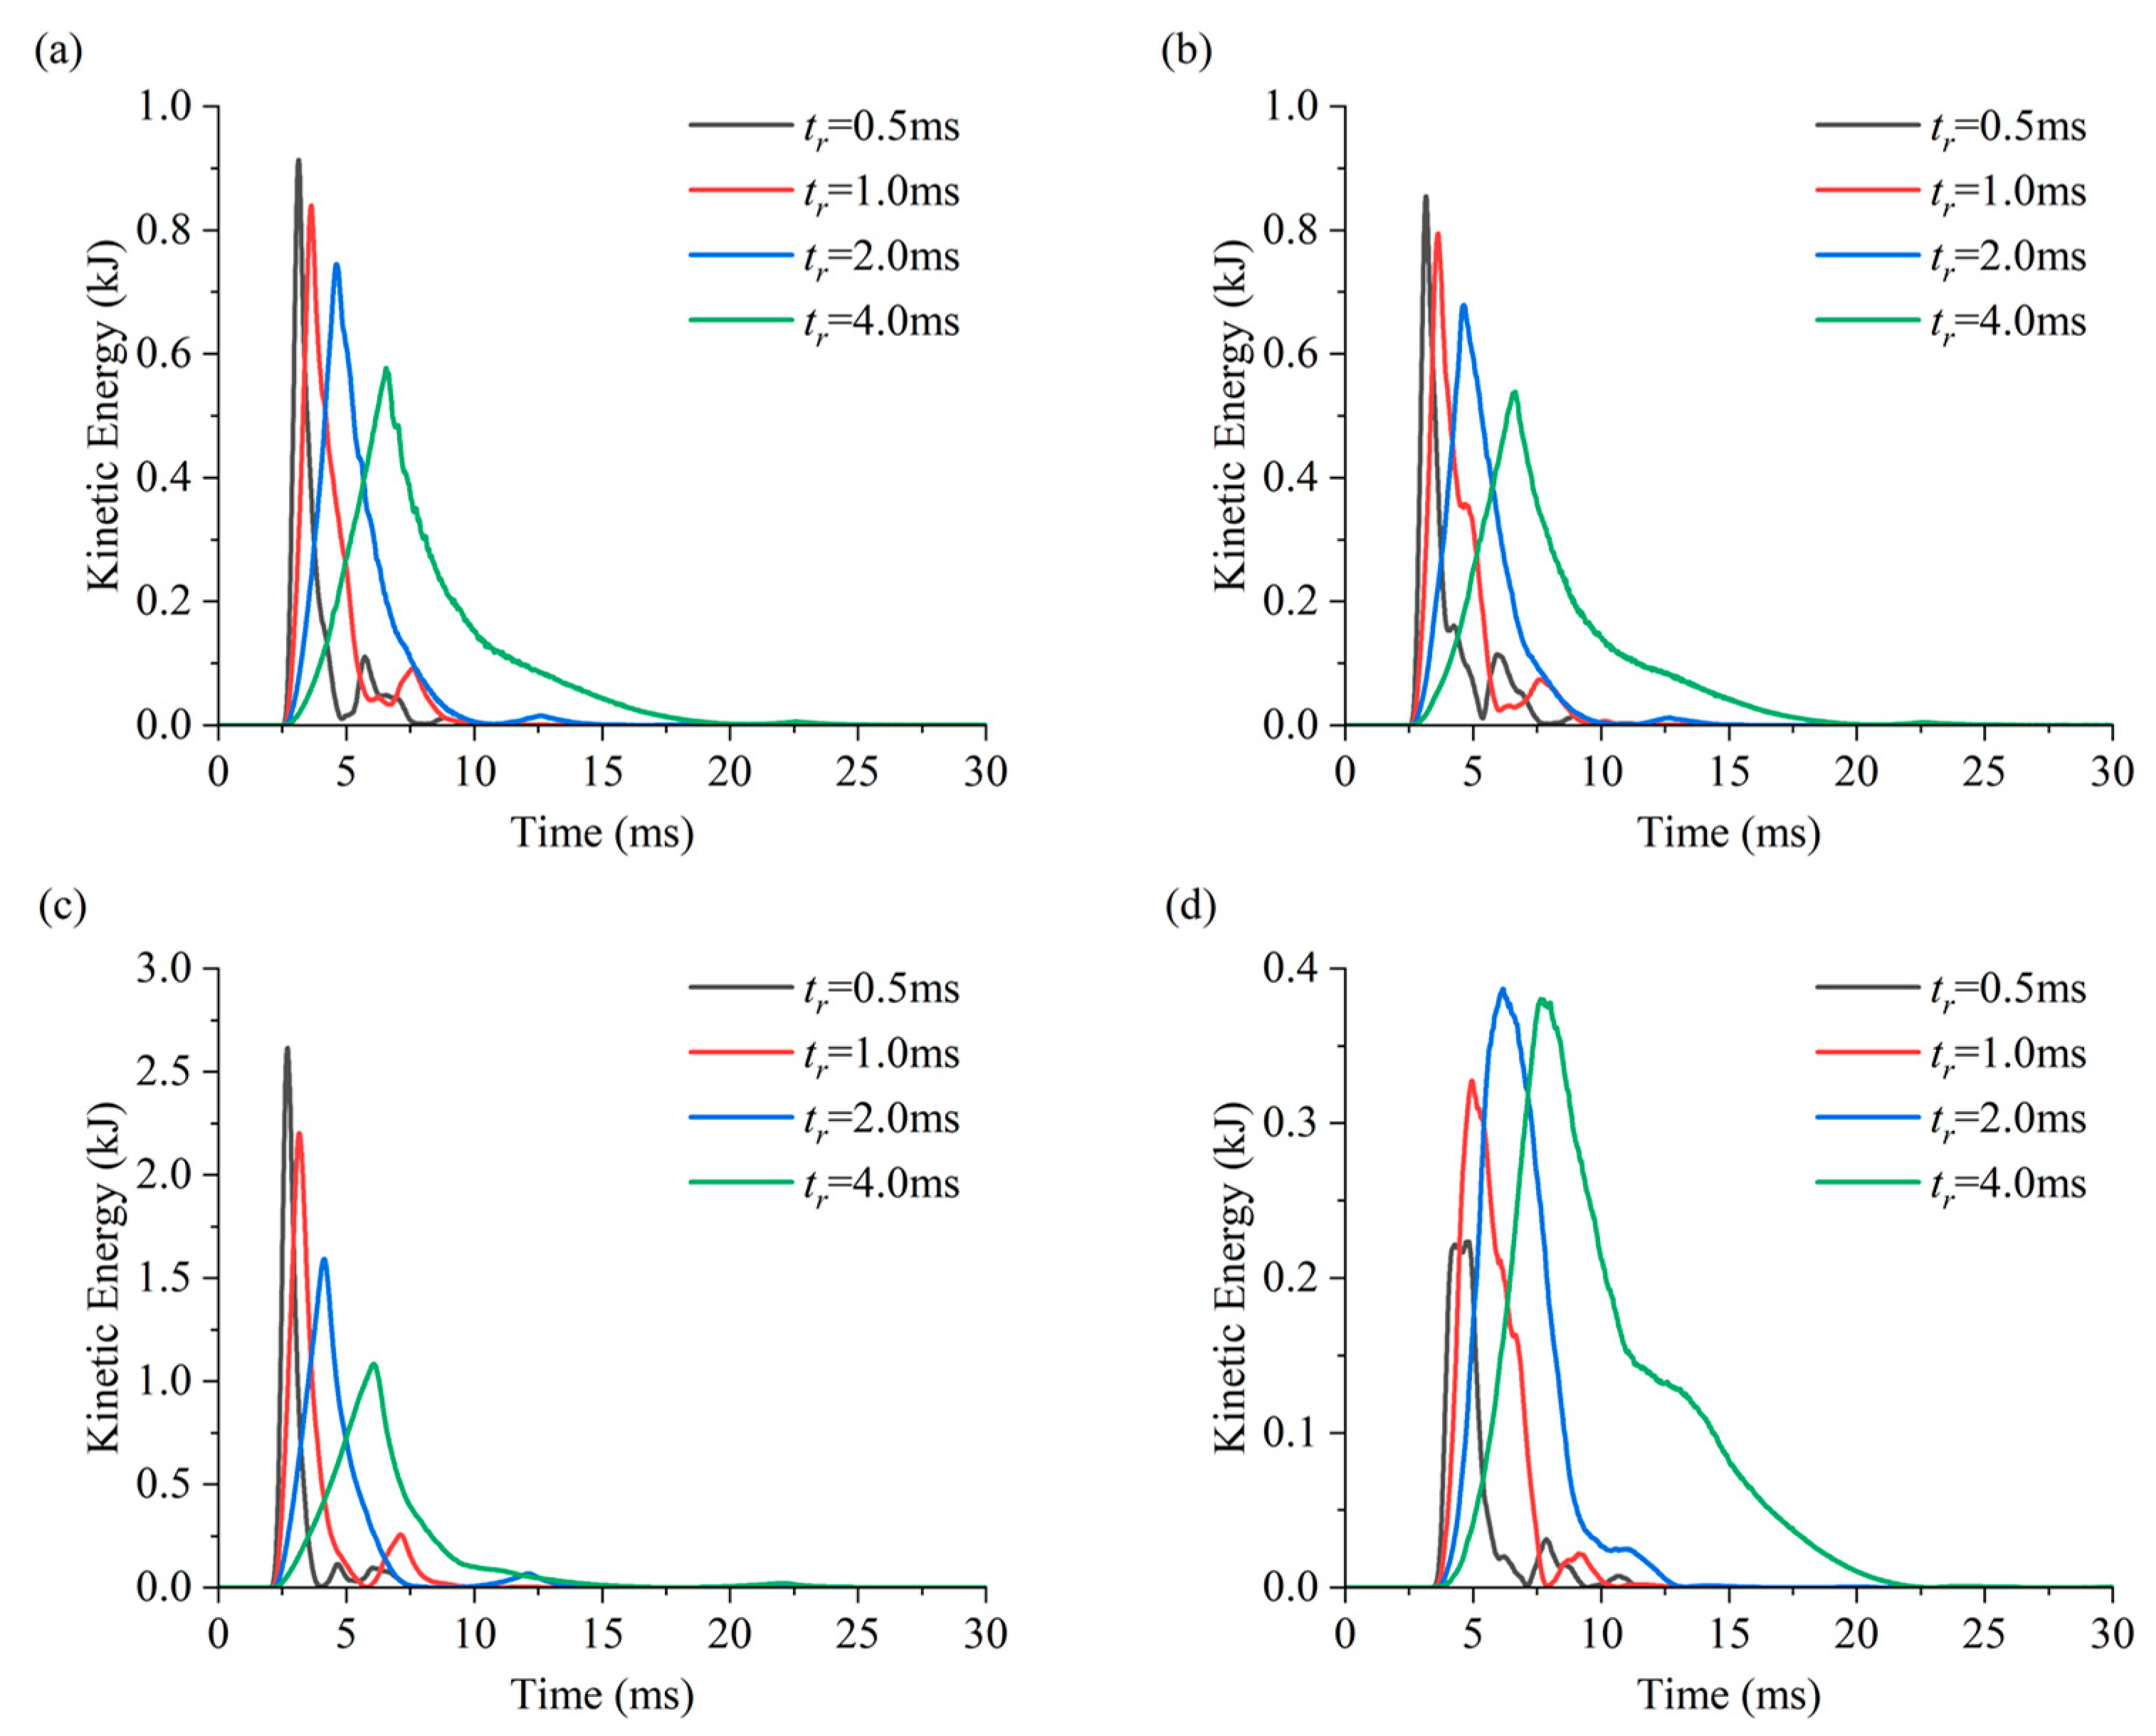
The buried depth of the U-shaped cavern was set to 1000 m. According to the stress field of China [34], the corresponding vertical and horizontal principal stresses were set ass 26.1 MPa and 18.7 MPa, respectively. The amplitude of the incident stress wave was 15 MPa and the ratio of the total time to the rising time was ts/tr = 5. In order to investigate the stress and energy evolution around the cavern, four measurement circles were set at the midpoints of the roof, floor, and both sidewalls, where the radii of the measurement circles were 0.22 m. In Figure 5, the blue circles represent the positions of the measurement points. The evolution curves of the tangential stress, strain energy, and kinetic energy at different positions of the U-shaped cavern are shown in Figure 5, Figure 6 and Figure 7 and their peak values are illustrated in Table 3, for different rising times of the stress wave (tr = 0.5, 1.0, 2.0, and 4.0 ms).
As the lateral pressure coefficient was less than 1.0, the static tangential stress around the sidewall was larger than those around the roof and floor of the cavern. When the stress wave propagates to the cavern boundary, the tangential stress at the cavern boundary changes accordingly. The stress at the left boundary changed first since the stress wave was horizontally incident from the left side of the cavern.
As shown in Figure 5c, the tangential stress on the left sidewall rapidly decreased at first, when the stress wave was horizontally incident from the left side of the cavern. The larger the rising time, the larger the decline of tangential stress at the midpoint of the left sidewall. When tr = 4.0 ms, the tangential stress at the midpoint of the left sidewall decreased from 41.9 MPa to 30.3 MPa. In the unloading process, the tangential stress on the sidewall increased. Due to the unloading effect of the stress wave, the tangential stress evolution curve exhibited a positive peak and then gradually returned to the initial stress level. Due to the existence of the initial static stress, no tensile stress was observed in the sidewall. This indicates that the high in situ stress is conducive to limiting the occurrence of tensile failure in the sidewall along the horizontal direction.
Figure 5. Tangential stress evolution of different points of the U-shaped cavern under coupled static–dynamic loading (Pd = 15 MPa): (a) midpoint of the roof; (b) midpoint of the floor; (c) midpoint of the left sidewall; and (d) midpoint of the right sidewall.
Mathematics 12 01836 g005
Figure 6. Strain energy evolution of the U-shaped cavern under coupled static–dynamic loading (Pd = 15 MPa): (a) roof; (b) midpoint of the floor; (c) midpoint of the left sidewall; and (d) midpoint of the right sidewall.
Mathematics 12 01836 g006
Figure 7. Kinetic energy evolution of the U-shaped cavern under coupled static–dynamic loading (Pd = 15 MPa): (a) roof; (b) midpoint of the floor; (c) midpoint of the left sidewall; and (d) midpoint of the right sidewall.
Mathematics 12 01836 g007
Table 3. Peak values of tangential stress, strain energy, and kinetic energy.
Position Tangential Stress (MPa)Strain Energy (kJ)Kinetic Energy (kJ)
tr (ms)0.51.02.04.00.51.02.04.00.51.02.04.0
Roof50.1055.0159.9361.489.6011.5613.7414.650.910.840.740.58
Floor28.1329.9234.0035.883.153.504.565.070.850.790.680.54
Left sidewall35.7333.0630.6730.314.824.183.743.672.612.201.591.08
Right sidewall31.2729.2429.4430.314.203.733.804.110.220.330.390.38
Tangential stress and strain energy in the left sidewall and right sidewall are minimal values.
With the further propagation of stress waves, the dynamic responses occurred on the roof and floor of the cavern. As shown in Figure 5a,b, the tangential compressive stresses in the roof and floor increased rapidly as the incident stress wave propagated to the roof and floor. The larger the rising time, the higher the peak value of tangential stress. When tr = 4.0 ms, the maximum increase in tangential stress in the roof was 31.3 MPa, while the maximum increase in tangential stress in the floor was 23.5 MPa. The dynamic stress concentration in the roof was more significant than that in the floor. Compared with that in shallow caverns, a higher static compression concentration occurs at the roof and floor of deep-buried caverns, making dynamic failure more prone to occur. To improve the safety of deep-buried engineering, the disturbance amplitude needs to be minimized as much as possible.
Due to the microheterogeneity of the model, there was a slight difference in the initial stress between the right and left sidewalls. As shown in Figure 5d, when the stress wave propagated to the right side of the cavern, the tangential stress at the midpoint of the right sidewall decreased first. Then, it was restored to the initial value, resembling the stress evolution process of the left sidewall.
It is noteworthy that the tangential stresses in the numerical simulation were obtained by the measurement circles, which represent the average stress over the measurement region. Comparing the simulation results and the theoretical results at the center of the measurement circle, their tangential stress evolutions were very similar, as depicted in Figure 8, which further validated the accuracy of the theoretical results. However, the theoretical results were derived based on the theory of elasto-dynamics, while the simulation model was composed of discrete particles. Due to the reflection of the stress wave, the vibration of the incident sidewall was the most prominent, which amplified the microheterogeneity of the numerical model and induced the difference between the theoretical and numerical results at the left sidewall.
The dynamic disturbances also caused energy transformation in the surrounding rock. Figure 6 illustrates the evolution of strain energy at different positions of the U-shaped cavern under dynamic disturbances. Under the in situ stress field, an amount of strain energy accumulated in the surrounding rock. When the stress waves arrived at the cavern boundary, the strain energy in both sides of the cavern decreased, while a large amount of strain energy accumulated in the roof and floor of the cavern. The larger the rising time of the stress wave, the more strain energy that was accumulated in the roof and floor. When the coupled static and dynamic stresses exceed the strength of the surrounding rock, dynamic failure occurs, accompanied by the release of a large amount of strain energy, resulting in more severe damage. Comparing the stress and strain energy evolution curves, it was observed that their evolution processes were similar. This suggests that the accumulation and release of strain energy in the surrounding rock are controlled by stress re-distribution.
The dynamic disturbance causes particle vibration in the surrounding rock. To minimize the effect of the microheterogeneity of the model, the evolution laws of the vibration velocity of the surrounding rock can be revealed according to the kinetic energy evolution in the measurement circles. The evolution of kinetic energy around the deep U-shaped cavern under dynamic disturbances is illustrated in Figure 7.
As shown in Figure 7a–c, the peak value of kinetic energy at the midpoints of the roof, floor, and left sidewall decreased with increasing rising time. This indicates that the peak particle velocity at these positions decreases with decreasing wavelength of the incident stress wave. As illustrated in Figure 7d, the peak value of kinetic energy at the midpoint of the right sidewall increased as the rising time of the stress wave increased from 0.5 ms to 2.0 ms. This suggests that stress wave diffraction at the back-wave side of the cavern is strengthening. When tr increased to 4.0 ms, the peak value of kinetic energy was roughly the same as that at tr = 2.0 ms. Comparing the kinetic energy evolutions at different positions, the peak value of kinetic energy at the midpoint of the left sidewall (the incident side) was the highest, while the peak value of kinetic energy at the midpoint of the right sidewall (the back-wave side) was the lowest. When tr = 0.5 ms, the peak value of kinetic energy at the midpoint of the left sidewall was 2.61 kJ, while those for the roof, midpoint of the floor, and midpoint of the right sidewall were 0.91 kJ, 0.85 kJ, and 0.22 kJ, respectively. This indicates that the particle vibration on the incident side is most violent, while that on the back-wave side is weakest.
When the amplitude of the incident stress wave increased to 75 MPa, an evidently damaged zone appeared around the cavern. The evolution of microcracks in the surrounding rock is shown in Figure 9, where the red segments represent tensile microcracks and the blue segments represent shear microcracks. As the stress wave propagated to the floor area (t = 3.0 ms), a few microcracks were generated around the cavern. At t = 4.0 ms, the tangential stresses at the roof and floor increased, and multiple microcracks parallel to the free surface were generated around the cavern floor. Due to the arching effect, the ultimate strength of the roof was higher than that of the floor [35], resulting in fewer microcracks generated around the roof. Compared with the failure patterns of the circular caverns [14], the floor of the U-shaped cavern was more prone to failure. Subsequently, the radial stress around the left sidewall was converted into tensile stress, and multiple tensile microcracks near the incident side were generated due to the reflected tensile stress waves. When t = 7.5 ms, stress wave diffraction caused the generation of microcracks on the non-incident side of the cavern. Afterward, the in situ stress field promoted the interconnection of microcracks around the incident sidewall and floor of the cavern, exacerbating rock damage and eventually leading to macroscopic failure around the cavern.

4.3. Lateral Pressure Coefficient Effect on Failure Behaviors of Deep U-Shaped Caverns under Coupled Static–Dynamic Loading

The in situ stress field is critical for the static stress distribution around the cavern. The dynamic responses of a U-shaped cavern with different lateral pressure coefficients (k = 0.2, 0.5, 1.0, 1.5, and 2.0) are studied in this section. The vertical in situ stress was 26.1 MPa, and the horizontal in situ stresses were 5.2, 13.1, 26.1, 39.2, and 52.2 MPa. The stress wave was horizontally incident from the left side of the cavern, and the amplitude of the incident wave was 45 MPa. The rising time and total time of the stress wave were 2 ms and 10 ms, respectively. Figure 10 and Figure 11 illustrate the failure modes and dynamic response processes of deep U-shaped caverns with different lateral pressure coefficients.
Before dynamic loading (initial static stress state), the tangential stresses on the sidewalls of the cavern decreased with an increasing lateral pressure coefficient, while the tangential stresses on the roof and floor increased with an increasing lateral pressure coefficient, as presented in Figure 11a,c. When the lateral pressure coefficient k was 0.2, tensile stress concentration appeared in the roof and floor of the cavern. Before stress wave loading, two primary tensile cracks were observed to extend along the vertical direction, as shown in Figure 10a. As the measurement circle obtains the average stress within a specific range, the initial tensile stress at the midpoint of the floor in Figure 11c was smaller than the tangential stress at the cavern boundary. When the stress wave propagated to the boundary of the cavern, the tangential stresses of the roof and floor transformed from tension stress to compressive stress. Plenty of microcracks were distributed in the floor area, while the model maintained overall stability.
With increasing lateral pressure coefficient, the static tensile stress concentration around the roof and floor disappeared, and no primary tensile crack was generated in the roof or floor of the cavern. When the lateral pressure coefficient k was 1.0, microcracks emerged around the sidewall, accompanied by a particle separating from the left sidewall. As the lateral pressure coefficient increased to 1.5 and 2.0, the compressive stress concentration occurred in the roof and floor of the cavern under the initial static stress state. Subsequently, the horizontally incident stress wave exacerbated the compressive stress concentration in the roof and floor of the cavern. It can be seen, from Figure 10d,e, that the density of microcracks at the floor area increased significantly, resulting in dynamic failure of the surrounding rock. Meanwhile, the dynamic tensile failure occurred at the incident sidewall, while the damage degree of the surrounding rock was smaller than that for the floor. When the lateral pressure coefficient was 2.0, the peak value of tangential stress in the cavern roof exceeded its ultimate strength, resulting in several particles separating from the cavern roof. According to the theoretical solution of tangential stresses along the cavern boundary, the initial static stress state induces a significant stress concentration around the bottom corners of the cavern [30]. With increasing horizontal in situ stress, the static tangential stresses around the corner also increased. Superimposing the scattering of stress waves, the peak dynamic tangential stresses around the cavern corner exceeded the strength of surrounding rock, resulting in the generation of microcracks around the bottom corners.
When the stress wave was horizontally incident, dynamic failure occurred in the incident sidewall and floor of the U-shaped cavern. The kinetic energy evolution curves of the midpoints of the incident sidewall and floor with different lateral pressure coefficients are presented in Figure 11b,d. The lateral pressure coefficient had little effect on the peak value of the kinetic energy; however, there were significant differences in residual kinetic energy (ΔEk) with different lateral pressure coefficients. When the U-shaped cavern had a small lateral pressure coefficient (k = 0.2 or 0.5), the kinetic energy of the incident sidewall and floor returned to zero as the stress wave passed through the cavern completely. When k = 1.0 or 1.5, there was a slight fluctuation period of kinetic energy in the incident sidewall before returning to zero. This indicates that the failure process around the incident sidewall was relatively gentle, and the surrounding rock recovered to a stable state after the stress wave passed through.
When the lateral pressure coefficient was 2.0, the residual kinetic energy at the midpoint of the left sidewall was 1.92 kJ. In comparison, the residual kinetic energy at the midpoint of the floor was 47.36 kJ, exceeding the peak value of kinetic energy significantly. This is because the U-shaped cavern with more significant lateral pressure coefficients accumulates more strain energy in the floor area under the initial static stress state, and the dynamic failure that occurs in the floor would induce the release of a large amount of strain energy from the surrounding rock. Thus, the damage degree of the floor is more violent than that of the incident sidewall. This also suggests that the rockburst is more prone to occur when the direction of the incident stress wave is parallel to the maximum principal stress direction, and the cavern boundary—which is perpendicular to the incident direction of the stress wave—should be a key monitoring object in underground engineering. This phenomenon is consistent with the conclusion of Li et al. [22]. Their results also pointed out that violent rockburst is more likely to occur when the incident direction of the disturbance is the same as the direction of the higher in situ stress. Laboratory experiments have also confirmed the obvious rockburst on the cavern floor under dynamic loading [36]. Due to the limitation of the test devices, the wavelength of the dynamic disturbances induced by the laboratory devices is much larger than the opening size. Thus, spalling failure did not occur around the incident side of the cavern. These results further indicate that stress waves with different wavelengths will induce different failure modes in the surrounding rock.

5. Conclusions

Based on the wave function expansion method, the conformal mapping theorem, and the Fourier transform, the dynamic responses of a U-shaped cavern under transient loading were obtained. The theoretical results were validated through simulations using PFC2D, and the energy evolution and failure characteristics around U-shaped caverns under coupled static–dynamic loading were investigated systematically. The main conclusions are as follows:
(1)
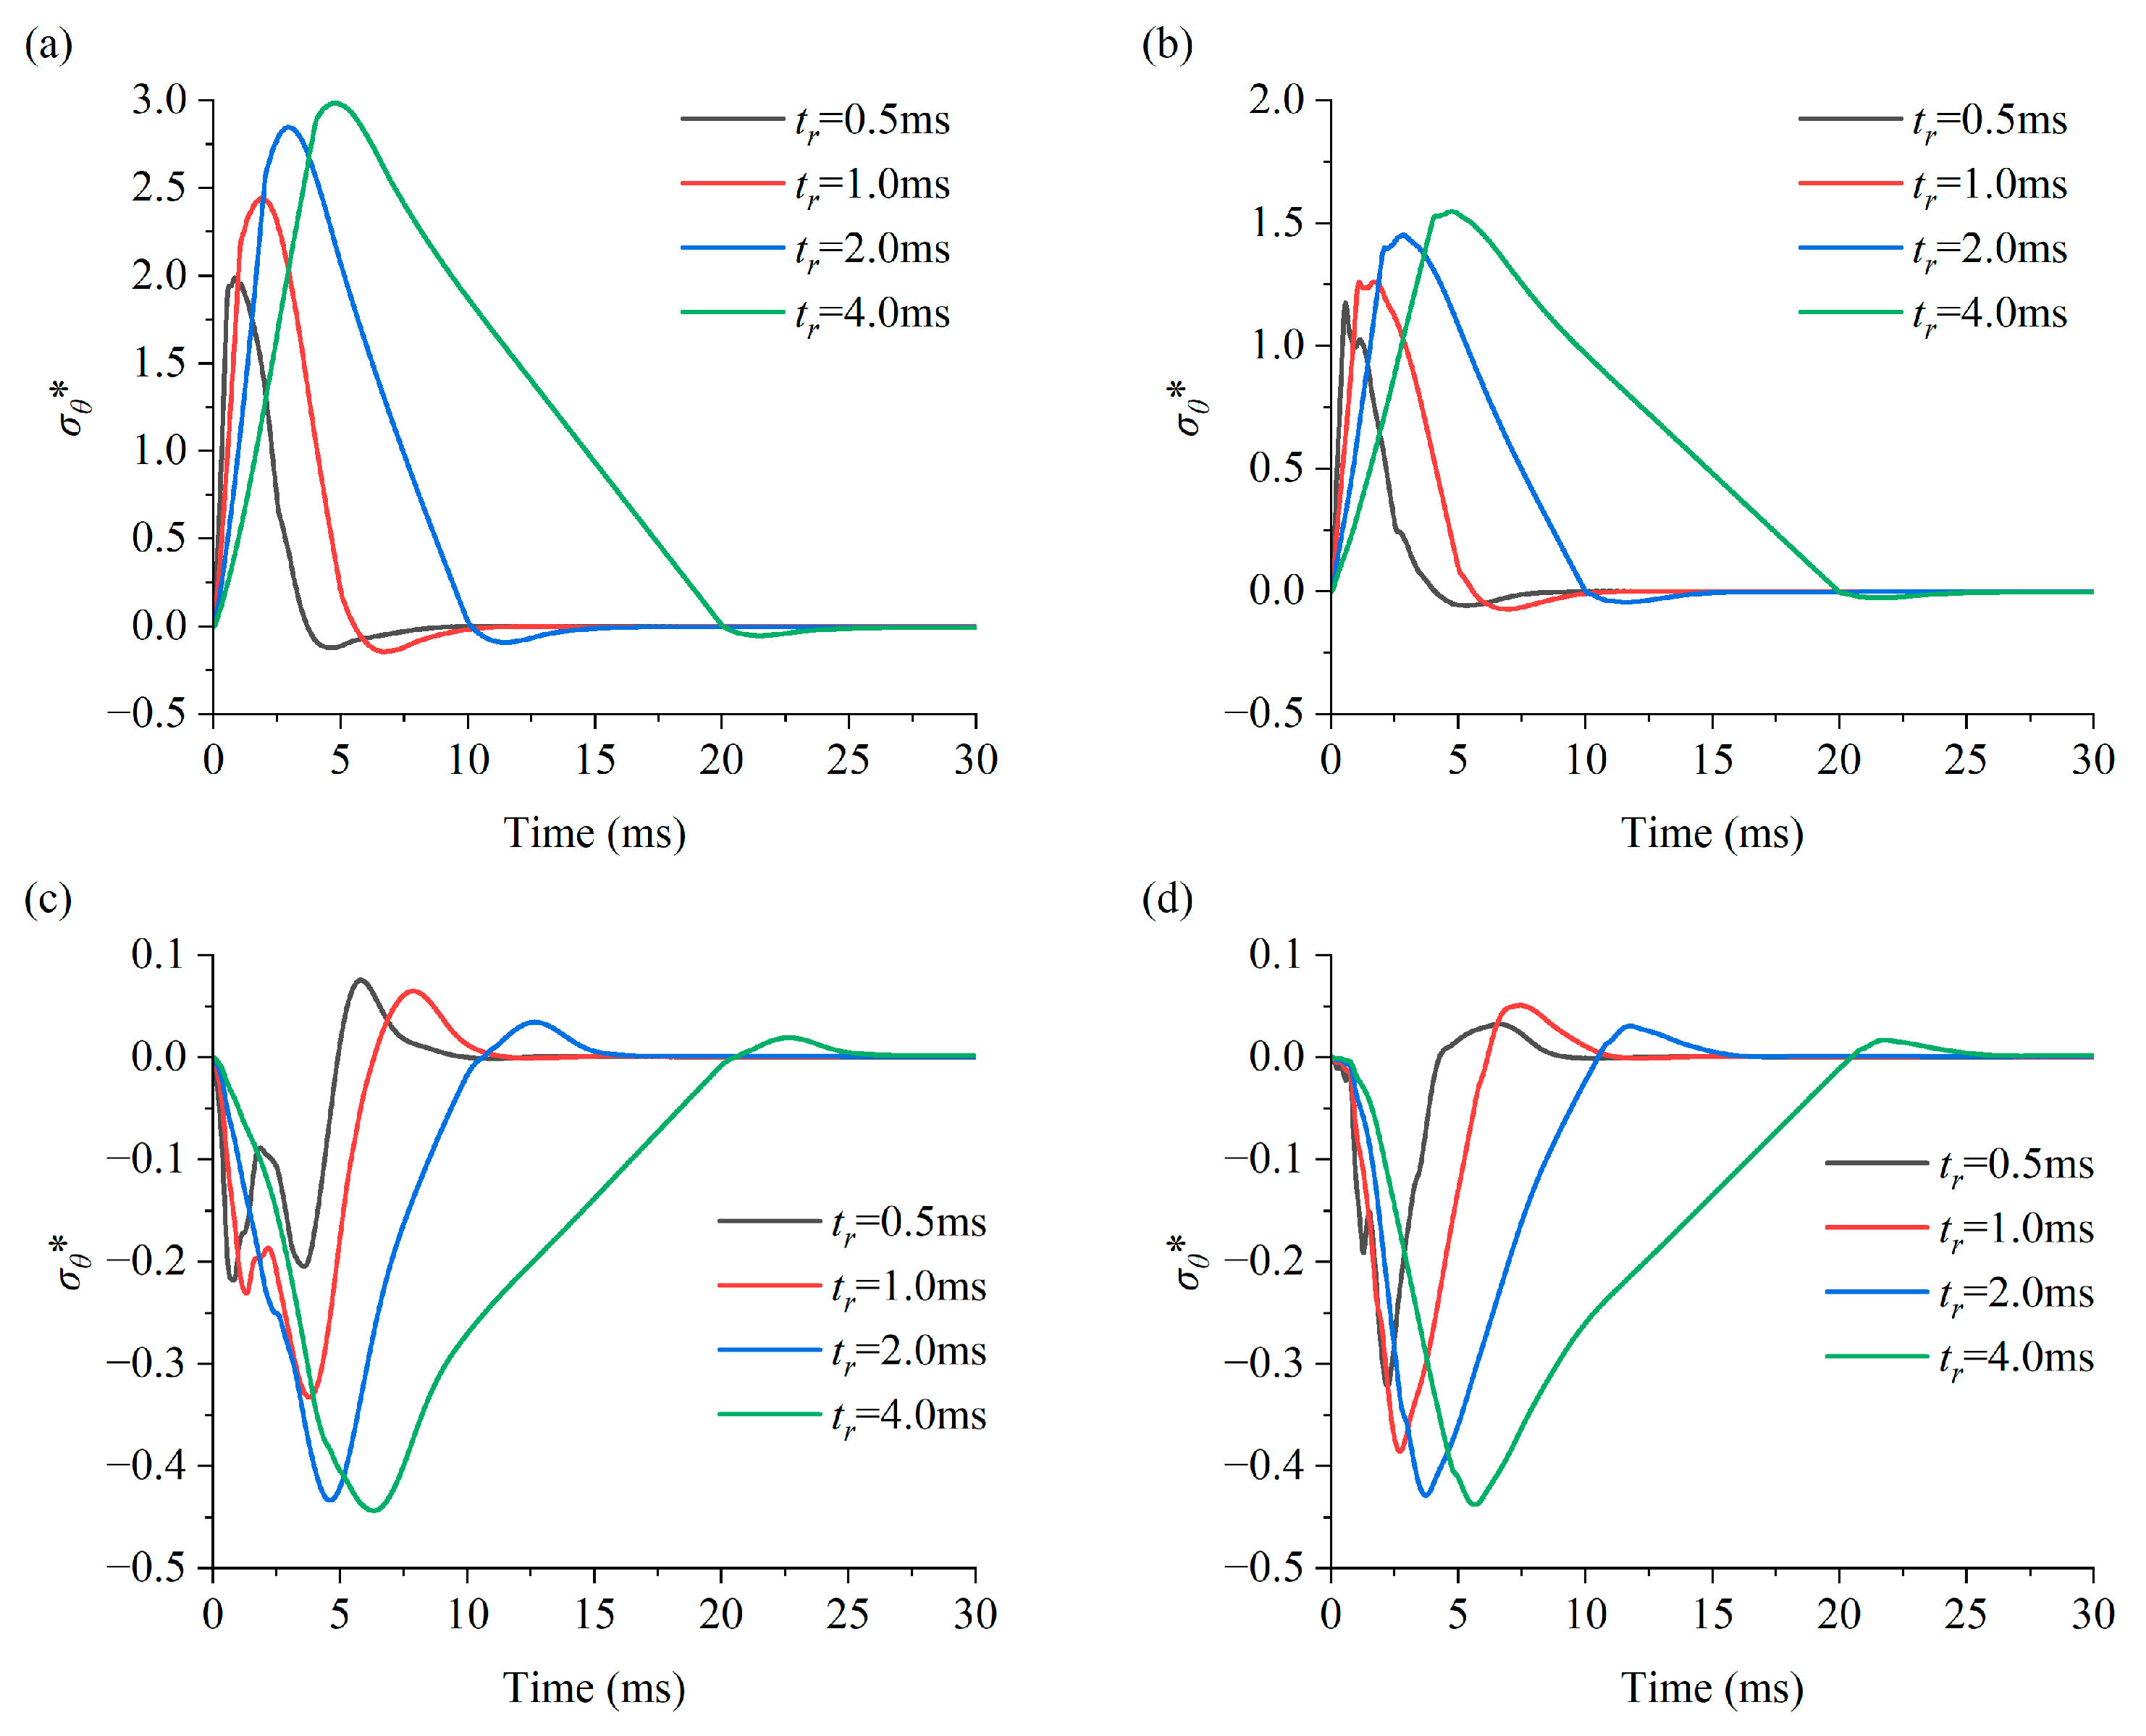
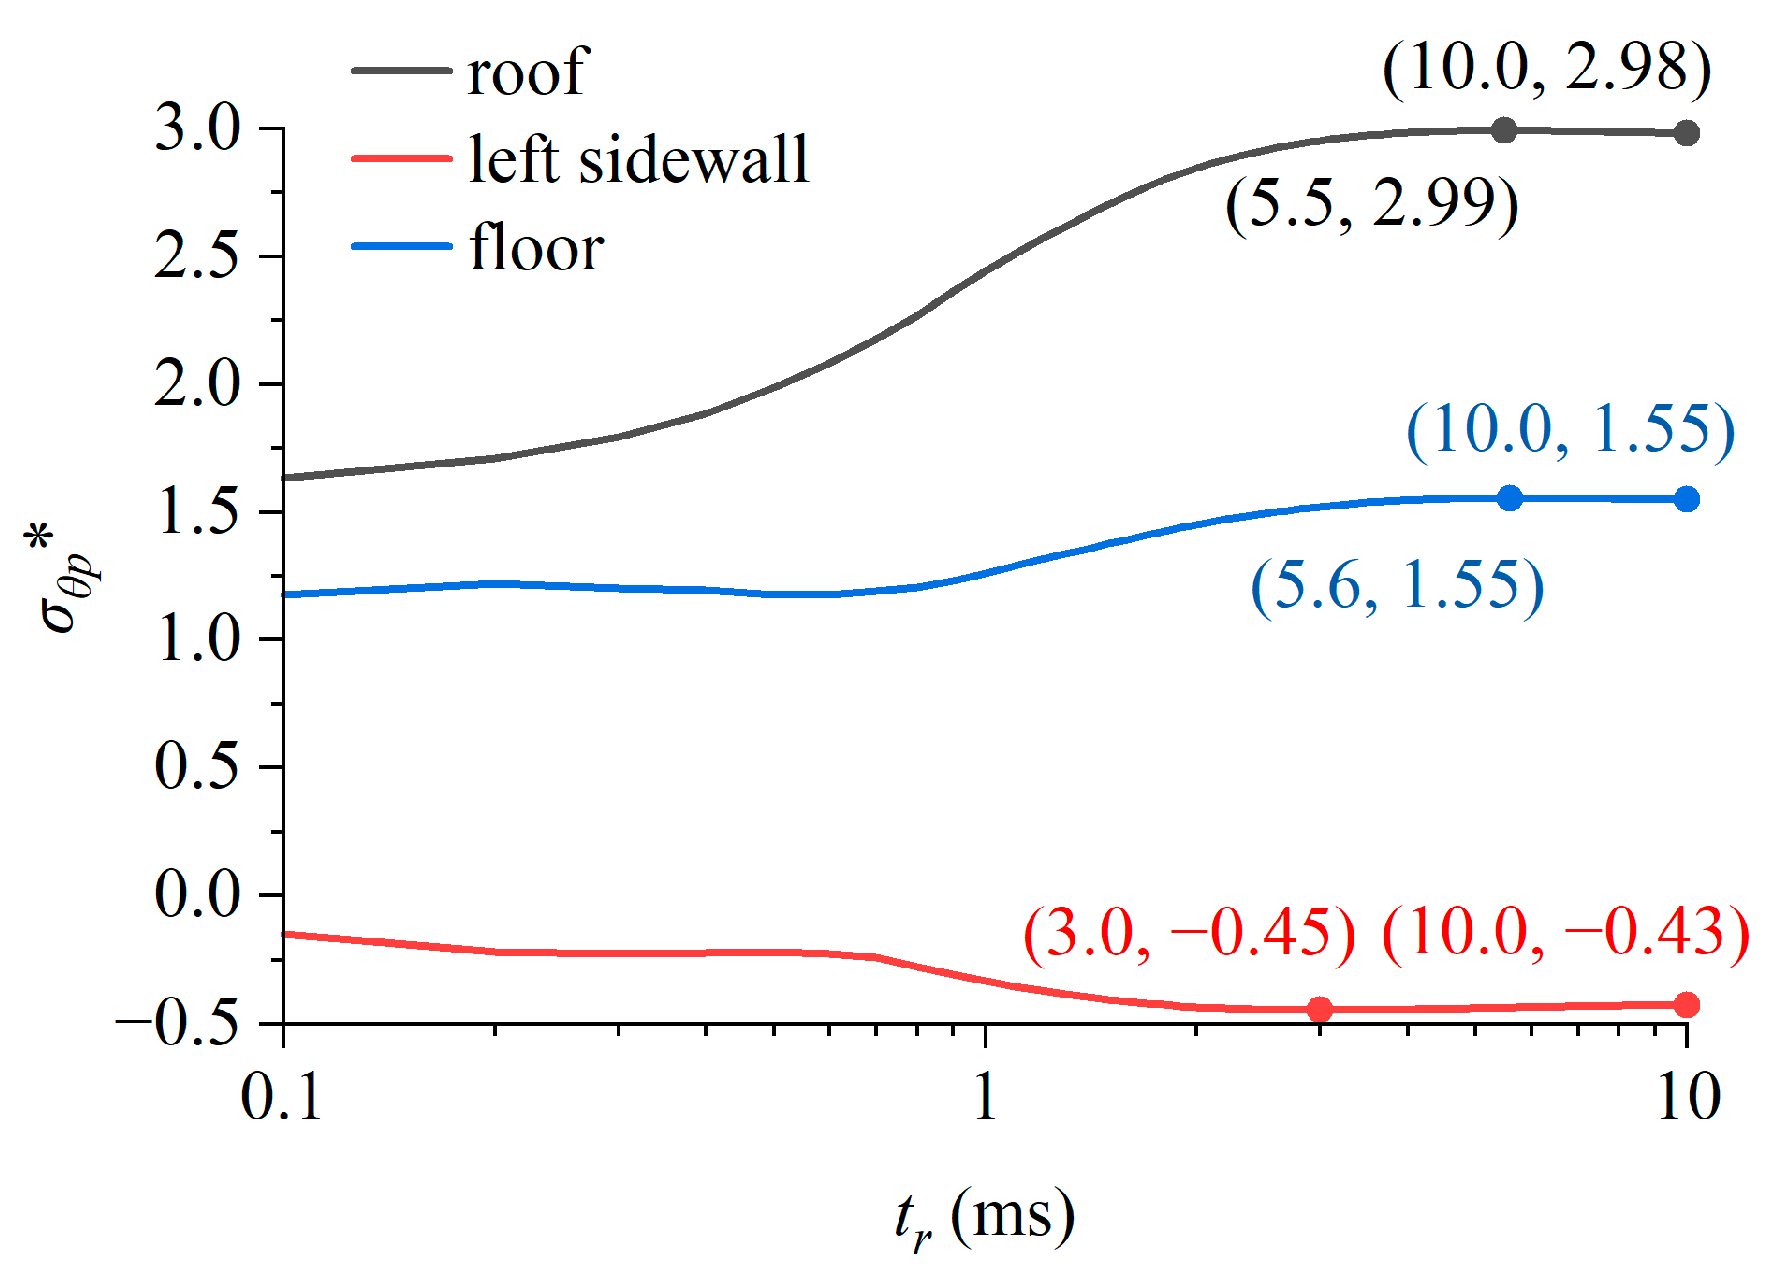
The scattering of stress waves induces the dynamic compressive stress concentration in the roof and floor and dynamic tensile stress concentrations in the sidewalls when the stress wave is horizontally incident. When the rising time of the stress wave is greater than 6.0 ms, the peak dynamic stress concentration factor converges to a stable value, and the stress condition of the surrounding rock can be considered as a quasi-static state.
(2)
When the stress wave is horizontally incident, the strain energy accumulates in the roof and floor, and dynamic compressive shear failure is more likely to occur in the cavern floor. The maximum peak kinetic energy occurs in the incident sidewall, which is prone to producing dynamic tensile failure. The incident sidewall and the floor are considered potential hazard areas, and the presence of a supporting structure is essential.
(3)
Rockburst tends to occur at the cavern boundary that is perpendicular to the incident direction, especially when the incident direction of the stress wave is parallel to the maximum principal stress. The higher the lateral pressure coefficient, the higher the amount of residual kinetic energy that is released. In practical engineering, the dynamic disturbances that come from the direction of the maximum principal stress should be minimized as much as possible.

Author Contributions

Methodology, software and writing—original draft, L.L.; validation and funding acquisition, X.L.; writing—review and editing, Z.L.; software and writing—review and editing, S.P. All authors have read and agreed to the published version of the manuscript.

Funding

This research was funded by the National Natural Science Foundation of China, grant number 51927808.

Data Availability Statement

Data will be made available on request.

Conflicts of Interest

The authors declare no conflicts of interest.

Nomenclature

z Complex variables in z-plane
ζ Complex variables in ζ-plane
ρ Polar radius in the ζ-plane
γ Polar angle in the ζ-plane
W ( ζ ) Mapping function that transforms the exterior of the cavern section in the z-plane into the exterior of a unit circle in the ζ-plane
W ( ζ ) ¯ Conjugate of the mapping function
φ 0 Amplitude of incident wave
φ ( i ) Potential function of the incident P-wave
φ ( r ) Potential function of the reflected P-wave
ψ ( r ) Potential function of the reflected SV-wave
ω Circular frequency of incident stress wave
α P-wave number
β S-wave number
t Time
t s Total time of the incident wave
t r Rising time of the incident wave
c p P-wave velocity
c s S-wave velocity
H n ( 1 ) Hankel function of the first kind
a n , b n Undetermined coefficients
σ r Radial stress components
σ θ Tangential stress components
τ r θ Shear stress components
λ , μ Lame constants
σ 0 Stress amplitude of the incident wave
σ θ * Dynamic stress concentration factor
g ( t ) Transient response
g δ ( t ) Transient response caused by the unit pulse function
p ( ω ) Fourier transform of the incident wave
χ ( ω ) Admittance function of the steady-state response
R ( ω ) Real part of the admittance function
P ( t ) Incident stress wave of blasting disturbance
P d Amplitude of the incident wave

References

  1. Yan, P.; Zhao, Z.G.; Lu, W.B.; Fan, Y.; Chen, X.R.; Shan, Z.G. Mitigation of rock burst events by blasting techniques during deep-tunnel excavation. Eng. Geol. 2015, 188, 126–136. [Google Scholar] [CrossRef]
  2. He, B.; Armaghani, D.J.; Lai, S.H.; He, X.Z.; Asteris, P.G.; Sheng, D.C. A deep dive into tunnel blasting studies between 2000 and 2023—A systematic review. Tunn. Undergr. Space Technol. 2024, 147, 105727. [Google Scholar] [CrossRef]
  3. Guo, Y.D.; Dyskin, A.; Pasternak, E. Thermal spallation of dry rocks induced by flame parallel or normal to layering: Effect of anisotropy. Energy 2024, 288, 129697. [Google Scholar] [CrossRef]
  4. Li, X.B.; Gong, F.Q.; Tao, M.; Dong, L.J.; Du, K.; Ma, C.D.; Zhou, Z.L.; Yin, T.B. Failure mechanism and coupled static-dynamic loading theory in deep hard rock mining: A review. J. Rock Mech. Geotech. Eng. 2017, 9, 767–782. [Google Scholar] [CrossRef]
  5. Ortlepp, W.D. The behaviour of tunnels at great depth under large static and dynamic pressures. Tunn. Undergr. Space Technol. 2001, 16, 41–48. [Google Scholar] [CrossRef]
  6. Pao, Y.H.; Mow, C.C. Diffraction of Elastic Waves and Dynamic Stress Concentrations; Crane Russak & Co.: New York, NY, USA, 1973. [Google Scholar]
  7. Liu, D.K.; Gai, B.Z.; Tao, G.Y. Applications of the method of complex functions to dynamic stress concentrations. Wave Motion 1982, 4, 293–304. [Google Scholar] [CrossRef]
  8. Bouaré, H.; Mesgouez, A.; Lefeuve-Mesgouez, G. Stress and displacement fields around an arbitrary shape tunnel surrounded by a multilayered elastic medium subjected to harmonic waves under plane strain conditions. Soil Dyn. Earthq. Eng. 2022, 154, 107158. [Google Scholar] [CrossRef]
  9. Liu, D.K. Dynamic stress concentration around a circular hole due to SH-wave in anisotropic media. Acta Mech. Sin. 1988, 4, 146–155. [Google Scholar]
  10. Zhang, X.P.; Jiang, Y.J.; Sugimoto, S. Anti-plane dynamic response of a non-circular tunnel with imperfect interface in anisotropic rock mass. Tunn. Undergr. Space Technol. 2019, 87, 134–144. [Google Scholar] [CrossRef]
  11. Yi, C.P.; Zhang, P.; Johansson, D.; Nyberg, U. Dynamic response of a circular lined tunnel with an imperfect interface subjected to cylindrical P-waves. Comput. Geotech. 2014, 55, 165–171. [Google Scholar] [CrossRef]
  12. Fang, X.Q.; Jin, H.X. Visco-elastic imperfect bonding effect on dynamic response of a non-circular lined tunnel subjected to P and SV waves. Soil Dyn. Earthq. Eng. 2016, 88, 1–7. [Google Scholar] [CrossRef]
  13. Fang, X.Q.; Jin, H.X.; Liu, J.X.; Huang, M.J. Imperfect bonding effect on dynamic response of a non-circular lined tunnel subjected to shear waves. Tunn. Undergr. Space Technol. 2016, 56, 226–231. [Google Scholar] [CrossRef]
  14. Li, X.B.; Li, C.J.; Cao, W.Z.; Tao, M. Dynamic stress concentration and energy evolution of deep-buried tunnels under blasting loads. Int. J. Rock Mech. Min. Sci. 2018, 104, 131–146. [Google Scholar] [CrossRef]
  15. Mei, W.Q.; Xia, Y.Y.; Han, G.S.; Pan, P.Z.; Li, M.; Wang, Z.D. Theoretical responses of shallow-buried circular cavity subjected to transient P wave. Comput. Geotech. 2021, 139, 104411. [Google Scholar] [CrossRef]
  16. Mei, W.Q.; Xia, Y.Y.; Pan, P.Z.; Li, M.; Tan, S.R.; Zhang, Y.H. Transient responses of deep-buried unlined tunnels subjected to blasting P wave. Comput. Geotech. 2022, 146, 104729. [Google Scholar] [CrossRef]
  17. Tao, M.; Zhao, H.T.; Li, Z.W.; Zhu, J.B. Analytical and numerical study of a circular cavity subjected to plane and cylindrical P-wave scattering. Tunn. Undergr. Space Technol. 2020, 95, 103143. [Google Scholar] [CrossRef]
  18. Lu, S.W.; Zhou, C.B.; Zhang, Z.; Jiang, N. Particle velocity response of surrounding rock of a circular tunnel subjected to cylindrical P-waves. Tunn. Undergr. Space Technol. 2019, 83, 393–400. [Google Scholar] [CrossRef]
  19. Wu, H.; Fan, A.Q.; Zheng, Z.; Wang, M.L.; Li, S.J.; Zhang, B.; Liu, Y.H. Dynamic mechanical properties and failure behaviors of brittle rock materials with a tunnel-shaped opening subjected to impact loads. J. Mater. Res. Technol. 2023, 25, 3285–3297. [Google Scholar] [CrossRef]
  20. Wang, X.; Cai, M. Numerical modeling of seismic wave propagation and ground motion in underground mines. Tunn. Undergr. Space Technol. 2017, 68, 211–230. [Google Scholar] [CrossRef]
  21. Zhu, W.C.; Li, Z.H.; Zhu, L.; Tang, C.A. Numerical simulation on rockburst of underground opening triggered by dynamic disturbance. Tunn. Undergr. Space Technol. 2010, 25, 587–599. [Google Scholar] [CrossRef]
  22. Li, X.; Li, X.F.; Zhang, Q.B.; Zhao, J. A numerical study of spalling and related rockburst under dynamic disturbance using a particle-based numerical manifold method (PNMM). Tunn. Undergr. Space Technol. 2018, 81, 438–449. [Google Scholar] [CrossRef]
  23. Wei, P.C.; Lin, P.; Peng, H.Y.; Yang, Z.L.; Qiao, Y. Analysis of cracking mechanism of concrete galleries in a super high arch dam. Eng. Struct. 2021, 248, 113227. [Google Scholar] [CrossRef]
  24. Liu, G.F.; Feng, X.T.; Jiang, Q.; Yao, Z.B.; Li, S.J. In situ observation of spalling process of intact rock mass at large cavern excavation. Eng. Geol. 2017, 226, 52–69. [Google Scholar] [CrossRef]
  25. Zeng, G.S.; Cai, H.; Lu, A.Z. An Analytical Solution for an Arbitrary Cavity in an Elastic Half-Plane. Rock Mech. Rock Eng. 2019, 52, 4509–4526. [Google Scholar] [CrossRef]
  26. Chen, J.; Zhou, C.; Zhou, T.; Zhu, J.; Xie, H. Experimental study on strain evolution and failure behavior of sandstone containing a single pre-existing flaw under compressive-shear loading. Chin. J. Rock Mech. Eng. 2023, 42, 1743–1758. (In Chinese) [Google Scholar]
  27. Yilmaz, O.; Unlu, T. Three dimensional numerical rock damage analysis under blasting load. Tunn. Undergr. Space Technol. 2013, 38, 266–278. [Google Scholar] [CrossRef]
  28. Manouchehrian, A.; Cai, M. Analysis of rockburst in tunnels subjected to static and dynamic loads. J. Rock Mech. Geotech. Eng. 2017, 9, 1031–1040. [Google Scholar] [CrossRef]
  29. Hu, X.D.; Zhao, G.F.; Deng, X.F.; Hao, Y.F.; Fan, L.F.; Ma, G.W.; Zhao, J. Application of the four-dimensional lattice spring model for blasting wave propagation around the underground rock cavern. Tunn. Undergr. Space Technol. 2018, 82, 135–147. [Google Scholar] [CrossRef]
  30. Liang, L.S.; Li, X.B.; Zhu, Q.Q.; Peng, S.Y.; Si, X.F. Stress distribution and failure characteristics around U-shaped caverns with different height-to-width ratios under biaxial compression. Eng. Fail. Anal. 2024, 156, 107800. [Google Scholar] [CrossRef]
  31. Wang, X.; Cai, M. Influence of wavelength-to-excavation span ratio on ground motion around deep underground excavations. Tunn. Undergr. Space Technol. 2015, 49, 438–453. [Google Scholar] [CrossRef]
  32. Li, C.; Li, X. Influence of wavelength-to-tunnel-diameter ratio on dynamic response of underground tunnels subjected to blasting loads. Int. J. Rock Mech. Min. Sci. 2018, 112, 323–338. [Google Scholar] [CrossRef]
  33. Potyondy, D.O.; Cundall, P.A. A bonded-particle model for rock. Int. J. Rock Mech. Min. Sci. 2004, 41, 1329–1364. [Google Scholar] [CrossRef]
  34. Sun, Y.; Tan, C.X. An analysis of present day regional tectonic stress field and crustal movement trend in China. J. Geomech. 1995, 1, 1–12. (In Chinese) [Google Scholar]
  35. Chen, H.L.; Xia, Z.C.; Zhou, J.N.; Fan, H.L.; Jin, F.N. Dynamic responses of underground arch structures subjected to conventional blast loads: Curvature effects. Arch. Civ. Mech. Eng. 2013, 13, 322–333. [Google Scholar] [CrossRef]
  36. Wang, Z.; Zhu, Z.; Zhou, L.; Wang, M.; Ma, L.; Nie, F.; Shi, T. Dynamic mechanical properties and failure characteristics of layered composite rock containing a tunnel-shaped hole. Theor. Appl. Fract. Mech. 2024, 129, 104217. [Google Scholar] [CrossRef]
Figure 1. The model of a U-shaped cavern under the P-wave.
Mathematics 12 01836 g001
Figure 2. Theoretical results for the dynamic stress concentration factor of the U-shaped cavern under a horizontally incident wave (ts/tr = 5): (a) roof; (b) midpoint of the floor; (c) midpoint of the left sidewall; and (d) midpoint of the right sidewall.
Mathematics 12 01836 g002
Figure 3. Variation in the peak dynamic stress concentration factor with the rising time of the incident stress wave at the U-shaped cavern boundary (ts/tr = 5).
Mathematics 12 01836 g003
Figure 4. Numerical model of a U-shaped cavern under the coupled static–dynamic loading.
Mathematics 12 01836 g004
Figure 8. Comparison of theoretical results and simulation results (Pd = 15 MPa, tr = 2.0 ms, ts/tr = 5): (a) midpoints of the roof and floor; (b) midpoints of both sidewalls.
Mathematics 12 01836 g008
Figure 9. Evolution process of microcracks around the U-shaped cavern under coupled static–dynamic loading (Pd = 75 MPa).
Mathematics 12 01836 g009
Figure 10. Failure modes of the U-shaped cavern under different lateral pressures: (a) k = 0.2; (b) k = 0.5; (c) k = 1.0; (d) k = 1.5; (e) k = 2.0.
Mathematics 12 01836 g010
Figure 11. Stress and energy evolution curves of the U-shaped cavern under different lateral pressure coefficients: (a) tangential stress of the midpoint of the left sidewall; (b) kinetic energy of the midpoint of the left sidewall; (c) tangential stress of the midpoint of the floor; and (d) kinetic energy of the midpoint of the floor.
Mathematics 12 01836 g011
Table 1. Microscopic parameters of the PFC2D model.
Microscopic ParametersValuesMicroscopic ParametersValues
Particle density, ρ (kg/m3)2711Elastic modulus, Ec (GPa)18.34
Particle minimum radius, rmin (m)2 × 10⁻⁴Stiffness ratio, kn/ks2.0
Particle radius ratio, rmax/rmin2.0Tensile Strength, σc (MPa)8.25 ± 0.83
Number of elements2Bonding strength, c (MPa)45.60 ± 4.56
Porosity0.1Friction angle, φ (°)46
Local damping coefficient0.0Friction coefficient, μ0.50
Table 2. Macro-mechanical parameters of rock specimen.
Mechanical ParametersDensity (kg/m3)Elastic Modulus
(GPa)
Poisson’s RatioUniaxial Compressive Strength
(MPa)
Brazilian Tensile Strength
(MPa)
Laboratory results244018.600.2197.604.87
Numerical results244018.740.2197.384.91
Disclaimer/Publisher’s Note: The statements, opinions and data contained in all publications are solely those of the individual author(s) and contributor(s) and not of MDPI and/or the editor(s). MDPI and/or the editor(s) disclaim responsibility for any injury to people or property resulting from any ideas, methods, instructions or products referred to in the content.

