1. Introduction
Over the past two decades, social media has assumed a critical and transformative role in the daily lives of individuals worldwide. Current data reveal that a third of the global population engages with at least one social networking site for various purposes, particularly among the youth who, on average, spend over four hours online daily [
1,
2,
3]. This surge in technology usage has necessitated adjustments to the emerging virtual landscape. Activities and practices that were previously confined to the offline world have had to evolve to meet the needs of the digital age, such as discovering innovative methods to communicate information to digital consumers, seeking out fresh opportunities for online commerce, and formulating approaches to engage more effectively with an audience that is increasingly connected to the internet [
4,
5].
On most social media platforms, the identities of individuals who create or share content are linked to the content itself. Platforms like Facebook, Instagram, Reddit, and Twitter, currently known as “X”, showcase content creators’ profiles with every post they make. Universal identification has recently been promoted as a potential method to control online content. Given the widespread presence of identity indicators on social media and the possibility of advancing further in this direction, a critical question arises: To what extent do the identity of the content creator and the reactions to the content (such as likes, votes, and comments) influence each other, rather than the content’s merit itself? [
6].
Social media has recently revolutionized how scholarly news and research are shared and made more visible. It acts as an effective platform for institutions, academics, and researchers to rapidly communicate their discoveries and collaborate with other professionals and policymakers, which in turn helps forge new partnerships and expand their networks online [
7,
8,
9,
10].
The utilization of social media within the realm of higher education has steadily become more widespread [
11]. Nevertheless, the depth of understanding regarding its use as a tool for educational development remains insufficient, signaling a clear avenue for further investigation [
12,
13]. The current approach, which relies on evidence-based methodologies informed by extant empirical studies, has been critiqued for its inadequacies [
14,
15]. Thus, it is essential to increase the emphasis on empirical research rooted in various theoretical frameworks to significantly enrich this burgeoning field within the academic landscape [
16,
17].
The challenge of integrating social media into university settings is to boost public involvement with university events, its core institutional values, and academic fields. Investigating the application of foundational communication theories and the advancement of social metric integration could alleviate some of the identified challenges associated with the integration effort; research by Manca et al. [
18] showed that students primarily used platforms such as Instagram, Pinterest, Snapchat, and WhatsApp for content creation and engaging in discussions with peers for educational and assessment purposes. The role of social media in education has attracted increasing attention from scholars [
11,
19], with various studies demonstrating its use by educators for personal, professional, and pedagogical goals [
20]. Notably, research has underscored the value of Facebook groups in improving educational experiences, offering benefits not found in traditional online Learning Management Systems [
21]. Furthermore, Tang and Hew [
22] identified Twitter as a platform that enhances learning by disseminating and creating digital content and collaboration among learners. Recent studies also investigated how platforms like Pinterest, Instagram, and Snapchat can be effectively utilized for educational purposes. Globally et al. [
18] note that these platforms are still not prominently featured in scholarly discussions despite their increasing use among younger demographics.
Twitter serves as a social media platform that allows users to post brief messages, known as tweets, to a broad audience, facilitating the exchange of ideas. Since its inception, Twitter has become a significant online space for individuals to share concise information, with a limit of 280 characters per message. The platform has witnessed a remarkable increase in user base, underscoring its potential as an effective communication tool. Twitter’s ability to facilitate idea-sharing allows it to integrate social networking across various domains. Its use in academic settings is increasing, though further efforts are necessary to maximize its potential. While Twitter has seen application in data analysis, primarily to engage students in real-time discussions, its effectiveness in enhancing learning outcomes remains an area ripe for further investigation [
23,
24,
25,
26].
Twitter, a complimentary text-centered online social network, boasts over 330 million active monthly participants. Nearly 46% of Twitter’s U.S. audience engages with the platform daily. It is the foremost social media channel for news and contemporary issues, with 55% of Americans using it as a regular news source. The platform’s distinctive feature of allowing brief, to-the-point conversations through a 280-character limit (
https://twitter.com/premium/status/1623411400545632256?lang=en), (accessed on 1 January 2020) along with the option to “retweet” or share other users’ content, uniquely positions Twitter as a primary locale for discourse on current events and popular themes [
27,
28,
29,
30].
As more individuals engage with social media platforms, examining the vast amounts of information shared online can provide valuable perspectives on changing attitudes, behaviors, and mental processes, according to Alamoodi et al. [
31], which has led to the increasing use of Twitter data for analyzing sentiments, marking a trend in this area. Furthermore, the rising focus on social media analytics has enhanced the prominence of technologies reanalyzing textual data in Natural Language Processing (NLP) and artificial intelligence (AI).
This research aims to leverage actual data from KFU’s official Twitter account as a case study, extracting valuable insights into public interaction with the university’s Twitter activity. It explores the role of Twitter in spreading awareness of KFU’s institutional identity across nine distinct domains, examining how this presence has evolved. By employing thorough analytical methods and ML algorithms, the study assesses the effectiveness of KFU’s Twitter platform in enhancing the recognition of its institutional identity.
The proposed models were deployed to organize and predict the institutional identity domains within the gathered data by applying the K-means clustering algorithm and a customized tweet categorization methodology and employing sentiment analysis methodologies (TFIDF and Word2vec) to assess the similarity between the domains of institutional identity. Four ML algorithms were used to create our models: Artificial Neural Networks (ANNs), Support Vector Machine (SVM), Random Forest (RF), and Logistic Regression (LR). The performance of these models, alongside their counterparts, was evaluated across the collected dataset based on precision, recall, classification accuracy, and F-score metrics.
1.1. Motivations
Institutional identity (ID) is pivotal in establishing a university’s global reputation. It attracts top-tier faculty and students by offering a coherent value proposition that aligns with their academic and professional goals. Furthermore, a strong and well-articulated ID enhances international collaborations and partnerships, essential for fostering innovation and maintaining a competitive advantage in the global educational landscape [
32,
33,
34].
Based on the Kingdom’s Vision 2030, Saudi Arabia prioritizes development strategies and their objectives to influence vital sectors significantly. To become a global leader in research and development, Saudi Arabia emphasizes the role of ID in shaping organizational strategies and enhancing international branding efforts. As a case study, King Faisal University (KFU) is among the first academic institutions in the Middle East to adopt ID and is committed to establishing an enriching and encouraging academic environment. It strives to become an institution that significantly contributes to research and development to the fullest extent. Consequently, KFU and its educational and research departments aim to boost its developmental trajectory by formulating a vision and investment strategies reflecting its identity. This endeavor led to the initiation of KFU’s corporate ID in 2020.
Water: Focuses on ensuring access to clean and potable water for all and managing water resources sustainably to prevent pollution and over-extraction.
Agriculture: Concerned with developing sustainable agricultural practices that minimize environmental impact, improve resource efficiency, and ensure food security without harming ecosystems.
Environment: Includes protecting biodiversity and preserving natural ecosystems through managing protected areas, combating pollution, and promoting the sustainable use of natural resources.
Management: Focuses on developing effective strategies and policies for the sustainable management of natural and human resources and encouraging good governance practices.
Technology: Involves developing and applying new technologies that support sustainability, such as renewable energy technologies, smart agriculture, and water treatment technologies.
Health: Covers the promotion of public health and disease prevention by ensuring access to healthy food and clean water and reducing exposure to environmental pollutants.
Transport: Aims to develop sustainable transportation systems that reduce reliance on fossil fuels, decrease emissions, and encourage public transport and active travel.
Manufacturing: Focuses on developing industries in ways that reduce environmental impacts, such as minimizing resource use, recycling, and using sustainable materials in production.
Energy: Concerned with transitioning to renewable energy sources and clean energy technologies to reduce dependence on fossil fuels and decrease harmful environmental emissions.
The current research proposes a framework to aid institutions in evaluating and refining their social media communication strategies. The framework aims to ascertain the efficacy of current methods and identify necessary enhancements to achieve institutional objectives and effectively engage with target audiences.
1.2. Contributions
This paper introduces an innovative approach for evaluating the impact of KFU’s Twitter activities on increasing awareness about the institution’s identity through systematic analysis and advanced ML techniques. The methodologies proposed uniquely contribute in several areas:
Unique Dataset Compilation: The research centered around assembling and utilizing a unique dataset designed for the real-time detection and extraction of significant insights into public engagement with KFU’s Twitter platform.
Dissemination and Temporal Analysis: The study explores the role of Twitter in promoting KFU’s institutional identity across nine specific domains, with an analysis on their temporal evolution.
Data Clustering: The K-means clustering algorithm is applied to categorize data effectively.
Advanced Sentiment Analysis: Use sentiment analysis tools, specifically TFIDF and Word2vec, to measure the similarities among the various domains of institutional identity.
Dictionary-Based Categorization: Implementing the Matching Words Dictionary Method to process and categorize tweets according to KFU’s 9-ID framework.
ML Frameworks: Model construction using four primary ML classifiers: Logistic Regression, Support Vector Machine, Artificial Neural Network, and Random Forest.
Comprehensive Model Assessment: Evaluation of the proposed models and their peers using metrics such as precision, recall, classification accuracy, and F-score.
Dynamic Dashboard Implementation: Introduction of a dynamic dashboard that showcases data collected from KFU-Twitter, with visualizations of responses to reviews designed to update as the underlying dataset is refreshed automatically.
Recommendations for Strategic Advancements: Development of strategic recommendations to assist in future planning and decision making, aiming to enhance KFU’s institutional identity further.
1.3. Structure
The structure of this document is methodically delineated as follows:
Section 2 is dedicated to a comprehensive review of the pertinent literature.
Section 3 delves into the intricacies of the proposed model, offering a detailed exposition of its components.
Section 4 systematically and concisely outlines the experimental results obtained. Conclusively,
Section 5 provides practical suggestions for using social media, especially Twitter, to enhance engagement and reinforce institutional identity.
Section 6 articulates the concluding remarks and delineates potential avenues for future research.
2. Literature Review
Recently, social media has become an incredibly potent platform for communication, simplifying the process of expressing ideas and emotions. However, it has also created a complicated landscape characterized by a broad spectrum of reactions and feelings. This underscores the importance of comprehending how individuals respond to events happening in the real world. Sentiment analysis is an expanding discipline that leverages data from social media to gauge public sentiment towards a wide array of occurrences, including strategies adopted by universities, political initiatives, marketing efforts, natural calamities, and health incidents [
17,
35].
A range of studies have highlighted the effectiveness and engagement of social media in higher education settings [
18,
36]. These investigations explored the effects of diverse social media platforms like Facebook, Twitter, YouTube, Instagram, Pinterest, Snapchat, and WhatsApp on education. Evidence has shown that integrating social media into higher education enhances the learning experience and activities [
9,
37,
38].
Manca and Ranieri [
39] surveyed 6139 Italian academics, finding limited social media use in teaching due to cultural resistance, pedagogical challenges, and institutional barriers. They examined platforms like Twitter, Facebook, and YouTube, noting usage varied by discipline. Overall, the obstacles outweighed the benefits of social media integration. Bonifazi et al. [
40] examined social platform comments, focusing on semantic representation and management. They introduced a network-based, multidimensional approach for extracting and evaluating text patterns, considering frequency and utility. Tested on Reddit, the method can handle content semantics from various perspectives and assess semantic similarity between comments.
Hastuti et al. [
41] analyzed social media discussions on political choices and the 2024 Presidential Candidates using data from Drone Emprit Academic and Gephi tools. They found @abu_waras highly influential but unpopular, while @ChsnulCh_ was popular but less influential. The study emphasized evaluating both influence and popularity in social media networks.
Pratama et al. [
26] analyzed Ganjar Pranowo’s Twitter strategy for the 2024 Presidential election, focusing on health (47.11%), education (34.71%), and economy (18.18%). Using qualitative analysis, it found his emphasis was on health and education issues, suggesting political candidates prioritize these areas while improving economic policy communication to attract voters.
In the educational field, numerous studies have documented the positive impacts of social media on engagement and learning. For instance, platforms like Facebook and Twitter have been shown to enhance communication and pedagogical practices, supporting collaborative learning and real-time feedback [
9,
21,
42]. These findings align with theoretical frameworks such as the Uses and Gratification Theory and Social Constructivism, which suggest that social media satisfies specific user needs in educational contexts, facilitating information seeking and social interactions [
43,
44,
45].
The significance of social media in educational contexts is well documented. Barrot [
11] explored the scientific discourse on social media use in education, identifying Facebook, Twitter, and YouTube as extensively scrutinized platforms. The study highlighted the surge in interest due to social media’s advanced features, enhancing its utility for educational purposes. Similarly, Eutsler et al. [
46] examined the use of a specific institutional hashtag within the College of Education, revealing that while the hashtag promoted a sense of institutional community, there was potential for more strategic use to enhance engagement and interaction among different user groups. Murthy et al. [
47] conducted a comprehensive examination of opinion analysis on Twitter, employing lexicon-based approaches and ML strategies. Their study delved into different algorithms for analyzing Twitter data streams, including Naive Bayes, Maximum Entropy, and SVM. This analysis highlighted the effectiveness of various ML techniques in parsing complex social media data to gauge public sentiment and reactions.
However, integrating social media into education is not without its challenges. Studies by Ohara et al. [
48] and Chowdhury et al. [
49] highlight issues such as the spread of misinformation and the potential for excessive use, leading to dependency, which can inhibit students’ innovation and critical thinking skills. These challenges necessitate a balanced approach to utilizing social media, ensuring that adverse impacts do not overshadow its benefits in enhancing communication and collaboration.
Furthermore, social media application for broader societal communication has been examined in contexts such as health risk management and public sentiment during crises. Slavik et al. [
50] demonstrated how social media platforms were crucial in disseminating timely and accurate information about health risks, such as wildfire smoke, to the public. Similarly, Qi et al. [
42] analyzed public sentiment during the COVID-19 lockdowns, revealing valuable insights into public attitudes that could inform government policies.
The strategic use of social media in public relations activities within higher education institutions was explored by Colak et al. [
51], who found active engagement with target audiences significantly enhanced public relations and audience engagement efforts. The study supported the notion that social media is essential for managing institutional identity and community relations, as evidenced by its widespread use across various universities.
The examination of social media’s impact on subjective well-being by Ye et al. [
52] further added to the complexity of social media’s role in society and illustrated how online interactions can influence individual emotional states and overall well-being.
Table 1 shows the comparative analysis of prior research. Overall, the literature indicated that while social media offers numerous benefits in enhancing educational outcomes and societal communication, the effective use of these platforms depends on carefully crafted strategies considering both their potential and limitations. This nuanced understanding of social media’s impact is crucial for educational institutions [
38,
42,
48,
53,
54].
Accordingly, as a case study, this research was conducted to explore the scholarly landscape regarding using social media to disseminate and enhance the corporate institutional identity of King Faisal University in Saudi Arabia. It explicitly addresses its progression and identifies prevalent or significant terms associated with social media. Consequently, this systematic review not only emphasizes the positive impacts of social media but also highlights the need for a critical and balanced usage of social media within educational settings and wider societal interactions that help institutions understand and visualize their communication strategy on social media platforms.
3. The Proposed Model
This section explores the analytical framework for predicting the manifestation of KFU’s institutional identity across nine domains on the Twitter account.
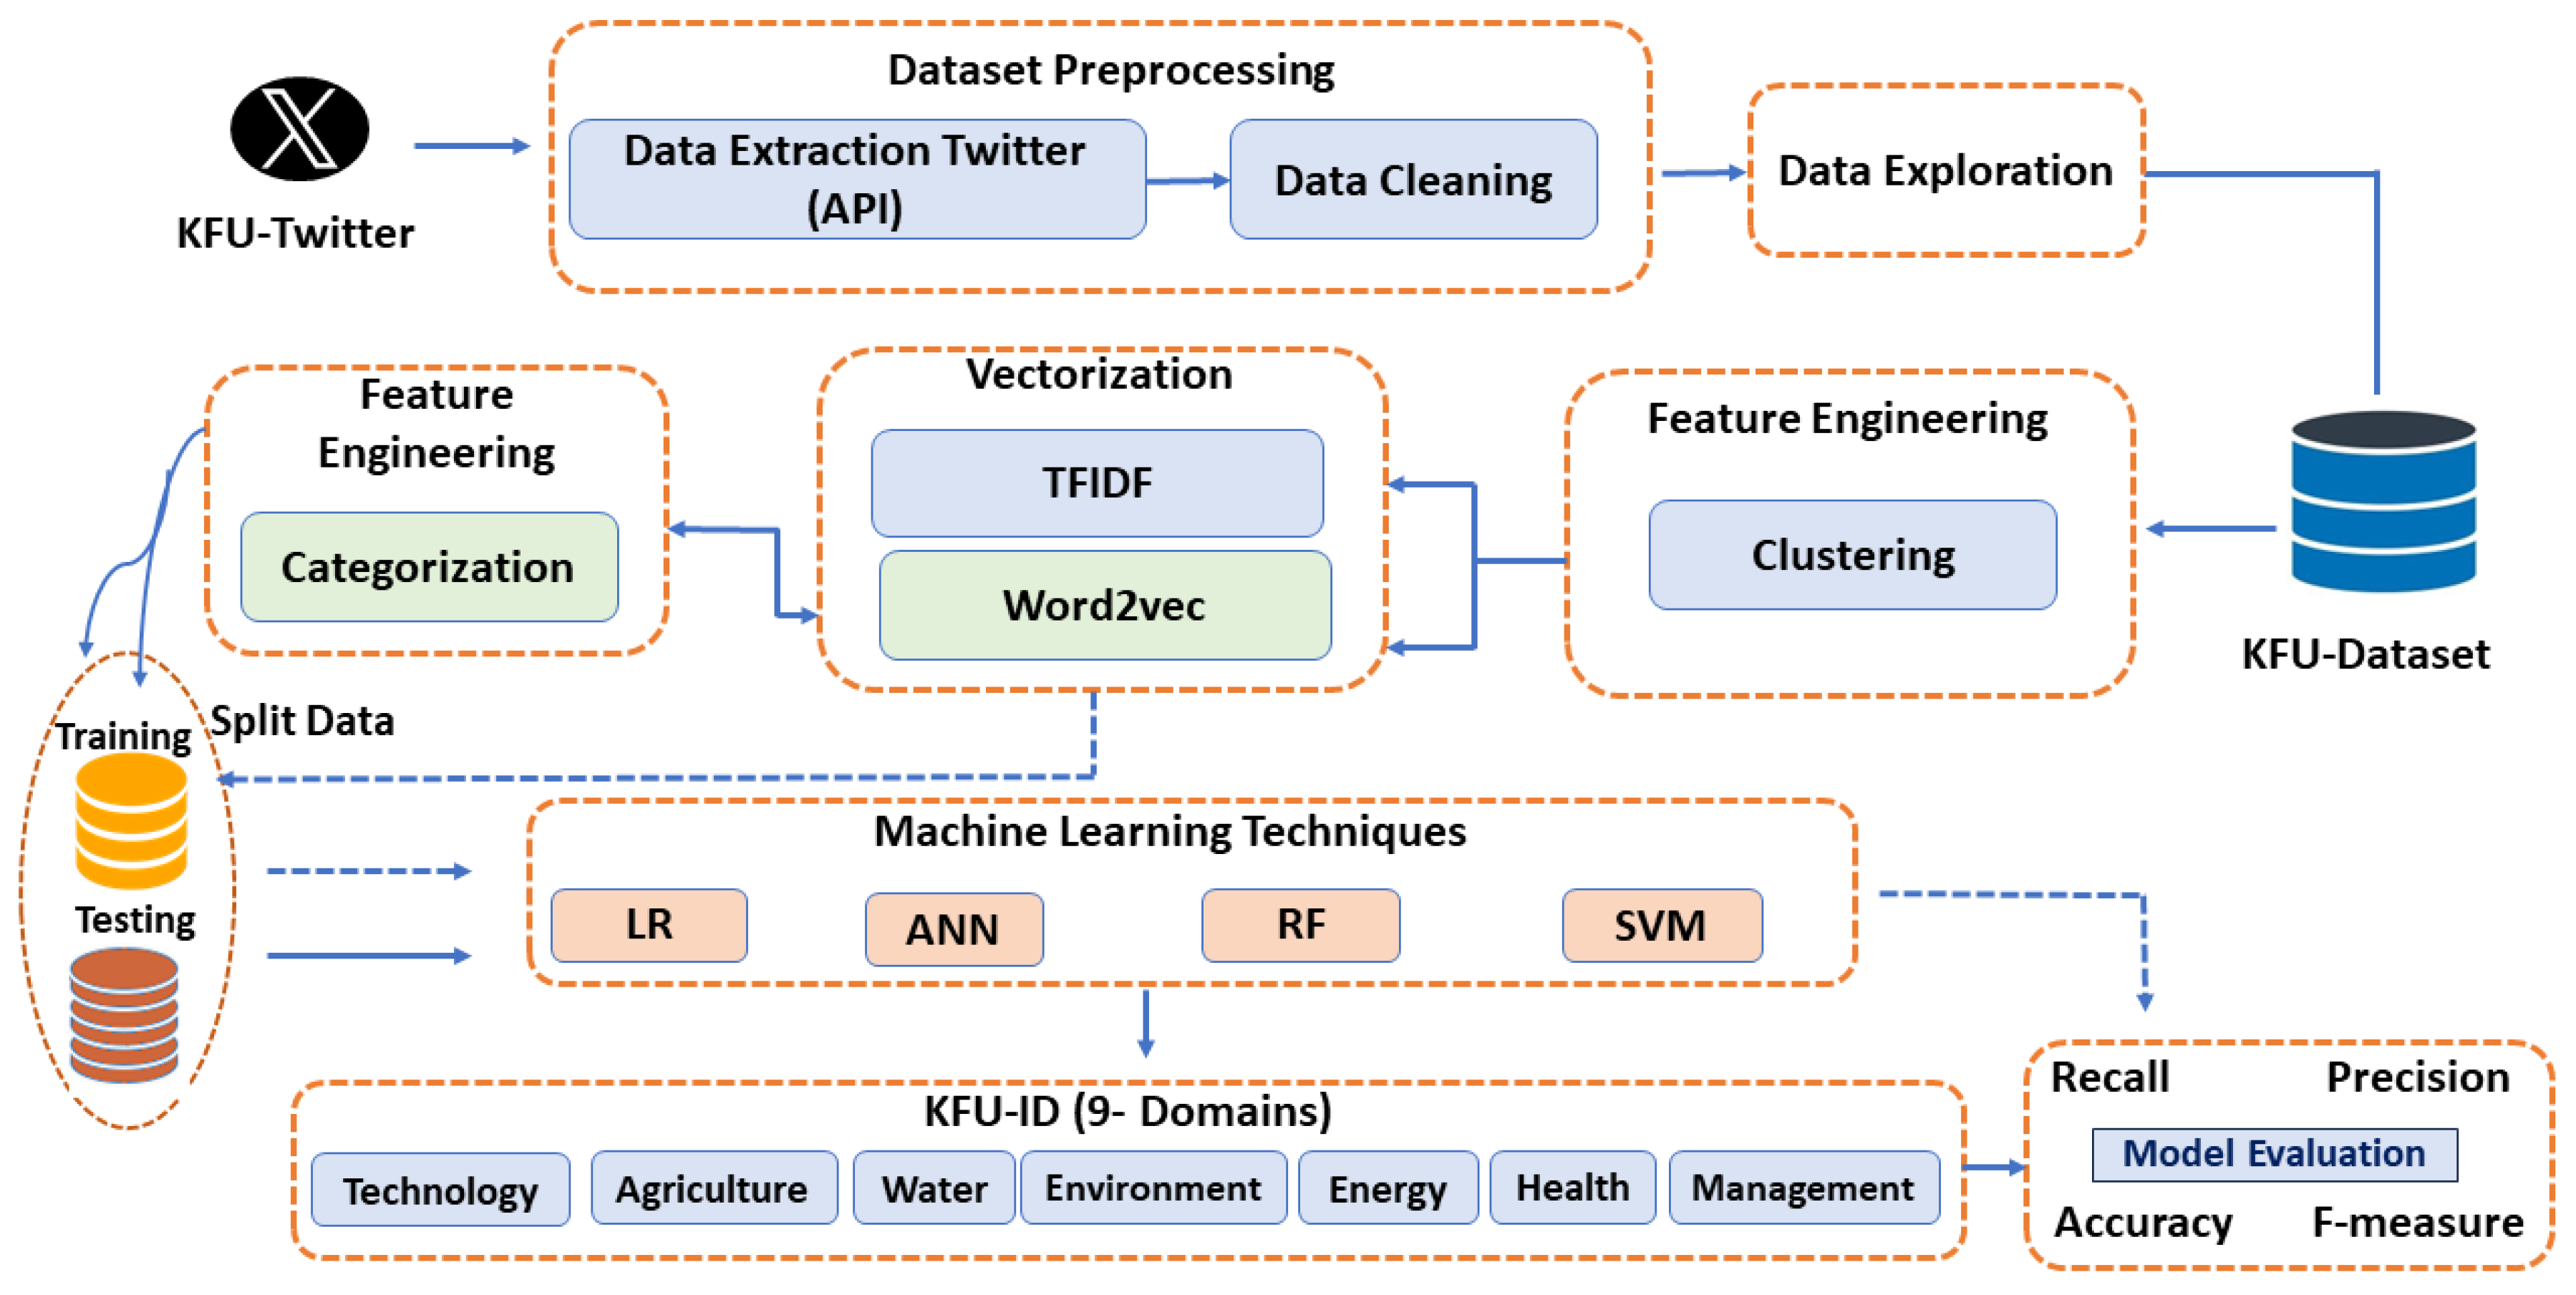
Figure 1 represents a typical workflow of the proposed model that explores the real dataset analysis and predicts the ID domains of KFU’s Twitter presence. Here is what each step represents:
Data Collection: The process begins by gathering data from KFU’s official Twitter account as a case study (
https://twitter.com/KFUniversity, accessed on 6 June 2024).
Data Preprocessing: This is a fundamental step in NLP, transforming unstructured text into a structured format that contains relevant information. This stage encompasses Data Extraction via the Twitter API and Data Cleaning.
- –
Data Extraction Twitter (API): Tweets were collected using the Twitter API and the Selenium Twitter scraping tool.
- –
Data Cleaning: The data were cleaned by applying several steps. This might involve removing irrelevant items, correcting errors, and dealing with missing or duplicated data.
Data Exploration: Exploratory data analysis is performed. This step involved understanding the characteristics of the data, finding patterns, and possibly visualizing relationships. The details are described in the following section.
Feature Engineering: Entails the development of meaningful and applicable features from raw data to improve the efficacy of ML models. In this study, models for clustering and categorization were employed.
- –
Clustering: A step that involves grouping similar data points using a K-means clustering algorithm.
- –
Categorization: A method that processes tweets and categorizes them. The method converts a dataset of tweets into a series of word vectors, which facilitates the assessment of word meanings and similarities of the 9-ID domains
Vectorization: This step converts text data into a numerical format, which is necessary for most ML algorithms. Two common techniques are:
- –
Word2vec: A method that represents each unique word with a particular list of numbers (a vector). It captures the contextual meanings of words by considering how words appear with others in the dataset.
- –
TFIDF (Term Frequency-Inverse Document Frequency): A statistical measure used to evaluate the importance of a word to a document in a collection of documents (corpus). It increases proportionally to the number of times a word appears in the document but is offset by the frequency of the word in the corpus.
Splitting Data: The dataset is split into training and testing sets.
- –
Training Data: The training data teach ML models to make predictions.
- –
Testing Data: The testing set is used to evaluate the performance of the models trained in step 7. Model: After testing, the best model is selected based on performance metrics.
Machine Learning Techniques: Four algorithms were trained on the training data:
LR (Logistic Regression), SVM (Support Vector Machine), ANN (Artificial Neural Network), and RF (Random Forest).
Final Performance Evaluation: The selected model’s performance is evaluated by applying precision, recall, classification accuracy, and F1-score to ensure it will generalize well to new, unseen data.
The details of the proposed models are further explained as follows:
3.1. Data Collection
In this research, the data were collected from KFU’s Official Twitter Account. The KFU Twitter dataset is a collection of approximately 6328 raw data entries from 2019 to January 2024.
Database Description
The collected data were scraped from the official Twitter account of King Faisal University, capturing a wide range of tweets and interactions over the specified period. The current study emphasized King Faisal University’s institutional identity (KFU-ID), which commenced development in 2019 and was officially launched in 2020. The dataset comprised sixteen columns, providing critical insights into the university’s social media presence and engagement:
Created_at: This column contains the timestamp indicating the date and time each tweet was created. The timestamp format typically includes the day, month, year, and time (in UTC or local time zone).
Full_text: The content of each tweet is stored in this column, providing the textual context of the university’s communications, announcements, events, and other relevant information shared on Twitter.
Hashtags: This column contains hashtags within each tweet. Hashtags are words or phrases preceded by the “#” symbol and serve as identifiers for specific topics, events, or themes associated with the tweet content.
Is_pinned: This binary column indicates whether the KFU Twitter account has pinned the tweet. A value of “1” typically indicates that the tweet is pinned, while “0” indicates it is not.
Is_quote_tweet: This binary column indicates whether the tweet is a quote tweet. A quote tweet is a tweet that quotes another tweet, providing additional context or commentary. A value of “1” typically indicates it is a quote tweet, while “0” indicates it is not.
Is_retweet: This binary column indicates whether the tweet is a retweet. A retweet is a re-sharing of another user’s tweet. A value of “1” typically means it is a retweet, while “0” indicates it is not.
Url: This column contains the URL associated with the tweet, if applicable. URLs may direct users to external websites, articles, or other online content related to the tweet.
Media_url: If the tweet includes media such as images or videos, the URL(s) of the media content are stored in this column.
Media_type: This column specifies the type of media included in the tweet, such as “photo”, “video”, or “gif”. It provides information about the media content format associated with the tweet.
Quote_count: This column records the number of times the tweet has been quoted by other users. Quoting a tweet involves replying to it with additional commentary or context.
Reply_count: This column records the number of replies received for each tweet, offering insights into the engagement and interaction generated by individual tweets, reflecting the audience’s response and interaction with the university’s social media content.
Retweet_count: This column records the number of times the tweet has been retweeted by other users. Retweeting involves sharing a tweet with followers, amplifying its reach and visibility.
Friends_count: This column indicates the number of accounts the user is following (i.e., their “friends” or accounts they have chosen to follow on Twitter).
Favourites_count: This column indicates the number of tweets the user has liked (i.e., “favorites”) on Twitter.
User/verified: This binary column indicates whether Twitter verifies the user account associated with the tweet. Verified accounts typically belong to public figures, brands, or organizations that Twitter has authenticated as authentic and notable.
View_count: This column records the number of views received for the tweet. Views represent the number of times users have seen the tweet on Twitter.
3.2. Data Preprocessing
Data preprocessing plays a crucial role in NLP, transforming unstructured text into a format with meaningful information. Our research used various tools and methods to preprocess the data. Given the multilingual nature of our dataset, ensuring uniformity in language was essential. Therefore, we utilized the Google Translate API to convert all non-English tweets to English. The preprocessing steps included removing retweets, punctuation, hashtags, and stop words, executing tokenization, eliminating repeated words, and performing both stemming and lemmatization. Afterward, we will provide a detailed discussion of these preprocessing activities.
3.2.1. Target Variable
The target variable is the sentiment of tweets related to KFU.
- –
Categorized into positive, negative, and neutral.
- –
Crucial for understanding public perception and engagement with KFU’s Twitter content.
Sentiment analysis methodology using NLP techniques:
- –
Each tweet is labeled based on sentiment, serving as the target variable for classification models.
Significance of the target variable:
- –
Provides insights into the public’s emotional response.
- –
Helps gauge the effectiveness of KFU’s communication strategies.
- –
Identifies areas for improvement in engagement efforts and institutional identity.
In the classification process:
- –
Used to train machine learning models.
- –
Models associate tweet features with sentiment labels.
Comprehensive approach during evaluation ensures:
- –
Performance assessed based on predicting the sentiment of unseen tweets.
- –
Identification of sentiment expressed in tweets.
- –
Provision of actionable insights for enhancing KFU’s social media engagement.
3.2.2. Data Extraction Twitter (API)
The Twitter API and the Twitter scraper tool Selenium were applied to gather tweets (
https://selenium-python.readthedocs.io/, accessed on 6 June 2024). Selenium, a widely utilized Python library, facilitated the automated extraction of information from web pages. To collect tweets related to KFU’s Official Twitter Account, a Python script was searched based on specific keywords. The data meeting our selection criteria were saved in a CSV format.
Combining programmatic access and web automation maximizes data collection coverage. Here are the steps:
Twitter API:
- –
Setup and Authentication: We used the Tweepy library to interact with the Twitter API, setting up authentication with our API keys.
- –
Fetching Tweets: We fetched tweets within a defined timeframe using specific keywords.
- –
Storing Tweets: The retrieved tweets were stored in a CSV file for further analysis.
Selenium Web Scraping:
- –
Setup: Selenium, a Python library for web automation, was used to simulate a browser and access Twitter.
- –
Extracting Tweets: Selenium searched for tweets based on our keywords and extracted the tweet text.
- –
Storing Tweets: These tweets were saved in a CSV file.
Combining Data:
- –
The Twitter API and Selenium data were combined into a single CSV file, ensuring a comprehensive dataset for analysis.
3.2.3. Data Cleaning
Data cleaning is an essential step in the preparation process. It is impossible to train an effective model without initially filtering out noisy data and extraneous content that detract from accurately classifying tweets. Achieving a satisfactory outcome involves numerous steps in this process, as follows:
Elimination of Retweets and User Mentions
Retweeting entails redistributing another user’s tweet on Twitter, which can lead to redundant data and impact the effectiveness and accuracy of the model. Therefore, it was imperative to exclude retweets, identified by “RT”, and user mentions, signified by “@User”, from the dataset.
Transformation of Emojis to Text and Text Normalization
Emojis, small digital symbols used to express emotions or opinions, were converted to their equivalent text descriptions to enhance model training. Additionally, to prevent the model from recognizing the exact words in different cases as distinct, all text in the dataset was transformed to lowercase.
Removal of Hashtags, Numbers, and Punctuation
Hashtags and symbols used on social media for aggregating related content, along with numbers and punctuation, were deemed unnecessary for our models and thus removed. This action, facilitated by regular expressions, aimed to decrease memory demands and quicken the model training process.
Stopword Removal
Words that contribute minimal meaningful information to sentences, known as stopwords (e.g., “the”, “and”, “to”), were eliminated using a specific Python library designed for this purpose. This step helps in reducing dataset noise.
Tokenization
The tokenization process involves breaking down text into smaller units, or tokens, which are essentially individual words. This step, crucial for sentiment analysis, aids in streamlining the extraction of features.
Lemmatization and Stemming
To address the issue of words with the same meaning being presented in various forms, lemmatization and stemming techniques were applied. Lemmatization transforms words into their lemma or dictionary form, while stemming truncates words to their base form, removing endings to uncover the root meaning.
3.3. Dataset Exploration
Before initiating the model training process, a preliminary dataset exploration was conducted to gain insights and familiarity with the data. This exploration phase involved extracting and visualizing words frequently appearing within the dataset. The subsequent section delves into the specifics of word frequency analysis and word cloud visualizations.
3.3.1. Word Embedding and Visualization
This section introduces NLP methods. Word embedding is a method utilized in NLP. This approach converts words or phrases from sentences into corresponding vectors of real numbers. These vectors are instrumental in identifying word predictions, similarities, and semantic meanings. Utilizing word embedding simplifies the training process and feature extraction in ML. Our study explores various exploration techniques [
55].
3.3.2. Word Frequency
After the cleaning phase, word frequency analysis was employed to scrutinize the dataset further. This analysis revealed the most frequently used words in the dataset, as shown in
Table 2. The Natural Language Toolkit (NLTK), a Python package for NLP, was utilized.
The dataset was scrutinized to identify elements like words and frequencies.
A matrix A was constructed to determine the word frequency per tweet, comprising m words () over n tweet (). The cell value in this matrix indicates the occurrence frequency of word in tweet .
The initial word-by-tweet matrix underwent normalization of word frequencies, laying the groundwork for further analysis. In our study, CountVectorizer, a tool from the scikit-learn library in Python, transformed text into vectors according to the frequency of each word’s appearance in the text [
56].
Table 2 represents a quantitative analysis of text data showing the frequency of each word’s appearance within KFU’s Twitter. The words are arranged in descending order of frequency, indicating that “university” is the most frequently occurring word in the analyzed text with 6607 instances, followed by “Faisal” with 6244 occurrences. The counts reflect the prominence of specific themes or topics within the dataset, with words like “Saudi Arabia”, “Nutritional”, and “Environmental sustainability” suggesting a focus on educational, health, and environmental issues in the context of Saudi Arabia. The table serves as a tool for understanding the emphasis and concentration of particular terms within the text, which can be helpful for content analysis, trend identification, or linguistic research.
Table 3 shows the top most-frequent words in the 9-ID domain from KFU. This categorization showcases the university’s diverse academic and research interests through social media engagement.
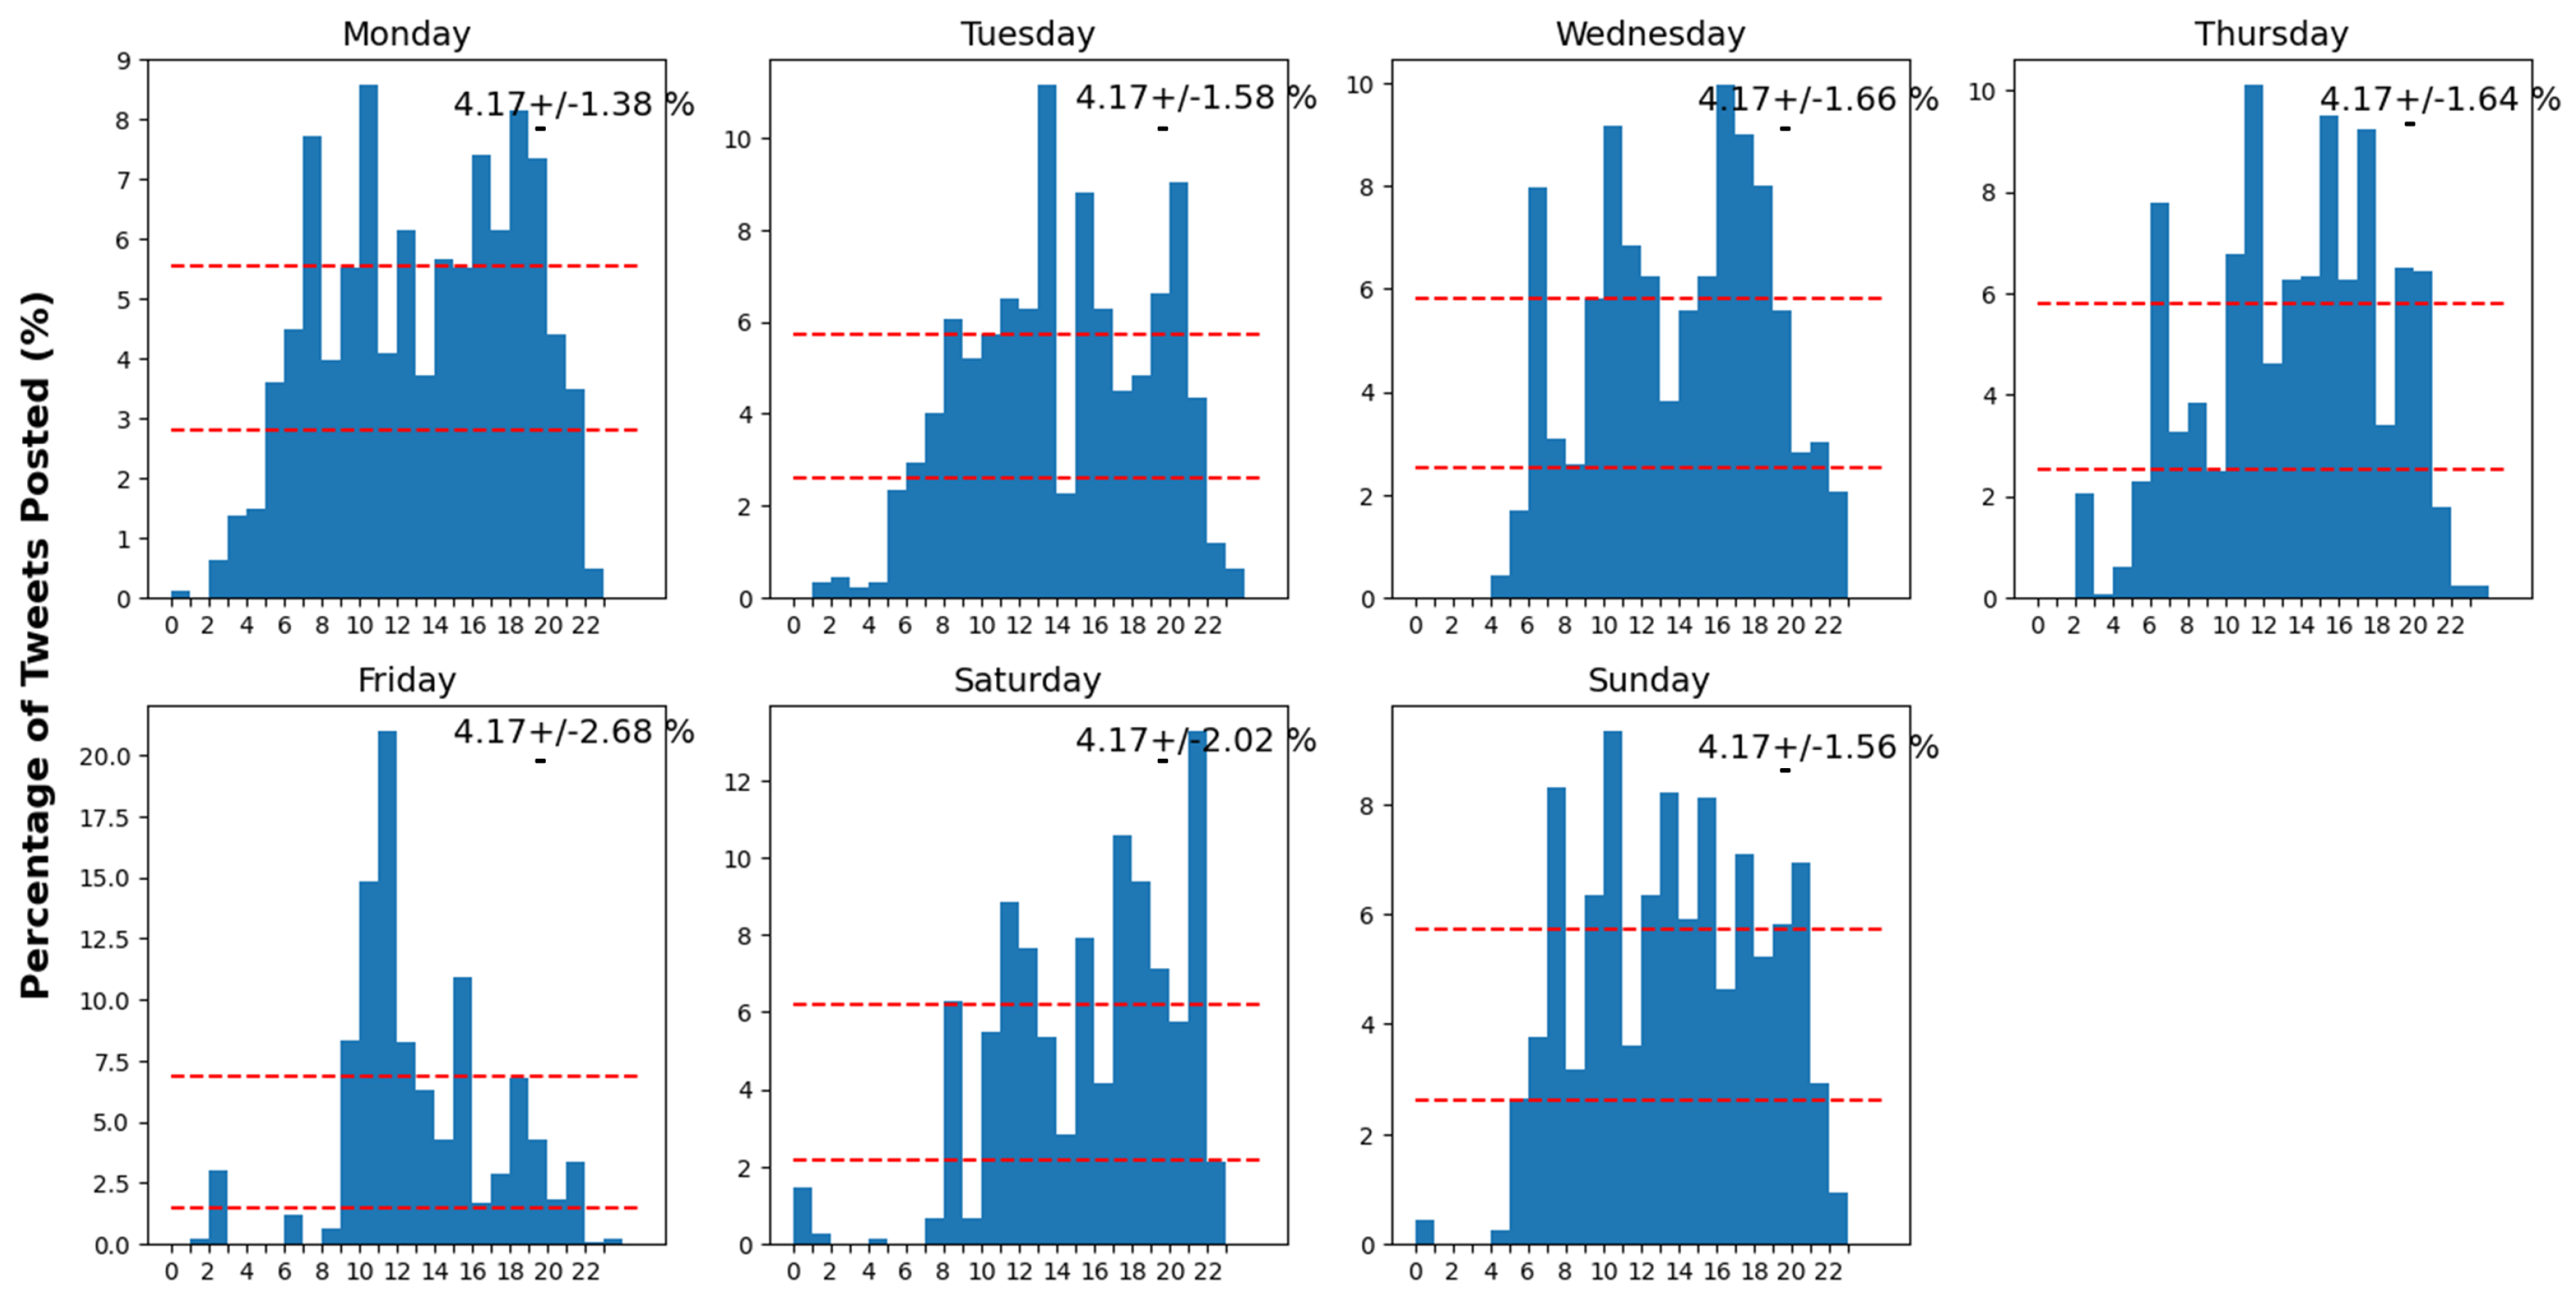
3.3.3. Analysis of Hourly and Daily Patterns in Twitter Activity
Figure 2 provides a visual and statistical analysis of Twitter usage patterns, suggesting when users are most and least active on the platform during different hours and days of the week. Each panel represents one day, from Monday to Sunday, with the x-axis divided into 24 h and the y-axis showing the percentage of total tweets posted during each respective hour. The red dashed lines represent the mean percentage of tweets posted.
Key observations that can be made from
Figure 2 include:
Hourly Activity Patterns: Tweeting Patterns by Hour: Significant variations in the frequency of tweets are observed from 10 a.m. to 6 p.m., indicating heightened user interaction throughout this timeframe. On the other hand, tweeting activity declines from 1 a.m. to 6 a.m.
Daily Variations: While the general shape of the distribution remains similar from day to day, there are noticeable variations. Certain days exhibit unique patterns, such as Friday showing a significant peak that exceeds the observed average activity.
Average Tweeting Activity: The red dashed lines indicate the average percentage of tweets posted at a given hour, with the accompanying margin of error. These averages provide a baseline to compare against the actual tweet percentages each hour for every day.
Weekday vs. Weekend: The histograms for Saturday and Sunday display a different tweeting pattern compared to weekdays, with activity spread more evenly throughout the day and potentially starting later, which could suggest a change in user behavior during the weekend.
3.3.4. Correlations between Replies Count and Likes Count
Figure 3 presents a correlation matrix between the replies count and likes of KFU’s audience posts. The high correlation implies that as the number of replies to a post increases, the number of likes also tends to increase.
3.3.5. Statistical Summary of Replies and Likes of the Audience
Table 4 presents a descriptive analysis of reply and like counts from a collected data sample. The average number of replies is approximately 9.41%, while the average number of likes is much higher at around 87.94%. There is a significant variation in likes as indicated by a standard deviation of 2801.89, much higher than the replies’ standard deviation of 444.15. The maximum number of replies recorded for a single data piece collected is 31,744, and the highest number of likes is 200,202.
3.4. Feature Engineering
Feature engineering significantly enhances the performance of ML models by developing pertinent and valuable features from raw data. In our research, we concentrated on creating features for clustering and categorization. By meticulously designing features highlighting significant patterns and connections within the data, we sought to enhance our models’ ability to group similar data points and classify them into relevant categories. Feature engineering aimed to strengthen our ML algorithms’ predictive accuracy and decision-making capabilities using processed data.
3.4.1. Clustering Model
This section outlines the methods used to assess the data similarity discussed in the previous section. Our study employed the K-means algorithm. The clustering model [
57] is an effective tool in data science. It represents a technique used to identify clusters within a dataset, ensuring that elements within the same cluster exhibit the highest level of similarity while maximizing the dissimilarity among elements from different clusters.
The K-means algorithm is widely recognized in unsupervised ML for effectively addressing clustering issues. It arranges
n observations into
K distinct clusters, ensuring each observation is nearest to its centroid. The algorithm proceeds through a cyclic method consisting of two key steps: initially, the assignment step, in which observations are grouped into the nearest cluster, followed by the update step, during which the centroids of these clusters are revised [
58].
Initialization
Choose K initial centroids by using an initialization technique K-means algorithm.
Assignment Step
For each observation
, find the closest cluster centroid and assign
to that cluster, as shown in Equation (
1).
Here, denotes the central point of cluster k.
Update Step
Update the centroid of each cluster to be the mean of the observations in the cluster:
Here, indicates the total number of points assigned to cluster j.
Iteration
Repeat the Assignment and Update steps until the centroids no longer change significantly or a predetermined number of iterations is reached.
Objective Function
The objective of K-means is to minimize the sum of squared distances between points within the same cluster, referred to as the Within-Cluster Sum of Squares (WCSS):
Choosing K: The Elbow Method
In our study, the elbow method with the Python scikit-learn library was utilized to identify the best number of clusters. The elbow method involves plotting the WCSS against various values of K and looking for a point where the decrease in WCSS begins to slow down, indicating a good balance between K and the total WCSS.
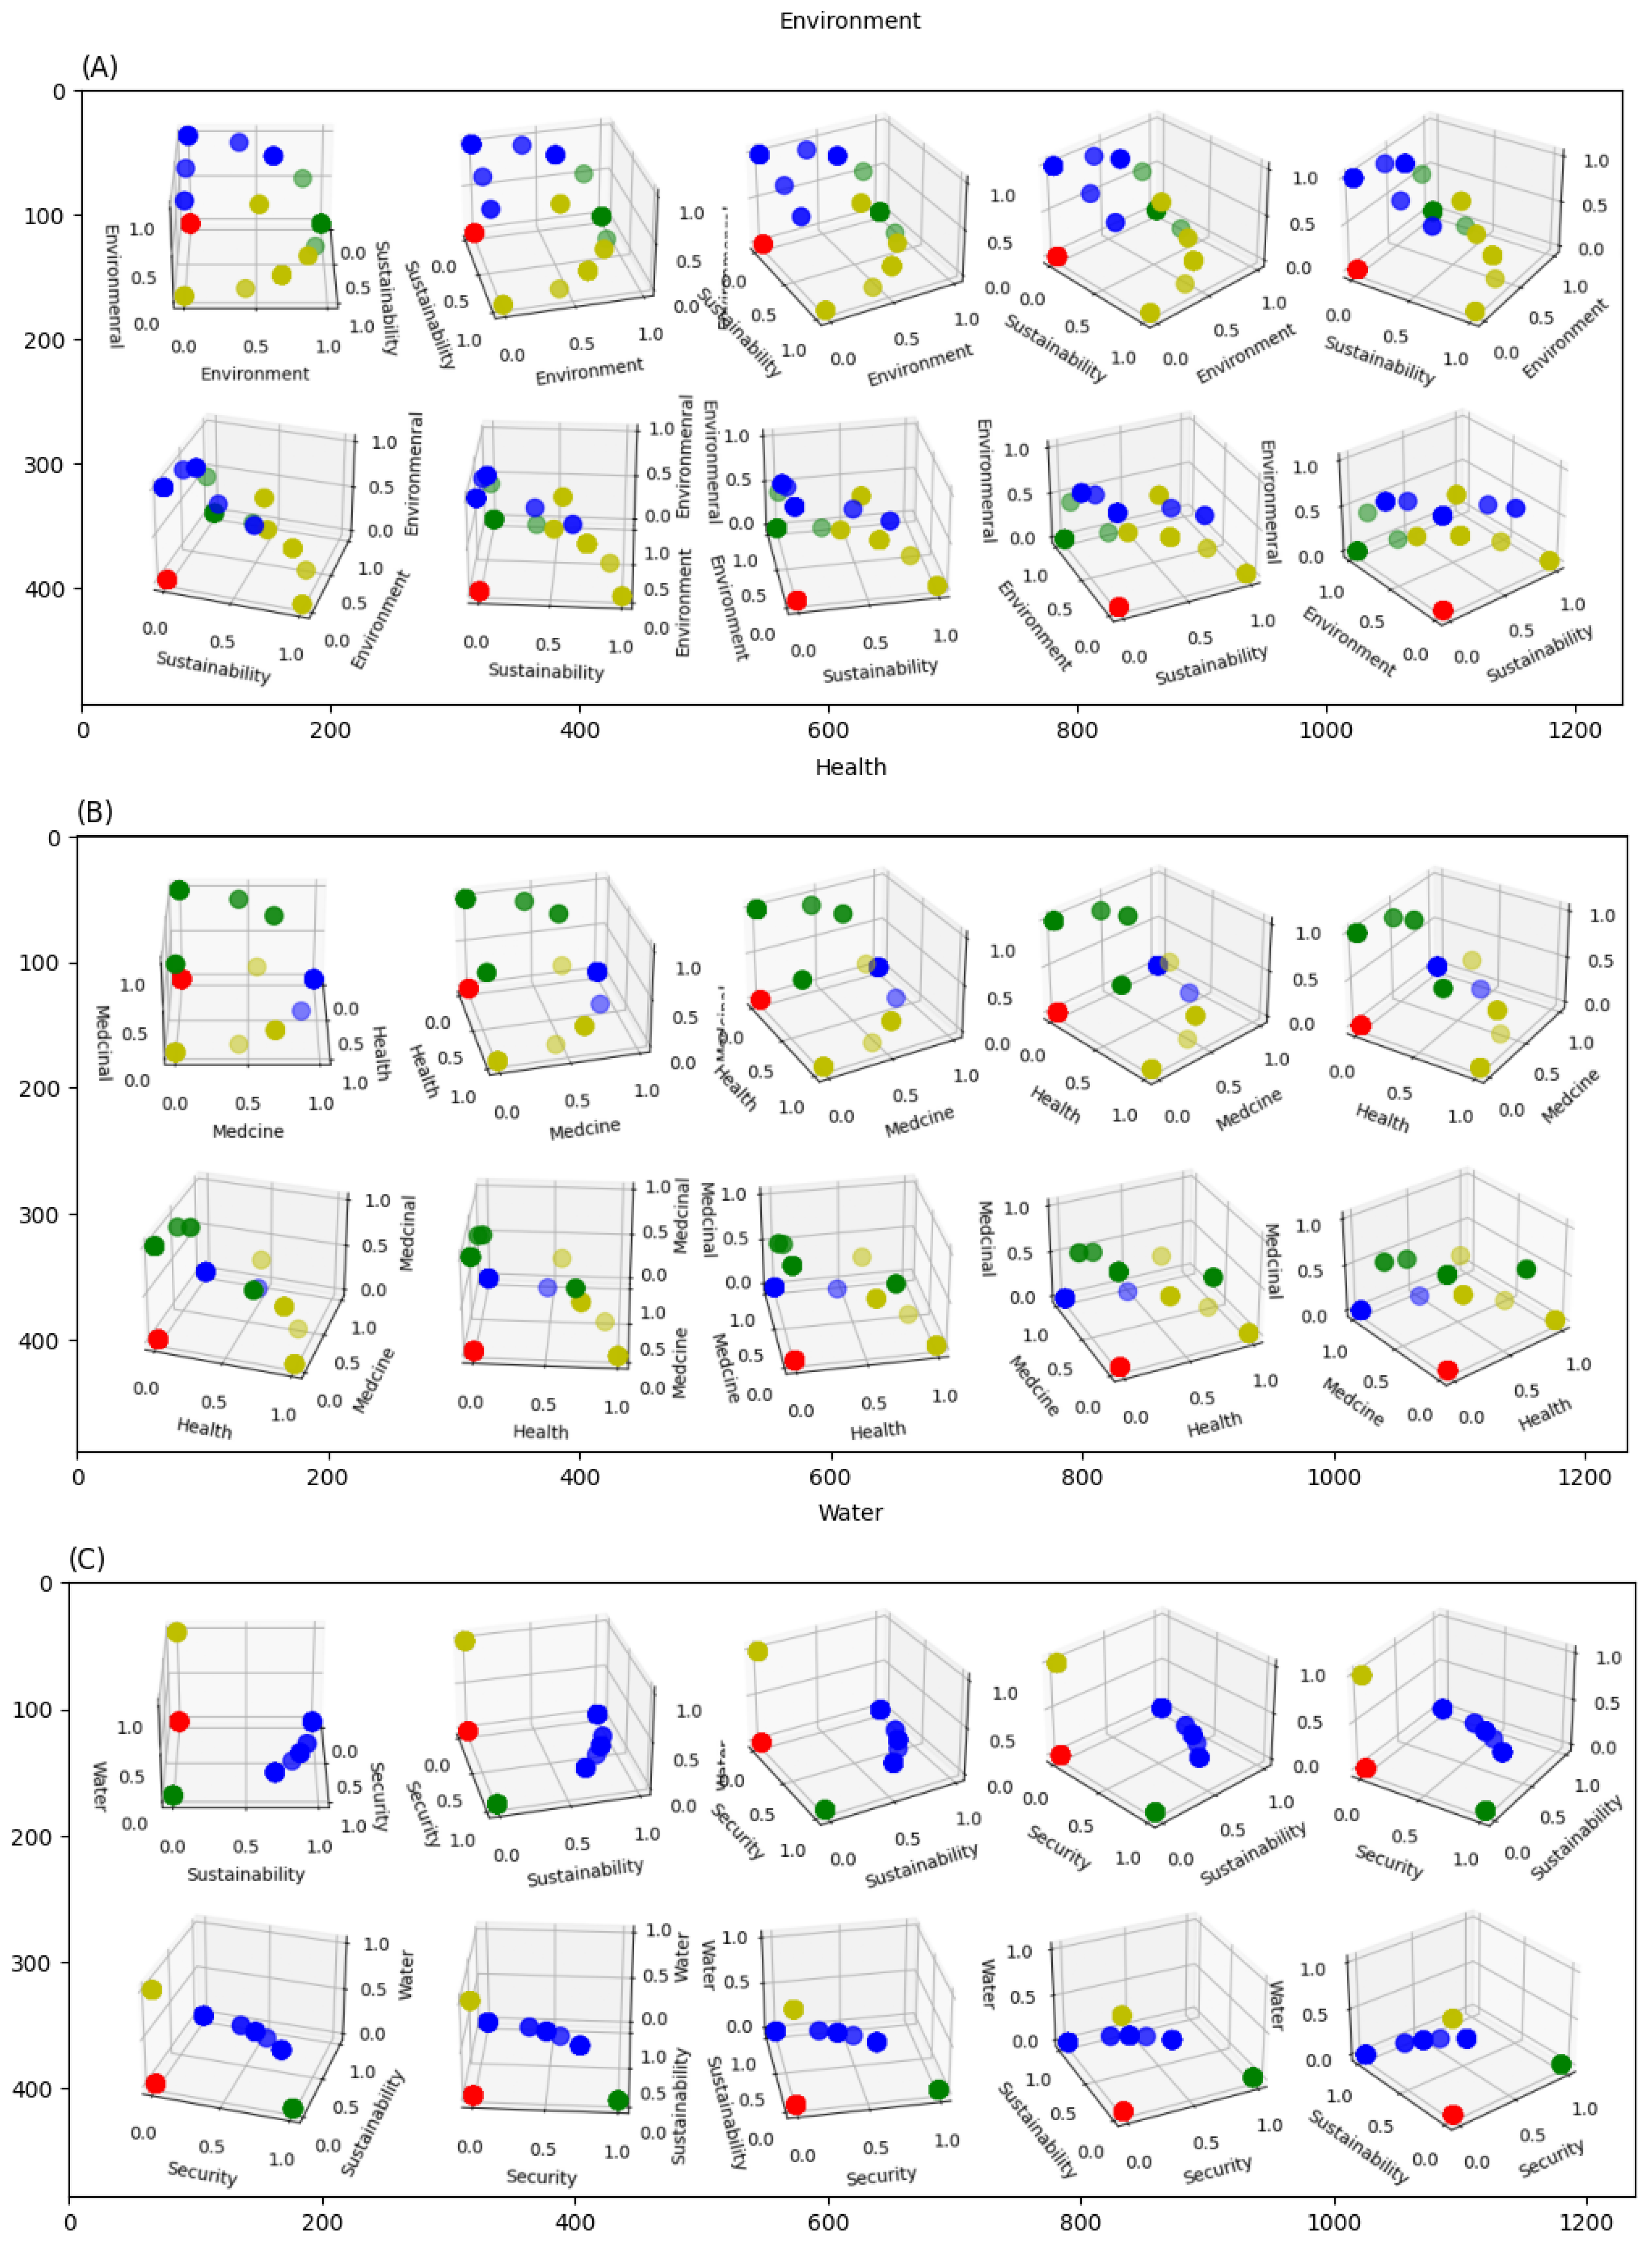
Figure 4 illustrates the results of applying the K-means clustering algorithm to a proposed dataset, which led to the identification of eight distinct clusters using the elbow method. Each cluster’s centroid denotes the mean position of its points, illustrating the algorithm’s effectiveness in grouping the data into meaningful categories based on the intrinsic patterns observed in the dataset.
Figure 5 shows the high correlation between the environment, health, and water domains, as an example, and various high-frequency words. The visual representation seeks to discover trends or conglomerates in the data, associating the prevalence of specific words with their respective domain areas. This is especially apparent with words such as “medicine”, “hospital”, “patient”, and “health” related to the health sector, as well as words of environmental and sustainability issues within the environmental domain.
3.4.2. Features Vectorization
The current research applied two models to transform text data into meaningful numerical representations after clustering the data into eight clusters: Term Frequency-Inverse Document Frequency (TFIDF) and Word2vec model. The details are discussed in
Section 3.4.3 and
Section 3.4.4.
3.4.3. Term Frequency-Inverse Document Frequency (TFIDF)
TFIDF, introduced by Joachims [
59] within a probabilistic context, stands for Term Frequency-Inverse Document Frequency. It is a statistical tool highlighting the importance of a word in a document, which is part of a larger dataset or corpus. Essential for text mining and information retrieval activities, TFIDF plays a crucial role in extracting features and determining the relevance of information.
3.4.4. Word2Vec Model
Word2vec [
60,
61] is a technique for NLP. The algorithm creates word embeddings, vector representations of words in a continuous vector space. These embeddings capture syntactic and semantic word relationships. Word2vec includes the Skip-Gram model.
The Skip-Gram model uses a target word to predict context words. Its objective function is:
The probability
is calculated using the softmax function:
where
and
are the “input” and “output” vector representations of the word
w, and
W is the vocabulary size.
3.4.5. Tweet Categorization Methodology
This subsection describes a methodology for processing and categorizing tweets. The method employs the Word2vec model to convert a dataset of tweets into a series of word vectors, which facilitates the assessment of word meanings and similarities, where semantic proximities and lexical similarities are quantifiable.
Let represent the set of categories, and be the corpus of tweets. The tweets are tokenized into a set of tokens , where each token corresponds to a unique word. A Word2vec model is trained over to learn vector representations for each word .
A lexicon is defined where each category is associated with a subset of keywords . The categorization process employs a binary classification mechanism where a regular expression is formulated for each category using its keywords , combined with the logical “OR” operator.
The binary indicator function
for a tweet
t and category
is given by:
The DataFrame is augmented with columns for each category , and tweets are annotated as per values. Algorithm 1 encapsulates the Tweet Categorization Methodology.
| Algorithm 1 Tweet Categorization Method. |
| Require: (List of tweets), (Dictionary of categories and associated keywords)
|
| Ensure: (DataFrame with categorized tweets)
|
- 1:
Initialize tokenized tweets , word vectors , category patterns - 2:
function TokenizeTweets() - 3:
- 4:
return - 5:
end function - 6:
function TrainWord2VecModel() - 7:
- 8:
return - 9:
end function - 10:
TokenizeTweets - 11:
TrainWord2VecModel - 12:
for all do - 13:
- 14:
- 15:
end for - 16:
- 17:
for all do - 18:
- 19:
end for - 20:
for all do - 21:
for all do - 22:
if then - 23:
- 24:
end if - 25:
end for - 26:
end for - 27:
return
|
3.4.6. Distribution Analysis of Tweets by ID Domains at KFU
This study explores the connection between Twitter data collection and KFU-ID domains. Through data clustering and the similarity models, closely aligned clusters were identified. It was found that 76.4% of the analysis revealed positive sentiment, covering all data associated with KFU’s 9-ID domains. Negative sentiment comprised 13.7% of the data, including hashtags and retweets, while neutral sentiment accounted for 9.9%, encompassing conferences, exhibits, and celebrations.
Figure 6 illustrates the sentiment distribution of the tweets collected.
Figure 7 shows tweets’ distribution based on nine ID domains from 2019 to 2023.
Figure 7 illustrates that the environment has the highest count of tweets, followed by management and manufacturing. Water has the lowest count of tweets compared to the other domains.
Table 5 identifies the leading domains each year from 2019 to 2023. In 2019, the Environment domain was the most prominent. In 2020, Agriculture and Health were the highest domains. In 2021, Agriculture, Environment, and Health all shared prominence. The Transport domain led in 2022, while Energy was the highest in 2023. This table illustrates the shifting priorities and focus areas across different years, with certain domains like Agriculture and Health appearing as key areas in multiple years.
Table 6 provides a detailed overview of the yearly tweet counts for the most active domain, the total count across all years, and the percentage of the total count for that domain. For example, the environment had 1356 tweets over the years, with the highest count in 2019 (604 tweets), which represents 44.54% of all environment tweets.
Figure 8 presents the correlations between 9-ID domains per year
In 2019, the environment domain significantly exceeded the others, followed by the manufacturing domain.
From 2020 onwards, there is a noticeable decline in the counts for all domains, with some variation between them except the health and agriculture domains because of the presence of the Corona pandemic COVID-19.
In 2021, the distribution among ID domains like health, technology, and agriculture was fairly even, showing balanced activity across these domains. However, the environmental domain had the lowest representation compared to the others.
By contrast, 2022 shows a more varied distribution, with certain domains such as technology, transport, and agriculture seeing a higher count, indicating a more significant presence or focus within the collected data. The environmental domain, in particular, shows a substantial increase, reflecting a growing emphasis on environmental topics or events related to that domain in the data from that year.
The data for 2023 show an interesting resurgence in the energy domain. This trend, alongside sustained interests in the environment, manufacturing, technology, and health domains, may signal a strategic refocusing or the emergence of new trends in the energy domain.
3.4.7. Correlation of the Most Frequent Words and the Nine Domains of the ID
This section outlines the relationship between all tweets and their corresponding ID-categorized words.
Figure 9 provides a distribution of tweets across various domains and effectively visualizes the prevalence of topics discussed in the tweets. The largest category is technology, accounting for 26.6%.
Figure 10 displays the percentage distribution of ID domains after applying the tweet categorization methodology. It indicates that technology holds the most significant percentage at 34.24%, followed by agriculture at 23.04%, and environment close behind at 22.93%. Management and transport rank third at 16.71%, and manufacturing comes fourth. The smallest percentages are observed in water at 4.02% and energy at 2.01%.
Figure 11 shows the correlation coefficients of the 9-ID domains, highlighting the strength of their relationships based on shared attributes. The technology, agriculture, and environment domains exhibit notably strong relationships, each having a perfect correlation coefficient of 1.00, as typically seen on the diagonal of a correlation matrix. Strong inter-domain relationships between agriculture and environment (0.79) and somewhat strong correlations are observed between transport and manufacturing (0.32). On the other hand, very weak relationships are observed between technology and several domains like health, agriculture, and environment, with coefficients near 0.00, indicating minimal correlation or shared attributes between these sectors.
3.5. Learning Algorithms
In our research, four different models of ML techniques were applied: Logistic Regression (LR), as shown in Subsection LR, and Support Vector Machine (SVM).
In this study, the dataset is allocated with 80% for training purposes and 20% designated for testing. Moreover, the training dataset is further segmented into two parts: the training and validation subsets. These subsets were utilized to adjust the model’s hyperparameters and develop the final model.
3.5.1. Logistic Regression (LR)
Logistic Regression [
62,
63], also known as the logit model, explores the connection between several independent variables and a categorical dependent variable. It predicts the likelihood of an event’s occurrence by adapting the data to fit a logistic curve. It uses the logistic (sigmoid) function to estimate probabilities, which are mapped to classes.
3.5.2. Support Vector Machine (SVM)
A Support Vector Machine [
64] is a powerful and versatile supervised ML algorithm used for classification and regression tasks. It is particularly well-suited for classifying complex but small- or medium-sized datasets. In our experiment, the polynomial kernel is applied.
3.5.3. Artificial Neural Networks (ANNs)
Artificial Neural Networks [
65,
66] are advanced computational models that mimic the brain’s neural networks, designed to recognize patterns and solve problems by learning from data. Composed of layers of interconnected nodes, they process input data through these nodes to make predictions or decisions. ANNs are trained by adjusting the connections between nodes to minimize errors, using techniques like backpropagation. They excel in tasks such as image recognition, NLP, and more by effectively handling complex, nonlinear relationships in data. Despite their capabilities, optimizing ANNs requires carefully selecting architecture and parameters. As technology advances, ANNs significantly contribute to AI, enhancing ML and data processing capabilities.
3.5.4. Random Forest (RF)
Random Forest [
67,
68,
69,
70] is a potent predictive instrument that employs a bagging strategy to generate a randomly selected subset of training data for each decision tree. The RF algorithm aggregates the outcomes from each tree to make classifications and is capable of addressing both regression and classification challenges, including tasks with multiple classes.
The pseudo-code for the proposed “KFU-ID Twitter” algorithms that are suggested in the previous subsections is demonstrated by Algorithm 2.
| Algorithm 2 KFU-ID Twitter Algorithm. |
- 1:
Input: Raw data from the official KFU’s Twitter - 2:
Output: Best performing model, Performance metrics of the final model. - 3:
Start - 4:
Collect Data - 5:
Collect raw data from the official KFU’s Twitter. - 6:
Clean Data - 7:
Preprocess the data by handling missing values, outliers, …, and removing duplicates, etc. - 8:
Explore Dataset - 9:
Perform exploratory data analysis to understand the characteristics of the data - 10:
Vectorization - 11:
if text data is present, vectorize the data using: - 12:
TFIDF: Convert text to term frequency-inverse document frequency feature vectors - 13:
Word2Vec: Convert words into word vectors - 14:
Clustering - 15:
Apply K-means clustering to group similar data points, Equations ( 1)–( 3) - 16:
Tweet Categorization Methodology - 17:
Apply Tweet Categorization Methodology to process and classify tweets, Equation ( 10). - 18:
Split Data - 19:
Split the processed data into training and testing datasets - 20:
Train ML Models - 21:
for each model type (LR: Logistic Regression, SVM: Support Vector Machine, ANN: Artificial Neural Network, RF: Random Forest): - 22:
Train the model on the training dataset - 23:
Test Models - 24:
Evaluate each trained model on the testing dataset to obtain performance metrics - 25:
Model Selection - 26:
Compare the performance metrics of all models - 27:
Select the model with the best performance - 28:
Performance Evaluation - 29:
Perform a final evaluation of the selected model based on precision, recall, classification accuracy, and F1-score metrics. - 30:
End - 31:
Return the best-performing model and its performance metrics
|
4. Experimental Results
4.1. Parameters Settings
Table 7 summarizes the hyperparameters used for applying the proposed model: TFIDF, Word2vec, and four ML algorithms: LR, SVM, RF, and ANN. These parameters were adjusted before training the models to influence their behavior and performance. The listed values were used to run experiments in Python as part of the research presented in this paper.
4.2. Performance Evaluation Criteria
A set of widely acknowledged metrics was applied to assess the proposed models’ efficacy, ensuring the integrity and statistical depth of the experimental analysis. These metrics, specifically accuracy, precision, recall, and the F1-score, serve as the cornerstone for evaluating the performance of proposed models.
Accuracy [
71], which quantifies the overall correctness of the model’s predictions, integrates both correctly identified positives and negatives. It contrasts true positives (
) and true negatives (
) against the incorrect classifications of false positives (
) and false negatives (
). The formula for accuracy, incorporating these aspects, is detailed in Equation (
11):
Precision [
72] evaluates the reliability of positive predictions, calculated as the proportion of true positives (
) over the sum of true positives and false positives (
), as shown in Equation (
12):
Recall [
73], or sensitivity, measures the model’s ability to identify all relevant instances accurately, defined by the ratio of true positives (
) to the total of true positives and false negatives (
), as depicted in Equation (
13):
Lastly, F-score [
74], providing a balanced measure between precision and recall by calculating their harmonic mean, reflects the model’s balanced performance in terms of both precision and recall, as formulated in Equation (
14):
4.2.1. The Performance Results of TFIDF and Word2Vec
This section presents the results of the proposed TFIDF and Word2vec models using SVM.
Table 8 shows that the Word2vec model achieved a 99% accuracy and 96% for TFIDF. In addition, in the LR model, the accuracy results were 95% and 97% for the TFIDF and Word2vec, respectively. This indicated that Word2vec achieved the best results compared to TFIDF.
4.2.2. The Performance Results of Word2vec with the Learning Algorithms
This section examines the outcomes of applying Word2vec with the four ML techniques.
Table 9 shows the average overall performance for LR, SVM, RF, and ANN using the Word2vec model, and
Figure 12 presents the average overall accuracy for the four models. The results indicated that RF scored the highest results; it achieved 100% for accuracy, precision, recall, specificity, and F-score, respectively. Conversely, the ANN model exhibited the lowest performance with precision at 95%, recall at 81%, F-score at 87%, and accuracy at 70%.
4.2.3. Comparative Analysis
Figure 13 shows the confusion matrix for the Word2vec model using the four ML algorithms. The matrix for the ANN model showed that it effectively predicted classes ‘0’ and ‘2’ with a high rate of correct class identification. Nevertheless, it also showed a significant rate of misclassifications from classes ‘0’ and ‘2’ into class ‘1’. The SVM model demonstrated high precision in accurately classifying class ‘1’, misclassifying only a small number of instances as ‘0’ or ‘2’. Meanwhile, the RF and LR models demonstrated strong predictive performance for classes ‘0’ and ‘2’, with very few misclassifications noted.
4.2.4. Average Prediction Results for Each Domain Using Tweet Categorization Methodology
Table 10 displays the aggregate predictive performance of precision, recall, accuracy, and F-score for the nine domains obtained using the four ML techniques: LR, SVM, RF, and ANN, after applying the tweet categorization methodology.
Figure 14 shows the accuracy results for the nine-domain KFU-ID using the four MLs. These results were derived following extraction of the most commonly used words within each domain via the word2vec similarity model. The findings reveal that SVM yielded superior prediction performance. Moreover, it is noted that the prediction outcomes for the energy domain were exceptionally high, with the SVM, RF, and ANN models all achieving a perfect score of 100%.
Figure 15 displays the confusion matrix across nine domains in the KFU-ID, showing differential performance. In the “water” domain, the model displayed strong accuracy with high true positives and negatives and minimal false negatives. In contrast, the “Technology” domain exhibited significant prediction challenges, particularly in correctly identifying class ‘1’, suggesting the need for model refinement. Other domains like “Transport” and “Management” also demonstrated mixed accuracy and misclassification rates, highlighting distinct challenges specific to each domain. These matrices collectively provided critical insights into the model’s past performance, identifying strengths and pinpointing areas requiring improvement across different sectors.
4.3. The Performance Metrics of Preprocessing Steps
Table 11 presents the performance metrics of the different preprocessing steps used in our study, evaluated through precision, recall, F-score, and accuracy. Without any data cleaning, the model showed moderate performance with an accuracy of 0.82. Implementing tokenization and stop word removal slightly improved the metrics, achieving an accuracy of 0.83. Using TFIDF instead of Word2vec significantly enhanced performance, resulting in an accuracy of 0.95 due to its focus on the statistical importance of terms. However, the best results were observed with Word2vec, which demonstrated superior semantic understanding and contextual relevance, yielding an impressive accuracy of 0.98. Omitting clustering still provided decent results with an accuracy of 0.84, suggesting that while clustering could aid in handling data variability, other preprocessing techniques like Word2vec offered greater improvements.
4.4. Evaluating the Proposed Model on a Different Dataset
4.4.1. Overview of the New Dataset
The efficacy of the proposed model is demonstrated using another dataset from Kaggle. The dataset consists of tweets from the Twitter account of Donald Trump (
https://www.kaggle.com/datasets/austinreese/trump-tweets, accessed on 6 June 2024). The dataset consists of 43,352 tweets from the Twitter account of Donald Trump, capturing various aspects of his tweets, including unique identifiers, URLs to the tweets, the text content, timestamps, and engagement metrics such as retweets and favorites. Additionally, it includes information on user mentions and hashtags, though these fields have many missing entries. The dataset provides a comprehensive overview of Trump’s tweeting activity, offering insights into the content and popularity of his posts over time. These data can be valuable for analyzing trends, sentiment, and the impact of his social media presence.
4.4.2. Performance Comparison of the Proposed Model
Table 12 compares four machine learning models, LR, SVM, ANN, and RF, using three feature extraction methodologies: TFIDF, Word2vec, and a Categorization Methodology. It presents the models’ precision, recall, F-score, and accuracy performance. The results indicate that all models perform better with the categorization methodology than TFIDF and Word2vec. Among the models, ANN and RF consistently exhibit higher precision, recall, F-score, and accuracy, with RF achieving the highest overall accuracy of 0.96 using the categorization methodology. This suggests that ANN and RF are more effective for this dataset, particularly when enhanced by the categorization methodology.
4.5. Discussion
The purpose of this research was multifaceted. It aimed to investigate and quantify the impact of KFU’s Twitter account as a case study and evaluate its influence on disseminating institutional identity within the nine domains using various models. The results obtained from our systematic approach offer profound insights, which are discussed in this section.
Recent studies have explored various aspects of sentiment analysis and its applications in higher education, public sentiment, and text categorization. For instance, Perez et al. [
9] conducted a systematic review of social media as a teaching and learning tool in higher education, highlighting the positive impacts of social media on student engagement and learning outcomes. Our study corroborates these findings by demonstrating how KFU’s Twitter activities have enhanced engagement in various institutional identity domains, particularly in education and technology [
9].
The application of Word2vec and TFIDF has also been extensively studied. Mostafa [
75] demonstrated the effectiveness of Word2vec for sentiment analysis during the COVID-19 pandemic, showing significant improvements in capturing semantic relationships between words. Similarly, using Word2vec resulted in high accuracy and F-scores across multiple domains. Additionally, TFIDF improved precision, aligning with Joachims et al. [
59], who analyzed the Rocchio algorithm with TFIDF for text categorization.
Jain et al. [
76] provided insights into public sentiments towards the COVID-19 pandemic using Twitter analytics, highlighting the importance of real-time data in sentiment analysis. Our study extends this by analyzing the sentiments expressed in tweets related to KFU, demonstrating the role of social media in shaping public perception of institutional identity.
Methodologically, our approach aligns with rigorous data cleaning and preprocessing practices emphasized by Almahdi et al. [
31], who stressed the importance of meticulous data preparation in sentiment analysis for infectious diseases. This meticulous approach to data cleaning was reflected in our study. Furthermore, Korkmaz et al. [
77] analyzed user sentiments using various ML models and found SVM to be highly effective for sentiment classification. Our findings confirm this, as SVM achieved the highest accuracy and F-score in categorizing tweets across multiple domains.
The collected data enabled a thorough exploration of user interactions, demonstrating alignment with KFU’s-ID strategic communication goals. This evidence, extracted from confusion matrices, highlights the effectiveness of KFU’s communications in engaging and educating its audience. Applying k-means clustering and advanced sentiment analysis methodologies, such as TFIDF and Word2vec, deepened our comprehension of the data’s intrinsic patterns. Moreover, utilizing the Tweet Categorization Method was crucial in systematically classifying tweets into the nine domains that form the cornerstone of KFU’s identity framework.
This research’s significant contributions include developing and evaluating various ML classifiers, such as LR, SVM, ANN, and RF. The models’ performances, measured by accuracy, precision, recall, and F-score metrics, shed light on the vital need for modeling approaches customized to each domain’s distinct characteristics. Enhancing the analytical capabilities of this research is the introduction of an interactive dashboard meticulously crafted to offer stakeholders a real-time, intuitive overview of KFU’s social media interactions. This dashboard, an integration of user engagement metrics, provides a dynamic and current view of communicative trends, serving as a vital tool for data-driven strategy formulation.
To conclude, the research pinpointed the RF classifier in tandem with Word2vec vectorization as the most effective model, showcasing the highest level of accuracy and asserting the advantage of ensemble learning in analyzing social media data. Furthermore, the SVM model, coupled with the Tweet Categorization Method applied to the nine KFU-ID domains, supervised and enhanced the analytical process. This blend of insightful data interpretation and visual dashboard representation enhances the strategic approach of KFU’s social media team. It offers a model other educational entities can adopt to strengthen their social media presence and foster greater community engagement.
Table 13 provides a detailed comparative analysis of machine learning models used to classify tweets related to King Faisal University. Logistic Regression (LR) is effective for linearly separable data, while Support Vector Machine (SVM) excels in high-dimensional spaces. Random Forest (RF) handles nonlinear relationships well, and Artificial Neural Networks (ANNs) capture complex patterns but require extensive tuning. K-means clustering aids exploratory data analysis but is sensitive to initial cluster centers. Word2vec enhances feature generation by capturing word relationships, and TFIDF highlights significant terms, though it may miss context. The custom categorization model effectively processes and categorizes tweets using domain-specific keywords. This analysis aids in selecting the appropriate model for social media data analysis based on specific needs.
6. Conclusions and Future Work
This paper provides a convincing argument for the strategic use of social media in higher education, as evidenced by the thorough examination of King Faisal University’s (KFU) Twitter to enhance its institutional identity. By implementing advanced machine learning algorithms such as Logistic Regression, Support Vector Machine, Random Forest, and Artificial Neural Networks, the study analyzes Twitter interactions to determine KFU’s effectiveness in KFU’s awareness of its identity focused on environmental sustainability and sustainable development.
The standout result is the exceptional performance of the Random Forest model combined with Word2vec, which achieved perfect accuracy. This outcome illustrates the potential of ensemble learning models and NLP in social media analytics. The study also highlights the utility of such data-driven approaches in shaping communication strategies that resonate with the audience and reinforce the institution’s identity. The institution’s research provides actionable insights and recommendations for enhancing social media engagement. These include optimizing posting schedules for increased interaction, balancing content across various identity domains to maintain audience interest, and adapting strategies based on sentiment analysis to foster a positive institutional image.
The paper illustrates how to transform data from social media platforms into insightful analytics to steer institutional strategy. The findings benefit KFU and offer a blueprint for other educational institutions leveraging social media to solidify their brand and identity. This research suggests a shift towards evidence-based social media practices in academia, which could result in more impactful and informed engagement with the public. It sets a precedent for future research in digital communication and its influence on the educational sector’s public perception. Despite these strengths, the proposed work has limitations. The dataset is constrained to tweets from King Faisal University’s official Twitter account, limiting the generalizability of the findings to other social media platforms or broader public sentiments.
In future studies deriving from this research, we will expand our analytical scope to include textual data from tweets and multimedia content such as images and videos. Given the significant impact that visual content has on user engagement, our upcoming studies will incorporate advanced image and video analysis techniques. These techniques will enable an in-depth examination of visual narratives, assessing audience responses to multimedia and determining how such content influences engagement metrics. This initiative integrates deep learning models designed to automatically classify and predict the impact of visual elements in social media posts. Additionally, a bot will be developed to address public queries triggered by tweets, enhancing interaction and providing deeper insights into user behavior. This comprehensive approach aims to improve our ability to anticipate engagement trends and fine-tune content strategies in response to the dynamic nature of social media platforms.


