

Utilizing Cross-Ratios for the Detection and Correction of Missing Digits in Instrument Digit Recognition

Abstract
1. Introduction
- (1)
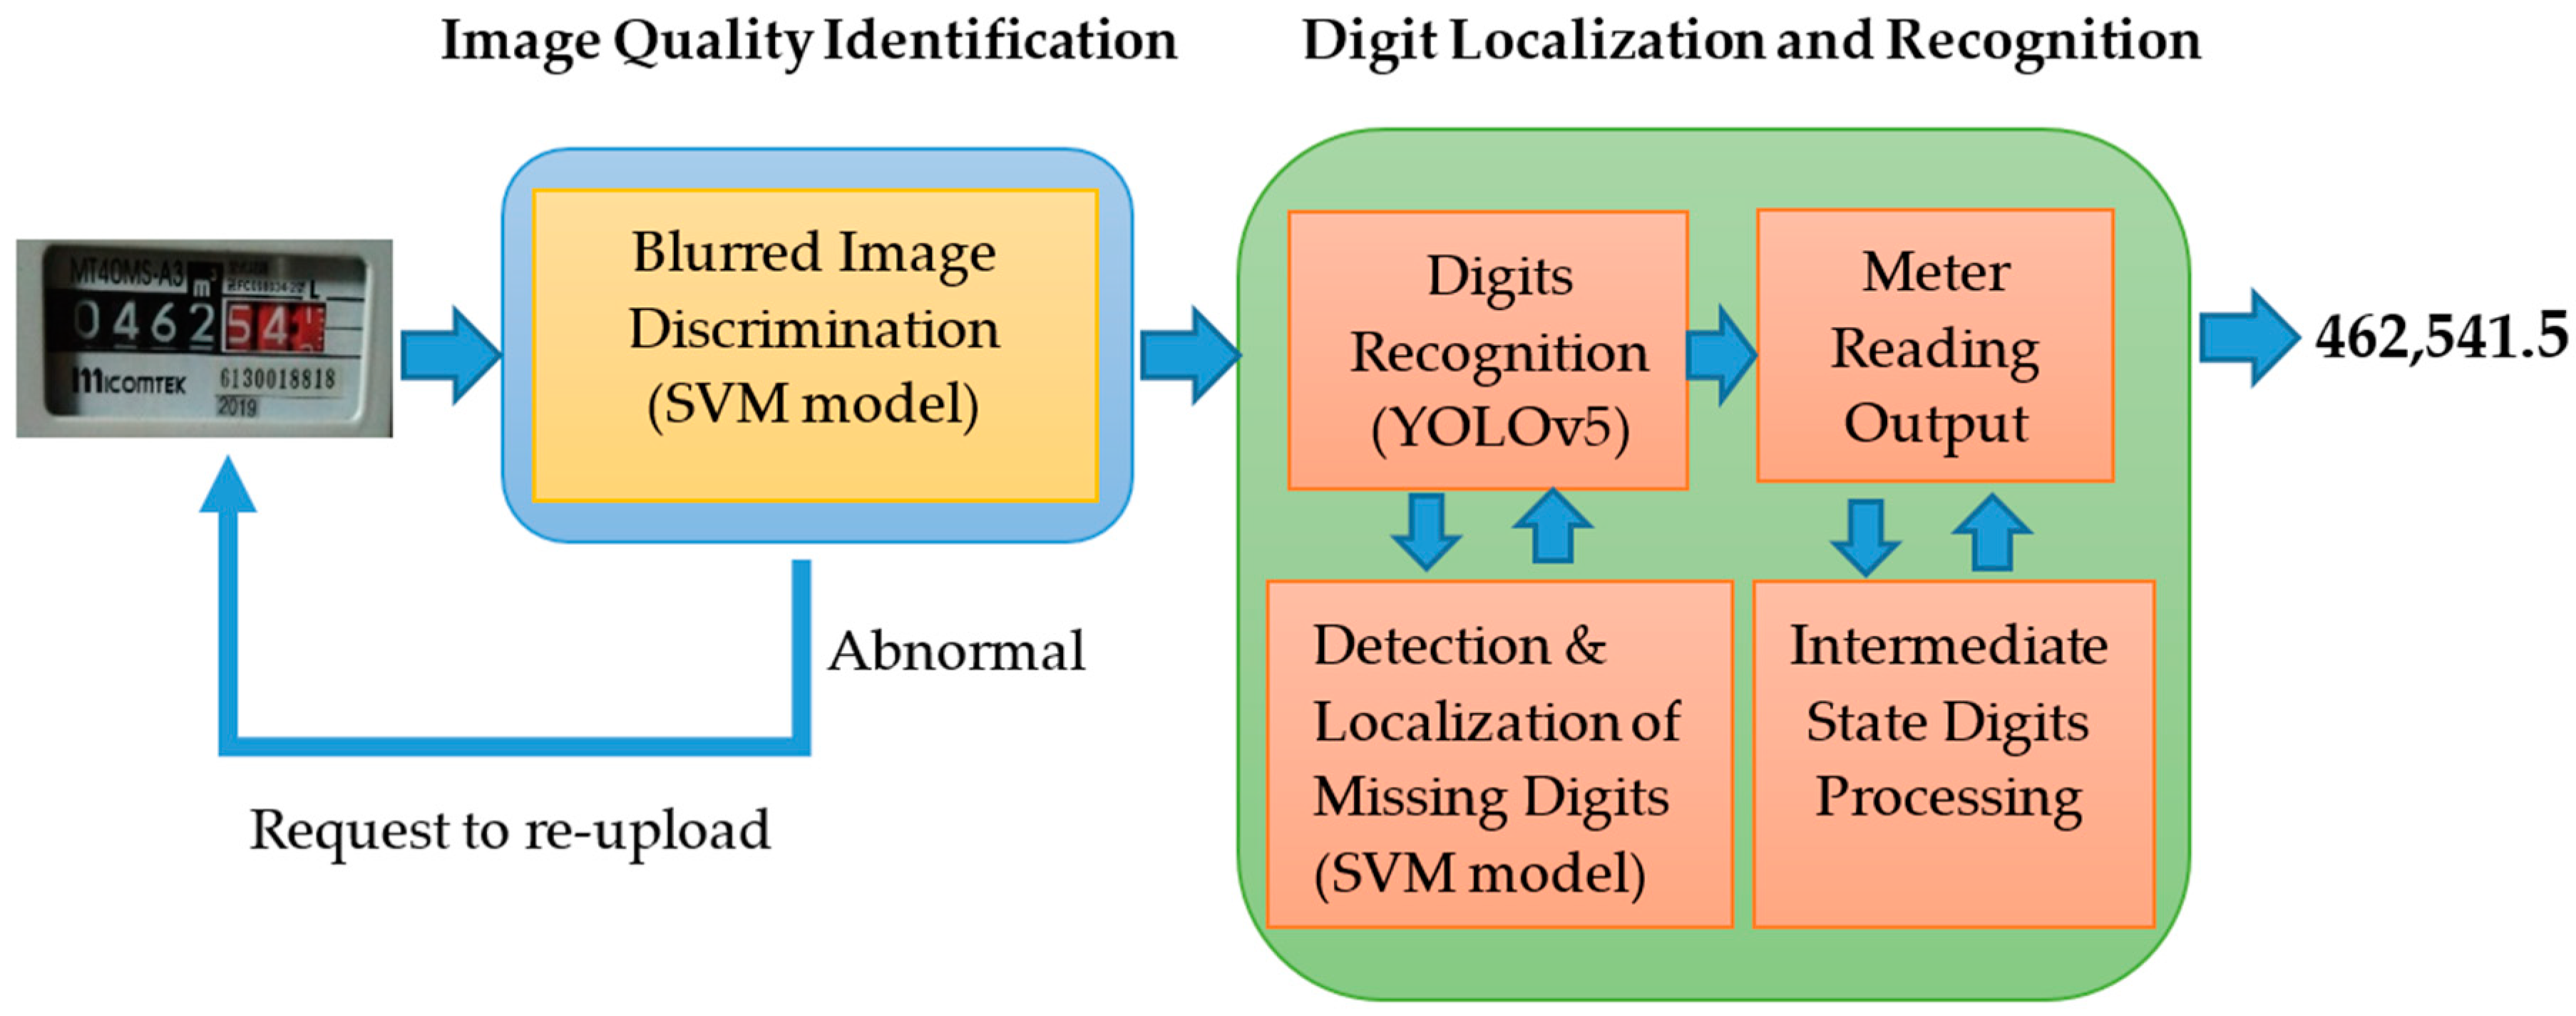
- In the application scenario of automated meter readings, the installation locations of home gas meters vary greatly, leading to significant differences in the quality of images uploaded by users, substantially reducing the success rate of automated readings. Poor image quality is primarily caused by several factors: blurred images, localized reflections, poor lighting conditions, missing digits, digits in transitional states, and images containing elements unrelated to the meter, as shown in Figure 1. These issues are primarily due to the environment’s variability and improper shooting handling (such as incorrect shooting angles or exposure settings). To address the variations in image clarity caused by different shooting environments, this study employs machine learning techniques to analyze a large dataset of images. Using a Support Vector Machine (SVM) as the classifier, this research has established a set of image quality assessment standards and categorized the images into clear and blurry classes. These classification results are used to determine whether it is necessary to request users to retake the images or whether the images are suitable for digit recognition, thereby enhancing the overall efficiency and accuracy of automated meter readings.
- (2)
- In traditional machine learning algorithms, techniques used for meter digit recognition often fail to meet practical application demands due to slow recognition speeds and lower success rates (approximately 80% to 60%). Therefore, this study aims to explore the use of advanced deep learning models to enhance meter digits’ detection and recognition efficiency. Our objective is to improve the consistency of recognition results with human-eye recognition to over 95% and ensure all visible digits are accurately identified. The choice to deploy the YOLO (You Only Look Once) series of models for image recognition tasks is based on their processing efficiency and feature identification advantages. Among the various variants, this research has chosen to implement YOLOv5, primarily considering its data augmentation techniques, lightweight and efficient backbone network architecture, and superior ability to extract and integrate target features. Furthermore, YOLOv5’s multi-scale prediction strategy enhances the model’s flexibility to adapt to targets of various sizes, further ensuring high efficiency and accurate detection performance. These characteristics make YOLOv5 an ideal choice for the meter digit recognition task in this study.
- (3)
- When dealing with images captured in unrestricted environments, the phase of digit recognition often encounters the challenge of missing digits, a problem that persists even when employing advanced deep learning models, such as the YOLO series. Given the critical importance of thoroughly reading meter digits, the issue of missing digits becomes particularly significant. This is especially true when the visibility of digits is affected by reflections or lighting conditions that are too bright or too dark, rendering some digits unidentifiable. To address this challenge, this study proposes an innovative solution based on the geometric invariants between the centers of digit boxes. Specifically, the method utilizes the cross-ratio between the digit boxes, a value that remains constant even in images with perspective distortions, thereby significantly improving the precision of locating missing digits. This method not only accurately identifies and compensates for missing digits but also enhances the robustness and reliability of the overall digit recognition system. Through this approach, this research aims to substantially increase the accuracy of meter digit recognition under various environmental conditions.
- (1)
- Algorithm Innovation: We have developed an algorithm based on the cross-ratio that effectively detects and corrects image omissions caused by perspective distortions, size changes, or rotations. This method is pioneering in the existing literature on ARM and represents a significant advancement for practical applications.
- (2)
- Architecture Optimization: Tailored to the diverse needs of ARM tasks, this study proposes a multi-tiered image processing architecture that considers interactivity, immediacy, and the processing capabilities of devices. This structure can select the most suitable machine learning or deep learning models to handle various types of image blurring, digit recognition, or detection of missing digits at the boundaries.
- (3)
- Experimental Validation: Using datasets collected from real-world applications, the experiments demonstrate that our method surpasses existing technologies in terms of digit integrity and recognition accuracy, providing a more comprehensive and precise framework for applying ARM technology.
2. Related Work
- (1)
- Template Matching Methods
- (2)
- Feature Matching Methods
- (3)
- Deep-Learning-Based Methods
- (a)
- (b)
- Chen et al. introduced a deep-learning CNN model designed for processing entire rows of digits [11]. This model performed exceptionally well on synthetic datasets but its performance declined in real-world applications due to the discrepancies between real images and synthetic samples, leading to false detections, missed digits, and low recognition rates.
- (c)
- (d)
- Yang et al. designed a method, combining Fully Convolutional Networks with attention mechanisms, capable of recognizing digits directly without segmentation [14], demonstrating good recognition performance.
3. Image Quality Identification
3.1. System Overview
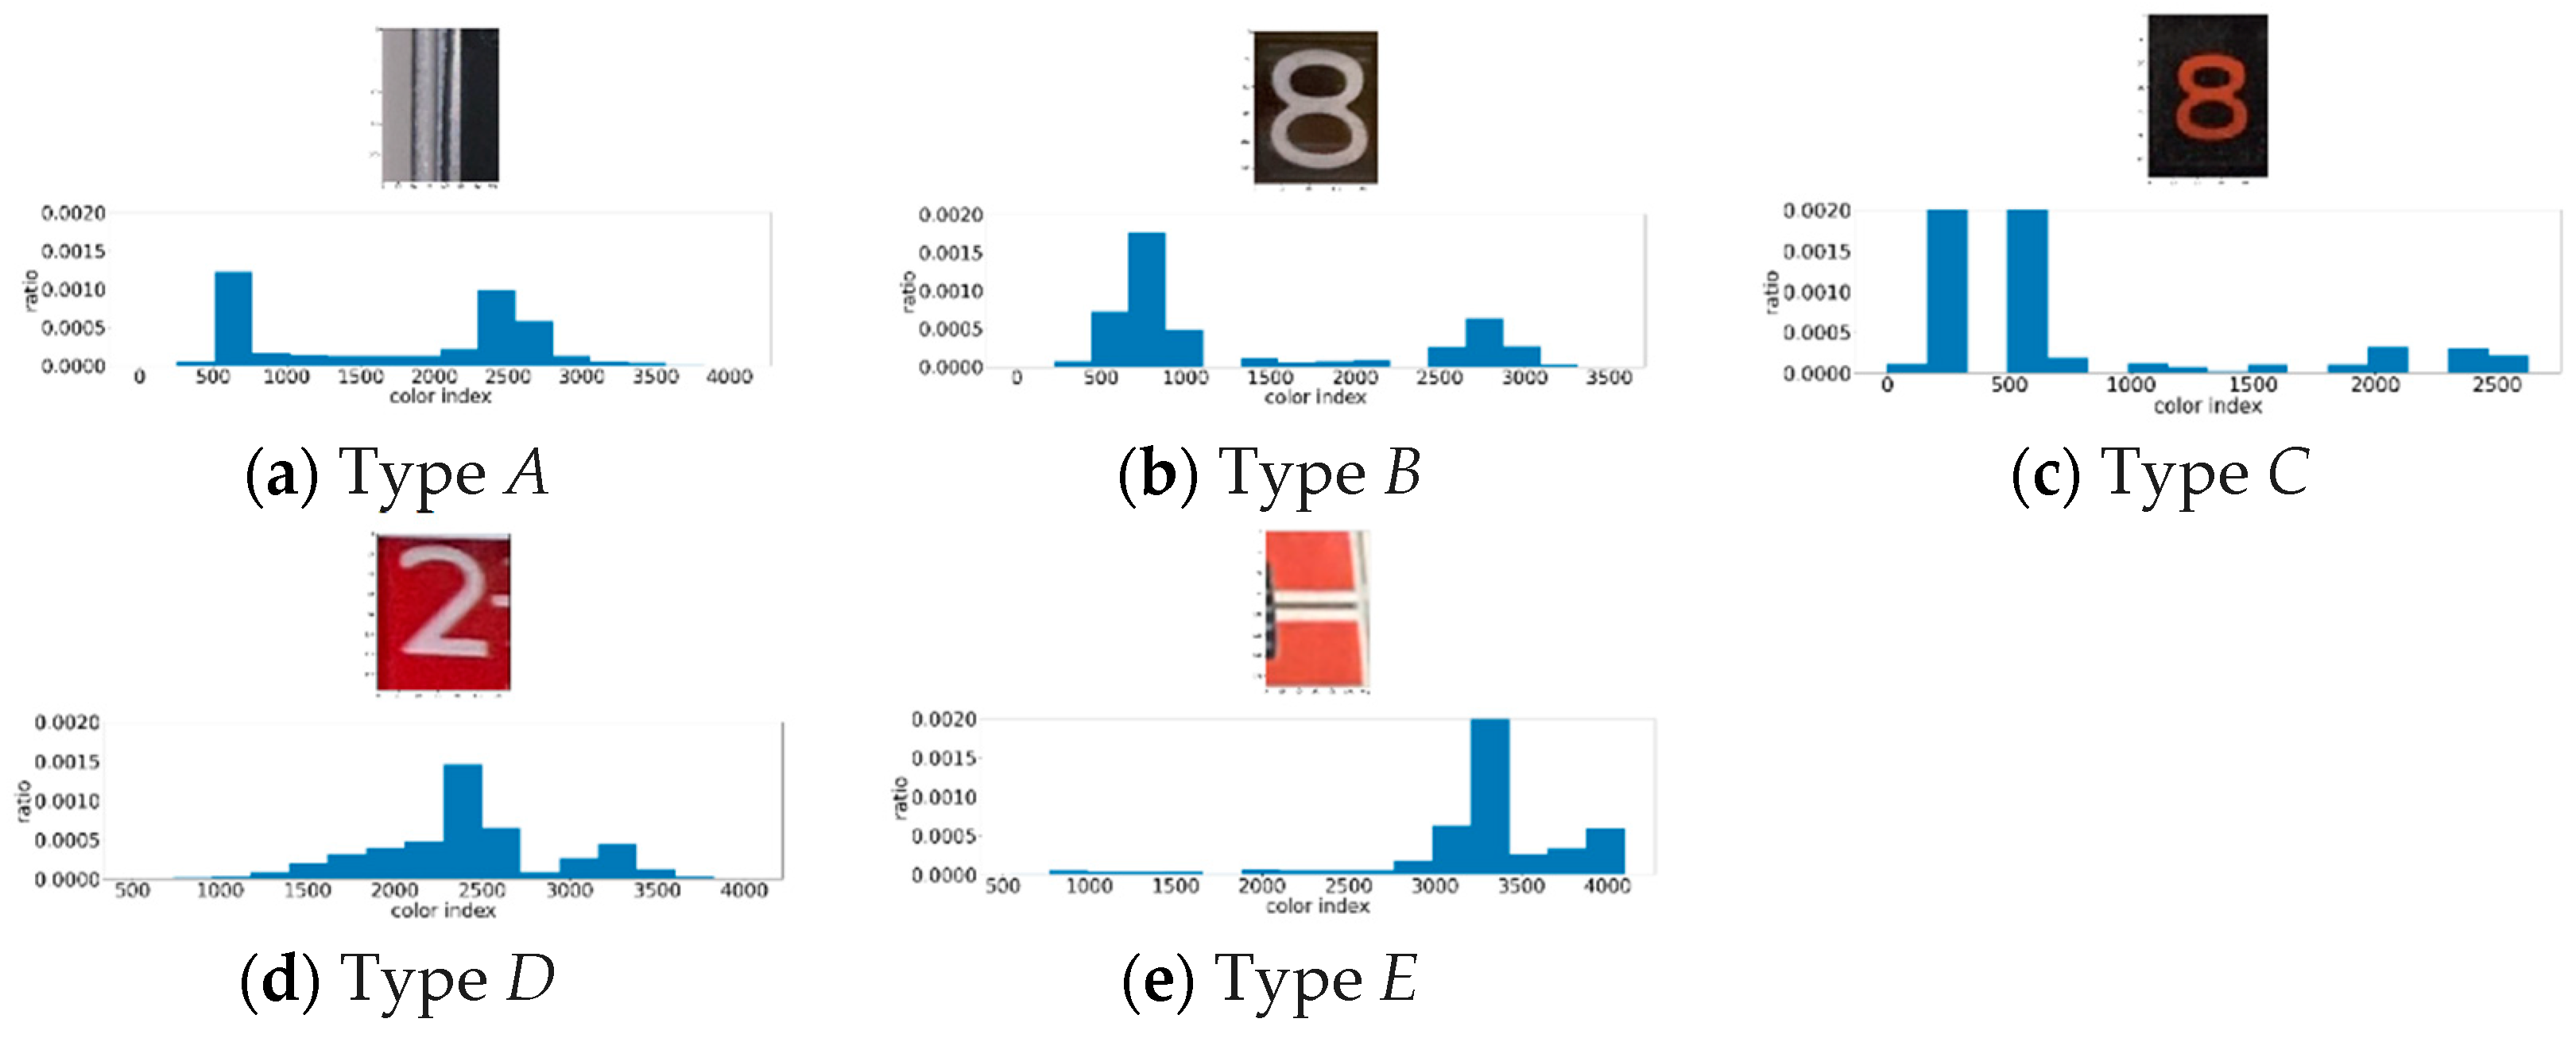
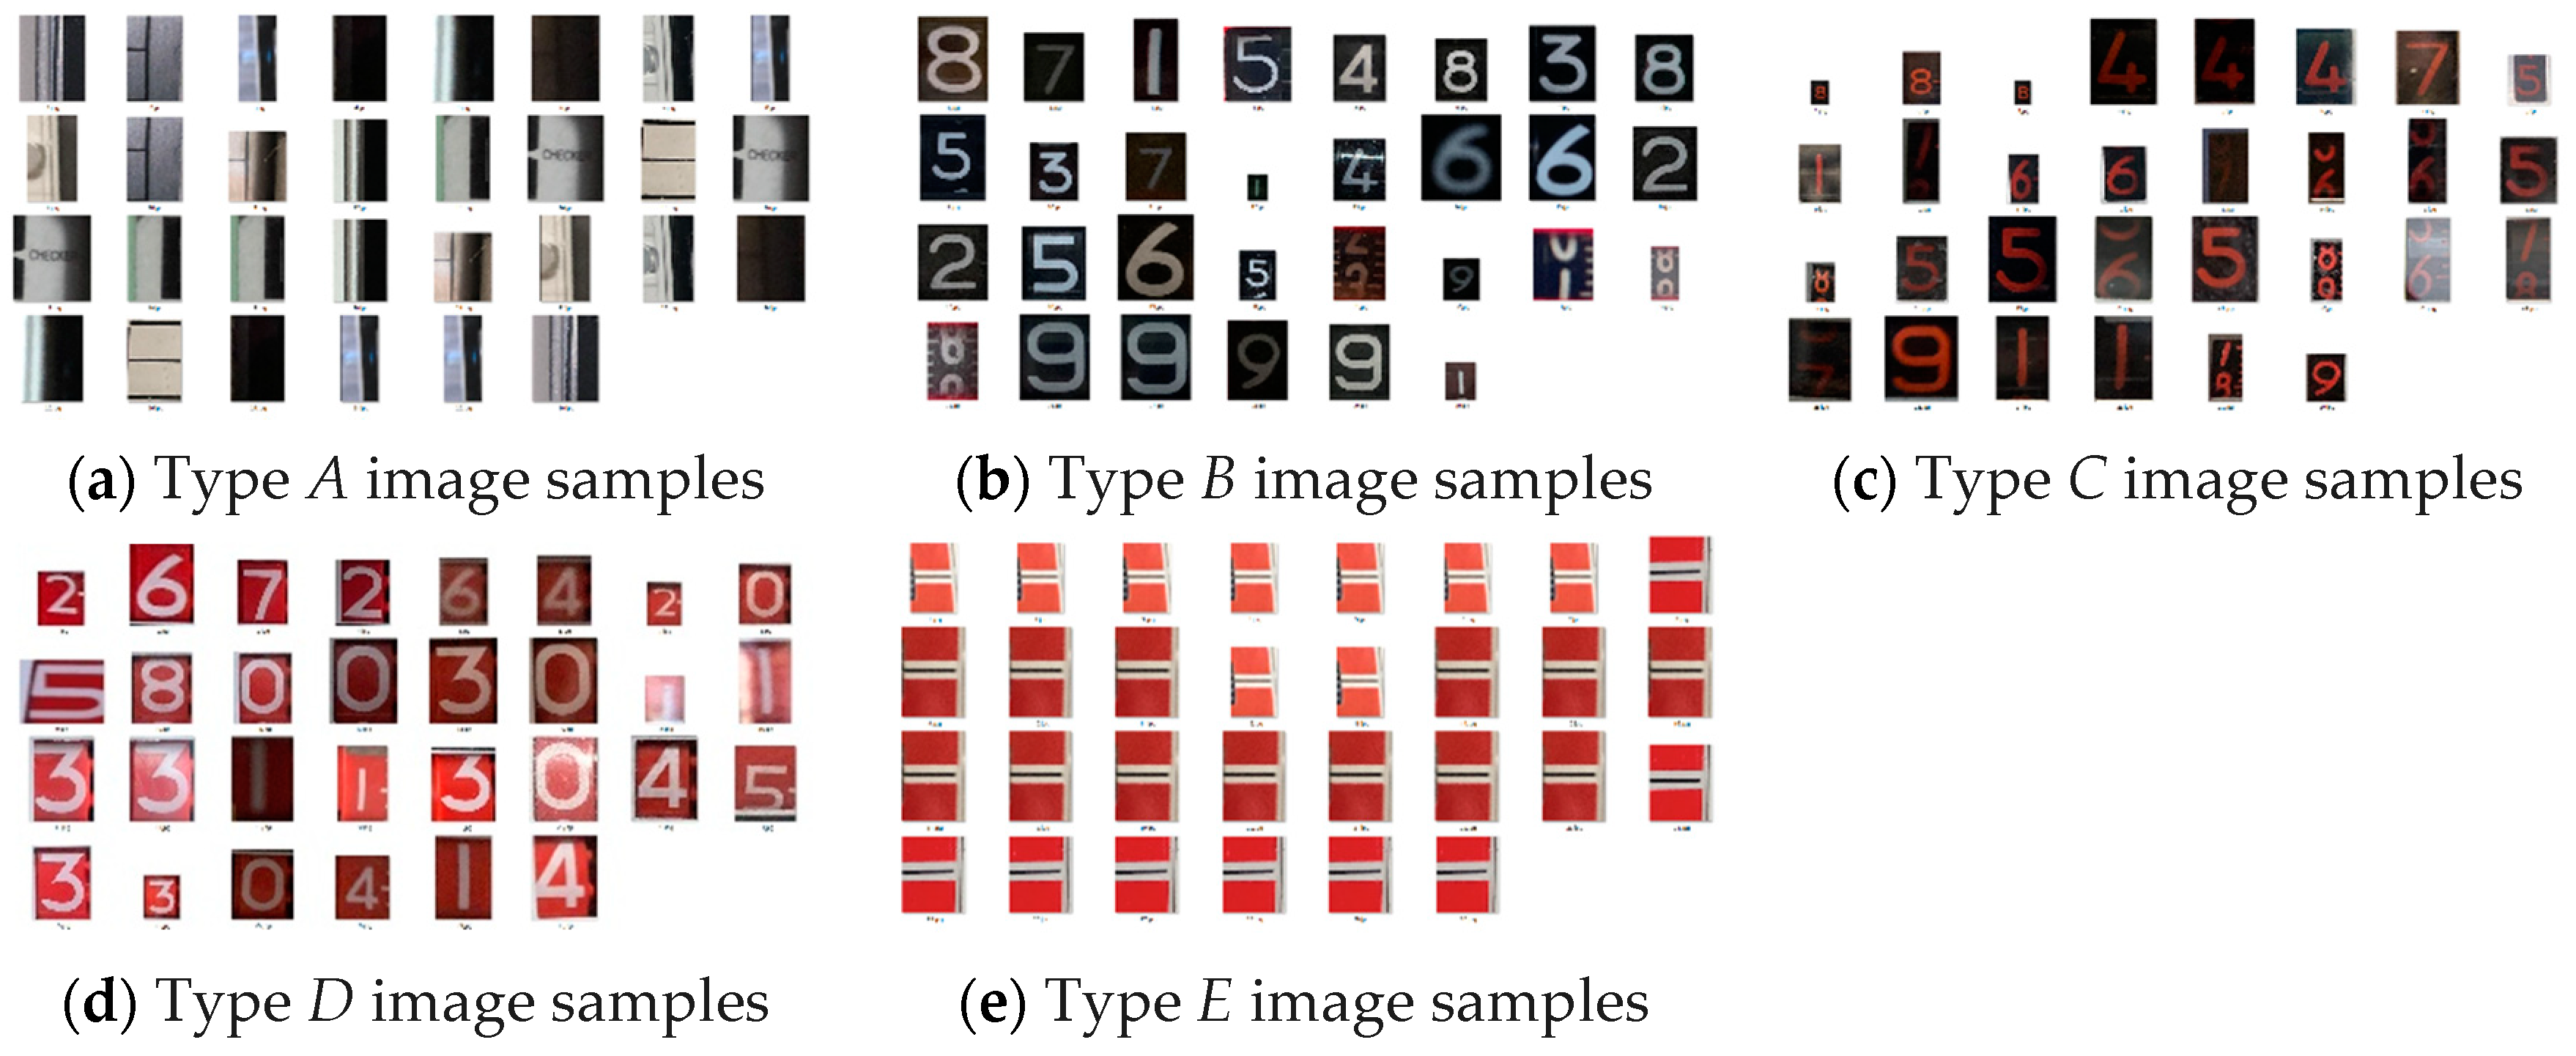
3.2. Types of Low Image Quality
- (1)
- Image Blur
- (2)
- Partial Reflection
- (3)
- Poor Exposure
3.3. Blurred Image Discrimination
3.3.1. Blurred Image Discrimination Algorithm
3.3.2. Non-Linear SVC Model
4. Digit Recognition
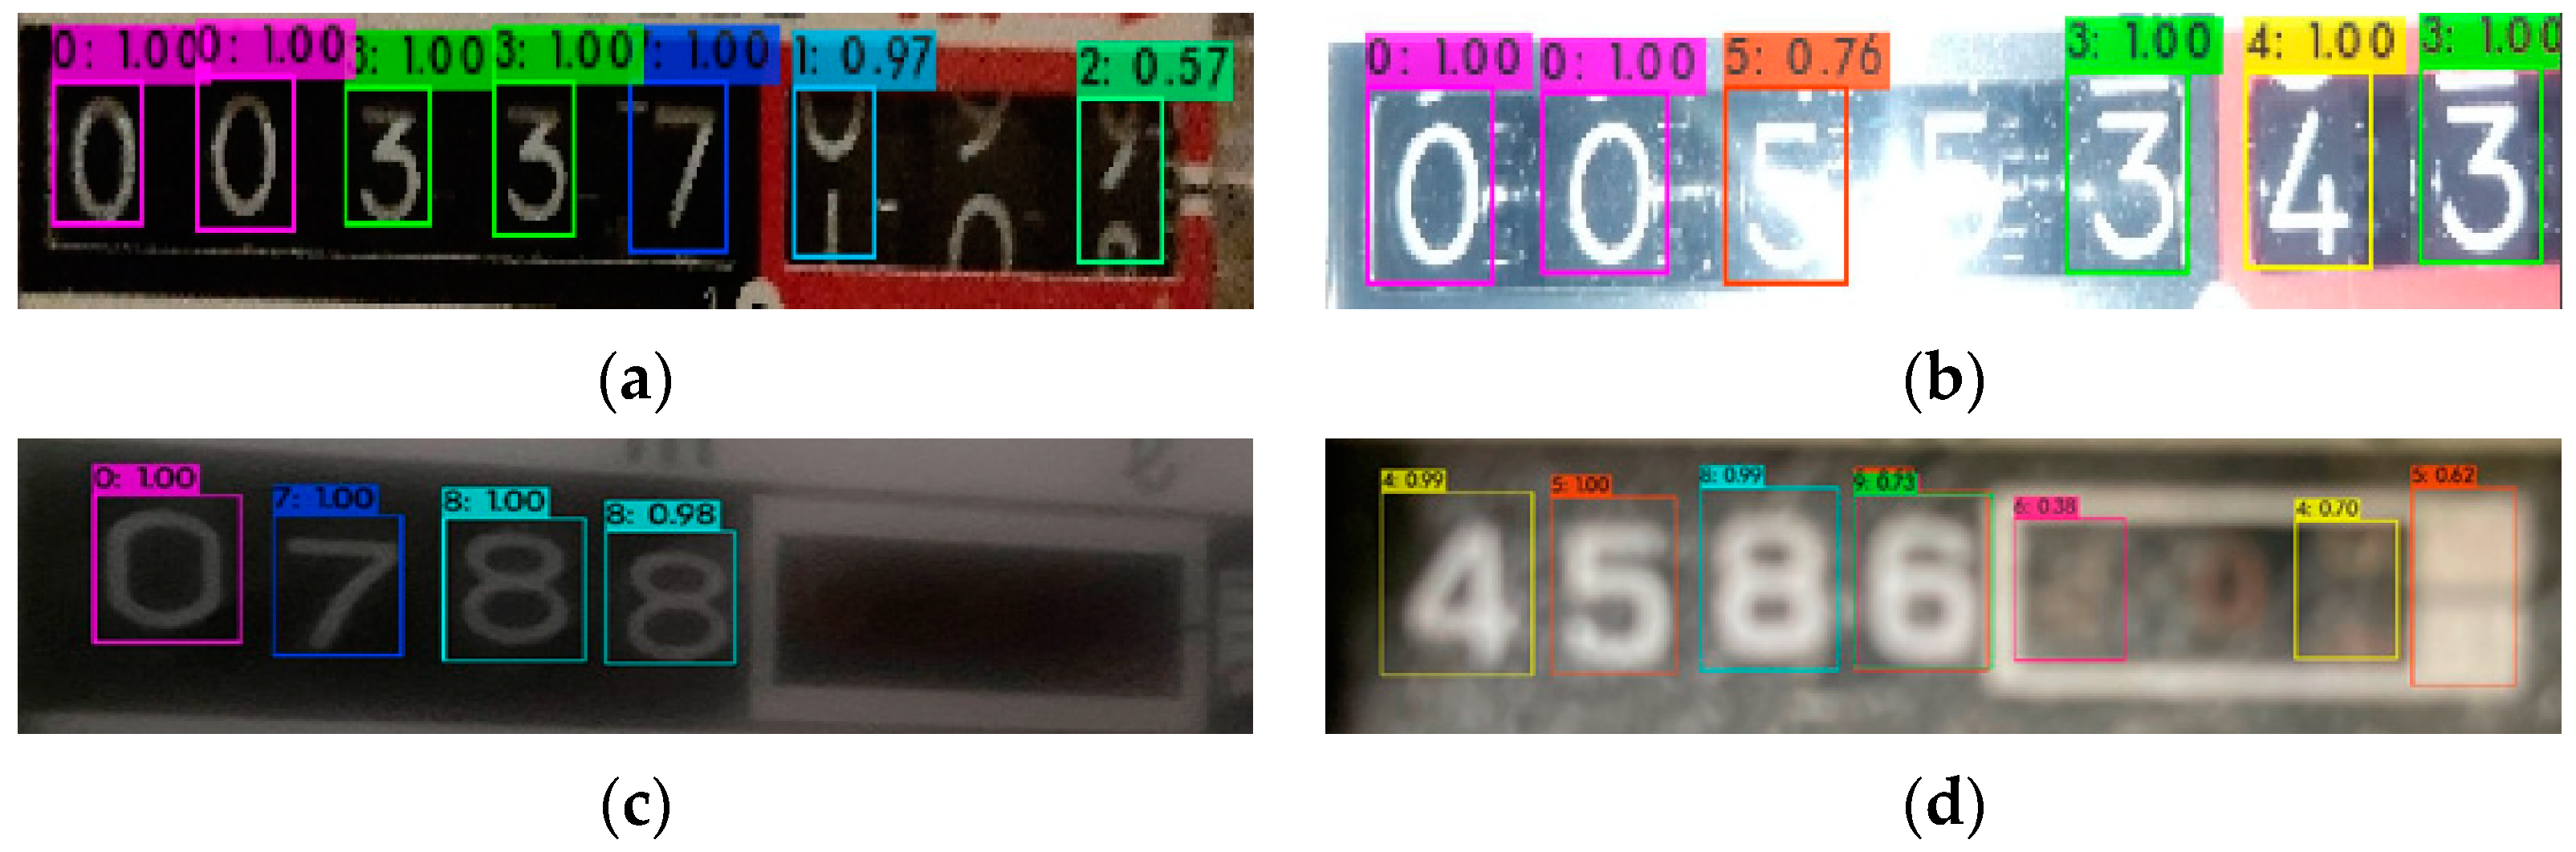
4.1. Digit Localization and Recognition
4.2. Training Dataset Construction
5. Missing Digit Detection and Correction
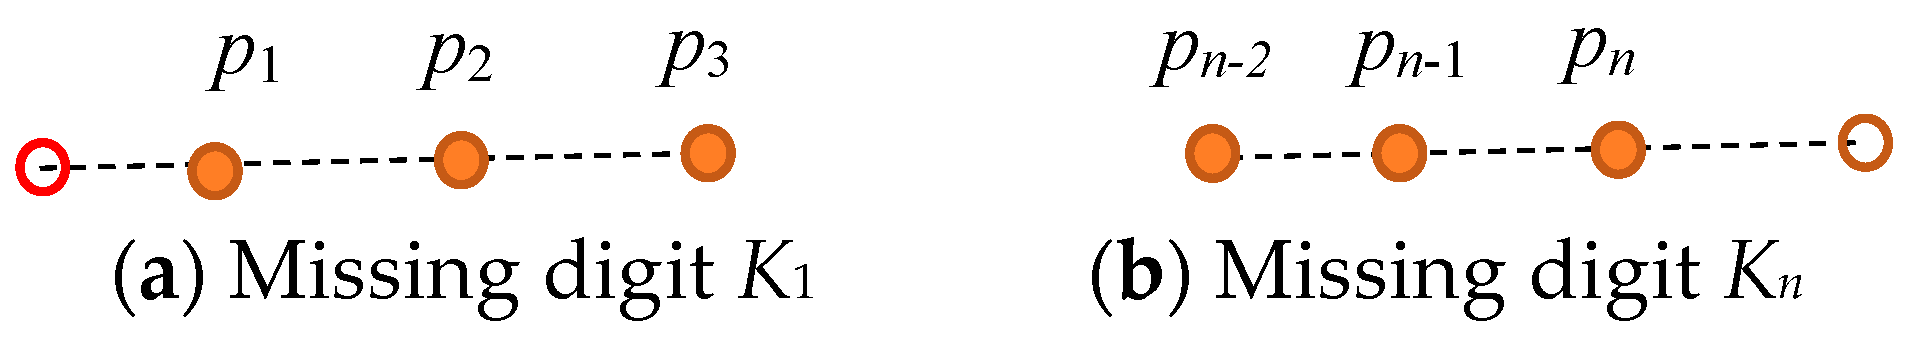
5.1. Identification and Localization of Missing Digits
5.2. Cross-Ratio
5.3. Missing Digit Detection
5.3.1. Filtering the Correct Bounding Boxes
- (1)
- Overlapping Bounding Boxes: More than one bounding box is included for the same digit. To address this, the bounding boxes overlapping with two or more other boxes are first eliminated, typically indicating that the boxes are oversized. For those overlapping with only one other bounding box, a new bounding box is defined by averaging the parameters of the two overlapping boxes, replacing the original boxes.
- (2)
- Non-Meter Digits: Given that meters often display many non-meter digits and text, it is essential to pre-remove these elements. Since meter digits are arranged horizontally, bounding boxes of meter digits have similar y, w, and h values, whereas the parameters of non-meter digit boxes are considered outliers and are thus eliminated.
- (3)
- Bounding Boxes with Low Confidence Scores: To ensure the recognized meter readings possess high robustness, bounding boxes with low confidence scores are eliminated. This is followed by processes to enhance their confidence scores by handling missing digits.
5.3.2. Types of Missing Bounding Boxes
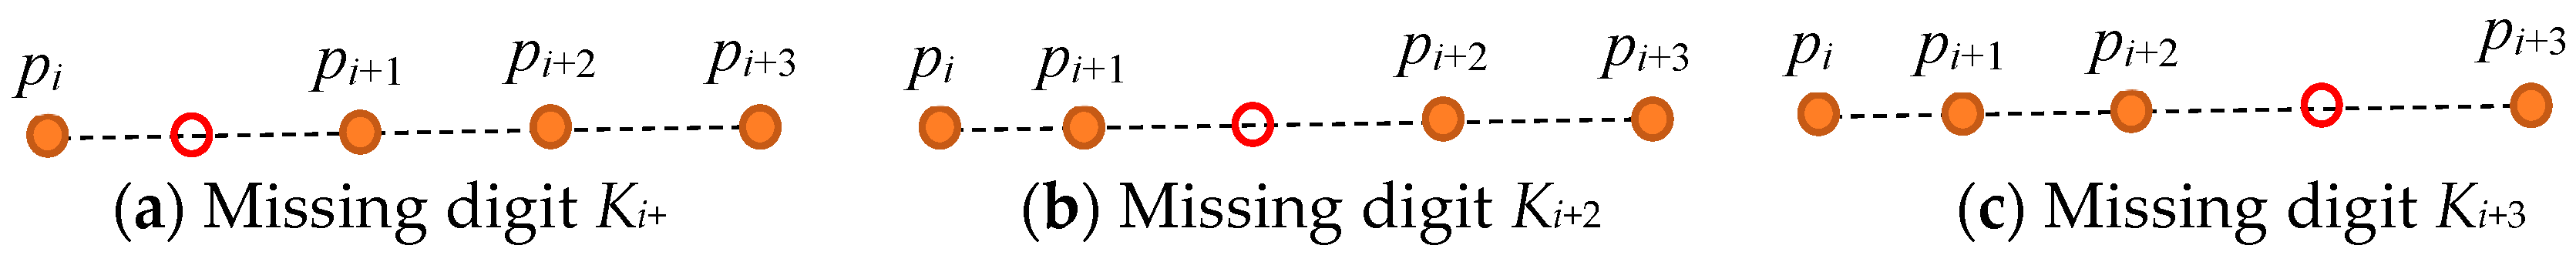
5.3.3. Cross-Ratio Feature of Bounding Boxes
- (A)
- No Missing Digits (find p1 to p8)
- (B)
- One Missing Digit (find p1 to p7)
- (a)
- The cross-ratio features from the third to the eighth rows are distinct, indicating that the types of digits missing between the second and seventh positions can be directly identified. Thus, L710 denotes that a missing digit can be determined from seven bounding boxes without involving boundary digits and does not require additional procedures.
- (b)
- The feature values of the second and ninth rows are identical because the seven obtained bounding boxes are consecutive, with no missing digits in between. Therefore, the corresponding L71S and L71E require a subsequent procedure for locating and confirming the starting and ending digits, which will be elaborated on in Section 5.3.4.
- (C)
- Two Missing Digits (find p1 to p6)
- (a)
- Missing digits do not include the first or eighth digits: This indicates that the missing digits do not appear on the instrument’s boundaries. The cross-ratio features for rows 10 to 24 in Table 3 are distinct, signifying that it can directly differentiate types with two digits missing between the second and seventh positions. Thus, L620 denotes that two missing digits can be determined from six bounding boxes without requiring subsequent boundary digit processing.
- (b)
- Missing digits include the first digit but not the second or eighth: This implies that one missing digit is at the start, with the other missing digit being one of the third to seventh digits. The cross-ratio features for rows 28 to 32 in Table 3 are distinct, indicating that it is possible to directly identify the presence of a missing digit among the third to sixth digits. Hence, L61S denotes that one missing digit can be determined from six bounding boxes, requiring a subsequent procedure for locating and confirming the starting boundary digit.
- (c)
- Missing digits include the eighth digit but not the first or seventh: This suggests that one missing digit is at the end, with the other missing digit being one of the second to sixth digits. The cross-ratio features for rows 33 to 37 in Table 3 are distinct, indicating that it is possible to directly identify the presence of a missing digit among the second to sixth digits. Thus, L61E denotes that one missing digit can be determined from six bounding boxes, necessitating a subsequent procedure for locating and confirming the ending boundary digit. Additionally, the cross-ratio features here are identical to those in (b), allowing for the identification of the two missing digits as either type (b) or (c) upon confirmation of the boundary digits.
- (d)
- Missing digits include the first and eighth digits: This indicates that the missing digits are the starting and ending digits, presenting the cross-ratio feature of row 25 in Table 3. Therefore, L60B denotes that six bounding boxes are consecutive without any missing digits, requiring further procedures for locating and confirming the starting and ending boundary digits.
- (e)
- Missing digits include the first and second digits: This results in a situation where six consecutive bounding boxes do not have any missing digits, as presented by the cross-ratio feature of row 26 in Table 3. Thus, L60S denotes that six bounding boxes are consecutive without any missing digits, similar to situation (d), requiring additional procedures for locating and confirming the first two consecutive starting digits.
- (f)
- Missing digits include the seventh and eighth digits: Similar to (d) and (e), this results in six consecutive bounding boxes without any missing digits, as indicated by the cross-ratio feature of row 27 in Table 3. Therefore, L60E denotes that six bounding boxes are consecutive without any missing digits, akin to situation (e), necessitating further procedures for locating and confirming the last two consecutive ending digits.
5.3.4. Locating and Confirming the Starting and Ending Digits
- (A)
- Locating the Starting Digit
- (B)
- Locating the Ending Digit
- (C)
- Confirmation of Meter Digits
5.3.5. Re-Processing of Missing Digits
5.3.6. Meter Reading Output
6. Experiment Results and Discussion
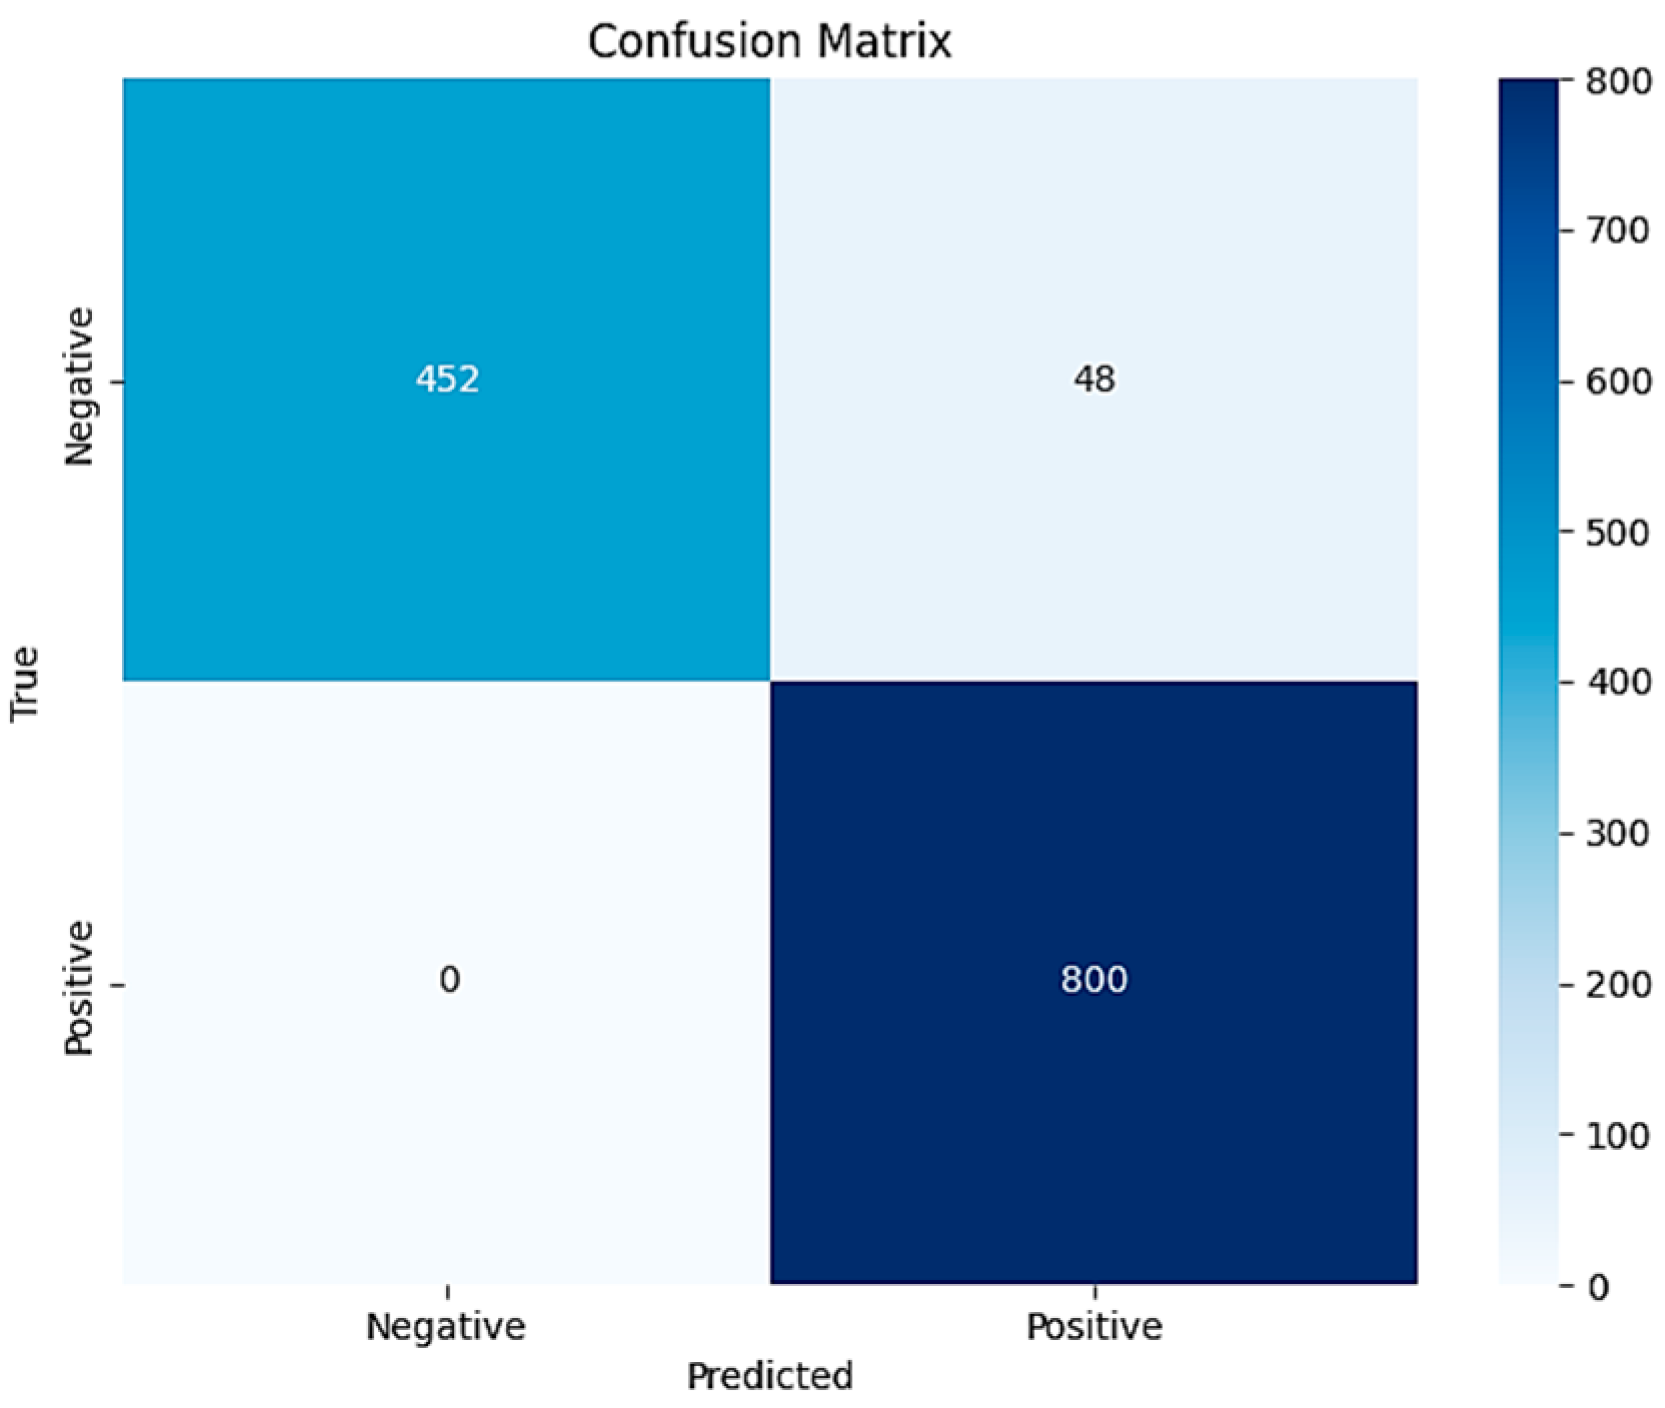
6.1. Experiment 1: Image Blur Discrimination
- (A)
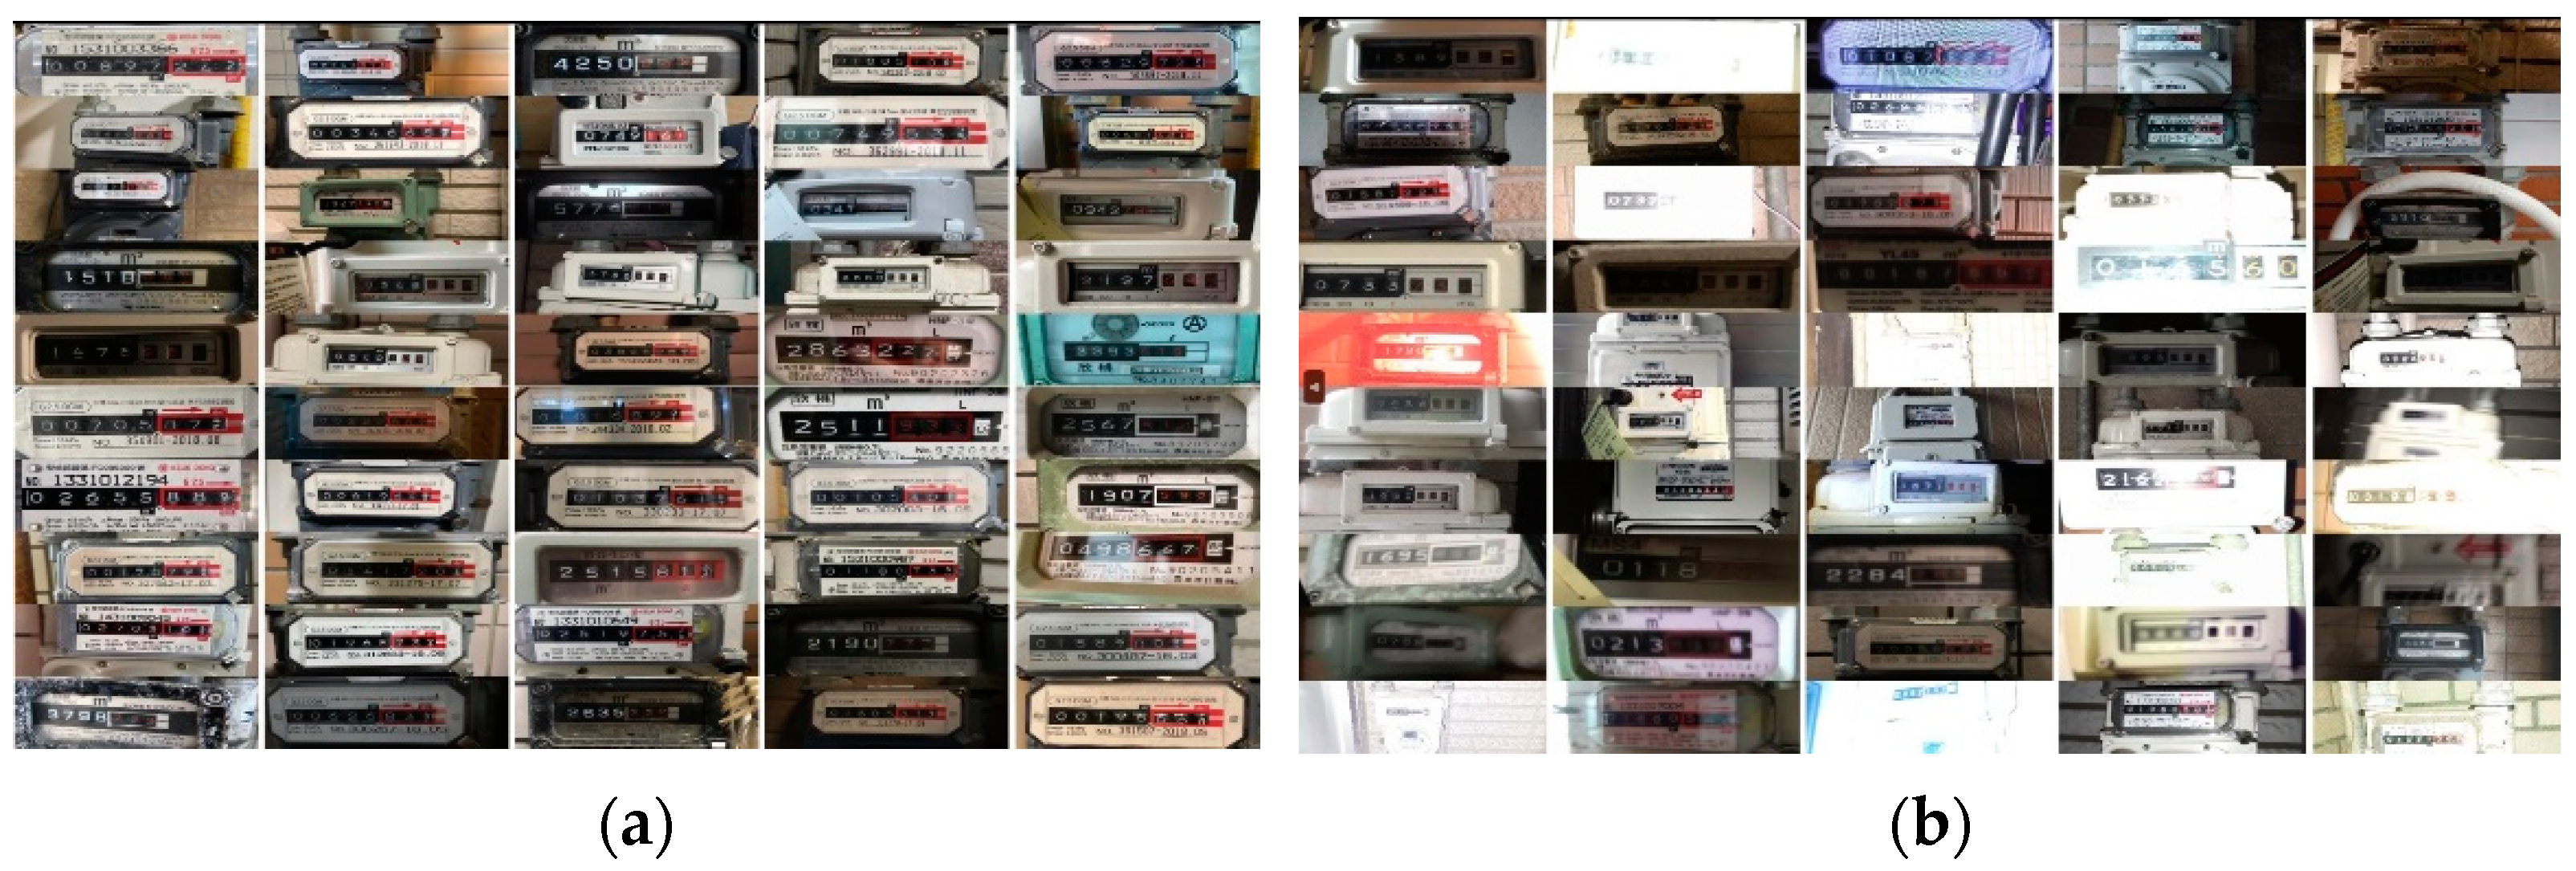
- Dataset
- (B)
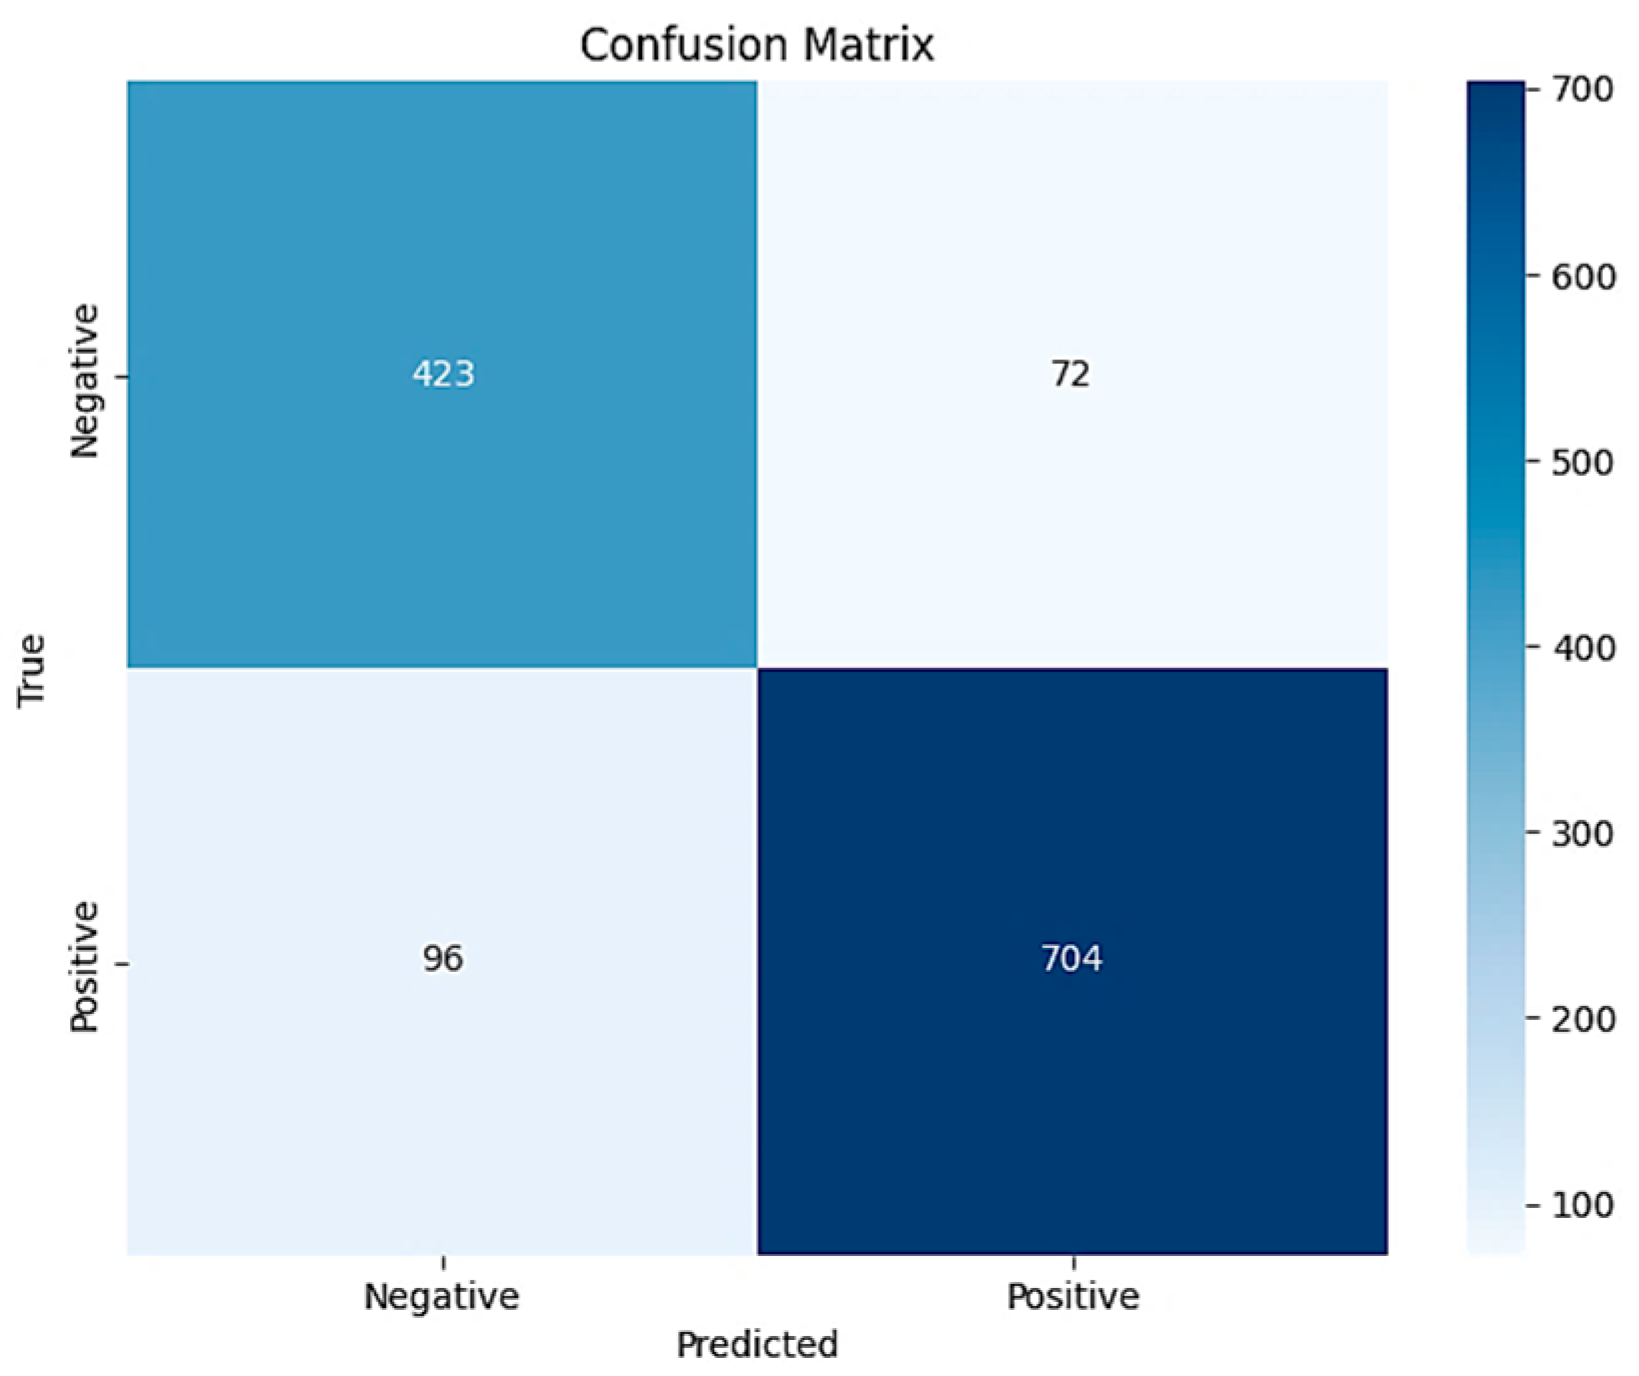
- Performance in Blurred Image Recognition
- (1)
- Accuracy: 87.03 ± 1.83% (with confidence interval) of all test samples were correctly classified. This relatively high accuracy demonstrates the model’s overall good recognition capability.
- (2)
- Precision: Indicates that among the samples predicted as correct by the model, 85.45% ± 0.98% were indeed correct. This means the model has a high certainty in making correct predictions, with a relatively low misjudgment rate.
- (3)
- Recall: The model predicted 81.50 ± 1.08% of all truly correct samples. This suggests that the model may have missed some samples that should have been correctly predicted.
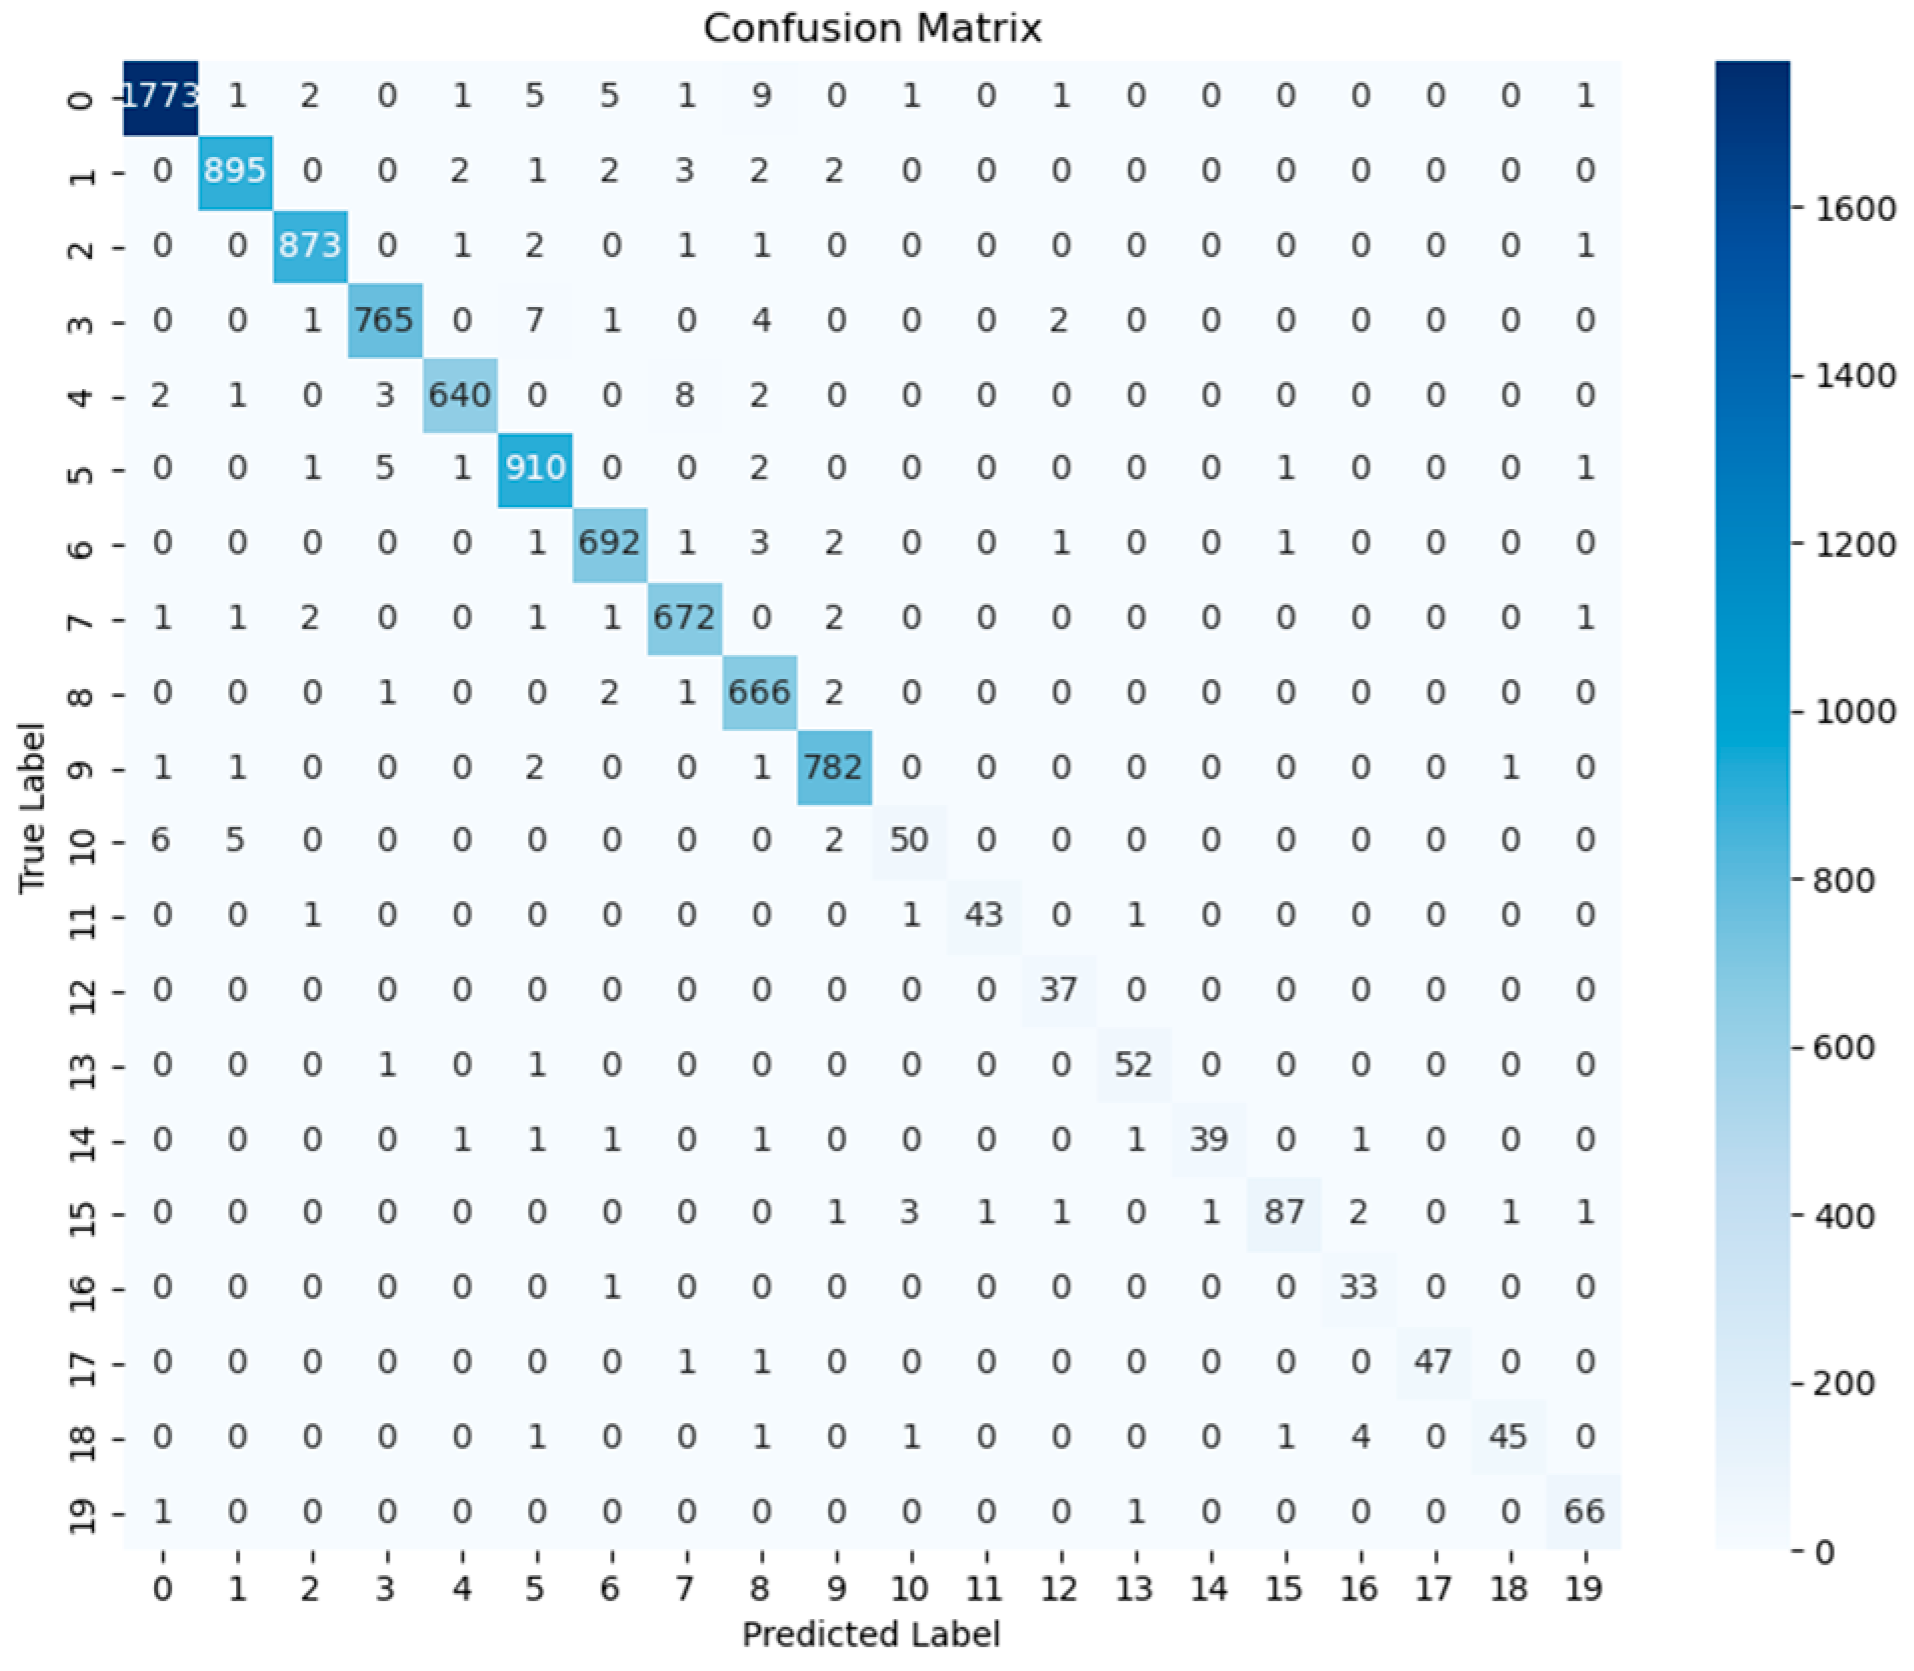
6.2. Experiment 2: Meter Digit Recognition
- (A)
- YOLOv5 Configuration
- (B)
- Results of Different Meter Digit Recognitions (Label 0–19)
- (C)
- Gas Meter Digit Recognition Results
- (1)
- Accuracy: Indicates that 6.31 ± 0.52% of all test samples were correctly classified. This relatively high accuracy demonstrates the model’s excellent overall recognition capability.
- (2)
- Precision: Indicates that among the samples predicted as correct by the model, 90.40 ± 0.82% were indeed correct. Although this precision rate is relatively high, there is still a gap compared to the accuracy rate, suggesting that the model may have produced false-positive results in some cases.
- (3)
- Recall: Indicates that the model successfully predicted all truly correct samples without missing any (100.00 ± 0.00%). This ideal recall rate shows the model’s excellent ability to cover all correct samples.
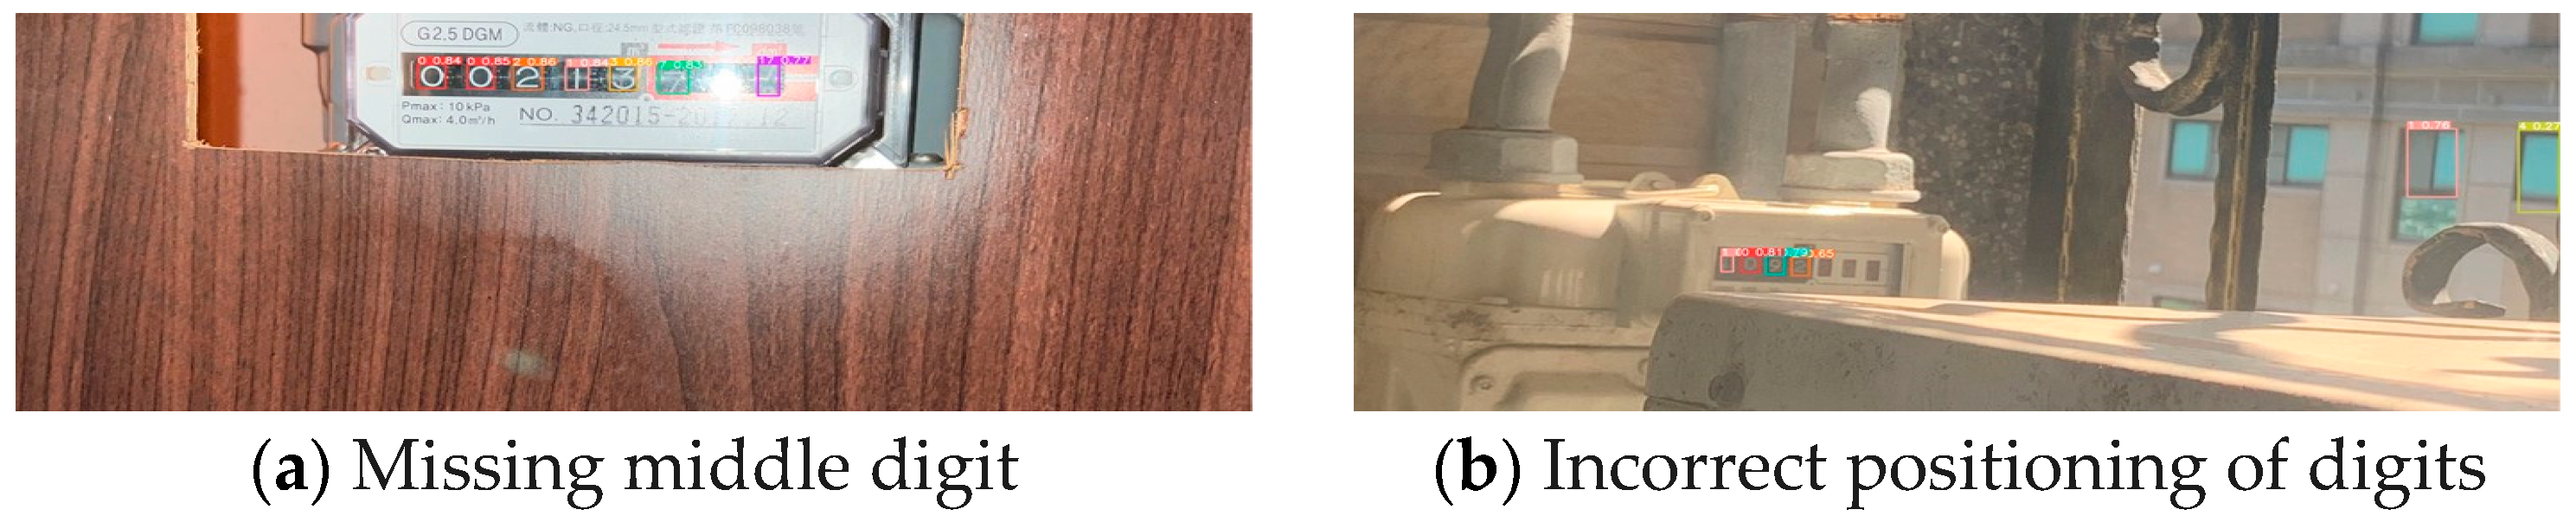
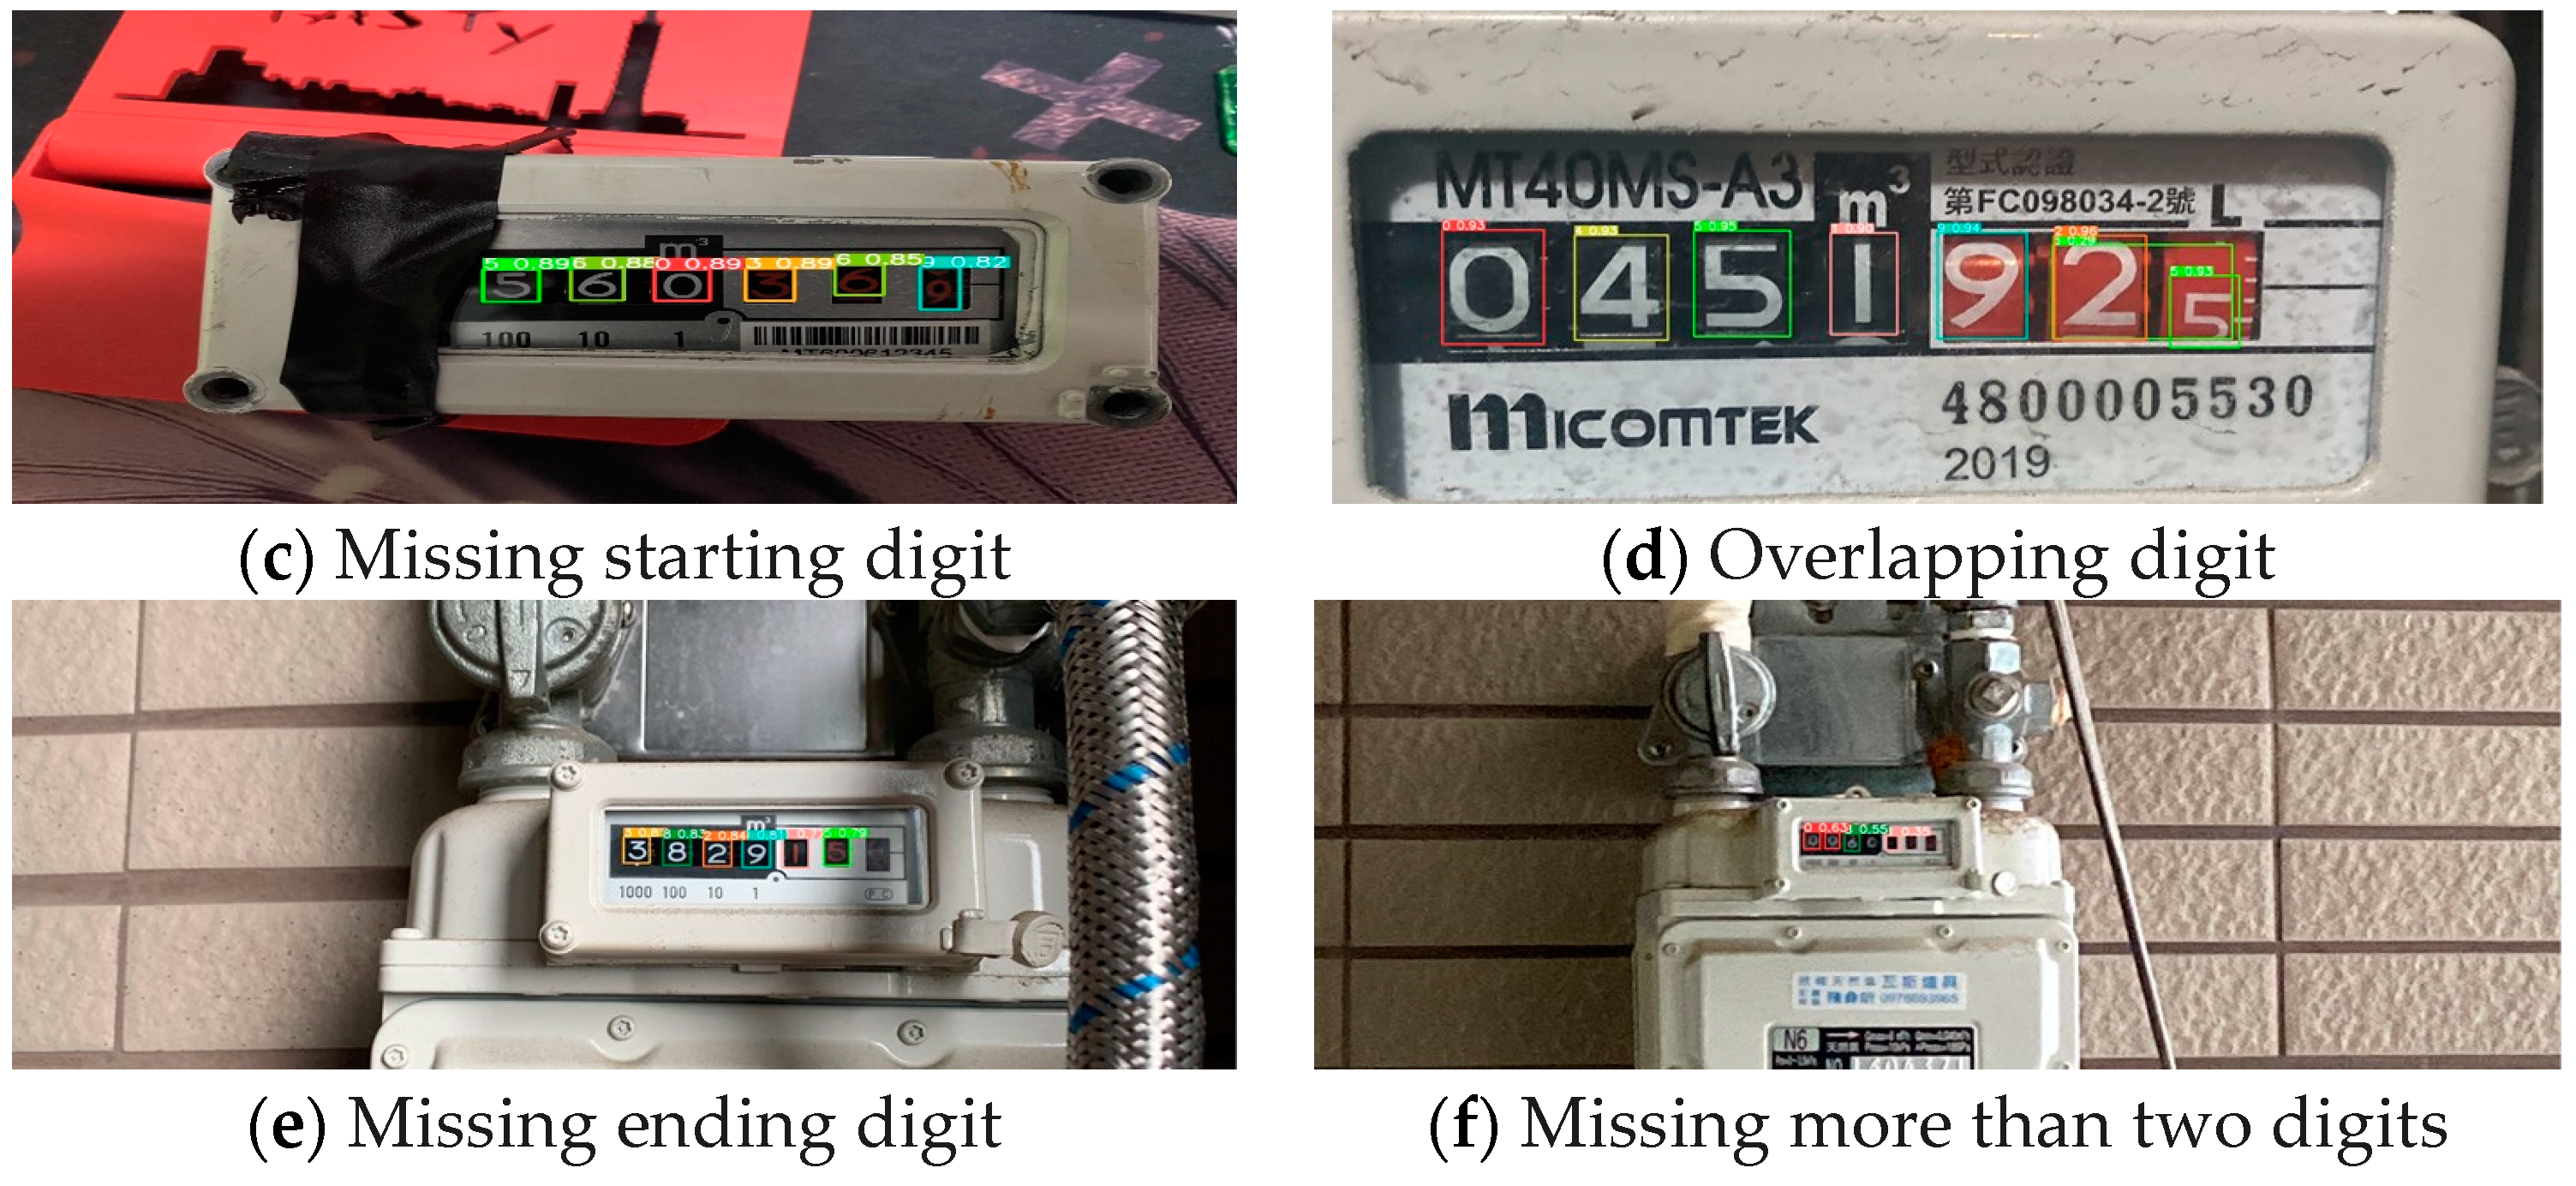
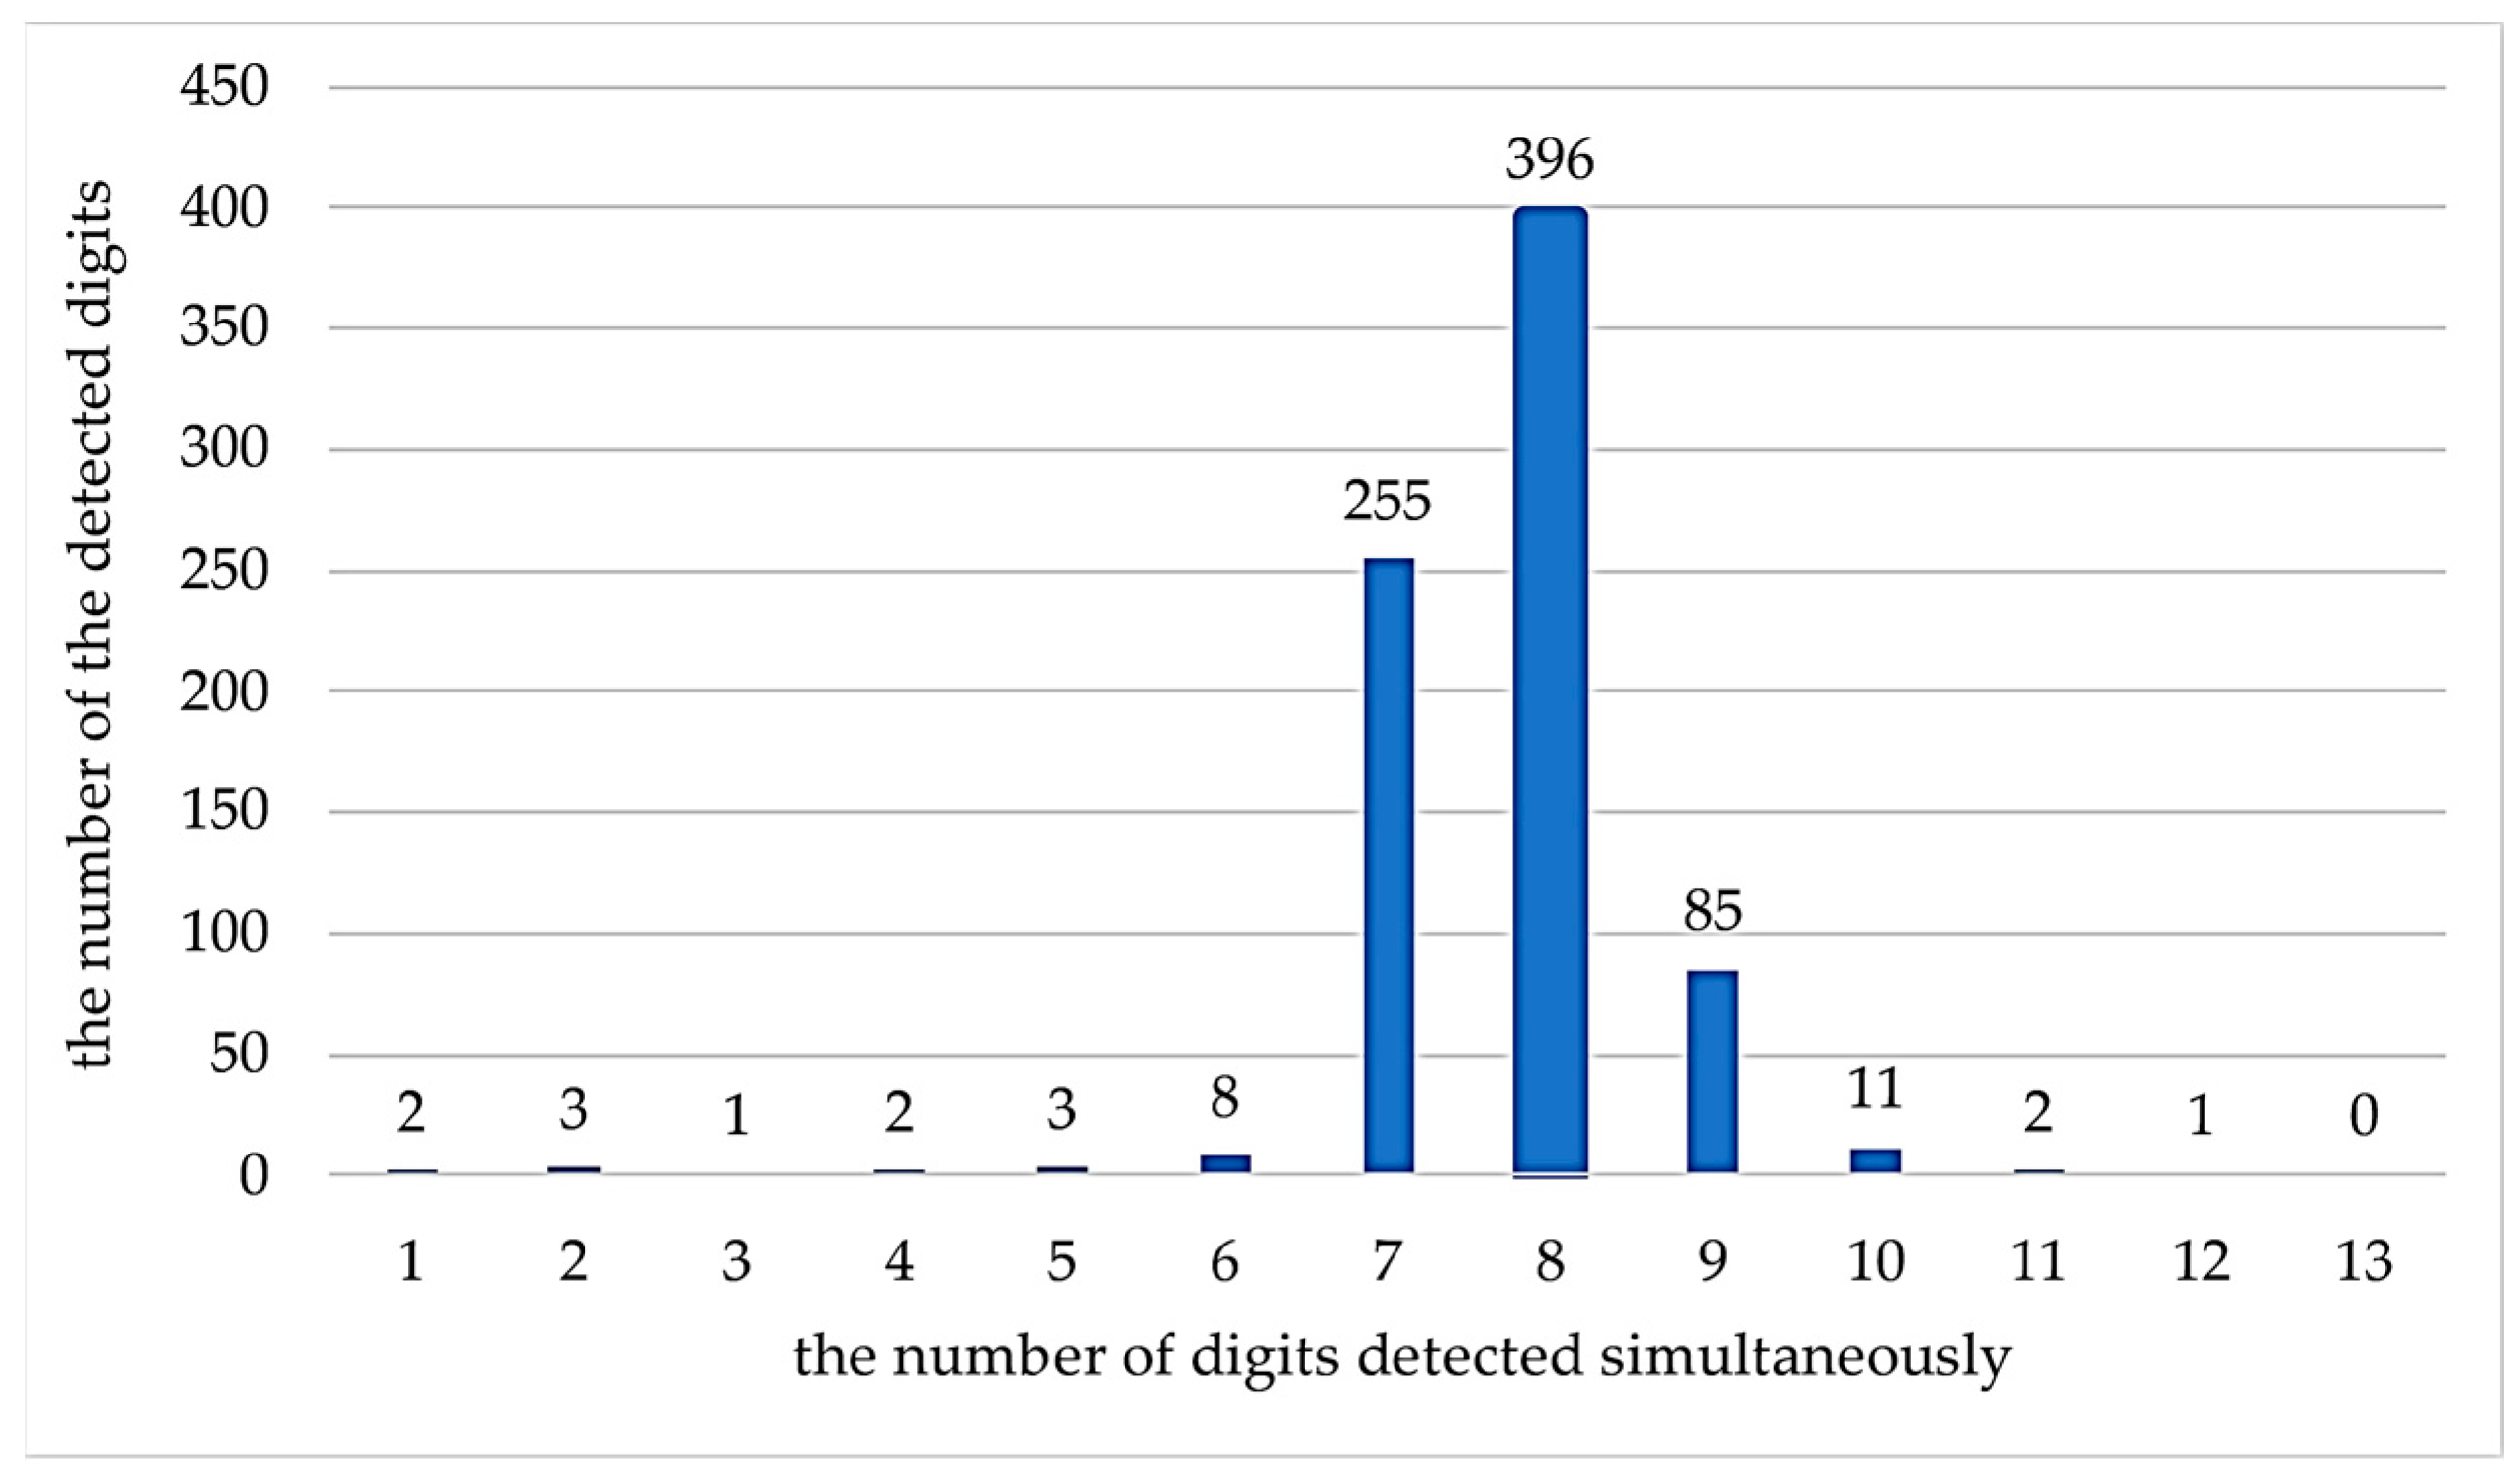
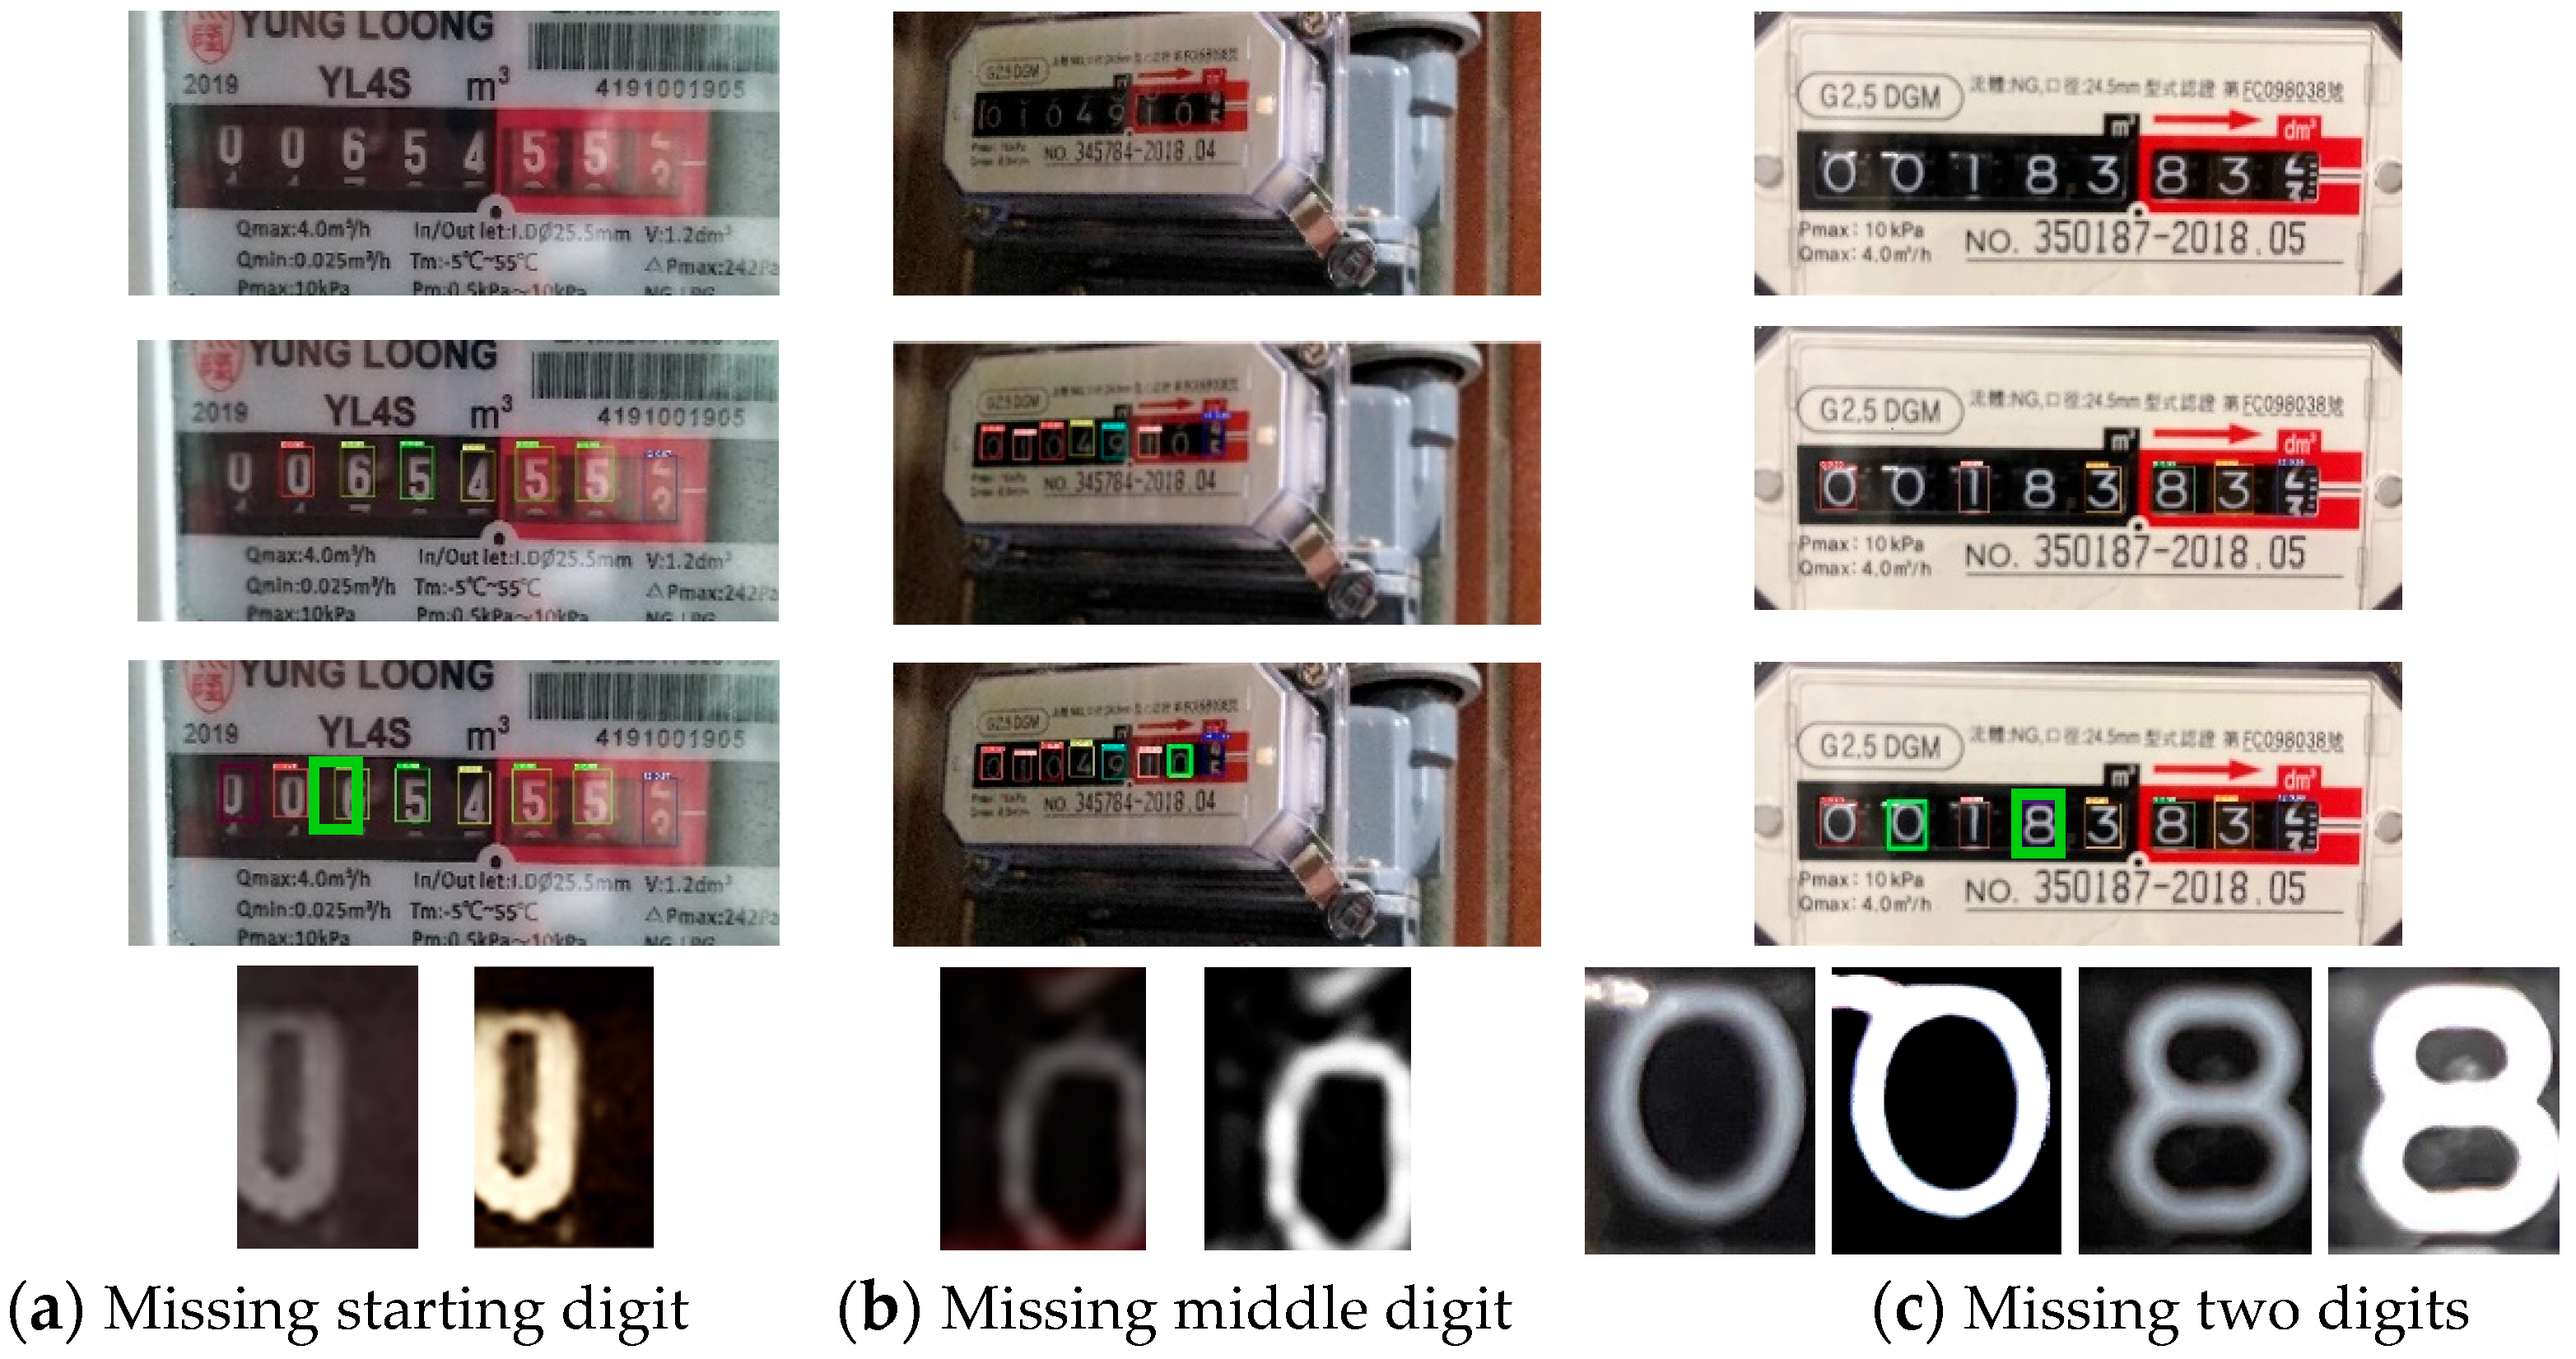
6.3. Experiment 3: Digit Misses and Recognition Correction
- (1)
- Error Analysis of YOLOv5 Digit Detection
- (2)
- Locating and Repairing Missing Digits
7. Conclusions
Author Contributions
Funding
Data Availability Statement
Acknowledgments
Conflicts of Interest
References
- Zhao, S.; Li, B.; Yuan, J.; Cui, G. Research on remote meter automatic reading based on computer vision. In Proceedings of the 2005 IEEE/PES Transmission & Distribution Conference & Exposition: Asia and Pacific, Dalian, China, 15–18 August 2005; pp. 1–4. [Google Scholar]
- Huang, X.; Nie, D.; Yong, H.E.; Wang, Q. Research on digital instrument automatic recognition technology of substation inspection robot. Mech. Electron. 2018, 36, 58–62. [Google Scholar]
- Elrefaei, L.A.; Bajaber, A.; Natheir, S.; AbuSanab, N.; Bazi, M. Automatic electricity meter reading based on image processing. In Proceedings of the 2015 IEEE Jordan Conference on Applied Electrical Engineering and Computing Technologies (AEECT), Amman, Jordan, 3–5 November 2015; pp. 1–5. [Google Scholar]
- He, Z.; He, Y.; Yang, Y.; Gao, M. A low-cost direct reading system for gas meter based on machine vision. In Proceedings of the 2017 12th IEEE Conference on Industrial Electronics and Applications (ICIEA), Siem Reap, Cambodia, 18–20 June 2017; pp. 1189–1194. [Google Scholar]
- Kashid, S.G.; Pardeshi, S.A. Intelligent water metering system: An image processing approach. In Proceedings of the 2014 First International Conference on Networks & Soft Computing (ICNSC2014), Guntur, India, 19–20 August 2014; pp. 289–294. [Google Scholar]
- Shu, D.; Ma, S.; Jing, C. Study of the automatic reading of watt meter based on image processing technology. In Proceedings of the 2nd IEEE Conference Industry Electron Applications, Harbin, China, 23–25 May 2007; pp. 2214–2217. [Google Scholar]
- Oliveira, D.M.; Cruz, R.D.S.; Bensebaa, K. Automatic numeric characters’ recognition of kilowatt-hour meter. In Proceedings of the 5th International Conference on Signal Image Technology Internet Based Systems, Marrakesh, Morocco, 29 November–3 December 2009; pp. 107–111. [Google Scholar]
- Rodríguez, M.; Berdugo, G.; Jabba, D.; Calle, M.; Jimeno, M. HD-MR: A new algorithm for number recognition in electrical meters. Turk. J. Electr. Eng. Comput. Sci. 2014, 22, 87–96. [Google Scholar] [CrossRef]
- Li, C.; Su, Y.; Yuan, R.; Chu, D.; Zhu, J. Light-weight spliced convolution network-based automatic water meter reading in smart city. IEEE Access 2019, 7, 174359–174367. [Google Scholar] [CrossRef]
- G’omez, L.; Rusinol, M.; Karatzas, D. Cutting Sayre’s knot: Reading scene text without segmentation. In Proceedings of the 13th IAPR International Workshop Document Analysis Systems (D.A.S.), Vienna, Austria, 24–27 April 2018; pp. 97–102. [Google Scholar]
- Chen, G.; Zifeng, H.U.; Zheng, C. Fast recognition algorithm of digital instrument numbers based on feature detection. China Test 2019, 45, 146–150. [Google Scholar]
- Laroca, R.; Barroso, V.; Diniz, M.A.; Gonçalves, G.R.; Schwartz, W.R.; Menotti, D. Convolutional neural network for automatic meter reading. J. Electron. Imaging 2019, 28, 013023. [Google Scholar] [CrossRef]
- Son, C.; Park, S.; Lee, J.; Paik, J. Deep learning-based number detection and recognition for gas meter reading. IEEE Trans. Smart Process. Comput. 2019, 8, 367–372. [Google Scholar] [CrossRef]
- Yang, F.; Jin, L.; Lai, S.; Gao, X.; Li, Z. Fully convolutional sequence recognition network for water meter number reading. IEEE Access 2019, 7, 11679–11687. [Google Scholar] [CrossRef]
- Edward, V.C.P. Support vector machine based automatic electric meter reading system. In Proceedings of the IEEE International Conference on Computational Intelligence and Computing Research, Tamilnadu, India, 26–28 December 2013; pp. 1–5. [Google Scholar]
- Sharma, A.K.; Kim, K.K. Lightweight CNN based meter digit recognition. J. Sens. Sci. Technol. 2021, 30, 15–19. [Google Scholar] [CrossRef]
- Agrawal, A.; Jain, S.; Deep, V.; Sharma, P.; Mishra, S. Meter reading using O.C.R. for comfort and cost optimization. In Proceedings of the 2021 5th International Conference on Information Systems and Computer Networks (ISCON), Mathura, India, 22–23 October 2021; pp. 1–4. [Google Scholar]
- Naim, A.; Aaroud, A.; Akodadi, K.; El Hachimi, C. A fully AI-based system to automate water meter data collection in Morocco country. Array 2021, 10, 1–15. [Google Scholar] [CrossRef]
- Mahatya, K.J.B.; Jati, F.W.; Irawan, B.; Hasibuan, F.C. Random forest implementation in prepaid electric meter recognition. J. Comput. Eng. Prog. Appl. Technol. 2022, 1, 33–40. [Google Scholar] [CrossRef]
- Liao, J.Y.; Hsieh, J.W.; Ma, C.M. Automatic meter reading based on bi-fusion M.S.P. network and carry-out rechecking. IEEE Access 2022, 10, 96710–96719. [Google Scholar] [CrossRef]
- Nigar, N.; Muhammad Faisal, H.; Kashif Shahzad, M.; Islam, S.; Oki, O. An offline image auditing system for legacy meter reading systems in developing countries: A machine learning approach. J. Electr. Comput. Eng. 2022, 2022, 4543530. [Google Scholar] [CrossRef]
- Hsu, T.C.; Tsai, Y.H.; Chang, D.M. The vision-based data reader in IoT system for smart factory. Appl. Sci. 2022, 12, 6586. [Google Scholar] [CrossRef]
- Xiu, H.; He, J.; Zhang, X.; Wang, L.; Qi, Y. HRC-mCNNs: A hybrid regression and classification multibranch CNNs for automatic meter reading with smart shell. IEEE Internet Things J. 2022, 9, 25752–25766. [Google Scholar] [CrossRef]
- Concio, M.L.W.; Bernardo, F.S.; Opulencia, J.M.; Ortiz, G.L.; Pedrasa, J.R.I. Automated water meter reading through image recognition. In Proceedings of the TENCON 2022—2022 IEEE Region 10 Conference (TENCON), Hong Kong, China, 1–4 November 2022; pp. 1–6. [Google Scholar]
- Li, W.; Wang, S.; Ullah, I.; Zhang, X.; Duan, J. Multiple attention-based encoder-decoder networks for gas meter character recognition. Sci. Rep. 2022, 12, 10371. [Google Scholar] [CrossRef] [PubMed]
- Chong, Y.J.; Chua, K.H.; Babrdel, M.; Hau, L.C.; Wang, L. Deep learning and optical character recognition for digitization of meter reading. In Proceedings of the 2022 IEEE 12th Symposium on Computer Applications & Industrial Electronics (ISCAIE), Virtual Conference, 21–22 May 2022; pp. 7–12. [Google Scholar]
- Filinger, A. Improving Automatic Meter Reading Using Data Generated from Unpaired Image-to-Image Translation. Doctoral Dissertation, Hochschule für Angewandte Wissenschaften Landshut, Landshut, Germany, 2022. [Google Scholar]
- Imran, M.; Anwar, H.; Tufail, M.; Khan, A.; Khan, M.; Ramli, D.A. Image-based automatic energy meter reading using deep learning. Comput. Mater. Contin. 2023, 74, 203–216. [Google Scholar] [CrossRef]
- Carvalho, R.; Melo, J.; Graça, R.; Santos, G.; Vasconcelos, M.J.M. Deep learning-powered system for real-time digital meter reading on edge devices. Appl. Sci. 2023, 13, 2315. [Google Scholar] [CrossRef]
- Sun, L.; Yuan, Y.; Qiao, S.; Qi, R. Detection of water meter digits based on improved faster R-CNN. J. Comput. Commun. 2024, 12, 1–13. [Google Scholar] [CrossRef]
- Zhao, S.; Lu, Q.; Zhang, C.; Ahn, C.K.; Chen, K. Effective recognition of word-wheel water meter readings for smart urban infrastructure. IEEE Internet Things J. 2024, 11, 17283–17291. [Google Scholar] [CrossRef]
- Liu, R.; Li, Z.; Jia, J. Image partial blur detection and classification. In Proceedings of the 2008 IEEE Conference on Computer Vision and Pattern Recognition, Anchorage, AK, USA, 23–28 June 2008; pp. 1–8. [Google Scholar]


| Reference | Blurred Images | Persp. Distortion | Partial Reflection | Poor Lighting | Missing Digits | Interm. Digits | Recognition Method |
|---|---|---|---|---|---|---|---|
| [15] (2013) | Y | SVM | |||||
| [10] (2017) | Y | Image analysis | |||||
| [13] (2019) | YOLO v3 | ||||||
| [14] (2019) | Y | FCSRN network | |||||
| [16] (2021) | Lightweight DNN | ||||||
| [17] (2021) | Image analysis | ||||||
| [12] (2021) | Y | Y | Y | YOLOv4 | |||
| [18] (2021) | Y | Y | CNN | ||||
| [19] (2022) | Y | Random forest | |||||
| [20] (2022) | Y | BIF-MSP network | |||||
| [21] (2022) | YOLOv5 | ||||||
| [22] (2022) | Y | Lightweight CNN | |||||
| [23] (2022) | Y | Y | Y | HRC-mCNN | |||
| [24] (2022) | Faster RCNN | ||||||
| [25] (2022) | CBAM network | ||||||
| [26] (2022) | Y | Y | MobileNet V2 | ||||
| [27] (2022) | CycleGAN | ||||||
| [28] (2023) | Y | Y | YOLOv3 | ||||
| [29] (2023) | MobileNet V2 | ||||||
| [30] (2024) | Y | Faster-RCNN | |||||
| [31] (2024) | Y | Y | Y | UNet + CNN | |||
| Our | Y | Y | Y | Y | Y | Y | YOLOv5 |
| Labels | 0 | 1 | 2 | 3 | 4 | 5 | 6 | 7 | 8 | 9 |
| Examples |  |  |  |  |  |  |  |  |  |  |
| Labels | 10 | 11 | 12 | 13 | 14 | 15 | 16 | 17 | 18 | 19 |
| Examples |  |  |  |  |  |  |  |  |  |  |
| n | Handling Procedure | CR1 | CR2 | CR3 | CR4 | CR5 | Missing Digits | Confirmation Procedure |
|---|---|---|---|---|---|---|---|---|
| 8 | L80B | 4/3 | 4/3 | 4/3 | 4/3 | 4/3 | No | |
| 7 | L71S | 4/3 | 4/3 | 4/3 | 4/3 | 1 | S | |
| L710 | 3/4 | 4/3 | 4/3 | 4/3 | 2 | |||
| 9/8 | 3/4 | 4/3 | 4/3 | 3 | ||||
| 3/2 | 9/8 | 3/4 | 4/3 | 4 | ||||
| 4/3 | 3/2 | 9/8 | 3/4 | 5 | ||||
| 4/3 | 4/3 | 3/2 | 9/8 | 6 | ||||
| 4/3 | 4/3 | 4/3 | 3/2 | 7 | ||||
| L71E | 4/3 | 4/3 | 4/3 | 4/3 | 8 | E | ||
| 6 | L620 | 8/5 | 4/3 | 4/3 | 2, 3 | |||
| 12/10 | 6/4 | 4/3 | 2, 4 | |||||
| 9/5 | 9/8 | 6/4 | 2, 5 | |||||
| 6/4 | 6/4 | 9/8 | 2, 6 | |||||
| 6/4 | 4/3 | 6/4 | 2, 7 | |||||
| 16/15 | 8/5 | 4/3 | 3, 4 | |||||
| 12/10 | 12/10 | 6/4 | 3, 5 | |||||
| 9/8 | 9/5 | 9/8 | 3, 6 | |||||
| 9/8 | 6/4 | 6/4 | 3, 7 | |||||
| 8/5 | 16/15 | 8/5 | 4, 5 | |||||
| 6/4 | 12/10 | 12/10 | 4, 6 | |||||
| 6/4 | 9/8 | 9/5 | 4, 7 | |||||
| 4/3 | 8/5 | 16/15 | 5, 6 | |||||
| 4/3 | 6/4 | 12/10 | 5, 7 | |||||
| 4/3 | 4/3 | 8/5 | 6, 7 | |||||
| L60B | 4/3 | 4/3 | 4/3 | 1, 8 | S, E | |||
| L60S | 4/3 | 4/3 | 4/3 | 1, 2 | S | |||
| L60E | 4/3 | 4/3 | 4/3 | 7, 8 | E | |||
| L61S | 6/4 | 4/3 | 4/3 | 1, 3 | S | |||
| 9/8 | 6/4 | 4/3 | 1, 4 | S | ||||
| 6/4 | 9/8 | 6/4 | 1, 5 | S | ||||
| 4/3 | 6/4 | 9/8 | 1, 6 | S | ||||
| 4/3 | 4/3 | 6/4 | 1, 7 | S | ||||
| L61E | 6/4 | 4/3 | 4/3 | 2, 8 | E | |||
| 9/8 | 6/4 | 4/3 | 3, 8 | E | ||||
| 6/4 | 9/8 | 6/4 | 4, 8 | E | ||||
| 4/3 | 6/4 | 9/8 | 5, 8 | E | ||||
| 4/3 | 4/3 | 6/4 | 6, 8 | E |
| Setting | Value |
|---|---|
| Weights | yolov5x.pt |
| Config File (cfg) | models/yolov5x.yaml |
| Data File | data\mydata.yaml |
| Hyperparameters | |
| Learning Rate | lr0: 0.01 |
| Momentum | momentum: 0.937 |
| Mosaic Augmentation | mosaic: 1.0 |
| Mixup Augmentation | mixup: 0.0 |
| Number of Epochs | 100 |
| Batch Size | 2 |
| Image Size (imgsz) | 640 |
| Label | 0 | 1 | 2 | 3 | 4 | 5 | 6 | 7 | 8 | 9 |
| Correct | 1773 | 895 | 873 | 765 | 640 | 910 | 692 | 672 | 666 | 782 |
| Samples | 1800 | 907 | 879 | 780 | 656 | 921 | 701 | 681 | 672 | 788 |
| Accuracy | 98% | 98% | 99% | 98% | 97% | 98% | 98% | 98% | 99% | 99% |
| AP | 0.989 | 0.991 | 0.993 | 0.983 | 0.976 | 0.991 | 0.987 | 0.987 | 0.991 | 0.994 |
| Label | 10 | 11 | 12 | 13 | 14 | 15 | 16 | 17 | 18 | 19 |
| Correct | 50 | 43 | 37 | 52 | 39 | 87 | 33 | 47 | 45 | 66 |
| Samples | 63 | 46 | 37 | 54 | 45 | 98 | 34 | 49 | 53 | 68 |
| Accuracy | 79% | 93% | 100% | 96% | 86% | 88% | 97% | 95% | 84% | 97% |
| AP | 0.877 | 0.935 | 1 | 0.963 | 0.867 | 0.888 | 1 | 0.959 | 0.9 | 0.97 |
| mAP | mAP ≈ 0.976 | |||||||||
Disclaimer/Publisher’s Note: The statements, opinions and data contained in all publications are solely those of the individual author(s) and contributor(s) and not of MDPI and/or the editor(s). MDPI and/or the editor(s) disclaim responsibility for any injury to people or property resulting from any ideas, methods, instructions or products referred to in the content. |
© 2024 by the authors. Licensee MDPI, Basel, Switzerland. This article is an open access article distributed under the terms and conditions of the Creative Commons Attribution (CC BY) license (https://creativecommons.org/licenses/by/4.0/).
Share and Cite
Huang, J.-H.; Chen, Y.-H.; Tsai, Y.-L. Utilizing Cross-Ratios for the Detection and Correction of Missing Digits in Instrument Digit Recognition. Mathematics 2024, 12, 1669. https://doi.org/10.3390/math12111669
Huang J-H, Chen Y-H, Tsai Y-L. Utilizing Cross-Ratios for the Detection and Correction of Missing Digits in Instrument Digit Recognition. Mathematics. 2024; 12(11):1669. https://doi.org/10.3390/math12111669
Chicago/Turabian StyleHuang, Jui-Hua, Yong-Han Chen, and Yen-Lung Tsai. 2024. "Utilizing Cross-Ratios for the Detection and Correction of Missing Digits in Instrument Digit Recognition" Mathematics 12, no. 11: 1669. https://doi.org/10.3390/math12111669
APA StyleHuang, J.-H., Chen, Y.-H., & Tsai, Y.-L. (2024). Utilizing Cross-Ratios for the Detection and Correction of Missing Digits in Instrument Digit Recognition. Mathematics, 12(11), 1669. https://doi.org/10.3390/math12111669