Article

An Enhanced Simulation-Based Multi-Objective Optimization Approach with Knowledge Discovery for Reconfigurable Manufacturing Systems

by
Carlos Alberto Barrera-Diaz
1,*,
Amir Nourmohammadi
1,
Henrik Smedberg
1,
Tehseen Aslam
1 and
Amos H. C. Ng
1,2
1
Division of Intelligent Production Systems, School of Engineering Science, University of Skövde, P.O. Box 408, 54128 Skövde, Sweden
2
Division of Industrial Engineering and Management, Department of Civil and Industrial Engineering, Uppsala University, P.O. Box 256, 75105 Uppsala, Sweden
*
Author to whom correspondence should be addressed.
Mathematics 2023, 11(6), 1527; https://doi.org/10.3390/math11061527
Submission received: 15 February 2023 / Revised: 15 March 2023 / Accepted: 17 March 2023 / Published: 21 March 2023
(This article belongs to the Special Issue Multi-Objective Optimization and Decision Support Systems)

Abstract

:
In today’s uncertain and competitive market, where manufacturing enterprises are subjected to increasingly shortened product lifecycles and frequent volume changes, reconfigurable manufacturing system (RMS) applications play significant roles in the success of the manufacturing industry. Despite the advantages offered by RMSs, achieving high efficiency constitutes a challenging task for stakeholders and decision makers when they face the trade-off decisions inherent in these complex systems. This study addresses work task and resource allocations to workstations together with buffer capacity allocation in an RMS. The aim is to simultaneously maximize throughput and to minimize total buffer capacity under fluctuating production volumes and capacity changes while considering the stochastic behavior of the system. An enhanced simulation-based multi-objective optimization (SMO) approach with customized simulation and optimization components is proposed to address the abovementioned challenges. Apart from presenting the optimal solutions subject to volume and capacity changes, the proposed approach supports decision makers with knowledge discovery to further understand RMS design. In particular, this study presents a customized SMO approach combined with a novel flexible pattern mining method for optimizing an RMS and conducts post-optimal analyses. To this extent, this study demonstrates the benefits of applying SMO and knowledge discovery methods for fast decision support and production planning of an RMS.

1. Introduction

In today’s volatile market, manufacturing enterprises are often challenged by ever-shortening product lifecycles together with unpredictable demands and fluctuating production volumes [1]. Therefore, the ability of a manufacturing system to react and adjust its capacities and equipment to cope with suddenly arising challenging variations encompasses a crucial consideration for production organizations [2,3]. The concept of a reconfigurable manufacturing system (RMS) was introduced to cope with challenges generated by a dynamic market wherein variations in demand need to be addressed [4]. RMSs are responsive production systems that, through reconfigurations, can efficiently add, remove, or relocate resources and equipment in response to market shifts [5,6]. Specifically, RMSs are essential to achieve cost efficiency, high flexibility, and to provide better scalability and responsiveness than traditional production systems. Many recent studies have highlighted that RMS research is a mainstream topic and a major drive towards the future of the manufacturing industry because companies need to avoid significant investment loss caused by non-utilized equipment when facing dynamic market demands [7,8,9].
An RMS consists of several workstations (WSs) that contain several parallel and identical resources [10]. When a single-product type is produced, the RMS is classified as a single-part flow line (SPFL), and when several product types are produced, it is classified as a multi-part flow line (MPFL) [11,12]. In the automotive industry, where several product types are produced in the same system, the adoption of MPFL is increasingly common [2]. There are only a few studies that have focused on resource and task assignments of MPFL-RMSs and the buffer allocation problem has been overlooked.
As a consequence of successfully modeling and analyzing production systems, simulation methods have been widely employed within the manufacturing industry [13]. In an era of digitalization, simulation models are essential to better understand and to assess the complex nature inherent in the dynamic scenarios found in manufacturing systems [14]. Simulation modeling, particularly discrete-event simulation (DES), is considered to be an effective tool for handling the uncertain and changing scenarios of manufacturing systems [15,16]. Additionally, optimization techniques have been used to solve the NP-hard combinatorial problems found in RMSs. However, despite the success shown by simulation and optimization techniques, researchers have shown their shortcomings when employed separately. On the one hand, as the complexity of a system and its decision variables increase, simulation techniques become impractical [17,18]. On the other hand, most RMS optimization studies have simplified the problem by disregarding the variability and stochasticity of the systems. Against this backdrop, simulation-based optimization (SBO) has emerged as a combination of simulation and optimization that can provide solutions to large-scale problems. SBO investigates an extensive decision space, searching for the optimal or near-optimal combination of input variables [19]. Simulation-based multi-objective optimization (SMO) is employed when several conflicting objectives exist. Although prior studies have applied optimization to deal with the challenges of RMS configuration, the use of SMO has been very sporadic. Researchers have identified opportunities for using SMO to tackle RMS NP-hard problems [8,20]. Exact and heuristic methods have been used for these combinatorial problems, whereas metaheuristic methods, in particular, genetic algorithms (GAs) for single-objective and non-dominated sorting genetic algorithm II (NSGA-II) [21] for multi-objective problems, have proven to perform better in achieving near-optimal solutions in the RMS field [22,23,24].
For an RMS where many scenarios are involved, SMO generates complex and large datasets that are difficult to analyze. Knowledge-driven optimization (KDO) is a recent research area where data mining methods are used on the resulting SMO datasets to expose underlying knowledge regarding what constitutes the preferred solutions in accordance with the generated Pareto-optimal front. Decision makers can benefit from using data mining methods to extract the patterns that support a better understanding of the problems under different circumstances (e.g., production volumes) [25].
Considering that the preferences of the decision maker are unknown in many real-world RMS problems, and therefore, they cannot be solved effectively with scalar weighted functions, this study aims at addressing an RMS system configuration with resource and work task allocations within a truly multi-objective optimization context. This study aims at contributing to the RMS research domain as follows:
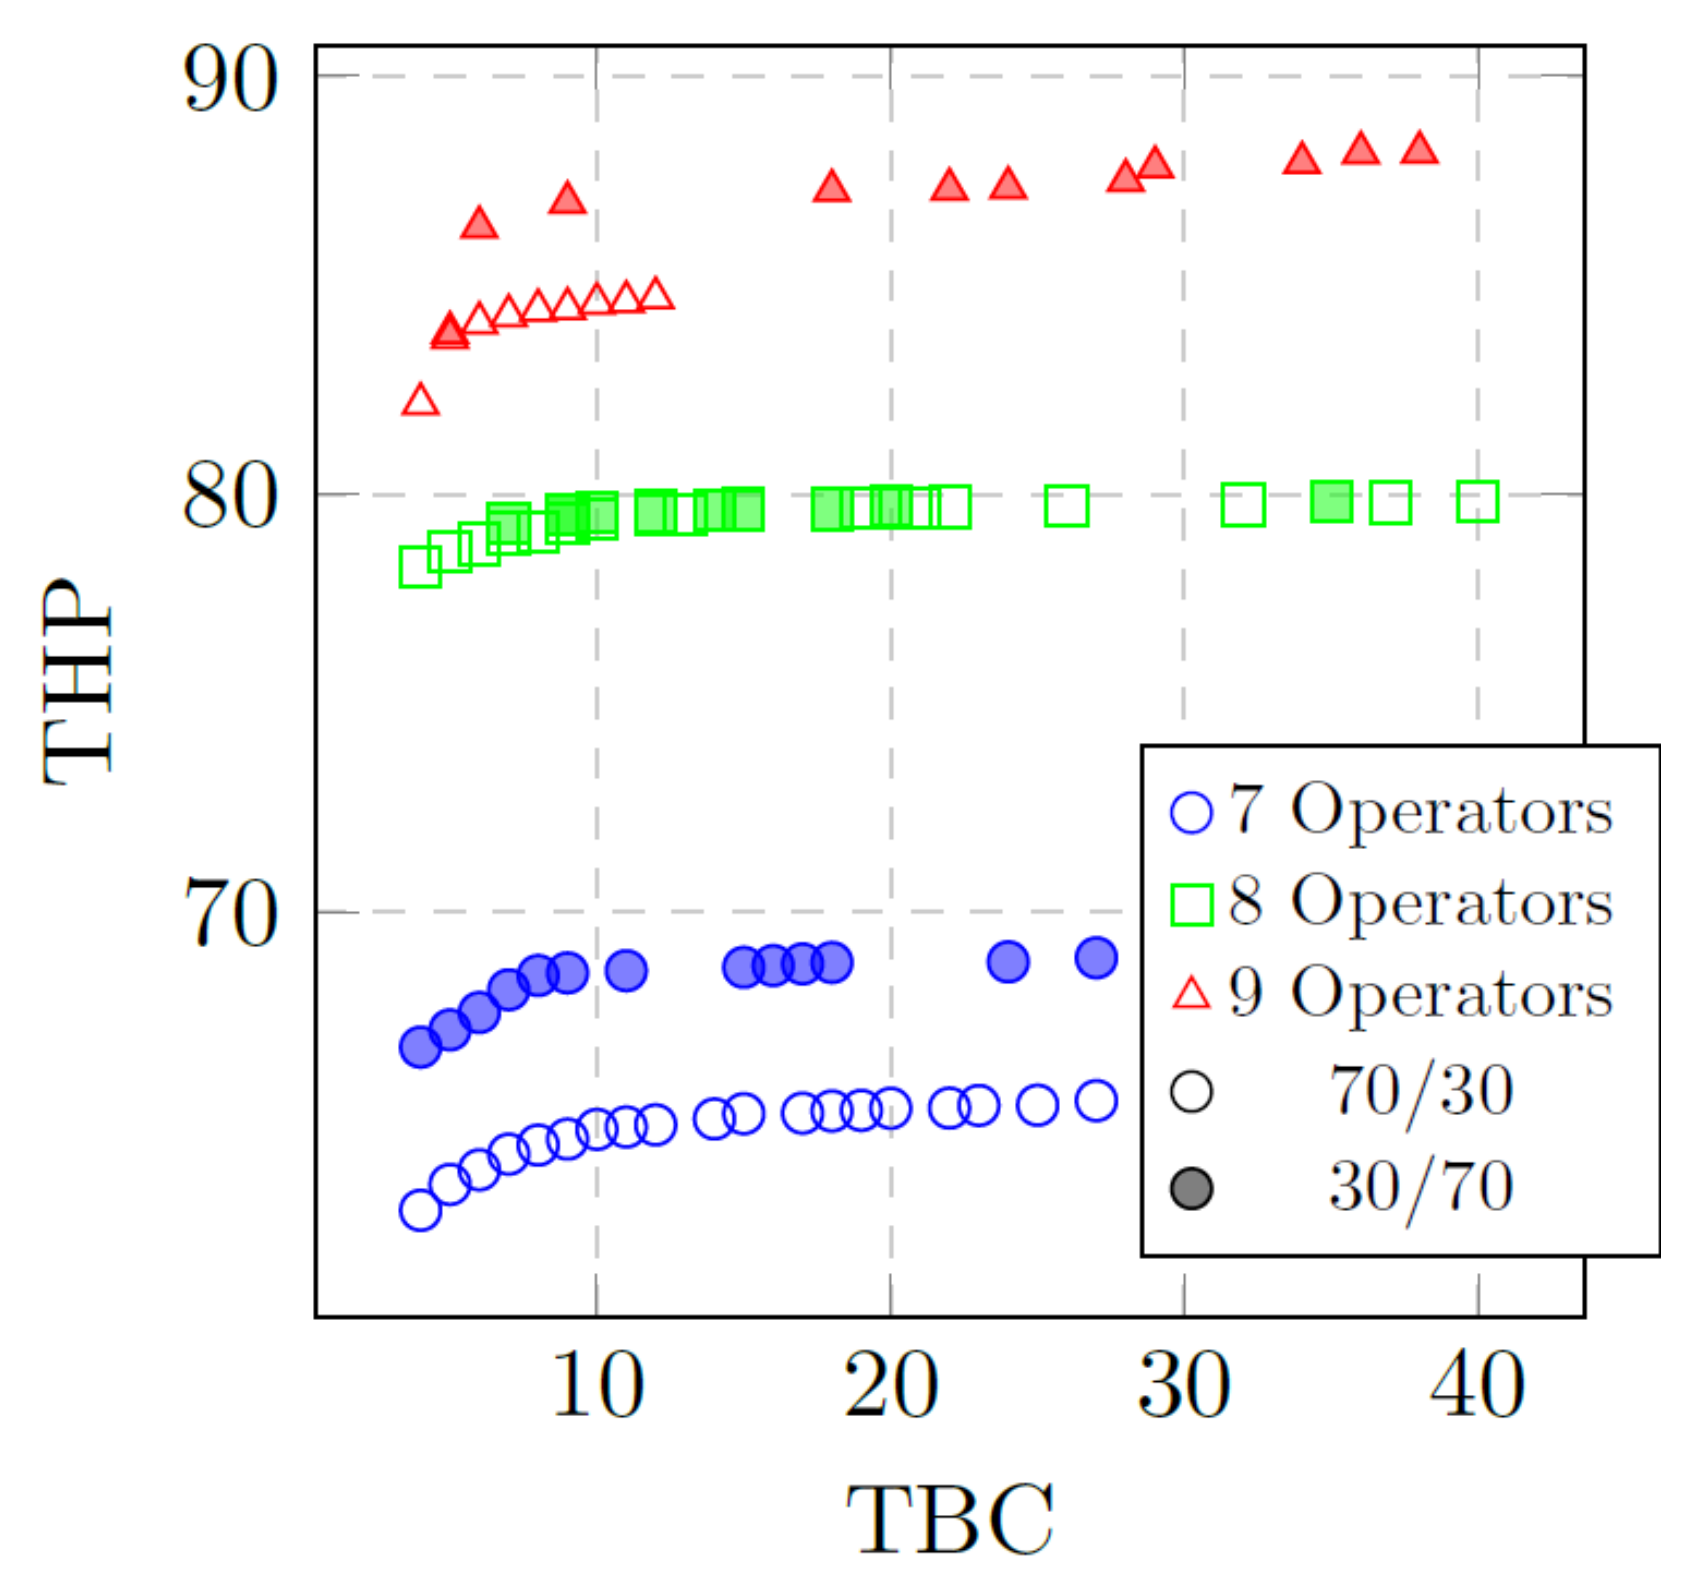
  • For an MPFL-RMS, a customized NSGA-II is proposed with an encoding and decoding strategy specifically designed to optimize system configuration subjected to scalable capacities and fluctuating production volumes by simultaneously addressing the task assignments to WSs and the buffer allocation problem for maximum throughput (THP) and minimum total buffer capacity (TBC). With this contribution, this study does not aim to compare the performance of the customized NSGA-II with other optimization methods or algorithms but to extend the performance of the NSGA-II and to show the benefits gained by customizing the genetic representation.
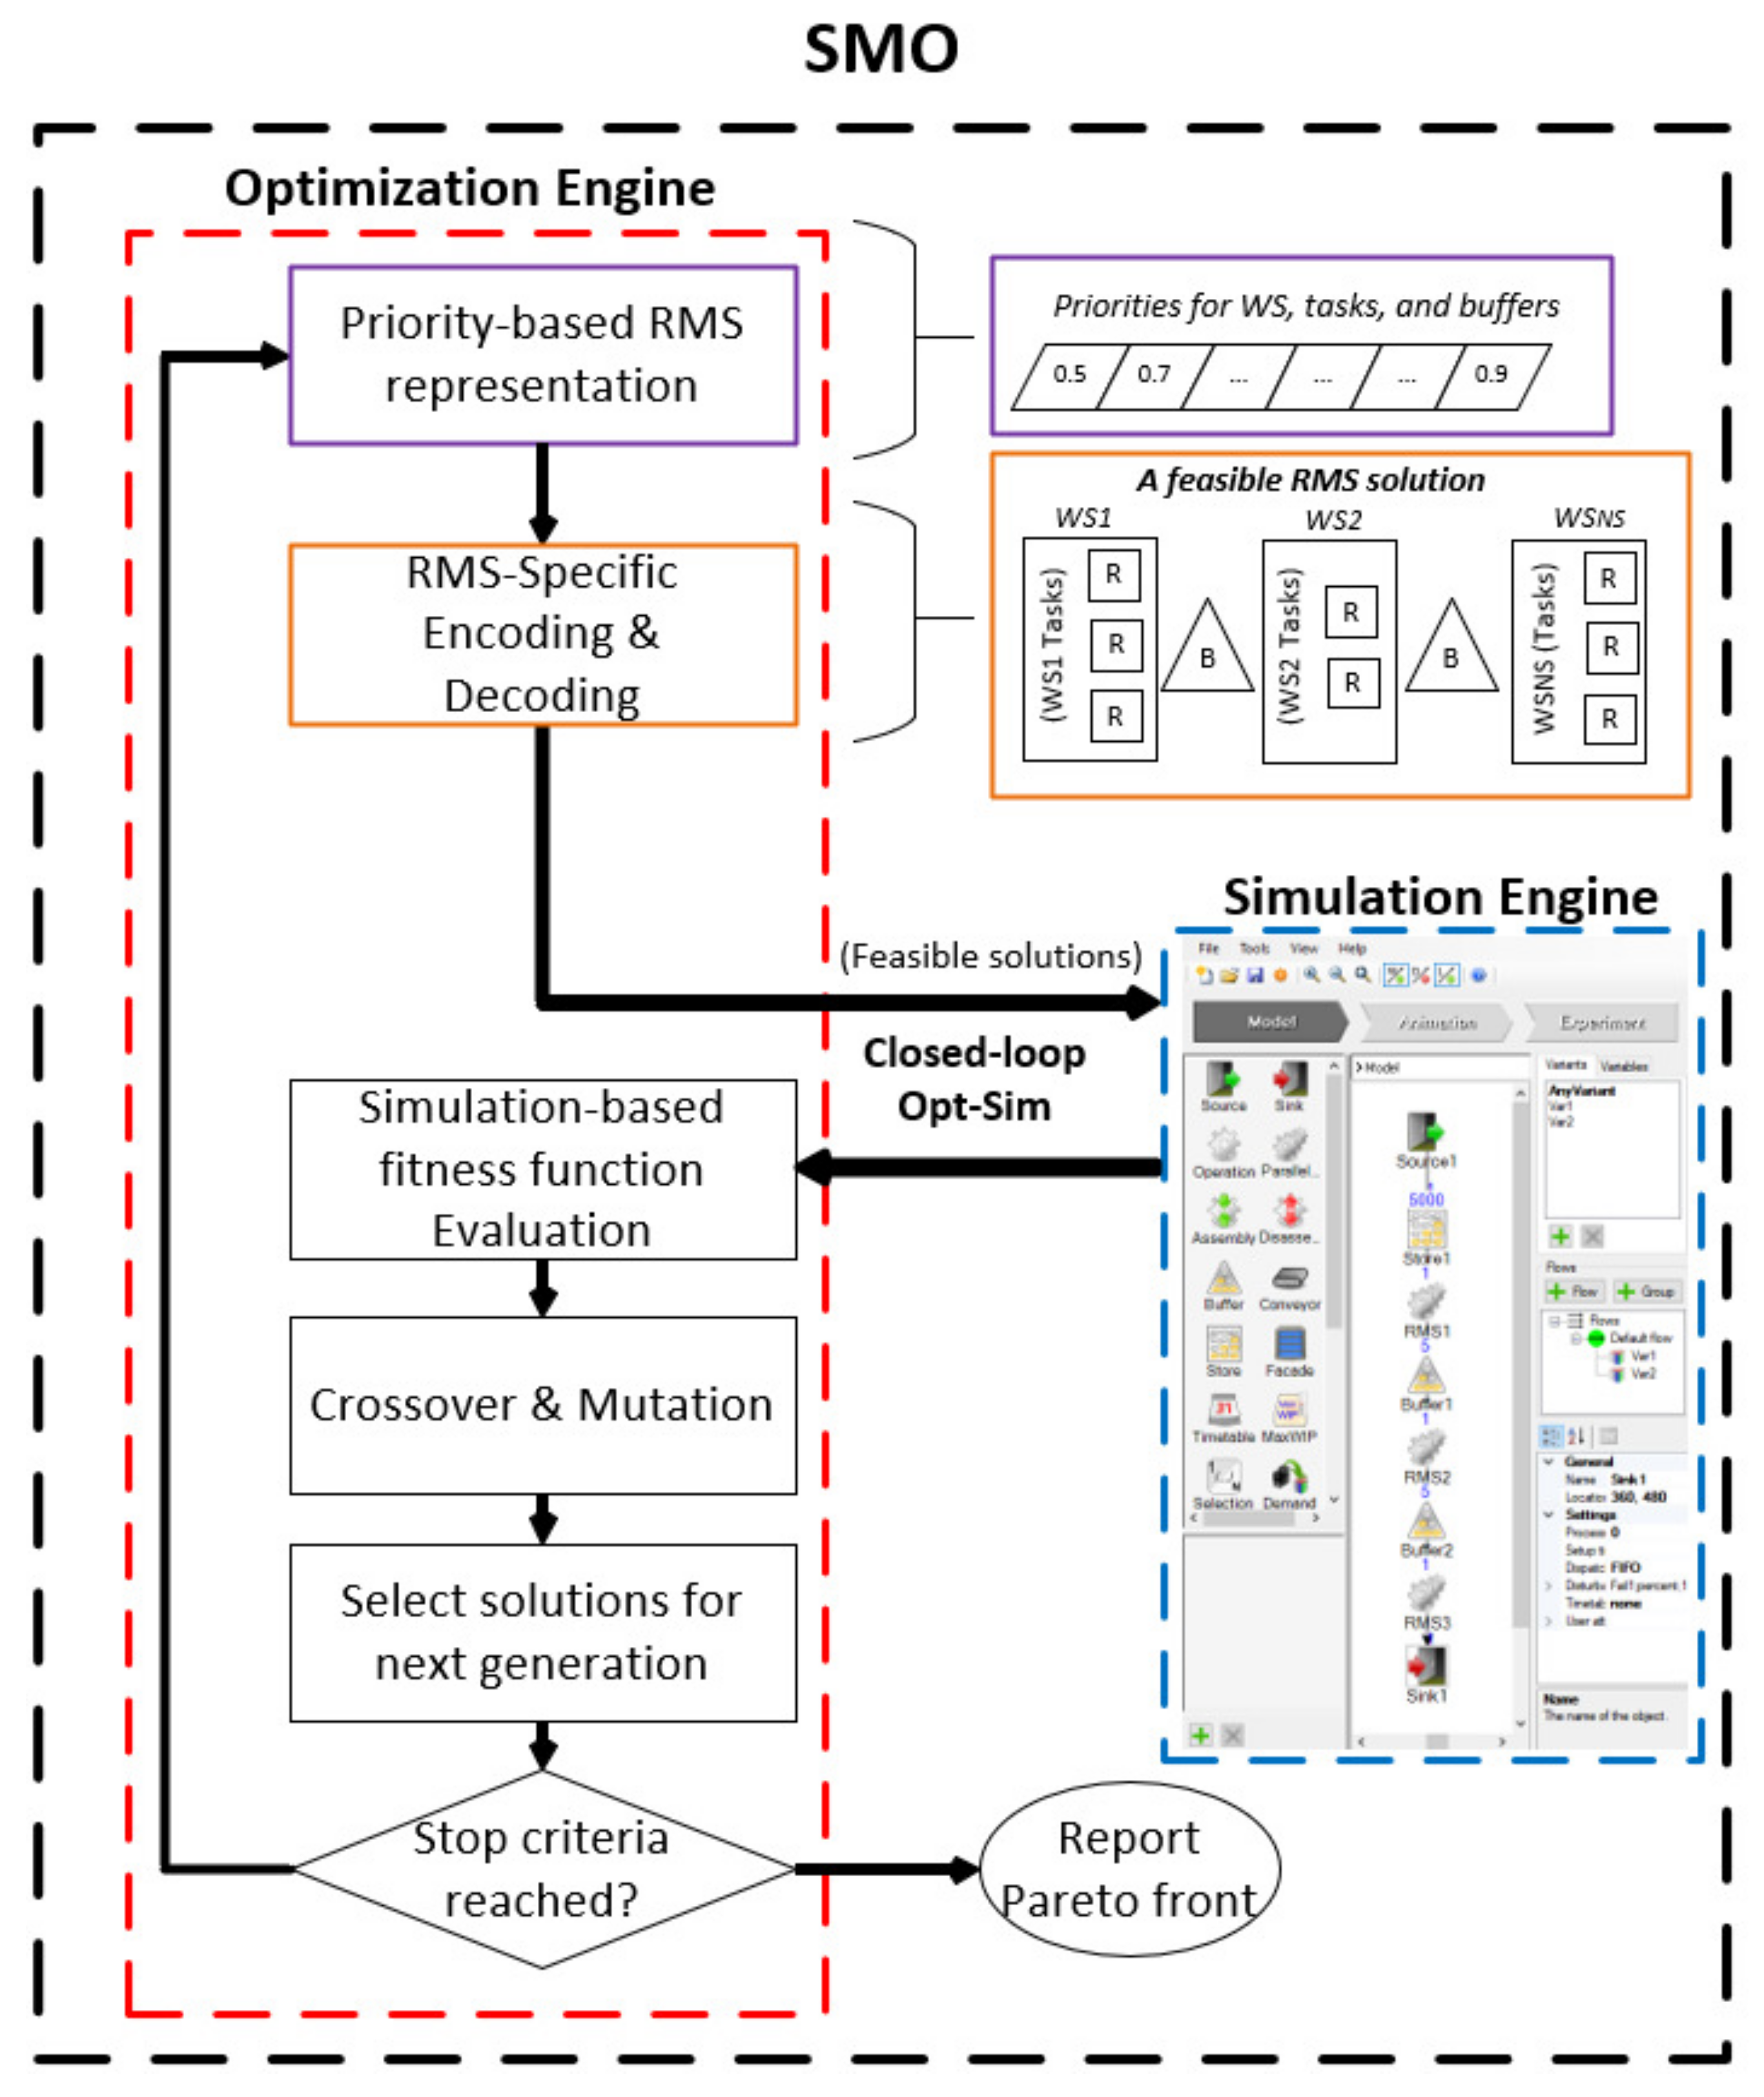
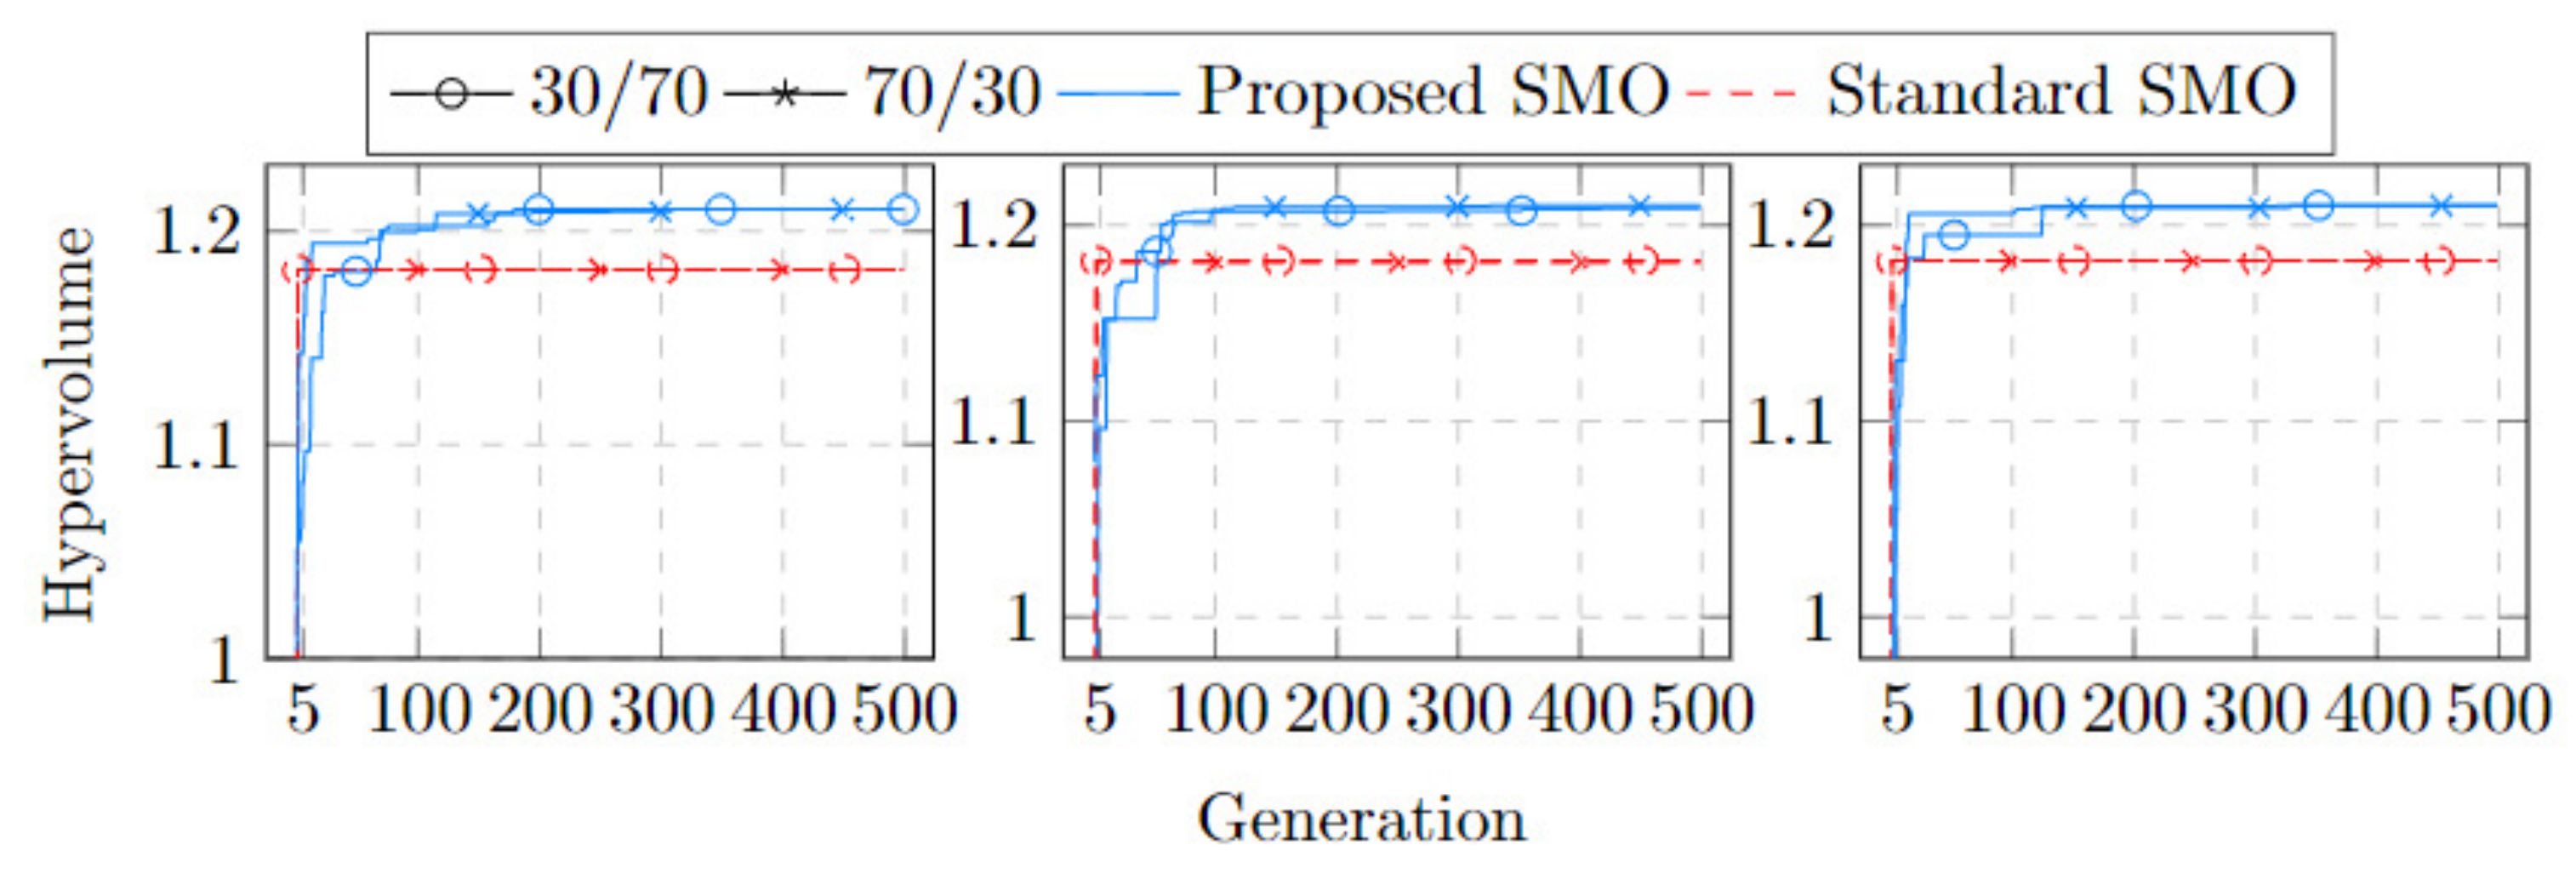
  • To overcome inaccurate results and to cope with the dynamic and stochastic behavior of an RMS (e.g., resource failures, variability of task times, and inter-station buffers) while simultaneously dealing with multiple objectives, the customized NSGA-II is incorporated with DES to render an SMO approach that takes the dynamic nature of the RMS into account.
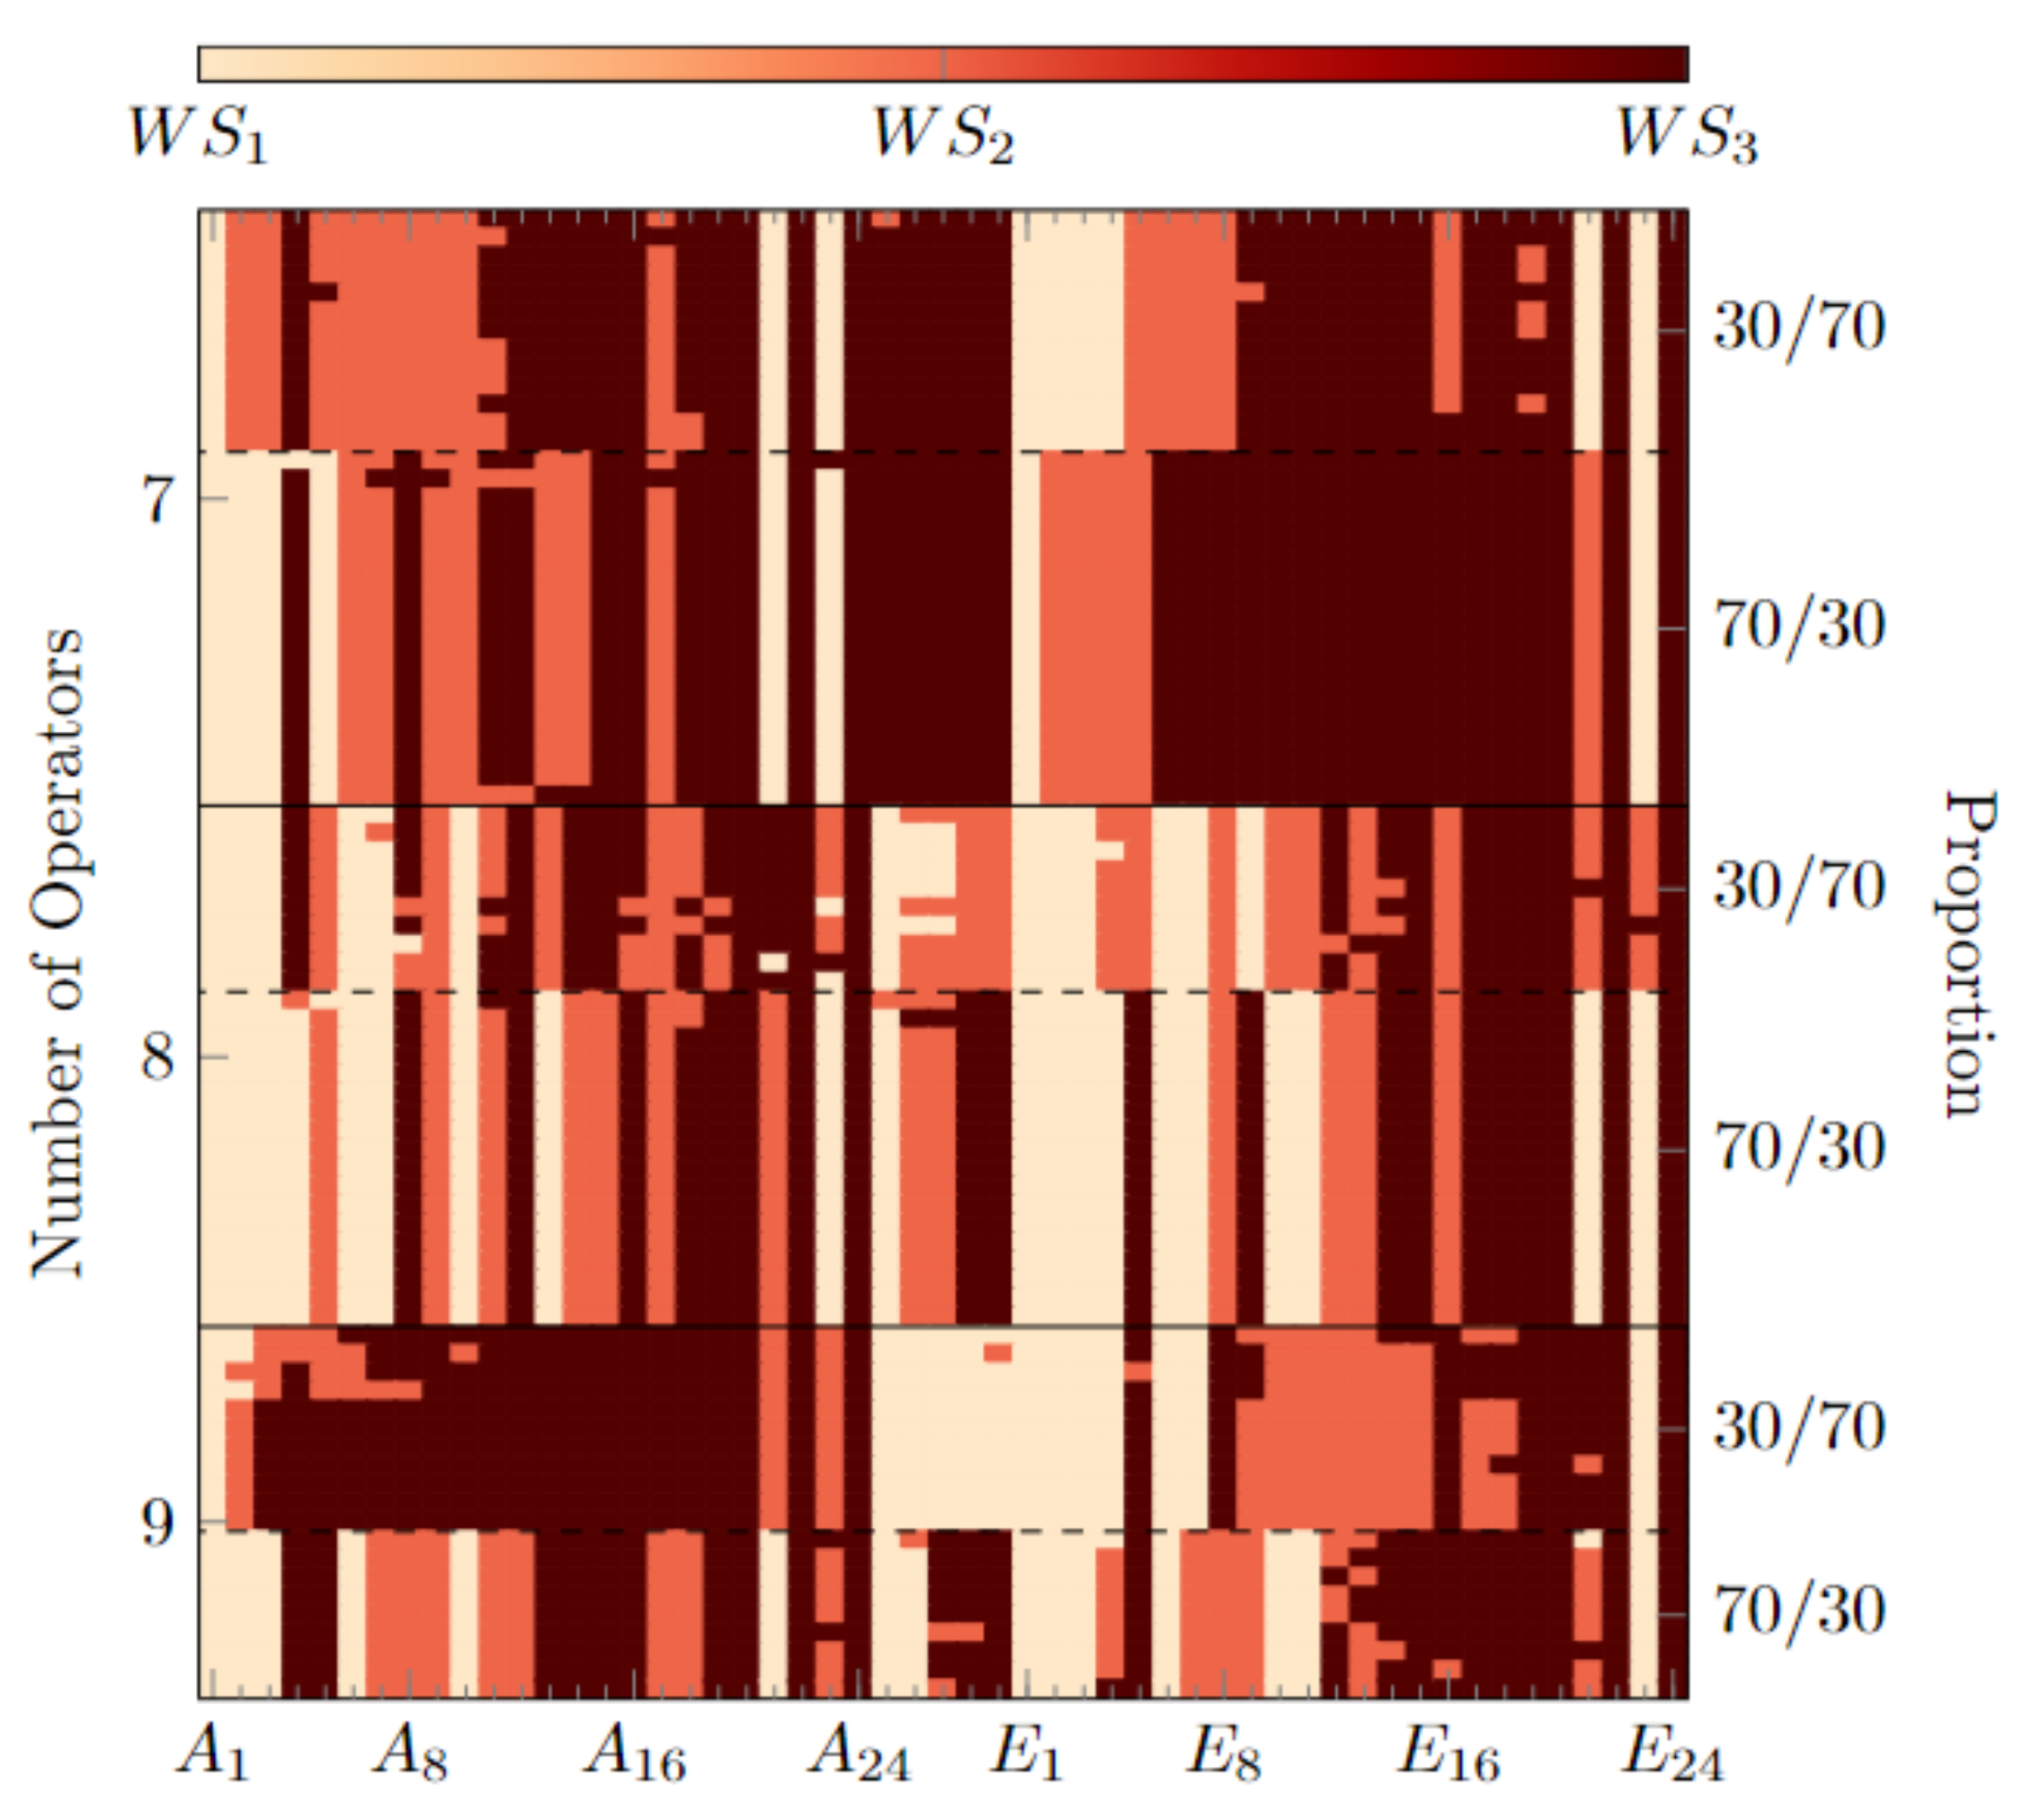
  • This study enhances the proposed SMO approach with a data mining methodology for a post-optimal analysis on multi-dimensional and multi-objective optimization datasets by employing a novel flexible pattern mining algorithm in an industrial R&D RMS application. Knowledge is extracted and represented as decision rules to discover the underlying patterns that constitute the preferred solutions for a scalable RMS under different production volumes. This contribution exploits the multi-objectiveness nature of the approach to analyze the trade-off solutions found in the Pareto front and gain knowledge from it.
The remainder of this article is structured as follows: Section 2 provides a frame of reference for the RMS challenges, the related work, and an understanding of SMO combined with multi-criteria decision making and knowledge discovery. In Section 3, we mathematically formulate the RMS required information. The proposed approach and the RMS-customized procedures are presented in Section 4. Section 5 introduces the case application and its multiple instances, and Section 6 shows the results and the discovered knowledge. Finally, the conclusions are presented in Section 7

2. Frame of Reference

2.1. Reconfigurable Manufacturing System Challenges and Related Work

According to Koren et al., the three main challenging areas that an RMS needs to address are the configuration of the system, the process planning, and the components of the system [6]. The system configuration involves the physical arrangement of resources (e.g., equipment, machines, and operators). The arrangement of the resources impact aspects such as the scalability, productivity, and functionality of the RMS [5,26]. Most previous research has focused on the assignment of machines to WSs. The process planning area addresses balancing the work tasks and assignments throughout the system, affecting the reconfiguration efficiency to cope with production changes (e.g., scalable capacities and volume changes) [27,28]. Research within process planning gravitates around work task assignment optimization. Lastly, the components of a system deal with the required type and amount of resources, such as machines, operators, buffers, and material handling, to achieve the desired capacity [6]. This area is crucial for scaling an RMS, and most of the existing research has merely focused on optimizing the number of resources [1]. Accordingly, for an RMS to accommodate changes in production during its lifecycle, reconfigurations in these areas are required. Generally, prior research has targeted one or more of the areas mentioned above by reallocating, adding, and removing resources, as well as rebalancing the tasks in the system [3,29]. However, although these areas are studied, they are rarely addressed simultaneously. Some of the most relevant studies are reviewed below.

2.1.1. Single-Part Flow Lines

Concerning SPFLs, Shabaka and Elmaraghy presented a GA-based method for the process plan generation of an RMS with cost as an objective [30]. Doe et al. presented two studies [31,32], in which they introduced two GA approaches for optimizing the RMS configuration with capital cost as an objective. A single-objective GA approach aiming at either maximizing THP or minimizing the number of machines employed in the system was presented in [29]. This study reconfigured a system without buffers, and tasks were rebalanced to meet specific production capacities. In a subsequent study, the authors presented five principles for designing a scalable RMS and extended their previous approach to include three cases in which the inter-station buffers had the same constant capacity [3]. Moghaddam et al. introduced an integer linear programming model to select the optimal configuration based on cost [33]. Deif and ElMaraghy also presented a GA optimization study where cost was utilized as an objective, and the authors investigated managing the capacity scalability in the RMS [34]. Borisovsky et al. and Makssoud et al. presented two different single-objective approaches, a GA approach and a mixed integer linear programming approach, which were utilized to find the best task allocations to minimize capital costs and the number of machines, respectively [35,36].
Contrary to single-objective studies, Goyal et al. presented a MOO NSGA-II-based approach for obtaining the optimal configuration regarding convertibility, cost, and resource utilization [12]. In a subsequent study, Goyal and Jain extended their previous research by proposing a particle swarm optimization that searched for an optimal set of SPFL configurations with the same optimization objectives as before: cost, resource utilization, and convertibility [37]. A MOO approach for finding the optimal RMS configuration, in this case, based on a simulations, was proposed by Diaz et al., wherein NSGA-II was employed for production rate, buffer capacity, and lead time optimization [5]. Targeting the process plan area, Khezri et al. optimized cost, production time, and sustainability using three different approaches: a posteriori augmented ε-constraint and two evolutionary approaches, i.e., NSGA-II and the strength Pareto evolutionary algorithms [38]. Touzout and Benyoucef employed exact and evolutionary methods to target the process plan area by optimizing cost, time, and energy consumption during the utilization of machines [39,40].

2.1.2. Multi-Part Flow Lines

In the context of MPFLs, a cost-oriented study considering the availability of the machines was formulated by Youssef and ElMaraghy to address the RMS configuration problem using GA and Tabu search [41]. The RMS configuration problem was approached again by J. Dou et al. using a GA [11]. A mathematical approach to minimize the cost of the RMS configuration design was developed by Saxena and Jain [42]. Cost was also the objective in an integer linear programming approach to find the optimal configuration design in a hypothetical part family proposed by Moghaddam et al. [43]. The RMS resource selection was approached by Bensmaine et al. using a simulation-based NSGA-II with completion time as the objective [44]. Bensmaine et al. proposed a new heuristic approach that was focused on the process plan of a MPFL with the makespan as the objective [45].
From a multi-objective optimization (MOO) perspective, Musharavati and Hamouda employed a simulated annealing algorithm to address generating a process plan, optimizing cost, and the THP [46]. Chaube et al. also targeted the process plan area using the conventional NSGA-II with cost and time as objectives [47]. Doe et al. targeted the flow line design of a MPFL using NSGA-II with cost and tardiness as objectives [48]. The same objectives were optimized by Doe et al., introducing, this time, a particle swarm optimization approach [2].

2.2. Simulation-Based Multi-Objective Optimization and Multi-Criteria Decision Making

Multiple conflicting objectives offer many challenges for decision makers in practical MOO scenarios. Not only do several objectives have to be optimized simultaneously to find a representative set of the Pareto-optimal front of solutions, but decision makers also need to select the final trade-off solution to be implemented. Neither one is a trivial task. A decision maker may have certain preferences about the solutions to a MOO problem [49,50]. When these preferences are known ahead of the optimization process, the decision maker may employ a priori methods to focus the search on certain preferred regions. When the preferences are unknown beforehand, a posteriori methods are used to find a representation of the entire Pareto-optimal front before the decision maker begins to analyze the solutions and find a preferred region. Assuming no preference, multi-objective evolutionary algorithms (MOEAs) are a proficient tool for finding solutions that both converge close to the true Pareto-optimal front while also having a good spread over the front. For the decision maker to perform an adequate a posteriori analysis of the solutions, a MOEA needs to live up to both requirements of convergence and diversity on the Pareto-optimal front [51]. SMO is the process of combining MOO and simulation. Combining these two techniques brings advantages to both fields [52]. The general representation of an SMO problem is defined by several conflicting objectives included in the objective functions and possibly subjected to several equality and inequality constraints. The use of simulation allows the decision maker to optimize a real-world system with much higher fidelity without the need to simplify the MOOP problem and lose intricate details and relationships that might exist in the system. Additionally, using MOEAs to solve SMO problems will discover and explore many more solutions than manual processes [53].

2.3. Knowledge Discovery and Flexible Pattern Mining

Once the optimization process has ended, the decision maker faces many trade-off solutions to analyze. Much of the literature has focused solely on analyzing the objective space while disregarding the role the decision space plays in a decision maker’s preferred solutions. It can be argued that more knowledge about both the objective space and the decision space and how they relate, generated with data mining and machine learning methods, will lead to more informed decision making [25,54].
Flexible pattern mining (FPM) [55] is a recent rule-mining method developed explicitly for knowledge discovery in MOO. FPM is based on the Apriori algorithm [56] and generates decision rules that describe a decision maker’s preferences regarding selected and unselected sets of solutions. Typically, the decision maker chooses the selected set as the preferred non-dominated solutions and the unselected set as the remaining solutions found in the search. Then, the FPM procedure extracts rules that discriminate the selected set from the unselected set, on the forms x < c 1, x > c 2 and x = c 3, for a decision variable x and constant values c 1, c 2, and c 3. Each FPM rule also has an associated significance and insignificance where the significance indicates the fraction of solutions in the selected set that lives up to the rule (the support of the rule in the selected set), and the insignificance indicates the fraction of solutions in the unselected set that corresponds to the rule (the support in the unselected set). A meaningful and descriptive rule would have high significance while having low insignificance, thereby describing more solutions in the selected set. Additionally, using frequent itemset mining, single rules can be combined to find rule interactions and their significance and insignifiacnce. Consider the following example of a three-level rule interaction: { x 1 <   0.2 x 2 >   0.3 x 3 =   4 } with significance equal to 90% and insignificance equal to 5%, it indicates that the combination of these three rules covers 90% of the preferred solutions, while only capturing 5% of the remaining (unpreferred) solutions.

2.4. Concluding Remarks

To the best of our knowledge, most of the prior studies have neglected real-world uncertainty and consideration of buffers. Most of the optimization studies have adopted metaheuristic algorithms. However, the use of MOO is sporadic, and the challenging areas of an RMS are rarely tackled simultaneously. The limited use of SBO has usually focused on small single-objective cases and mostly targeted one main area. Nearly all prior work that has combined simulation and optimization required a manual data transfer from one to the other [15]. This constitutes an evident research gap in the use of SMO to combine task and resource assignments of a scalable MPFL-RMS while considering the buffer allocation problem as an additional decision variable and the unreliability of the resources.
Knowledge discovery methods have been applied to extract patterns from manufacturing systems. Studies have shown that decision rules extracted from applying data mining and knowledge discovery methods to historical datasets can boost the effectiveness of production development and constitutes a challenging area for the future of manufacturing systems [57,58]. Although RMSs constitute one of the critical enablers that impacts significantly on today’s so-needed changeable manufacturing systems, the knowledge-capturing and decision-making process is very complex due to their intrinsic complexity and stochastic nature [1,59,60]. Accordingly, considering that the optimization of an RMS involves a large number of decision variables and that setting-up changeable optimization scenarios is a time-consuming task, the applicability of knowledge discovery methods to RMS applications becomes even more crucial. It indicates a research opportunity in order to support decision makers [6,59].
Thus, in this article, we aim to mitigate the abovementioned gaps by optimizing the tasks and resource assignments of a scalable MPFL-RMS while considering the buffer allocation problem by developing a customized SMO approach enhanced with a novel FPM method for conducting post-optimal analyses.

3. A MOO Problem Formulation for RMS

This study originated from the challenges that manufacturing enterprises face when adjusting production resources so that MPFL-RMSs can efficiently address volume and capacity changes. Many factors must be considered, including work task and resource reconfigurations to maximize THP and minimize TBC. As the parts mix and volumes change, the RMS evolves accordingly. Therefore, because decision makers’ preferences are not incorporated, this study uses a multi-objective problem formulation to analyze how the throughput is affected by different buffer capacities. The problem assumptions are as follows:
  • An MPFL-RMS that consists of one or several WSs manufactures several products under different production volumes.
  • Resources within the RMS are subjected to maintenance, breakdown, setup times, and variability of the task times.
  • All resources within a WS are identical and perform the same sequence of tasks.
  • There are reserved places for adding or relocating resources in the WSs.
  • There are inter-station buffers with variable capacity.
  • Tasks are subjected to precedence relationship and technological requirements that ensure a feasibility sequence is performed in specific WSs.
The following notations and their definitions are used while dealing with formulating and optimizing the MPFL-RMS.
NotationsDefinition
Indices:
i, rtask index
jWS index
mresources index
vvariant index
Parameters:
NSnumber of WS
NVnumber of variants
NTvnumber of tasks for variant v (v = 1, …, NV)
TNMtotal number of resources in RMS
NMWSmaxmaximum number of resources per WS
NMWSminminimum number of resources per WS
NBnumber of buffers (NS − 1)
Bminminimum safety buffer
Bmaxmaximum buffer capacity
Bunitbuffer incremental unit
PRirvprecedence relationships for variant v; 1 if task i is the predecessor of task r; otherwise 0
TRjivtechnological requirement for variant v; 1 if task i can be assigned to WS j; otherwise 0
THPthroughput per hour
TBCtotal buffer capacity
Decision variables:
xijv1 if task i is assigned to WS j for variant v; 0 otherwise
ymj1 if resource m is assigned to to WS j; 0 otherwise
Bjin-between buffer capacity for WS j and j + 1
The problem formulation is presented below. The following two conflicting optimization objectives are defined:
M a x i m i z e   f 1 = T H P = # p r o d u c t s / ( s i m u l a t i o n   h o r i z o n w a r m u p )
M i n i m i z e   f 2 = T B C = j = 2 N S B j 1
The following constraints must be satisfied when optimizing the MPFL-RMS.
Task assignment: For each variant v , each task must only be assigned to one WS, i.e.,
j = 1 N S x i j v = 1 ,   v ,   i = 1 , 2 , , N T v .
Precedence relationships: For each variant v , each task can only be assigned to a WS only if all its predecessors are assigned to the same WS or earlier, i.e.,
j = 1 N S j × ( x r j v x i j v ) 0 ,   v ,   ( r , i ) = 1 , 2 , , N T v { P R i r v |   P R i r v = 1 } .
Resource assignment: Each resource must be assigned to a WS, i.e.,
j = 1 N S y m j = 1 ,   m = 1 , 2 , , T N M .
Technological requirement: For each variant v , each task can only be assigned to a WS if it has the required machinery to perform the task, i.e.,
x i j v T R j i v ;   v = 1 , , N V ,   i = 1 , 2 , , N T v ,   j = 1 , 2 , , N S .
Minimum WS equipment: At least N M W S m i n should be assigned to each WS, i.e.,
m = 1 T N M y m j N M W S m i n ,   j = 1 , 2 , , N S .
Maximum WS equipment: WSs cannot have more than a certain number of resources, i.e.,
m = 1 T N M y m j N M W S m a x ,   j = 1 , 2 , , N S .
Buffer capacity: The inter-station buffers should not be less than the minimum safety buffer ( B m i n ) and not exceed the maximum buffer capacity ( B m a x ), i.e.,
B m i n B j 1 B m a x   j = 2 , , N S .
Because the considered MPFL-RMS belongs to NP-hard optimization problems, the next section proposes an SMO approach to address it.

4. A Simulation-Based Multi-Objective Optimization Approach

The SMO approach proposed in this paper consists of two major components, i.e., simulation and optimization. The simulation component consists of a DES software named FACTS Analyzer [61] in which the RMS and the studied scenarios are modeled and simulated. The optimization component is implemented in the well-known platform MATLAB where the assignment of tasks and resources to WS is performed. The tight integration of the simulation and optimization components allows an accurate representation of a realistic RMS, including many types of system variables regardless of their nature (e.g., failures, mean time to repair, availability, process time of resources, etc.) while avoiding simplifying the RMS as seen in other optimization studies.
The process starts in the optimization component, in which a population of size N P of priority-based RMS solutions is generated. Then, custom-made RMS-specific encoding and decoding mechanisms are used to generate feasible RMS solutions. Subsequently, the generated population of feasible solutions is mapped to the simulation component in which the RMS configurations are generated based on the received combination of input parameters from the optimization. Then, the DES engine runs several replications and uses the simulation function to evaluate the produced number of products considering the system’s stochastic nature. After these solutions are simulated, the results of the simulation-based fitness function evaluation in terms of multiple objectives are fed back to the optimization component. Next, by using a random solutions selection mechanism, the population of solutions goes through the crossover and the mutation operators, based on specific probabilities c p and m p , respectively, generate a new population of offspring. The above iterative process is repeated until the integrated optimization and simulation components converge to a set of Pareto-optimal solutions or the stopping criteria, i.e., a prespecified number of generations ( G m a x ), is reached. The main structure of the proposed SMO approach is illustrated in Figure 1.
In the context of optimization, metaheuristic algorithms have proven to be promising approaches for any combinatorial optimization problem. Among metaheuristics, GAs have been extensively employed to optimize manufacturing systems [62]. When dealing with two conflicting objectives, the NSGA-II is known to be one of the most effective MOEA, endowing a proper convergence and spread of solutions [22]. Three main factors drive the outstanding performance of NSGA-II: the fast non-dominated sorting approach that decreases the computational complexity; the elitism mechanism storing the non-dominated solutions; and the crowding distance calculation that ensures a diverse population by comparing and selecting solutions after the non-dominated sorting [63]. In this study, by incorporating simulation components into the fitness function evaluation of NSGA-II, a customized SMO-NSGA-II for RMS is developed, as described below.

4.1. SMO-NSGA-II for RMS

The NSGA-II sorts the solutions into different fronts based on their dominance relationship (dominated and non-dominated). The dominance relationship is established between each pair of solutions by comparing the objectives set by the objective functions. The crowding distance ensures a good spread of solutions by determining the density in the region, impacting the selection of the solutions that will be preserved for future generations. Once the fast non-dominated sorting is completed, the crowding distance calculation ranks the solutions in each individual front. The above features of NSGA-II promote the selection of dispersed solutions on the fronts. The proposed SMO-NSGA-II for RMS is summarized in Algorithm 1.
Algorithm 1: SMO-NSGA-II
1   Algorithm   inputs :   G m a x ,   N P ,   c p   ,   m p  
        RMS   inputs :   T R j , i v ,   P R i r v ,   N S ,   N T v ,   T N M ,   N M W S m i n ,   N M W S m a x n ,   N B ,   B m i n ,   B m a x ,   B u n i t
2 Using Section 4.1.1 ,   create   a   population   of   priority-based   representation   vectors
3 While gGmax
4   Using the proposed encoding and decoding mechanisms in Section 4.1.2 to ensure a population of RMS feasible solutions
5   Using the simulation component in Section 4.1.3, evaluate the fitness function for each solution
6   Rank the solutions using the fast non-dominated sorting mechanism
7   Calculate the crowding distance of each solution in each individual front
8   Select parents for crossover using tournament selection
9   Using crossover and mutation operators in Section 4.1.4, generate a new set of offspring
10    Using the elitism mechanism to preserve the best individuals
11    Increment g
12 End
13 Output: The Pareto-optimal solutions for RMS
The components of the SMO-NSGA-II for RMS are described below.

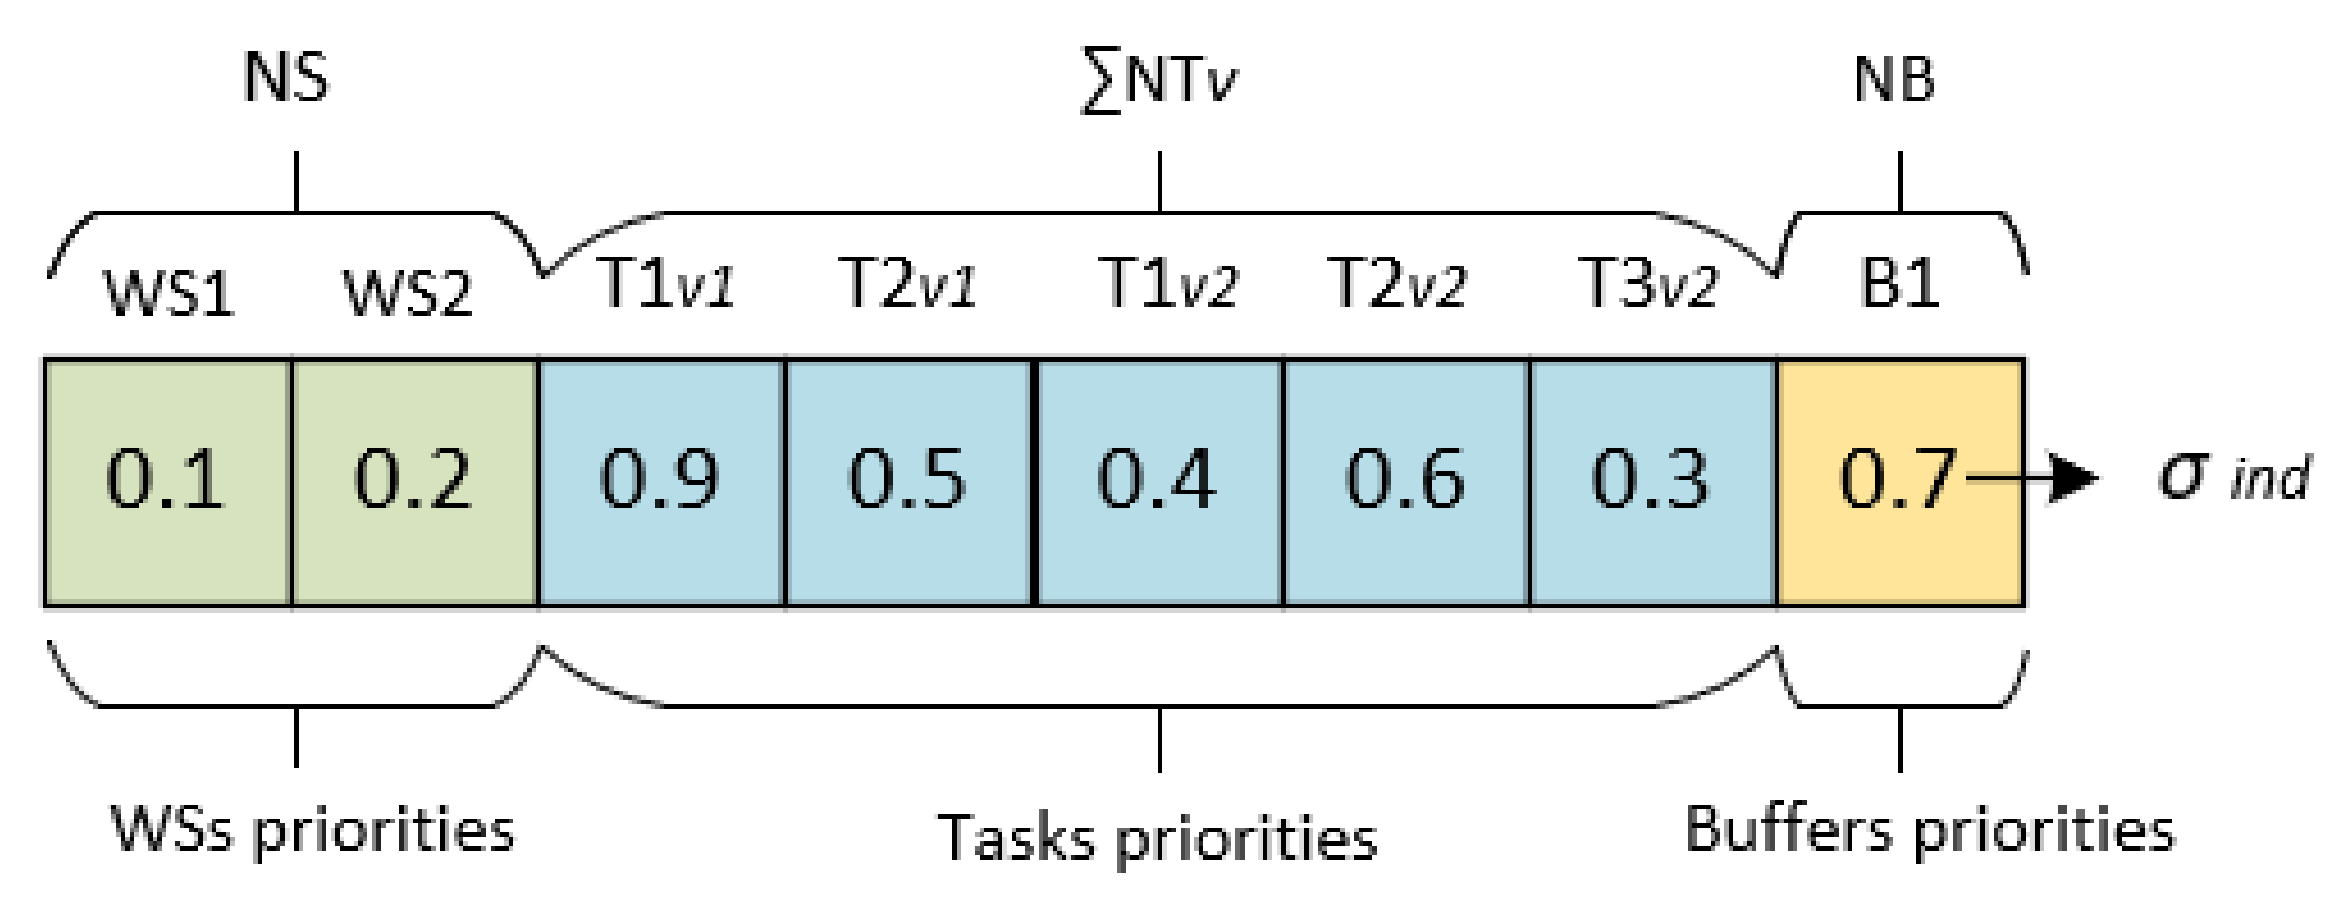
4.1.1. Solution Representation

The NSGA-II starts with an initial population of individual solutions in which each row represents a string of real numbers ( σ ) where the elements are randomly generated between (0,1). The length of a solution string is equal to the number of WSs ( N S ) plus the number of tasks for all the variants ( v N V N T v ) plus the number of inter-station buffers ( N B = N S − 1). The bit content at the i n d -th index, called σ i n d (i n d = 1,…, NS + v N V N T v + N B ), contains the random number showing the relative priority of WSs, tasks, and buffers depending on where the i index relies, as depicted in Figure 2. As the figure shows, the first NS columns relate to the WSs priority, meaning that the higher the priority, the more resources will be assigned to the WS. The same priority rule applies to the buffers in the last N B columns of the string. The random keys from column N S + 1 to N S + v N V N T v relate to the priority of the tasks, indicating that a task with a higher relative priority value is ranked higher to be assigned to the WSs. Figure 2 illustrates the solution representation for an example with two WSs, one inter-station buffer, and two parts to be produced with two and three tasks, respectively.

4.1.2. Encoding and Decoding

The encoding and decoding procedures aim at generating a feasible solution for each solution string in the population.
For each string, the encoding attempts to find feasible settings for the RMS configuration by assigning resources to the WSs, deciding on the assignment order of the tasks to WSs, and assigning inter-station buffer capacities. The number of resources per WS is calculated using N M W S m i n + σ i n d × ( N M W S m a x n N M W S m i n ) , where σ i n d ( i n d = 1 , , N S ) refers to the WSs priorities and [ ] is the lowest bigger integer number. If the total number of resources per WS is not equal to T N M , they are updated until their sum equals T N M . The assignment order of the tasks to WSs for each variant v is decided by the flexibilities of the tasks, based on T R j i v , and the proprieties of the tasks based on σ i n d ( i n d = N S + 1 , , N S + v N V N T v ), in ascending and descending orders, respectively. The inter-station buffer capacity is calculated using B m i n + σ i n d × ( B m a x B m i n ) , where σ i n d ( i n d = N S + v N V N T v + 1 , , N S + v N V N T v + N B ) refers to the priorities of the buffers. If the summation of the inter-station buffer capacities is less than B m i n × N B or larger than B m a x × N B , then they are updated until they fall in the range above. The encoding procedure is shown in Algorithm 2.
Algorithm 2: Encoding
1   Input :   σ ,   T R j i v ,   N S ,   N T v ,   T N M ,   N M W S m i n ,   N M W S m a x n ,   N B ,   B m i n ,   B m a x ,   B u n i t
2   For   i n d = 1   to   e n d
3             If   i n d = 1   to   N S
4                       Calculate   the   number   of   assigned   resources   per   WS   based   on   σ i n d ,   N M W S m i n ,   and   N M W S m a x n
5                         If   the   total   number   of   assigned   resources > T N M
6                                     Sort   WSs   in   terms   of   their   σ i n d in descending order
7                                     While   the   total   number   of   assigned   resources > T N M
8                                                   Decrease   one   resource   from   the   sorted   WSs   in   line   6 9                                       End   10                       Elseif   the   total   number   of   assigned   resources < T N M
11                                       Sort   WSs   in   terms   of   their   σ i n d in ascending order 12                                       While   the   total   number   of   assigned   resources < T N M
13                                                         Increase   one   resource   to   the   sorted   WSs   in   line   11 14                                       End   15                                   End   16               Elseif   i n d = N S + 1   to   N S + v N V N T v
17                                       For   v = 1   to   N V
18                                                   Sort   the   tasks   of   variant   v in terms of their flexibility (based on T R j i v ) and priority (based on σ i n d ) in ascending and descending orders, respectively
19                                       End   20               Elseif   i n d = N S + v N V N T v + 1   to   e n d
21                                         Calculate   the   allocated   in-between   WSs   buffer   capacity   based   on   σ i n d ,   N B ,   B m i n ,   and   B m a x
22                                         If   the   total   allocated   buffers   capacity > B m a x × N B
23                                               Sort   in-between   buffers   in   terms   of   their   σ i n d in descending order
24       While the total number of in-between buffers capacity > B m a x × N B
25                                                                 Decrease   one   B u n i t   from   the   sorted   in-between   buffers   in   line   23 26                                                 End   27                                       Elseif   the   total   allocated   buffers   capacity < B m a x × N B
28                                                 Sort   in-between   buffers   in   terms   of   their   σ i n d in ascending order
29         While the total number of in-between buffers capacity < B m i n × N B
30                                                                   Increase   one   B u n i t to the sorted in-between buffers in line 28
31       End
32      End
33   End
34 End
35 Output: number of resources per WS, vectors of sorted tasks based on flexibility and priority per variant, in-between buffers capacity
For each setting obtained via the encoding procedure, the decoding aims to generate a feasible solution for the RMS by assigning tasks to WSs, considering the vectors of the sorted tasks based on the flexibility and the priority for each variant. This is performed by selecting each task of variant v based on the related vector of sorted tasks, and then positioning the task within the eligible range of WSs considering the cumulative normalized vector of T R j i v and their priorities σ . The decoding procedure is shown in Algorithm 3.
Algorithm 3: Decoding
1   Input :   P R i   r v ,   T R j i v ,   N S ,   N T v , vectors of sorted tasks based on flexibility and priority per variant
2   For   v = 1   to   N V
3                 For   i = 1   to   N T v
4    task = set the selected task as the ith index in the sorted tasks vector for variant v
5                           Normalize   the   T R j i v matrix by T R 2 j i v = T R j i v / j N S T R j i v
6                           Calculate   the   accumulative   sum   for   T R 2 j i v   by   T R 3 j i v = j = 1 j 2 T R 2 j i v   where   j 2 = 1 to N S
7                             S t a t i o n = min j f i n d { T R 3 j   t a s k   v σ t a s k } ;   set   the   selected   station   by   finding   the   next   index   where   T R 3 j   t a s k   v   is   bigger   than   σ t a s k   for   variant   v
8                             Update   T R j i v   after   the   current   t a s k   has   been   assigned   to   WS   for   variant   v   including   all   its   predecessors   and   successors   in   P R i   r v
9  End
10 End
11 Calculate the total task time per variant per WS
12 Output: A feasible solution for RMS includes the number of resources per WS (encoding), assignment of tasks to WSs (decoding), the total task time per variant per WS (decoding), and in-between buffers capacity (encoding)

4.1.3. SMO-Based Fitness Function Evaluation of the RMS Solution

To guide the optimization and enable NSGA-II to perform the non-dominated ranking, the simulation measures and provides the fitness function of the solutions. To this end, each RMS solution is mapped to the simulation component, where a simulation scenario is built according to the information received from the optimization. These sets of scenarios are simulated, including the production variabilities in terms of availability of resources, failures, setup times, and production proportions. For each scenario, the simulation component calculates the value of the objective functions in terms of THP and TBC before they are fetched back to the optimization component.

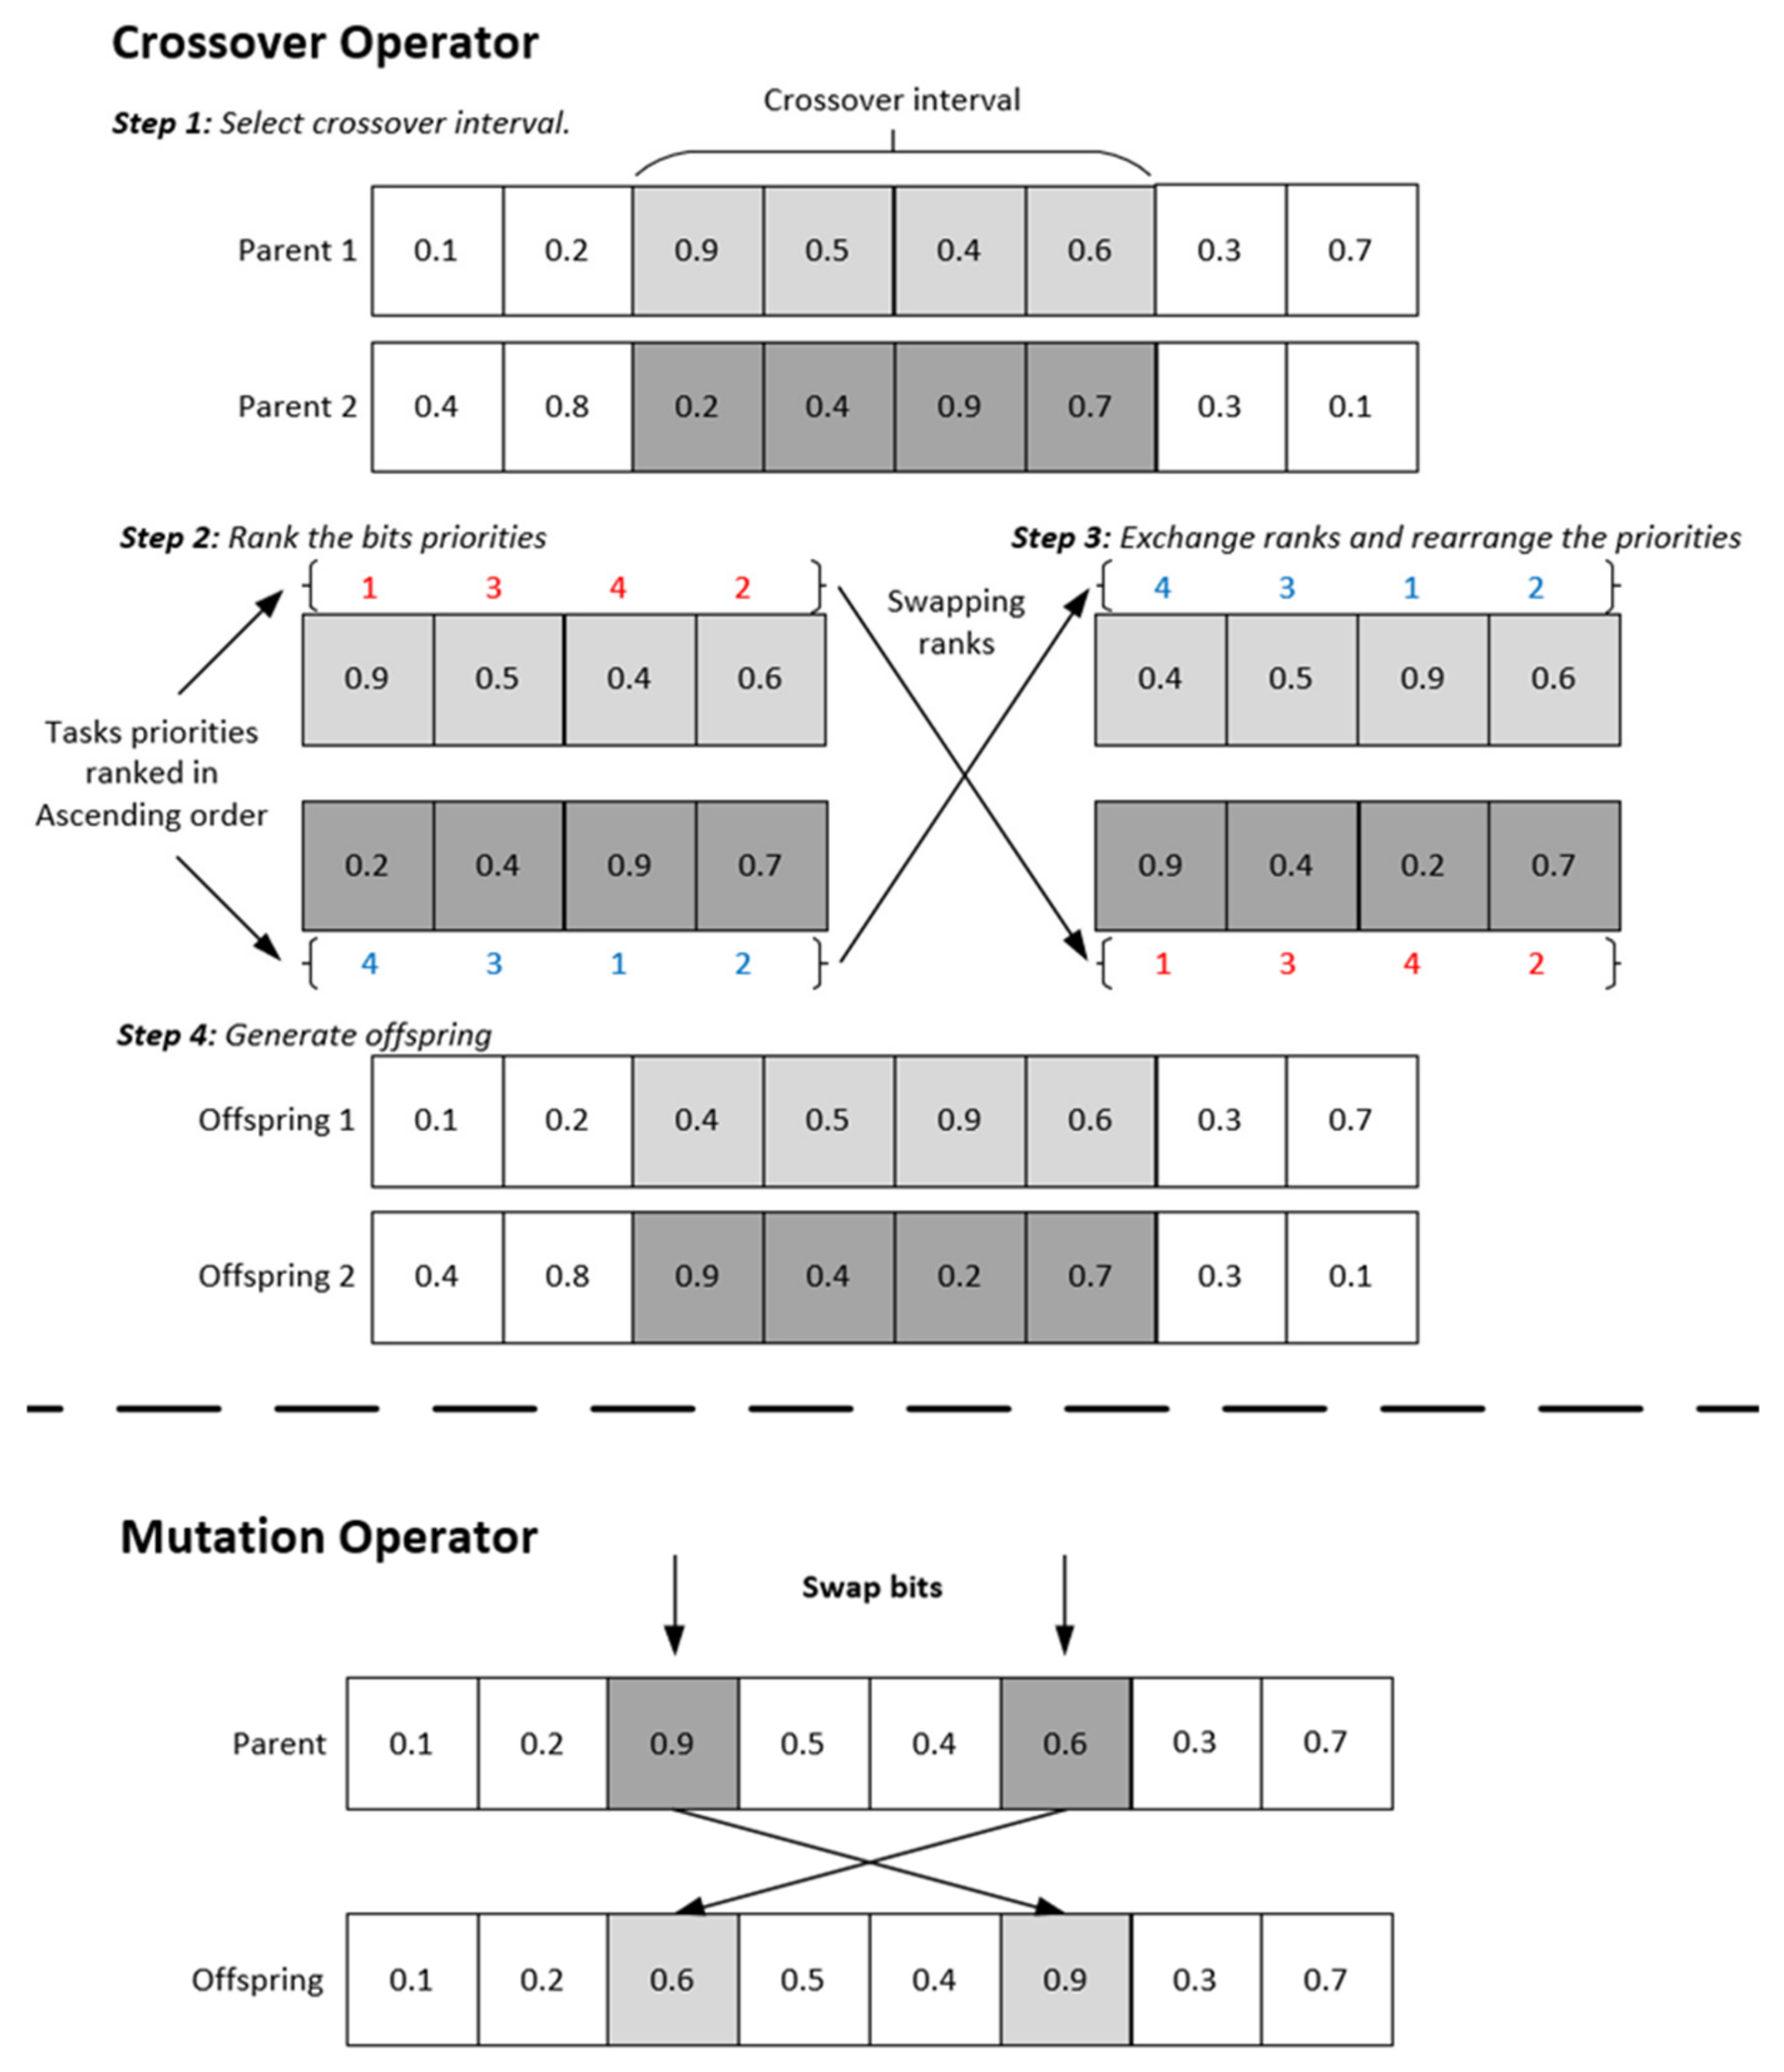
4.1.4. Genetic Operators (Crossover/Mutation)

To preserve diversity between generations, the genetic operator takes place randomly in each generation, as inspired by biological processes. To ensure that the best solutions are more likely to get more copies, tournament selection is used to select the best solutions to be preserved based on the SMO-based fitness function evaluation. Then, they go through the crossover and the mutation operators to generate a new diverse population. The crossover and mutation probabilities ( c p   and   m p ) of the genetic operators indicate the percentage of the population that will go through these processes.
A two-points-based weight mapping crossover is implemented. This crossover operator can be explained in four steps. The first step randomly chooses two intervals on the chromosomes of two selected solutions (parents). In the second step, the bits included in the crossover interval are ranked in ascending order based on their priority values. A lower ranking value indicates a bit with a higher priority. In the third step, the ranks between the chosen intervals are swapped between the parents, and the priorities are rearranged based on the new ranks. Therefore, the offspring are generated according to the newly mapped priorities in the four steps. The upper part of Figure 3 illustrates the implemented crossover steps.
The implemented mutation operator swaps the values of two randomly selected bits. The bits that are not selected are preserved from the parent. The bottom part of Figure 3 illustrates the mutation operator, where the darker bits represent those that are swapped.
The applicability of the proposed SMO-NSGA-II is demonstrated using an application case and its multiple instances described in the next section.

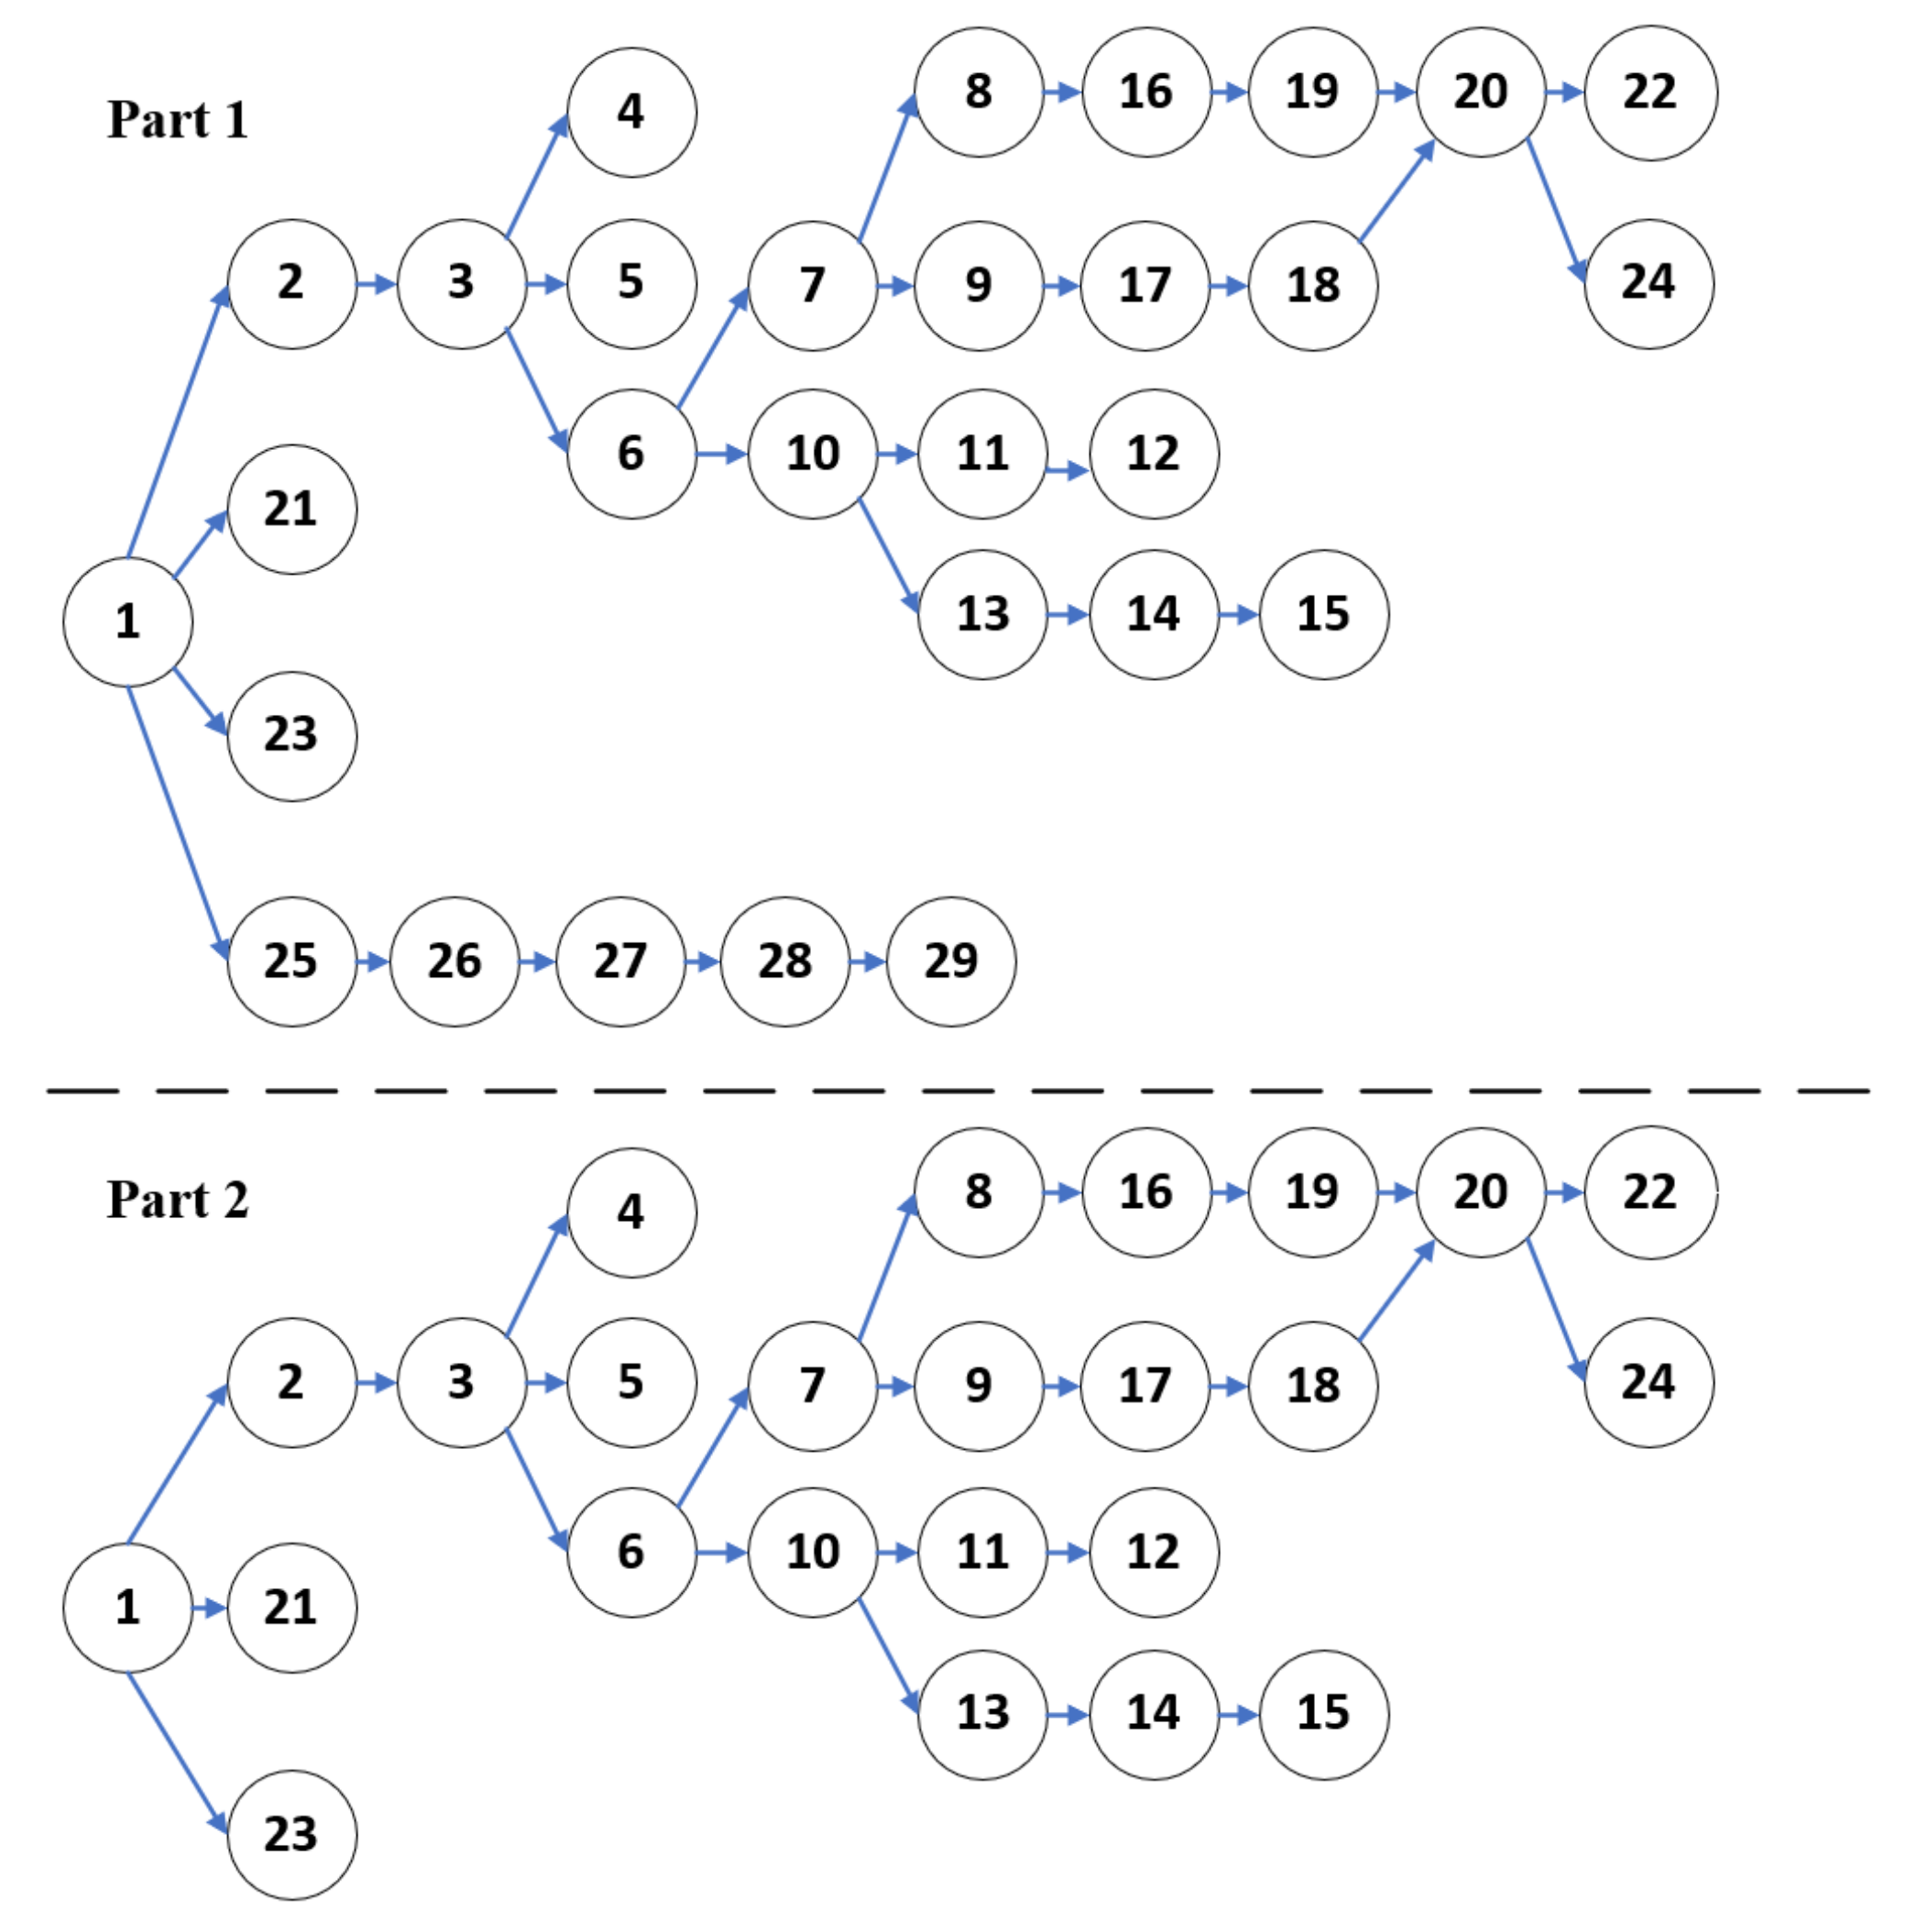
5. An Application Case with Multiple Instances

The case is based on an MPFL at a R&D facility of a truck manufacturer in Sweden, where the manufacturer tests and evaluates future concepts. The system manufactures two product families. The company has invested in three reconfigurable WSs in which the resources can be added, removed, or reallocated to a different WS if required due to production changes. Each WS has space for up to five resources (e.g., operators). Figure 4 represents an example of the MPFL in which there are seven operators configured in a 3-2-2 setting, meaning three operators in the first WS, and two operators in each of the remaining WSs. It can be observed that there are two, three, and three extra spaces remaining for resources in the first, second, and third WS, respectively. Furthermore, the WSs of this MPFL are subjected to uncertainty and variability, and they consider a specific availability and mean time to repair (MTTR). The availability is considered to be 85% with a 10-minute MTTR. There are two inter-station buffers with a minimum safety capacity of Bmin = 1 and a maximum buffer capacity of Bmax = 40. Additionally, the buffers require 5 s for loading/unloading as the material handling times.
In the studied case, the two product families must be produced at specific volumes to meet customers’ demands. As the customers’ demands vary over time, the MPFL configuration, the components of the system, and the process plan evolve accordingly to meet the new requirements. Changes in the line involve the total number of resources needed, the layout configurations in the WSs, as well as the assignment of the tasks to the resources. Moreover, a configuration change is required to accommodate a new demand requirement, which also implies changes in buffer capacity. The manufacturing company was interested in finding out the production capacity of the MPFL with an initial investment of seven operators for different production proportions, i.e., 70/30 (70% part 1 and 30% part 2) and 30/70. In addition, the company also requested information regarding the capacity that could be gained if one and two operators were added to the system, including where they needed to be placed according to the desired production proportion and the new optimized tasks assignment of both parts. This study simultaneously strives for maximum THP and minimum TBC as the optimization objectives, while deciding on the capacity of the buffers in the line and the allocation of resources and tasks to WSs according to the desired scenarios.
The total task time of Part 1 is 336.38 s, divided into 29 tasks, while the total processing time of Part 2 is 293.38 s, divided into 24 tasks. Figure 5 shows the precedence relationship of the tasks for both parts.

6. Experimental Results and Knowledge Discovery

The SMO-NSGA-II approach is implemented in MATLAB VERSION 2022a and Facts Analyzer version 3.1.7. The experiments include six different scenarios that investigate the above-explained RMS under variable production proportions utilizing a scalable number of operators. A baseline simulation model of the RMS was developed in the mentioned DES software to be used in the proposed SMO approach. Every scenario was optimized using 500 generations and a population size of 50.
Figure 6 illustrates the objective space of the non-dominated solutions found by the proposed SMO-NSGA-II for the RMS regarding the studied scenarios. According to this figure and as it was expected, the more operators used, the higher the THP of the system.
To better explain the results in Figure 6, the obtained ranges for the THP, the capacities of the inter-station buffers (Bu1 and Bu2), and the TBC (sum of Bu1 and Bu2) for each scenario are shown in Table 1. Each scenario in the table is characterized by the number of operators used (NO) and the production proportion. Considering the maximum THP obtained as the results of different scenarios shown in Table 1, one can observe that the optimized average THP increases that can be gained from every operator added to the considered RMS are approximately 9.64 JPH (jobs per hour) for the 30/70 proportion and 8.11 JPH for the 70/30 proportion. This is important for engineers to consider when scaling up (or down) the system to adjust the production volume required.
Table 2 presents how the results presented in Table 1 are attained in terms of the system configuration (operators per WS) and the task allocations per WS. Under columns WS1, WS2, and WS3, the number of parallel operators employed in Workstations 1, 2, and 3 are presented, respectively. The last column shows the number of tasks performed at each WS (i.e., no. tasks allocated to WS1/no. tasks allocated to WS3/no. tasks allocated to WS3). Note that the more operators at a WS, the more tasks assigned to the WS. Additionally, it is shown that, in most cases, the number of tasks per WS ranges among the non-dominated solutions.
An overview of a core tenant of this approach, the assignment of tasks to WSs, and the related pattern in the non-dominated solutions are presented in Figure 7. In this figure, each row represents one solution, and each column illustrates one task for either Part 1 or 2. Moreover, the color of the cells indicates the WS where the related task (A indicates tasks from Part 1 and E indicates tasks from Part 2) of each part has been assigned. The figure shows how most non-dominated solutions for each scenario share common task allocations. Nonetheless, all solutions shown in Figure 7 are distinct in terms of the allocation of the inter-station buffers.

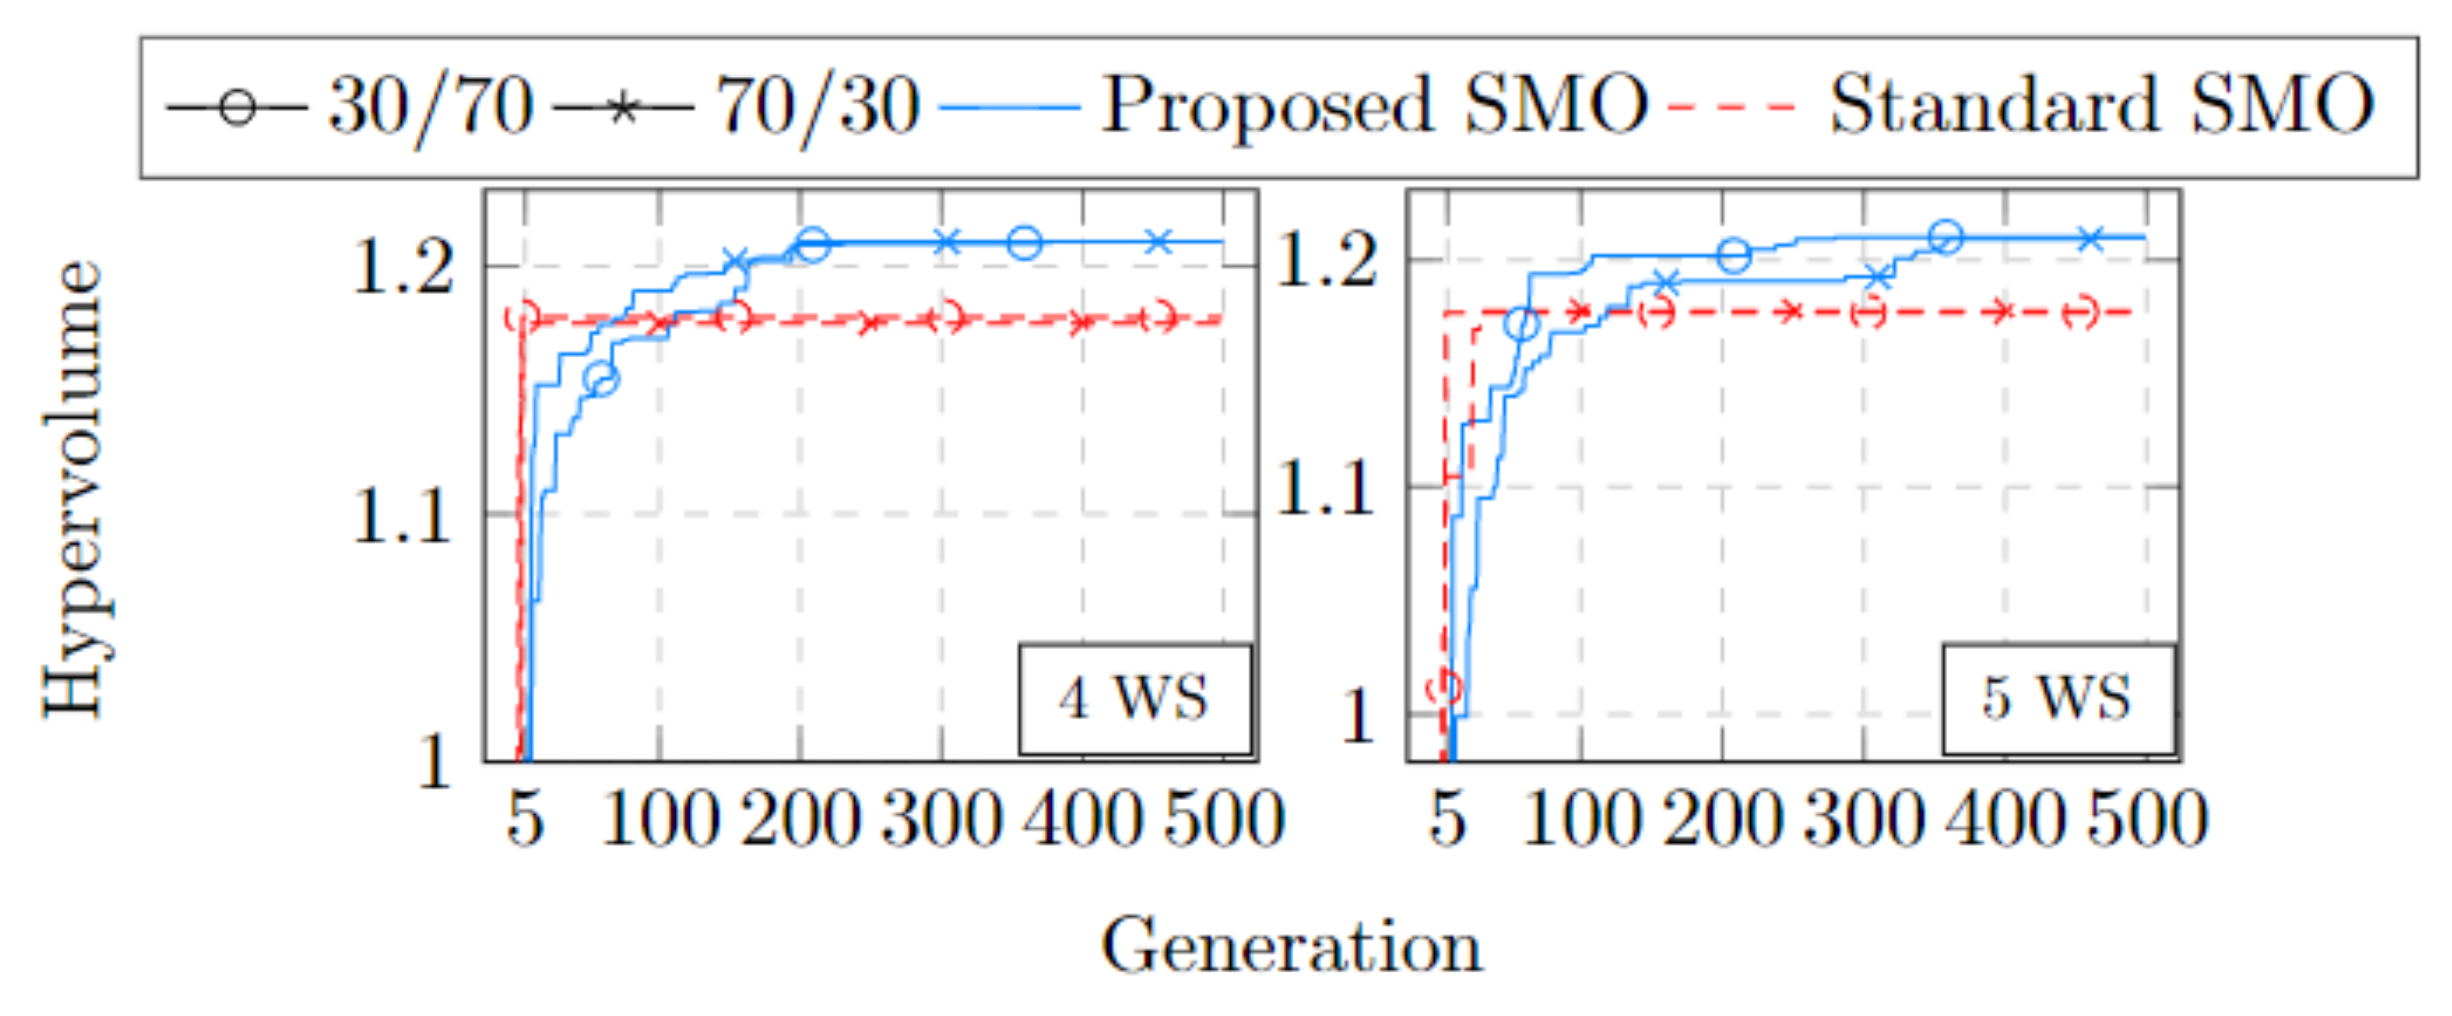
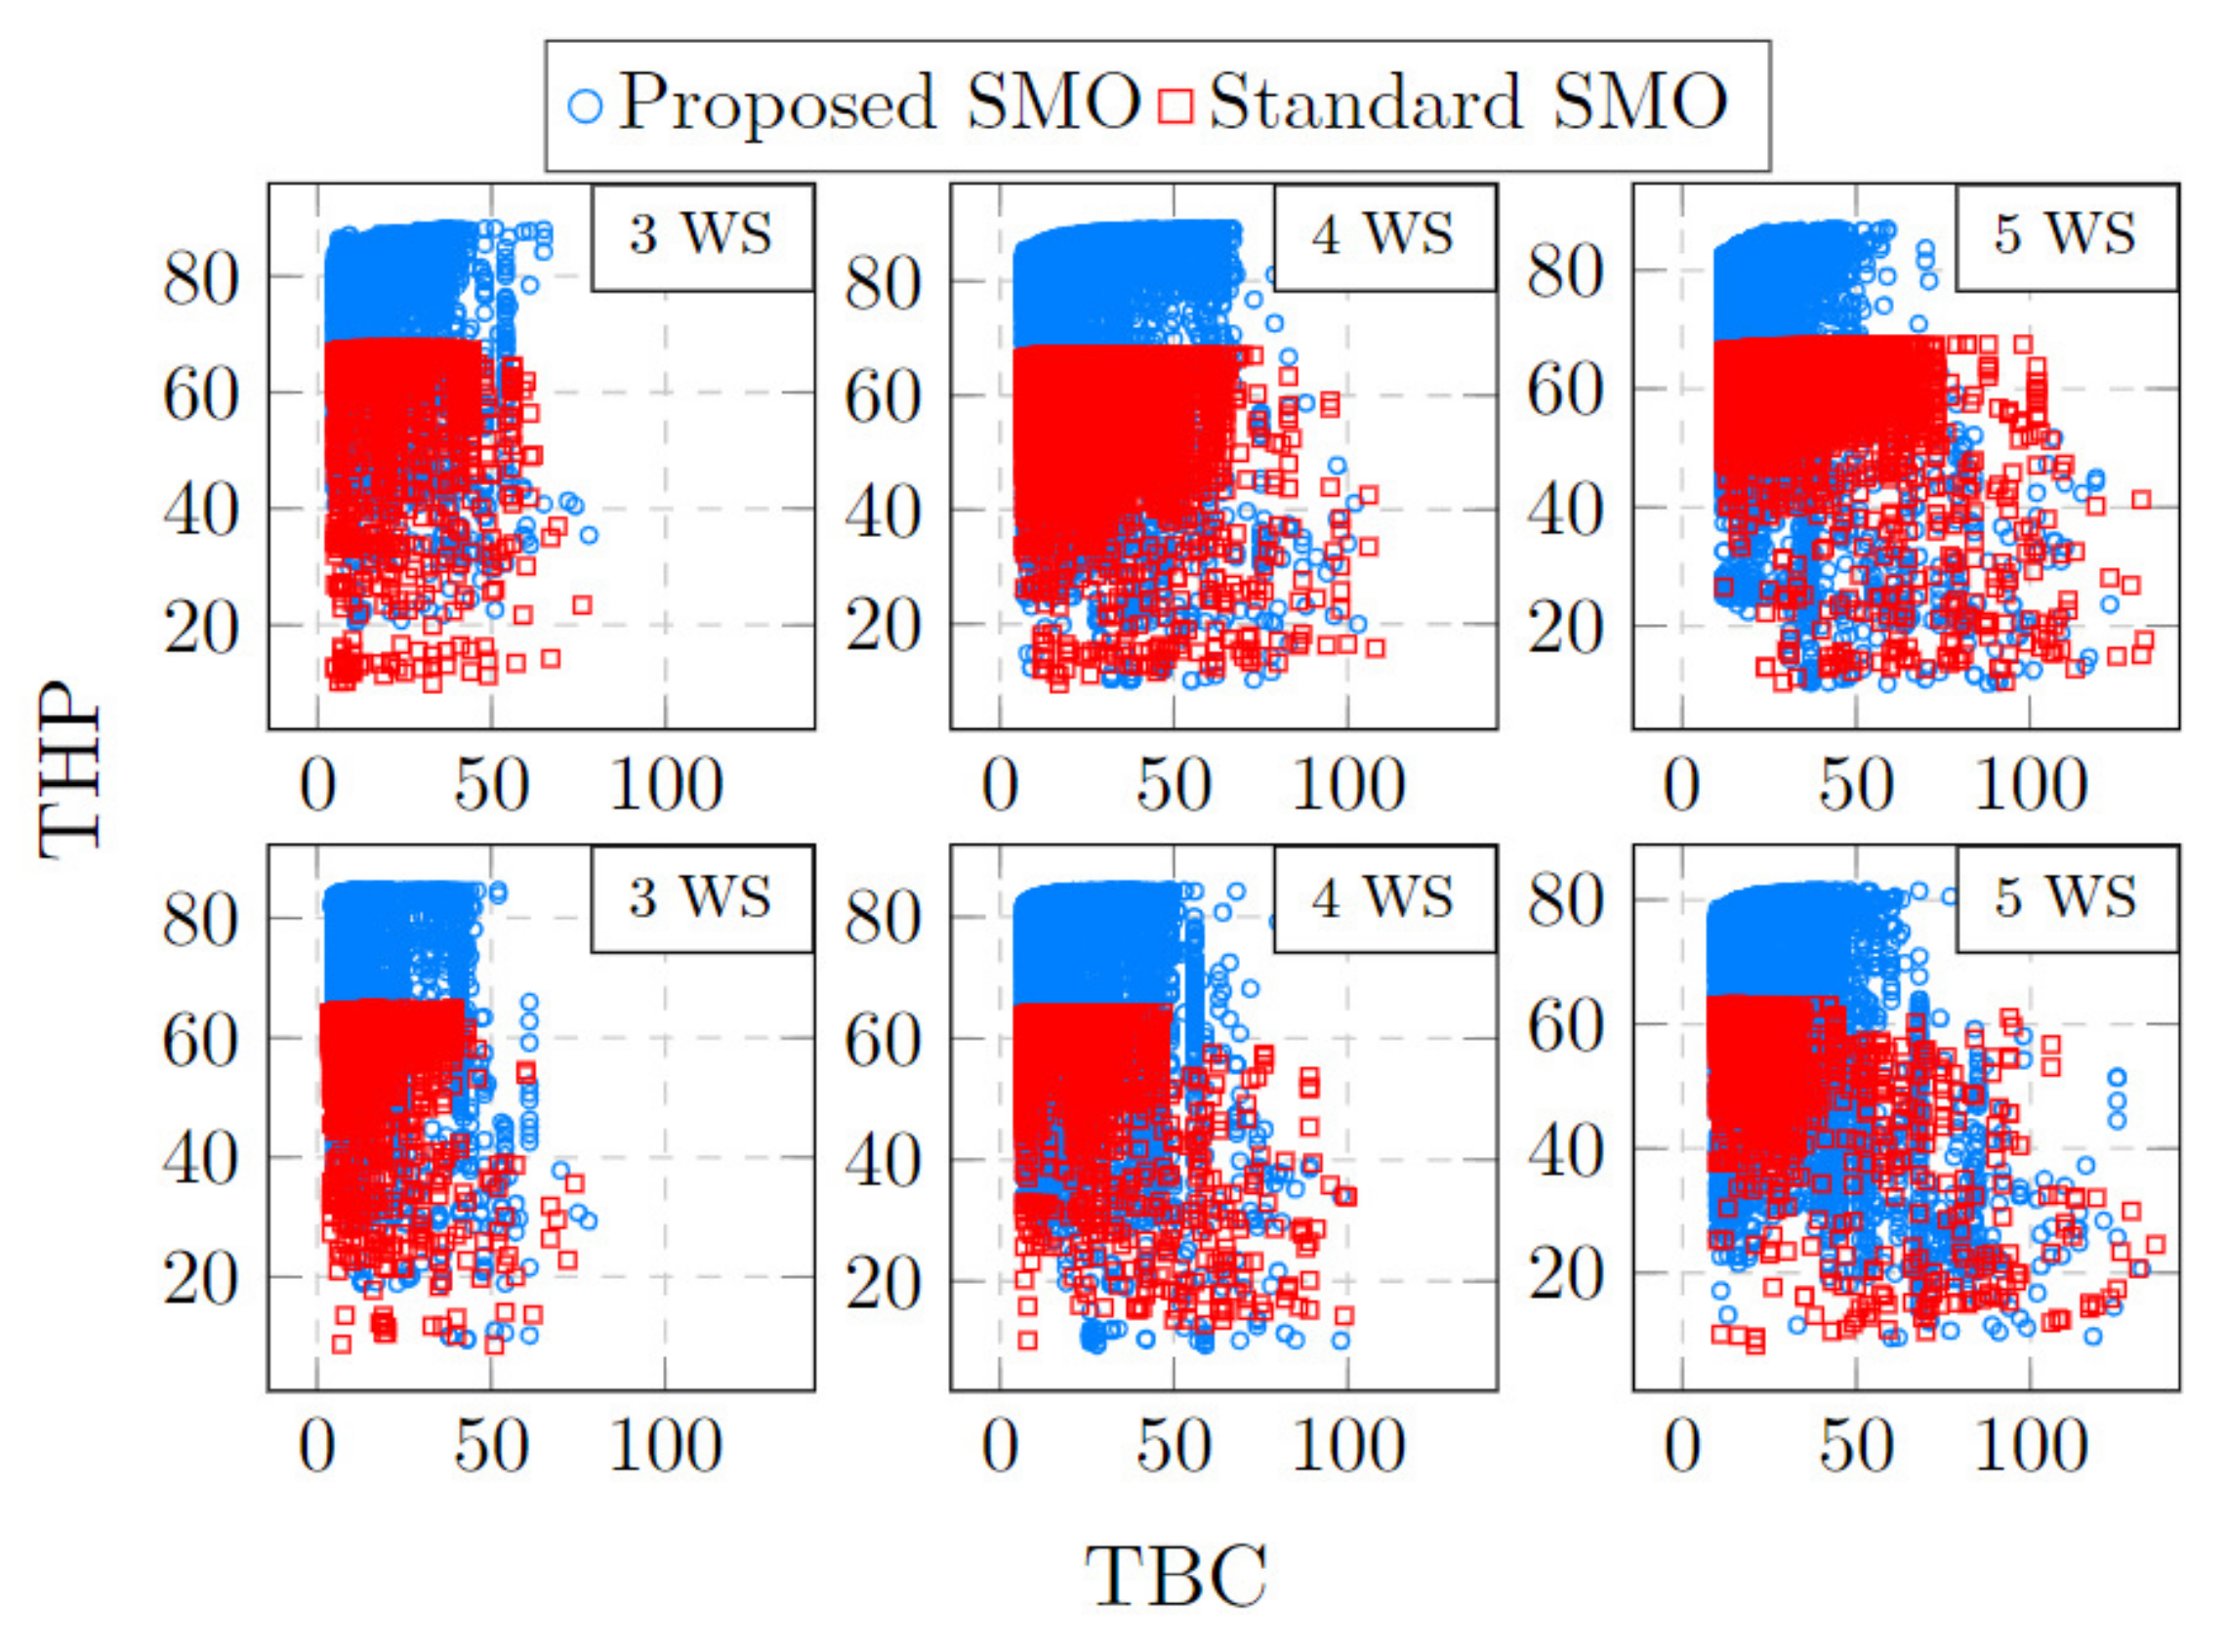
6.1. Approach Comparison

In this subsection, the proposed SMO-NSGA-II is compared to the standard SMO approach presented by [1] for RMS, in which both optimization and simulations are run on the standard SMO approach. This comparison aims to explore whether the proposed SMO approach with customized procedures improves the resulting RMS solutions. To this end, the same scenarios were implemented and optimized using the standard SMO approach and the same algorithm settings for the considered RMS application and its multiple instances. The abovementioned study proved that the standard SMO approach was effective for an industrial RMS application. However, the total number of decision variables was much lower, mainly due to the total number of tasks of the produced products, which was 25 tasks compared to the 53 tasks involved in the current RMS. The standard SMO approach uses a commercial NSGA-II embedded in the software that does not allow customization of specific procedures such as encoding and decoding, leading to a repair mechanism.
A comparison of the convergence rates of the standard SMO and the proposed SMO approaches is shown in Figure 8 by plotting the hypervolume (HV) [64] of the optimization algorithms at each generation. The higher the HV, the better the quality of the obtained solutions. According to this figure, one can observe that the proposed SMO approach has better convergence than the standard SMO approach in finding Pareto-optimal RMS solutions.
Furthermore, the HV of the non-dominated solutions obtained by the optimization approaches for different scenarios, including the number of operators (NO) and the production proportions, are shown in Table 3. The comparison of results in Table 3 indicates that, in all considered scenarios, a considerable improvement in HV was achieved when the proposed SMO approach was applied. These improvements can be explained by the customization of NSGA-II performed in the proposed SMO approach, enabling the optimization algorithm to deal with larger and more complex RMS applications.
To further validate that the proposed SMO approach outperforms the standard SMO approach, not just when increasing the number of operators used, we increased the number of WSs in the system. In this case, a new set of optimization scenarios was designed for the system using nine operators but distributed in four and five WSs with the same production proportions considered above.
The convergence rate plots, presented in Figure 9, for the system with four and five WSs also confirm a better convergence for the proposed SMO approach when finding the Pareto-optimal front. Similarly, the HV obtained from both approaches for the non-dominated solutions indicates significant improvements for the four new scenarios tested, as shown in Table 4.
A better convergence rate and HV performance can also be observed when plotting the solutions in the objective space. Figure 10 presents all solutions for the proposed SMO (blue points) and the standard SMO (red points) approaches for three, four, and five WSs. The three upper graphs in the figure refer to the 30/70 proportion scenarios, while the three lower graphs refer to the 70/30 proportion scenarios. As expected, the figure shows that, regardless of the number of WSs used in the system, the proposed SMO approach still outperforms the standard SMO approach, reaching significantly better solutions regarding the conflicting objectives.

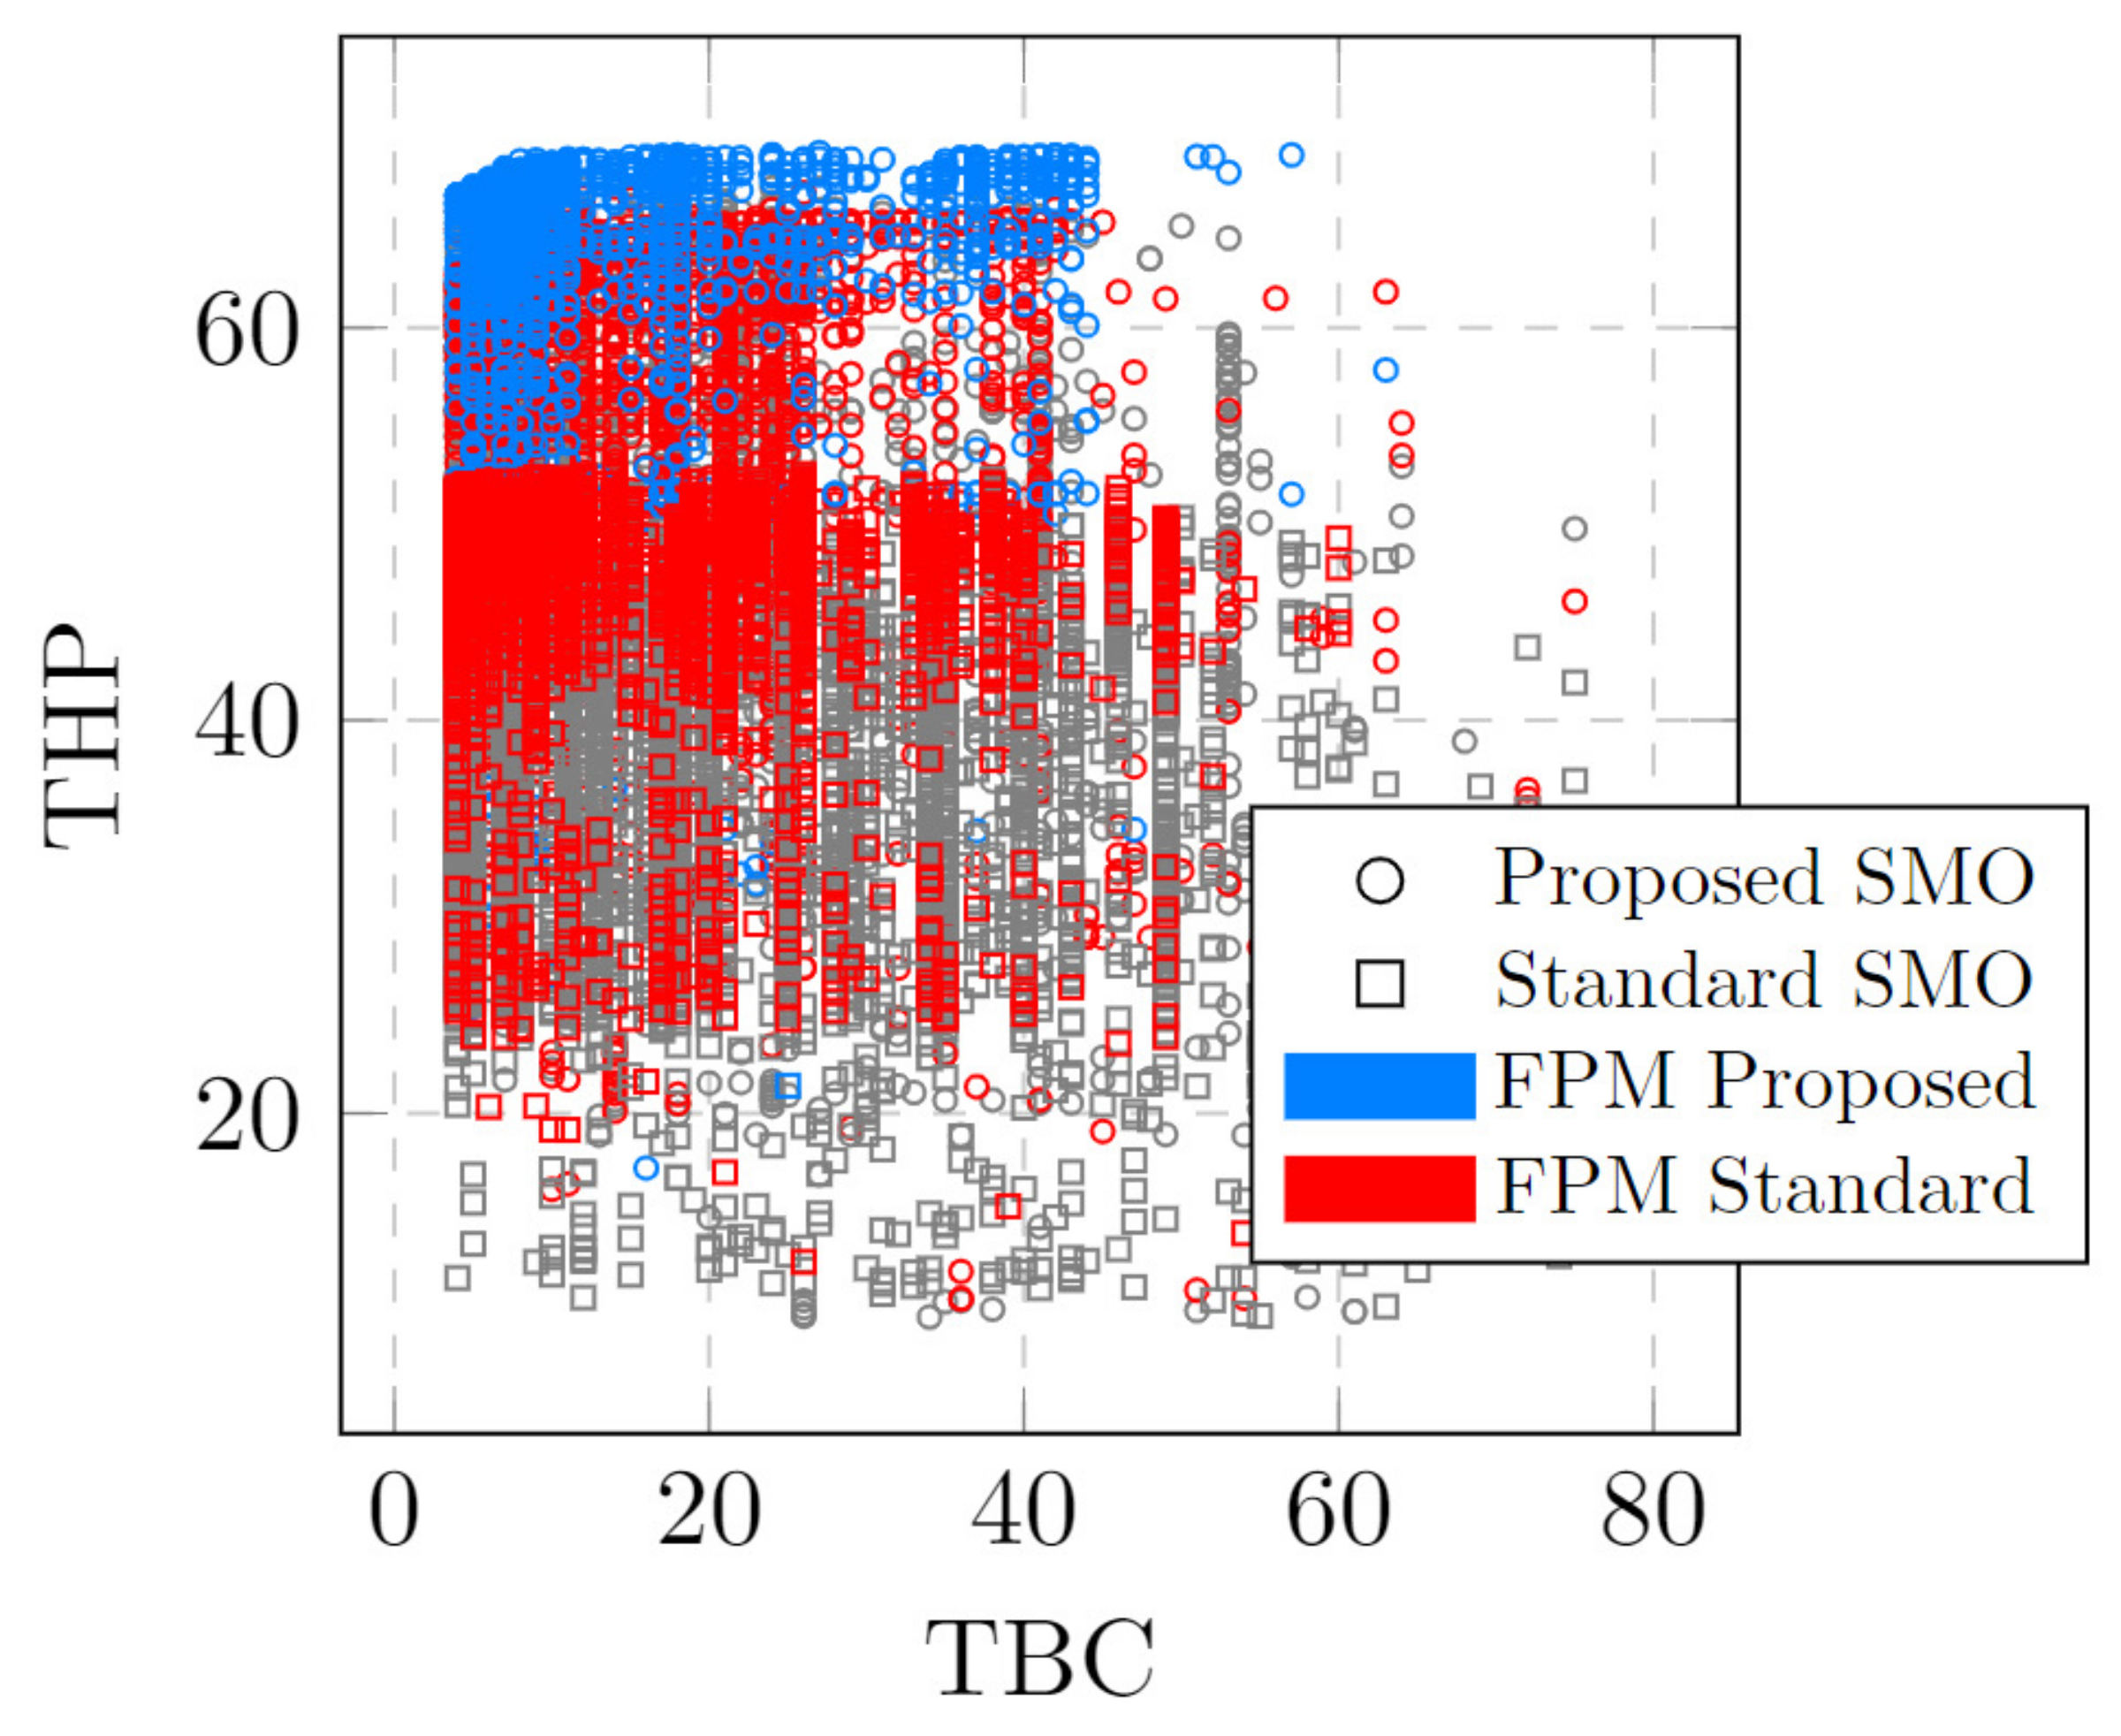
6.2. Knowledge Discovery from SMO

This subsection presents the knowledge discovered by applying FPM to datasets generated by the proposed optimization approach. Due to the ability of an RMS to increase and decrease the number of resources to address, among other challenges, fluctuating production volumes, in this study, we focused on discovering generalized knowledge regarding the different numbers of operators employed and the production proportions for the two products in the considered RMS application and its multiple instances. Therefore, to run the FPM procedure, the scenarios were merged into five groups in terms of the different numbers of operators and production proportions. FPM generates knowledge in the form of decision rules, and we focused on generating knowledge for both task allocations per WS and buffer allocations.
For each group, we ran FPM with the non-dominated solutions from the involved scenarios as the selected set while keeping the remaining solutions (dominated and non-dominated) as the unselected set. In this way, general knowledge was discovered between the scenarios. Because of the high number of decision variables involved that impacted the run time of the FPM procedure, the maximum level of rule interactions was limited to five, and the minimum required significance of the rules that described the selected set was set to 90%. The openly available decision support tool Mimer (https://assar.his.se/mimer/html/, accessed on 15 January 2023) was employed to generate the results. Mimer enables the interactive knowledge discovery framework for MOO proposed in [65]. The rule interactions found by using FPM regarding task allocations are presented in Table 5, where “A” and “E” refer to the related tasks for Part 1 and Part 2, respectively. The value of the variable represents in which WS the task was assigned. As an example, the first rule of the table, for the case with seven operators, states that in 100% of the solutions found in the Pareto-front, for Part 1, Task 10 was set to WS 2, whereas for Part 2, Task 5 was set to WS 2, Task 23 was set to WS 1, Task 4 was not set to WS 3, and Task 6 was not set to WS 1.
Looking at the rules presented in Table 5, we can see that the scenario with seven operators has the highest ratio significance of 100% and unselected significance of 10.49%, meaning that all non-dominated solutions support the rules found while only 10.49% of the unselected set of solutions support the rule interaction. This implies that the non-dominated solutions in this scenario are perhaps easier to distinguish than the rest. Another highlighted aspect from the rules of the seven operators scenario is a higher involvement of tasks for Part 2 than for Part 1. This could indicate that Part 2 needs to be prioritized over Part 1 when seven operators are employed regardless of the production proportion. Additionally, it can also be seen that the scenarios focused on the number of operators have a lower unselected significance than those focused on the production proportion. Therefore, more general knowledge is extracted regarding the number of operators employed in the system than the production proportion.
Decision makers can use the results presented in the table to identify which tasks to prioritize when a new scenario needs to be optimized. Another interesting aspect extracted is the importance of some tasks. When looking at the table, it can be seen that Task E23 (Task 23 of Part 2) is repeated in almost all the rules, suggesting the relevance of this task for the overall RMS. Furthermore, as can be interpreted from the rules, E23 does not take the value 3; in fact, in all the cases, one is equal to 1, meaning that this specific task should, instead, be allocated at the beginning of the RMS and never in the last WS. Furthermore, Table 5 shows that, regarding the decision rules extracted for all studied scenarios, except for the scenario with eight operators, there is a higher involvement of Part 2 than that of Part 1. This suggests that decision makers could prioritize the assignment of the tasks for Part 2 over Part 1, even in cases where the production of Part 1 is greater such as 70% of Part 1 and 30% of Part 2 production volumes. Consequently, with this information, decision makers can better understand which decision variables are more critical and how they impact the overall performance of the system. It is important to note that the rules in the table best distinguish the selected set from the unselected set. A rule would not be interesting if it has both a high significance and a high unselected significance; only the rules unique to the non-dominated solutions in each group of scenarios distinguish the selected and unselected sets.
Table 6 presents the decision rules extracted regarding WSs and buffer allocation. Similar to the rules describing task allocations presented in Table 5, the unselected significance of the results in Table 6 confirms that it is more difficult to generalize knowledge regarding production proportion compared to the number of operators used. Additionally, we can see that the unselected significance results for the rules in Table 6 are higher than in Table 5, meaning it is more difficult to distinguish the scenarios based on the workstation and buffer allocation. This is, however, expected since the number of variables considered in Table 5 is much greater (53) than the number of variables considered in Table 6 (5). Furthermore, the rules presented in Table 6 provide information regarding operators’ load per WS, hinting at which WSs need a higher or lower number of operators. Likewise, interesting aspects can be extracted from the rules regarding the inter-station buffers, for example, the rules display information regarding each buffer’s maximum capacity, which decision makers can use when deciding on new scenarios. This analysis shows that the FPM procedure can provide decision makers with a better knowledge of the system and consequently save time and cost.
The employed FPM methods and knowledge discovery can also be used to compare the performances of the SMO approaches. The significance of the rules indicates their quality in achieving better results. For comparison purposes, we ran FPM regarding work task allocations using the datasets generated by the standard SMO approach. Table 7 displays the decision rules. The results presented in this table are particularly different from the rules presented in Table 5, implying that the standard SMO approach did not converge to optimal solutions.
In addition, the significance/insignificance relationship of the rules, displayed in Table 7, indicates they are less relevant to achieve better results when compared to those displayed in Table 5. This is further exposed for the seven machines scenario, as shown in Figure 11. This figure presents both datasets, where a circle indicates solutions from the proposed SMO approach and a square indicates a solution from the standard SMO approach. The solutions that match the rules for seven machines extracted through the proposed SMO are highlighted in blue, and the solutions that match the rules extracted from the standard SMO approach are highlighted in red in both datasets. On the one hand, the number of solutions that match the rules extracted from the proposed SMO approach is significantly smaller than those matching the rules from the standard SMO approach. Since almost no blue points were found in the standard SMO dataset, this demonstrates the uniqueness and quality of the rules extracted from the proposed SMO approach dataset. On the other hand, many solutions match the rules extracted from the standard SMO approach regardless of the dataset. This proves that the rules extracted from the standard SMO dataset are not unique and do not represent the optimal solutions. Many of the solutions in the proposed SMO dataset match the rules extracted from the standard SMO dataset; however, as shown in Figure 11, they do not provide the best performance. Consequently, evaluating the quality of the rules extracted using FPM supports the statement from Section 6.1, where the proposed SMO approach outperforms the standard SMO approach.

7. Conclusions

In the current uncertainty and competitiveness of the market, RMS applications play a significant role in the success of manufacturing industries. However, prior SMO research that has considered the variability of RMS applications is scarce and neglects knowledge discovery to support decision makers. This study introduced a novel SMO approach to concurrently address the main challenging areas by combining task and resource assignments with the configuration of a system in a scalable MPFL, while considering the buffer allocation dilemma as an additional decision variable and the unreliability of the system. A customized SMO-NSGA-II approach was developed with specifically designed solution representation, encoding, and decoding mechanisms combined with a simulation component where the RMS solutions could be evaluated in terms of conflicting objectives, namely, the THP and TBC. The performance of the proposed SMO approach was tested against the standard SMO approach in the studied application with its multiple instances. The experimental results show the proposed SMO approach is promising in finding Pareto-optimal solutions compared to the standard SMO approach. It should be emphasized that instead of comparing the performance of the customized NSGA-II with other optimization algorithms, the current study focuses on showing how the performance of an ordinary SMO algorithm, such as NSGA-II, can be significantly enhanced by the problem-customized genetic representation. Furthermore, due to the ever-increasing amount of data generated by the MOO of an RMS, which is required to address frequent market changes, this study demonstrates how knowledge discovery and data mining methods can be used for extracting decision rules from RMS problem instances.
Essentially, the proposed enhanced SMO approach provides fast decision support for RMS production planning, especially when facing fluctuating production volumes. To this extent, the proposed approach supports decision makers with key information to enable an RMS with the capability to provide the required production capacity when needed. Specifically, this approach reveals underlying information that facilitates understanding the RMS and how the decision variable affects the performance of the system. This study used the FPM procedure to generate significant knowledge in the form of decision rules that describe the tasks and resource allocations to workstations and buffer capacity allocations for all considered scenarios.
Future research will use the generated knowledge to achieve faster optimization of additional scenarios using a process known as knowledge-driven optimization (KDO) [25]. Since FPM generates knowledge in the form of explicit decision rules, it would be straightforward for an optimizer to incorporate rules describing a general scenario into a future optimization run by applying the rules as constraints in the decision space. Future work may also consider additional RMS aspects, such as sustainability and reconfiguration frequency.

Author Contributions

Conceptualization, C.A.B.-D.; methodology, C.A.B.-D.; software, C.A.B.-D., A.N. and H.S.; validation, C.A.B.-D. and A.N.; formal analysis, C.A.B.-D. and H.S.; investigation, C.A.B.-D., A.N., H.S., T.A. and A.H.C.N.; data curation, C.A.B.-D. and H.S.; writing—original draft preparation, C.A.B.-D., A.N. and H.S.; writing—review and editing, C.A.B.-D., A.N., H.S.,T.A. and A.H.C.N.; visualization, C.A.B.-D. and H.S.; supervision, A.N., T.A. and A.H.C.N.; project administration, C.A.B.-D., A.N. and H.S.; funding acquisition, A.H.C.N. All authors have read and agreed to the published version of the manuscript.

Funding

This research was funded by the Knowledge Foundation, Sweden (KKS) through the KKS Profile Virtual Factories with Knowledge-Driven Optimization, VF-KDO, grant number [2018-0011].

Data Availability Statement

The data that support the findings of this study are available upon request.

Acknowledgments

The authors thank the Knowledge Foundation, Sweden (KKS) for funding this research through the KKS Profile Virtual Factories with Knowledge-Driven Optimization, VF-KDO, grant number 2018-0011.

Conflicts of Interest

The authors report there are no competing interest to declare.

References

  1. Diaz, C.A.B.; Aslam, T.; Ng, A.H.C. Optimizing Reconfigurable Manufacturing Systems for Fluctuating Production Volumes: A Simulation-Based Multi-Objective Approach. IEEE Access 2021, 9, 144195–144210. [Google Scholar] [CrossRef]
  2. Dou, J.; Li, J.; Xia, D.; Zhao, X. A Multi-Objective Particle Swarm Optimisation for Integrated Configuration Design and Scheduling in Reconfigurable Manufacturing System. Int. J. Prod. Res. 2020, 59, 3975–3995. [Google Scholar] [CrossRef]
  3. Koren, Y.; Wang, W.; Gu, X. Value Creation through Design for Scalability of Reconfigurable Manufacturing Systems. Int. J. Prod. Res. 2017, 55, 1227–1242. [Google Scholar] [CrossRef]
  4. Koren, Y.; Heisel, U.; Jovane, F.; Moriwaki, T.; Pritschow, G.; Ulsoy, G.; van Brussel, H. Reconfigurable Manufacturing Systems. CIRP Ann. 1999, 48, 527–540. [Google Scholar] [CrossRef]
  5. Diaz, C.A.B.; Aslam, T.; Ng, A.H.C.; Flores-Garcia, E.; Wiktorsson, M. Simulation-Based Multi-Objective Optimization for Reconfigurable Manufacturing System Configurations Analysis. In Proceedings of the 2020 Winter Simulation Conference, Orlando, FL, USA, 14–18 December 2020; pp. 1527–1538. [Google Scholar] [CrossRef]
  6. Koren, Y.; Gu, X.; Guo, W. Reconfigurable Manufacturing Systems: Principles, Design, and Future Trends. Front. Mech. Eng. 2018, 13, 121–136. [Google Scholar] [CrossRef] [Green Version]
  7. Fan, J.; Zhang, C.; Liu, Q.; Shen, W.; Gao, L. An Improved Genetic Algorithm for Flexible Job Shop Scheduling Problem Considering Reconfigurable Machine Tools with Limited Auxiliary Modules. J. Manuf. Syst. 2022, 62, 650–667. [Google Scholar] [CrossRef]
  8. Bortolini, M.; Galizia, F.G.; Mora, C. Reconfigurable Manufacturing Systems: Literature Review and Research Trend. J. Manuf. Syst. 2018, 49, 93–106. [Google Scholar] [CrossRef]
  9. Yelles-Chaouche, A.R.; Gurevsky, E.; Brahimi, N.; Dolgui, A. Reconfigurable Manufacturing Systems from an Optimisation Perspective: A Focused Review of Literature. Int. J. Prod. Res. 2020, 59, 6400–6418. [Google Scholar] [CrossRef]
  10. Koren, Y.; Gu, X.; Guo, W. Choosing the System Configuration for High-Volume Manufacturing. Int. J. Prod. Res. 2018, 56, 476–490. [Google Scholar] [CrossRef]
  11. Dou, J.; Dai, X.; Meng, Z. Optimisation for Multi-Part Flow-Line Configuration of Reconfigurable Manufacturing System Using GA. Int. J. Prod. Res. 2010, 48, 4071–4100. [Google Scholar] [CrossRef]
  12. Goyal, K.K.; Jain, P.K.; Jain, M. Optimal Configuration Selection for Reconfigurable Manufacturing System Using NSGA II and TOPSIS. Int. J. Prod. Res. 2012, 50, 4175–4191. [Google Scholar] [CrossRef]
  13. Pehrsson, L.; Frantzén, M.; Aslam, T.; Ng, A.H.C. Aggregated Line Modeling for Simulation and Optimization of Manufacturing Systems. In Proceedings of the 2015 Winter Simulation Conference, Huntington Beach, CA, USA, 6 December 2015; pp. 3632–3643. [Google Scholar]
  14. Mourtzis, D. Simulation in the Design and Operation of Manufacturing Systems: State of the Art and New Trends. Int. J. Prod. Res. 2020, 58, 1927–1949. [Google Scholar] [CrossRef]
  15. Petroodi, S.E.H.; Eynaud, A.B.D.; Klement, N.; Tavakkoli-Moghaddam, R. Simulation-Based Optimization Approach with Scenario-Based Product Sequence in a Reconfigurable Manufacturing System (RMS): A Case Study. IFAC-PapersOnLine 2019, 52, 2638–2643. [Google Scholar] [CrossRef]
  16. Juan, A.A.; Faulin, J.; Grasman, S.E.; Rabe, M.; Figueira, G. A Review of Simheuristics: Extending Metaheuristics to Deal with Stochastic Combinatorial Optimization Problems. Oper. Res. Perspect. 2015, 2, 62–72. [Google Scholar] [CrossRef] [Green Version]
  17. Niño-Pérez, E.; Méndez-Vázquez, Y.M.; Arias-González, D.E.; Cabrera-Ríos, M. A Simulation–Optimization Strategy to Deal Simultaneously with Tens of Decision Variables and Multiple Performance Measures in Manufacturing. J. Simul. 2018, 12, 258–270. [Google Scholar] [CrossRef]
  18. Xu, J.; Huang, E.; Hsieh, L.; Lee, L.H.; Jia, Q.S.; Chen, C.H. Simulation Optimization in the Era of Industrial 4.0 and the Industrial Internet. J. Simul. 2016, 10, 310–320. [Google Scholar] [CrossRef]
  19. Barrera Diaz, C.A.; Fathi, M.; Aslam, T.; Ng, A.H.C. Optimizing Reconfigurable Manufacturing Systems: A Simulation-Based Multi-Objective Optimization Approach. Procedia CIRP 2021, 104, 1837–1842. [Google Scholar] [CrossRef]
  20. Bensmaine, A.; Dahane, M.; Benyoucef, L. A Simulation-Based Genetic Algorithm Approach for Process Plans Selection in Uncertain Reconfigurable Environment. IFAC Proc. Vol. 2013, 46, 1961–1966. [Google Scholar] [CrossRef]
  21. Deb, K.; Pratap, A.; Agarwal, S.; Meyarivan, T. A Fast and Elitist Multi-objective Genetic Algorithm: NSGA-II. IEEE Trans. Evol. Comput. 2002, 6, 182–197. [Google Scholar] [CrossRef] [Green Version]
  22. Michalos, G.; Makris, S.; Mourtzis, D. An Intelligent Search Algorithm-Based Method to Derive Assembly Line Design Alternatives. Int. J. Comput. Integr. Manuf. 2012, 25, 211–229. [Google Scholar] [CrossRef]
  23. Renzi, C.; Leali, F.; Cavazzuti, M.; Andrisano, A.O. A Review on Artificial Intelligence Applications to the Optimal Design of Dedicated and Reconfigurable Manufacturing Systems. Int. J. Adv. Manuf. Technol. 2014, 72, 403–418. [Google Scholar] [CrossRef]
  24. Delorme, X.; Malyutin, S.; Dolgui, A. A Multi-Objective Approach for Design of Reconfigurable Transfer Lines. IFAC-PapersOnLine 2016, 49, 509–514. [Google Scholar] [CrossRef]
  25. Bandaru, S.; Ng, A.H.C.; Deb, K. Data Mining Methods for Knowledge Discovery in Multi-Objective Optimization: Part A—Survey. Expert Syst. Appl. 2017, 70, 139–159. [Google Scholar] [CrossRef] [Green Version]
  26. Koren, Y.; Hu, S.J.; Weber, T.W. Impact of Manufacturing System Configuration on Performance. CIRP Ann. 1998, 47, 369–372. [Google Scholar] [CrossRef]
  27. ElMaraghy, H.A. Reconfigurable Process Plans for Responsive Manufacturing Systems. In Digital Enterprise Technology: Perspectives and Future Challenges; Springer: Berlin/Heidelberg, Germany, 2007; pp. 35–44. [Google Scholar]
  28. Koren, Y. The Rapid Responsiveness of RMS. Int. J. Prod. Res. 2013, 51, 6817–6827. [Google Scholar] [CrossRef]
  29. Wang, W.; Koren, Y. Scalability Planning for Reconfigurable Manufacturing Systems. J. Manuf. Syst. 2012, 31, 83–91. [Google Scholar] [CrossRef]
  30. Shabaka, A.I.; Elmaraghy, H.A. A Model for Generating Optimal Process Plans in RMS. Int. J. Comput. Integr. Manuf. 2008, 21, 180–194. [Google Scholar] [CrossRef]
  31. Dou, J.P.; Dai, X.; Meng, Z. Precedence Graph-Oriented Approach to Optimise Single-Product Flow-Line Configurations of Reconfigurable Manufacturing System. Int. J. Comput. Integr. Manuf. 2009, 22, 923–940. [Google Scholar] [CrossRef]
  32. Dou, J.; Dai, X.; Meng, Z. A GA-Based Approach for Optimizing Single-Part Flow-Line Configurations of RMS. J. Intell. Manuf. 2011, 22, 301–317. [Google Scholar] [CrossRef]
  33. Moghaddam, S.K.; Houshmand, M.; Fatahi Valilai, O. Configuration Design in Scalable Reconfigurable Manufacturing Systems (RMS); a Case of Single-Product Flow Line (SPFL). Int. J. Prod. Res. 2018, 56, 3932–3954. [Google Scholar] [CrossRef]
  34. Deif, A.M.; ElMaraghy, W. Investigating Optimal Capacity Scalability Scheduling in a Reconfigurable Manufacturing System. Int. J. Adv. Manuf. Technol. 2007, 32, 557–562. [Google Scholar] [CrossRef] [Green Version]
  35. Borisovsky, P.A.; Delorme, X.; Dolgui, A. Genetic Algorithm for Balancing Reconfigurable Machining Lines. Comput. Ind. Eng. 2013, 66, 541–547. [Google Scholar] [CrossRef]
  36. Makssoud, F.; Battaïa, O.; Dolgui, A. Reconfiguration of Machining Transfer Lines. In Service Orientation in Holonic and Multi Agent Manufacturing and Robotics; Spring: Berlin/Heidelberg, Germany, 2013; pp. 339–353. [Google Scholar]
  37. Goyal, K.K.; Jain, P.K. Design of Reconfigurable Flow Lines Using MOPSO and Maximum Deviation Theory. Int. J. Adv. Manuf. Technol. 2016, 84, 1587–1600. [Google Scholar] [CrossRef]
  38. Khezri, A.; Benderbal, H.H.; Benyoucef, L. Towards a Sustainable Reconfigurable Manufacturing System (SRMS): Multi-Objective Based Approaches for Process Plan Generation Problem. Int. J. Prod. Res. 2020, 1–26. [Google Scholar] [CrossRef]
  39. Touzout, F.A.; Benyoucef, L. Multi-Objective Sustainable Process Plan Generation in a Reconfigurable Manufacturing Environment: Exact and Adapted Evolutionary Approaches. Int. J. Prod. Res. 2018, 57, 2531–2547. [Google Scholar] [CrossRef]
  40. Touzout, F.A.; Benyoucef, L. Multi-Objective Multi-Unit Process Plan Generation in a Reconfigurable Manufacturing Environment: A Comparative Study of Three Hybrid Metaheuristics. Int. J. Prod. Res. 2019, 57, 7520–7535. [Google Scholar] [CrossRef]
  41. Youssef, A.M.A.; ElMaraghy, H.A. Availability Consideration in the Optimal Selection of Multiple-Aspect RMS Configurations. Int. J. Prod. Res. 2008, 46, 5849–5882. [Google Scholar] [CrossRef]
  42. Saxena, L.K.; Jain, P.K. A Model and Optimisation Approach for Reconfigurable Manufacturing System Configuration Design. Int. J. Prod. Res. 2012, 50, 3359–3381. [Google Scholar] [CrossRef]
  43. Moghaddam, S.K.; Houshmand, M.; Saitou, K.; Fatahi Valilai, O. Configuration Design of Scalable Reconfigurable Manufacturing Systems for Part Family. Int. J. Prod. Res. 2020, 58, 2974–2996. [Google Scholar] [CrossRef]
  44. Bensmaine, A.; Dahane, M.; Benyoucef, L. A Non-Dominated Sorting Genetic Algorithm Based Approach for Optimal Machines Selection in Reconfigurable Manufacturing Environment. Comput. Ind. Eng. 2013, 66, 519–524. [Google Scholar] [CrossRef]
  45. Bensmaine, A.; Dahane, M.; Benyoucef, L. A New Heuristic for Integrated Process Planning and Scheduling in Reconfigurable Manufacturing Systems. Int. J. Prod. Res. 2014, 52, 3583–3594. [Google Scholar] [CrossRef]
  46. Musharavati, F.; Hamouda, A.S.M. Enhanced Simulated-Annealing-Based Algorithms and Their Applications to Process Planning in Reconfigurable Manufacturing Systems. Adv. Eng. Softw. 2012, 45, 80–90. [Google Scholar] [CrossRef]
  47. Chaube, A.; Benyoucef, L.; Tiwari, M.K. An Adapted NSGA-2 Algorithm Based Dynamic Process Plan Generation for a Reconfigurable Manufacturing System. J. Intell. Manuf. 2012, 23, 1141–1155. [Google Scholar] [CrossRef]
  48. Dou, J.; Li, J.; Su, C. Bi-Objective Optimization of Integrating Configuration Generation and Scheduling for Reconfigurable Flow Lines Using NSGA-II. Int. J. Adv. Manuf. Technol. 2016, 86, 1945–1962. [Google Scholar] [CrossRef]
  49. Miettinen, K.; Hakanen, J.; Podkopaev, D. Interactive Nonlinear Multi-objective Optimization Methods. Int. Ser. Oper. Res. Manag. Sci. 2016, 233, 927–976. [Google Scholar] [CrossRef]
  50. Qu, S.; Shu, L.; Yao, J. Optimal Pricing and Service Level in Supply Chain Considering Misreport Behavior and Fairness Concern. Comput. Ind. Eng. 2022, 174, 108759. [Google Scholar] [CrossRef]
  51. Deb, K. Multi-Objective Optimization. In Search Methodologies; Springer: Boston, MA, USA, 2014; pp. 403–449. [Google Scholar] [CrossRef]
  52. Jian, N.; Henderson, S.G. An Introduction to Simulation Optimization. In Proceedings of the 2015 Winter Simulation Conference, Huntington Beach, CA, USA, 6–9 December 2015; pp. 1780–1794. [Google Scholar] [CrossRef]
  53. Carson, Y.; Maria, A. Simulation Optimization: Methods and Applications. In Proceedings of the 29th Conference on Winter Simulation, Atlanta, GE, USA, 7–10 December 1997; pp. 118–126. [Google Scholar]
  54. Qu, S.; Xu, L.; Mangla, S.K.; Chan, F.T.S.; Zhu, J.; Arisian, S. Matchmaking in Reward-Based Crowdfunding Platforms: A Hybrid Machine Learning Approach. Int. J. Prod. Res. 2022, 60, 7551–7571. [Google Scholar] [CrossRef]
  55. Bandaru, S.; Ng, A.H.C.; Deb, K. Data Mining Methods for Knowledge Discovery in Multi-Objective Optimization: Part B—New Developments and Applications. Expert Syst. Appl. 2017, 70, 119–138. [Google Scholar] [CrossRef] [Green Version]
  56. Agrawal, R.; Srikant, R. Fast Algorithms for Mining Association Rules in Large Databases. In Proceedings of the 20th International Conference on Very Large Data Bases, San Francisco, CA, USA, 12–15 September 1994; Morgan Kaufmann Publishers Inc.: San Francisco, CA, USA, 1994; pp. 487–499. [Google Scholar]
  57. Kou, Z.; Xi, L. Binary Particle Swarm Optimization-Based Association Rule Mining for Discovering Relationships between Machine Capabilities and Product Features. Math. Probl. Eng. 2018, 2018, 2456010. [Google Scholar] [CrossRef] [Green Version]
  58. Tripathi, S.; Muhr, D.; Brunner, M.; Jodlbauer, H.; Dehmer, M.; Emmert-Streib, F. Ensuring the Robustness and Reliability of Data-Driven Knowledge Discovery Models in Production and Manufacturing. Front. Artif. Intell. 2021, 4, 22. [Google Scholar] [CrossRef]
  59. ElMaraghy, H.; Monostori, L.; Schuh, G.; ElMaraghy, W. Evolution and Future of Manufacturing Systems. CIRP Ann. 2021, 70, 635–658. [Google Scholar] [CrossRef]
  60. Algeddawy, T.; Elmaraghy, H. Manufacturing Systems Synthesis Using Knowledge Discovery. CIRP Ann. 2011, 60, 437–440. [Google Scholar] [CrossRef]
  61. Ng, A.H.C.; Bernedixen, J.; Moris, M.U.; Jägstam, M. Factory Flow Design and Analysis Using Internet-Enabled Simulation-Based Optimization and Automatic Model Generation. In Proceedings of the 2011 Winter Simulation Conference, Phoenix, AZ, USA, 11–14 December 2011; pp. 2181–2193. [Google Scholar]
  62. Lidberg, S.; Aslam, T.; Pehrsson, L.; Ng, A.H.C. Optimizing Real-World Factory Flows Using Aggregated Discrete Event Simulation Modelling: Creating Decision-Support through Simulation-Based Optimization and Knowledge-Extraction. Flex. Serv. Manuf. J. 2020, 32, 888–912. [Google Scholar] [CrossRef] [Green Version]
  63. Ng, A.H.C.; Bernedixen, J.; Syberfeldt, A. International Journal of Production Research A Comparative Study of Production Control Mechanisms Using Simulation-Based Multi-Objective Optimisation A Comparative Study of Production Control Mechanisms Using Simulation-Based Multi-Objective Optimisation. Int. J. Prod. Res. 2012, 50, 359–377. [Google Scholar] [CrossRef]
  64. Zitzler, E.; Thiele, L. Multi-objective Evolutionary Algorithms: A Comparative Case Study and the Strength Pareto Approach. IEEE Trans. Evol. Comput. 1999, 3, 257–271. [Google Scholar] [CrossRef] [Green Version]
  65. Smedberg, H.; Bandaru, S. Interactive Knowledge Discovery and Knowledge Visualization for Decision Support in Multi-Objective Optimization. Eur. J. Oper. Res. 2022, 306, 1311–1329. [Google Scholar] [CrossRef]
Figure 1. SMO approach.
Mathematics 11 01527 g001
Figure 2. Solution representation.
Mathematics 11 01527 g002
Figure 3. Genetic operators.
Mathematics 11 01527 g003
Figure 4. MPFL layout.
Mathematics 11 01527 g004
Figure 5. Precedence graphs.
Mathematics 11 01527 g005
Figure 6. Objective space of non-dominated solutions.
Mathematics 11 01527 g006
Figure 7. Task assignment in the non-dominated solutions for the RMS scenarios.
Mathematics 11 01527 g007
Figure 8. Convergence rate plots of the standard and proposed SMO approaches for the scenarios with 7 operators (left-hand side), 8 operators (center), and 9 operators (right-hand side).
Mathematics 11 01527 g008
Figure 9. Convergence rate plots of the standard and proposed SMO approaches for the 9 operators scenario distributed in 4 and 5 WSs.
Mathematics 11 01527 g009
Figure 10. Solution point comparison for the 9 operators scenario distributed in 3, 4, and 5 WSs.
Mathematics 11 01527 g010
Figure 11. Rules quality comparison for the 7 machines scenario.
Mathematics 11 01527 g011
Table 1. Throughput and buffers capacity ranges.
NOProportionTHPBu1Bu2TBC
730/70
70/30
66.76–68.90
62.86–65.48
2–13
2–6
2–14
2–21
4–27
4–27
830/70
70/30
79.31–79.82
78.27–79.81
3–7
2–16
4–28
2–24
7–35
4–40
930/70
70/30
83.86–88.18
82.16–84.69
2–5
2–5
3–33
2–7
5–38
4–12
Table 2. Configurations and work task allocations.
NOProportionWS1WS2WS3Tasks
730/70
70/30
1
1
2
2
4
4
9/14–15/29–30
8/11–12/33–34
830/70
70/30
2
3
3
2
3
3
13–16/17–20/19–20
19–20/12–14/20–21
930/70
70/30
2
2
3
3
4
4
13–14/12–14/26–28
15–16/13–15/23–24
Table 3. Quantitative HV comparison.
NOProportionProposed SMOStandard SMO
730/701.066 × 1003.277 × 10−1
70/301.055 × 1003.516 × 10−1
830/701.031 × 1002.981 × 10−1
70/301.159 × 1001927 × 10−1
930/701.070 × 1003.512 × 10−1
70/309.341 × 10−13.072 × 10−1
Table 4. Quantitative HV comparison for the 9 operators scenario distributed in 4 and 5 WSs.
WSProportionProposed SMOStandard SMO
430/701.103 × 1002.233 × 10−1
70/301.021 × 1002.422 × 10−1
530/701.074 × 1002.980 × 10−1
70/309.153 × 10−12.840 × 10−1
Table 5. Decision rules regarding work task allocations.
Scenario
NO Proportion
Rule-InteractionSig.Unsig.
7A10 = 2 ∧ E4 ≠ 3 ∧ E5 = 2 ∧ E6 ≠ 1 ∧ E23 = 1100%10.49%
8A10 = 1 ∧ A14 ≠ 1 ∧ A17 = 2 ∧ E7 = 1 ∧ E16 = 2100%15.44%
9A23 = 2 ∧ A26 = 1 ∧ E6 ≠ 1 ∧ E9 ≠ 1 ∧ E23 = 190.00%11.91%
30/70A2 ≠ 3 ∧ A14 = 3 ∧ E3 = 1 ∧ E10 ≠ 1 ∧ E23 ≠ 397.06%29.98%
70/30A3 = 1 ∧ E3 ≠ 3 ∧ E11 ≠ 2 ∧ E13 ≠ 1 ∧ E23 = 1100%23.97%
Table 6. Decision rules regarding workstations and buffer allocations.
Scenario
NO Proportion
Rule-InteractionSig.Unsig.
7WS1 = 1 ∧ WS2 = 2 ∧ Bu1 < 7 ∧ Bu2 < 2290.63%20.51%
8WS3 = 3 ∧ WS1 ≠ 1 ∧ Bu1 < 17 ∧ Bu1 > 292.86%26.15%
9WS2 = 3 ∧ WS3 = 4 ∧ Bu1 < 7 ∧ Bu2 < 34100%24.80%
30/70WS1 < 3 ∧ WS2 ≠ 1 ∧ Bu1 < 15 ∧ Bu2 > 294.12%71.01%
70/30WS2 ≠ 1 ∧ WS3 > 2 ∧ Bu1 < 17 ∧ Bu2 < 25100%83.81%
Table 7. Decision rules of the standard SMO approach regarding work task allocations.
Scenario
NO Proportion
Rule-InteractionSig.Unsig.
7A16 ≠ 1 ∧ A18 = 3 ∧ E5 ≠ 1 ∧ E19 ≠ 2 ∧ E21 = 292.86%16.48%
8A5 ≠ 2 ∧ A11 = 2 ∧ A13 ≠ 2 ∧ A28 ≠ 2 ∧ E19 ≠ 290.48%23.00%
9A4 = 3 ∧ A12 = 2 ∧ A18 ≠ 1 ∧ E4 ≠ 2 ∧ E19 ≠ 3100%6.83%
30/70A5 ≠ 3 ∧ E4 ≠ 3 ∧ E5 ≠ 1 ∧ E11 ≠ 2 ∧ E16 ≠ 196.00%15.57%
70/30A13 ≠ 2 ∧ A16 = 2 ∧ A21 ≠ 1 ∧ A28 ≠ 1 ∧ E18 ≠ 191.30%29.21%
Disclaimer/Publisher’s Note: The statements, opinions and data contained in all publications are solely those of the individual author(s) and contributor(s) and not of MDPI and/or the editor(s). MDPI and/or the editor(s) disclaim responsibility for any injury to people or property resulting from any ideas, methods, instructions or products referred to in the content.

