Abstract
A phenomenological 3D anisotropic nonlinear fatigue damage model has been developed for a short glass fiber-reinforced polyamide. The model is formulated within the framework of continuum damage mechanics and is based on a proposed anisotropic hyperelastic strain energy function. The proposed model accounts for the effects of fiber content and nonlinear material behavior. The mechanical behavior of polyamide reinforced with 20% and 30% wt short glass fiber has been experimentally investigated under quasi-static and fatigue loading. Fatigue tests under bending loading are carried out on rectangular specimens cut in the parallel and perpendicular direction to the mold flow direction. The proposed fatigue damage model allows predicting the fatigue damage of composite materials reinforced with short fiberglass, considering fiber orientation and fiber content. The model is used to predict the damage evolution and the number of cycles to failure, and good agreement between predicted values and experimental data is observed.
MSC:
74-10
1. Introduction
Numerous industries, including automotive, aeronautics, aerospace, construction, military, and sports equipment, are currently witnessing significant technological advancements in the use of composite materials. Composite materials are preferred due to their ability to reduce weight and, as a result, minimize energy consumption. They are also valued for their resistance to various environmental factors and their flexibility, which allows them to be shaped in different ways compared to metals [1]. Among the various types of composites, thermoplastic matrix composites have gained popularity and continue to experience rapid growth. Despite their many advantages, however, it is often challenging to obtain parts that meet the expectations of manufacturers. Extreme precision is required during the implementation of composites, and the slightest defect in impregnation or manufacturing can cause significant deformations within the material [2,3]. As a result, its mechanical characteristics are weakened, making it imperative to reduce the deformations within the material. Many factors influence the properties of composite materials, such as the type of fibers and matrix used or the processing method. However, it is widely acknowledged that the fiber–matrix interface plays a critical role because stress transfer occurs through this interface, and good compatibility between the two parts is necessary. The quality of the interface is closely linked to the presence of a specific surface treatment known as sizing. The impact of sizing on the properties of glass fiber-reinforced composite materials has been extensively studied, and it is evident that the quality of the interface significantly affects the properties of the material. Currently, short carbon fiber-reinforced thermoplastic matrix composites have the best adhesion properties, while glass fiber composites still require improved adhesion properties.
The use of short fiber reinforced thermoplastic composites has gained significant attention in various industrial fields and applications, including transportation, sports, aerospace, and automotive industries. These materials must have superior mechanical and chemical properties, be malleable to form complex shapes and be lightweight. Many authors have investigated the mechanical behavior of polyamide 66 (PA66GFs) reinforced with glass fibers in previous studies [4,5,6,7,8,9,10,11,12]. The properties of composite material are influenced by various factors, such as fiber type, matrix type, fiber volume fraction and orientation, interface, and fabrication process. Injection molding is a highly efficient and productive method for processing PA66GFs, and its mechanical properties depend heavily on this processing technique.
In addition, it has been shown that the mechanical properties of PA66GFs are primarily governed by three main variables: fiber characteristics (diameter, length, orientation, and content), molding conditions (temperature, pressure, and molding speed), and mechanical testing conditions (deformation speed, test temperature, and hygrothermal condition). Polyamide 66 reinforced by short glass fiber composites (PA66GFs) display anisotropic properties, and it has been found that the material properties such as Young’s modulus, fatigue strength, and tensile strength are significantly higher in the flow direction than perpendicular to the polymer flow direction when considering the material as a three-dimensional solid. This orientation dependency of PA66GFs mechanical properties makes it an anisotropic material, as highlighted by several studies [13,14,15,16,17,18]. Haut du formulaire.
Composite materials are known to experience damage accumulation, with stiffness reduction often beginning early in the fatigue life due to various types of damage (matrix cracking, fiber fracture, fiber pullout, and matrix fiber delamination). The type of failure that occurs is dependent on the material variables and test conditions. Moreover, the damage mechanisms can interact differently and have different predominance depending on these factors. In the case of short fiber reinforced PA66GF subjected to cyclic loading, the damage evolution occurs in three stages [19,20,21,22,23]. The first stage corresponds to material softening and damage initiation, characterized by a significant reduction in stiffness during the initial cycles. The second stage involves coalescence and the propagation of micro-cracks that occurred during the first stage. This phase is characterized by interfacial fiber–matrix damage, and a relatively steady reduction in stiffness is observed, corresponding to the behavior accommodation of the material. In the final stage, fiber fractures occur with the appearance of macroscopic cracks, leading to the total failure of the material. Degradation mechanisms result in a rapid reduction in stiffness.
Mechanical components made of PA66GFs are frequently subjected to random or cyclic loading during their service life, which can result in irreversible damage [24]. To ensure that these components meet the necessary requirements of safety, economy, and reliability, it is critical to evaluate their cyclic behavior and the evolution of fatigue damage. However, these properties are usually determined through expensive, complex, and time-consuming experimental tests. Therefore, numerical simulations should be employed to predict the evolution of damage and to provide a reliable estimate of fatigue life. Nevertheless, to enable numerical simulations, the development of simple and accurate fatigue damage models is essential.
The fatigue damage of composite materials has been extensively investigated and documented in the literature. In their work, Amjadi and Fatemi [25] introduced a fatigue damage model that focuses on the critical plane approach for predicting the fatigue life of SGFR thermoplastics under tension-tension or tension-compression loading. Their model takes into account the effects of fiber orientation and mean stress, as well as temperature and frequency. They applied this damage model to a general fatigue model in order to incorporate these additional effects.
Several researchers have proposed different fatigue damage models for short glass fiber-reinforced polyamide composites. Toubal et al. [21] developed an analytical model based on cumulative damage to predict damage evolution. The model used a new damage parameter determined via the final Young’s modulus [20]. Chebbi et al. [9,26] also proposed a 1D fatigue damage model based on young modulus degradation for predicting damage evolution in short glass fiber reinforced PA66GFs composite materials, using a similar approach and modifying the phenomenological model proposed by Chaboche [27]. Poursartip et al. [28] developed a phenomenological model where the unidirectional damage growth rate is a power function of mean stress and stress magnitude, independent of damage when cycle loading reaches constant stress magnitude. Recently, Chen et al. [29] proposed a novel damage model that integrates multiple deformation mechanisms using the modified Mori–Tanaka model and Transformation Field Analysis (MT–TFA) approach for predicting monotonic and cyclic stress–strain responses applied on short fibers reinforced polyamide composites. Liu et al. [30] and Kawai [31] used an expression for damage that varies with the compression and tension regime and is related to the damage itself and the amount of strain applied. Van Paepegem et al. [32] proposed a fatigue damage model that uses the amplitude of stress instead of the strain amplitude, which was validated by experimental results prepared on a flat woven glass/epoxy composite. Taheri-Behrooz et al. [33] presented multiple damage models, including four previously studied models for unidirectional stiffness degradation, upon which they based their own proposed models.
The use of Continuum Damage Mechanics (CDM) in conjunction with a fatigue predictor has been a common approach in the development of fatigue-damage formalism. Kachanov [34] was the first to introduce the CDM theory to explain the process of material degradation, and it was later extended to include fatigue damage due to its effectiveness in modeling the behavior of composite materials.
In the formulation of fatigue damage models, the small strain assumption is often used instead of the hyperelastic approach. The assumptions can be integrated with single or multiple damage variables corresponding to isotropic or anisotropic damage models, respectively. Ladevèze et al. [35] formulated a new phenomenological fatigue damage model using an anisotropic damage formulation and the CDM theory for laminate composite sheets in the plane stress assumptions. This model was later reformulated by Sedrakian et al. [36] to account for the strain energy and facilitate finite element implementation.
Nouri et al. [37] extended this method for predicting nonlinear cumulative fatigue damage in short glass fiber reinforced polyamide 66 under mechanical loading. The damage rate was assumed to be the sum of an exponential law and a power function to capture the three stages of damage typically observed in this material. Avanzini et al. [38] used a simplified version of the model to predict the fatigue behavior of a PEEK-based short fiber reinforced composite, considering isotropic fatigue damage with one damage variable. In related work, the authors [39] used a similar approach to model fatigue damage in short fiber reinforced PEEK, modifying the damage state variable to accurately describe the damage behavior. The fatigue damage model was implemented into a finite element code. Payan et al. [40] modeled the behavior of laminated carbon/epoxy composites under static and cyclic loading with plane stress assumptions and an orthotropic elastic potential. This model was later used by Hochard et al. [41] to develop a nonlinear cumulative damage model for woven-ply laminates in the framework of CDM subjected to cyclic and static loadings.
Wang et al. [42] employed the CDM theory in combination with a hyperelastic approach to describe the fatigue life of carbon-filled natural rubbers as a function of nominal strain amplitude under cyclic loading. They derived the damage evolution using Ogden strain energy density (SED) [43]. Ayoub et al. [44,45] improved upon the Continuum Damage Mechanics model proposed by Wang et al. [42] by utilizing a generalized form of Ogden SED and developing the theoretical framework for multiaxial loading. They tested the model using fatigue tests on a styrene–butadiene rubber (SBR) material under both constant and variable amplitude loading conditions to validate its applicability. The proposed model requires three damage parameters in addition to the constitutive law parameters.
Calvo et al. [46] proposed an uncoupled directional continuum damage model for biological soft tissues with fiber reinforcement using a hyperelastic approach. Their model considers two damage variables, one for the matrix and one for the fibers. Several damage models have been proposed recently [47,48,49,50] for metallic materials that can be extended for thermoplastic-based composites.
The objective of this paper is to investigate the fatigue damage behavior of glass fiber-reinforced polyamide 66 under both small and large deformations. To this end, a 3D anisotropic damage model is proposed for short glass fiber-reinforced polyamide based on the CDM theory. The model is developed using a hyperelastic finite deformation description of the elastic response and is an extension of the results reported by Chebbi et al. [8] for transversely anisotropic hyperelasticity where only the quasi-static uniaxial tensile and bending material behavior is considered. In addition, it is also an extension of the results illustrated in Chebbi et al. [9,26] for 3D anisotropic fatigue damage, where only a 1D elastic fatigue damage model is considered based on the degradation of the elastic modulus to predict the damage growth in composite materials.
The proposed 3D anisotropic fatigue damage model for short glass fiber-reinforced polyamide is developed in the framework of CDM theory and includes internal variables that introduce scalar variables for the fibers and matrix damages. The model takes into account the orientation of fibers due to the injection process of composite materials and is used to study the orthotropic material behavior under fatigue loading. To validate the model, material parameters are first determined through tensile tests on PA66GF in longitudinal and transverse directions. The fatigue damage of the PA66GF composite is then studied through both numerical simulations and experimental tests. The numerical simulations are performed via the developed finite element code and are used for sensitivity analysis of the effect of model parameters on damage evolution. The fatigue experimental tests are used to validate the proposed fatigue damage model.
2. Fatigue Damage Model Formulation
2.1. Constitutive Equations for Hyperelastic Material Model
Consider a continuum body with a reference placement and a material particle defined by its position in the reference configuration. Denote by the mapping function between the reference configuration and the deformed configuration and is the deformation gradient.
where is the local volume ratio. As a measure of strain, the right symmetric Cauchy–Green strain tensor is considered and defined as follows:
The fully elastic constitutive response is applicable for an extremely slow deformation and is expressed via a free energy. In the case of short glass fiber reinforced polyamide, the free energy is assumed to be composed of two separate terms, as described below.
Subscripts m and f are for matrix and fiber, c denotes the fibers volume fraction, is normalized scalar considered for the matrix damage variable, , are normalized scalars considered for fibers damage variables. These damage variables give an account of the evolution of the damage within the family of fibers or variables responsible for the damage, which can occur on the interface of the fiber–matrix.
, the matrix energy, is the isotropic part of the ground matrix. This strain energy potential is formulated considering the invariants terms and the incompressibility assumption. It is expressed as follows:
where
For the fiber energy , favored fiber directions are studied and characterized by unit vectors defined in the reference configuration by . Upon deformation, the unit vectors are transformed into , where are unit vectors in the deformed configuration, and are the stretches along the fibers directions
The energy function should be an even function of , expressed as follows:
According to Spencer [51], the energy function can be formulated as a function of a set of pseudo invariants as follows:
where and are defined as
and
In order to obtain the stress tensor, we differentiate Equation (3) with respect to time
The internal dissipation is given by the second principle of thermodynamics and is expressed as follows:
Therefore, the second Piola–Kirchhoff stress tensor may be written as the sum of the matrix and fiber contributions:
where
2.2. Energy Function
For the matrix isotropic free energy function, , the incompressible Yeoh model [52] is considered as in [8]. This free energy is written as
where , , and are material properties. The second Piola–Kirchhoff stress tensor of matrix contribution is then
where the first derivatives of the two first invariants, with respect to tensor, are given in [53,54].
where is the (3,3) components of the right Cauchy–Green strain tensor, Equation (2). For the fibers, the energy function is supposed as follows:
where are material properties. These materiel properties must satisfy the following conditions which are required by the fact that the fiber energy vanishes at zero volume fraction of glass fibers
The second Piola–Kirchhoff stress tensor relative to fibers. Equation (15)b is deduced from Equation (20) as
where the first derivatives of the invariants , Equation (9) with respect to tensor , is
2.3. Damage Evolution Equations
Using Equation (14), the internal dissipation, Equation (13), can be rewritten as
where
and are the thermodynamic dual variables associated with the damage variables and , respectively. Using Equations (13) and (20), they are given by
Therefore, the evolution equation of the thermodynamic force variables and are
The evolution of damage variables and are obtained from an irreversible equation as follows. Let and defined by the following expressions [54]
and let and be the maximum value of and , respectively, over the closed time interval [55].
The damage criteria in strain space are defined by the following expressions:
For no evolution of damage variable occurs. For no evolution of damage variable occurs. The equations and define the damaged surfaces with normals:
Loading conditions are
Finally, the evolution equation of damage variables and are given by [56,57]
where and are functions that describe the damages evolutions. From Equation (39), it can be deduced that the evolution equations and are related to and , respectively, as follows:
Under a cyclic loading condition, displacement, or loading controls, the damage will accumulate with the cycle’s number. The time rate change of damage variables, and , can be expressed in terms of and , respectively, with respect to the cycle’s number. Based on this consideration, the damage fatigue rate could be linked to the number of cycles N and written as follows:
The power law function is commonly utilized in numerous fatigue models for predicting the degradation of mechanical properties. Nevertheless, these models incorporate distinct effective quantities for damage evolution and characterization of material properties. Thus, the evolution equation that will be considered in this paper is as follows:
Where , , , , and are material constants and is the initial damage.
Next, we use the assumption that the damage of the whole composite PA66GFs is related to the damage variable as the experimental tests are bending tests in the longitudinal direction. Then, we can write
2.4. Elasticity Tensor
Starting from Equation (14) yields
where is the matrix contribution to the material tangent moduli. However, , k = 1,4 are the fibers contribution to the material tangent moduli. The is given by [58]
with
and is given by
with
and finally is given by
3. Experimental Study
The experimental investigation involved the use of polyamide 66, which was reinforced with short glass fibers at weight percentages of 10%, 20%, and 30%. The molding injection process was utilized to manufacture four grades of composites, namely, PA66GF00, PA66GF10, PA66GF20, and PA66GF30, with glass contents of 0%, 10%, 20%, and 30% based on polyamide 66. Rectangular plates with specific dimensions and ISO 527-2 tensile specimens were produced, as detailed in Chebbi et al. [9]. The mechanical properties were characterized via tensile tests in accordance with the ISO 527-2 standard specification. The specimens were cut along both the longitudinal and transverse directions, which are parallel and perpendicular, respectively, to the direction of mold flow. Room temperature tensile tests were conducted using a 10 kN INSTRON testing machine equipped with a RUDLPH laser extensometer, with a crosshead speed of 1 mm/min.
The specimens were subjected to cyclic loading using a fatigue-testing machine that was constructed in-house, as described in Chebbi et al. [9]. The adjustable crank-linkage mechanism was utilized to apply the alternating displacement () to one end of the specimen (point B) while the other end was clamped (point A). Consequently, the specimen was loaded as a clamped–clamped beam with one moving clamp (as shown in Figure 1). The amplitude of the displacement () and the displacement ratio ( ) were adjustable parameters. The force acting on the composite sample was measured using a force gauge connected to the sample fixture.
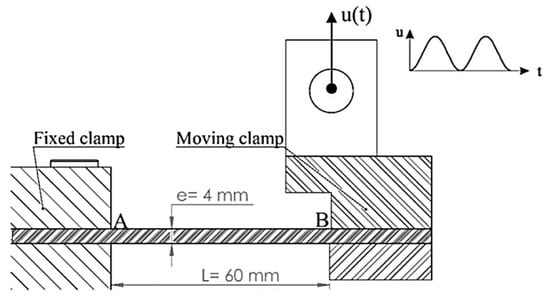
Figure 1.
Specimen clamping.
The fatigue tests were conducted at room temperature with a constant alternating displacement, using a cyclic frequency of 2 Hz for load cycles. The aim was to minimize the increase in temperature due to the self-heating phenomenon, as proposed by Handa et al. [59]. The variation of the displacement applied to the specimen during the test, as well as the resultant force, were recorded instantaneously. Three minimum tests were performed for each variation of displacement between 8 mm and 12.5 mm.
4. Identification of the Anisotropic Hyperelastic Behavior of PA66GFs
The parameters of the energy potential (defined in Equations (16) and (20)), including , , ,, and , were identified via an inverse method with three experimental tests. Two tensile tests were conducted in the longitudinal and transverse directions for PA66GFs, and a tensile test was conducted for the pure matrix. A finite element (FE) model was developed based on the specimens used in the tensile tests. Load control was employed, and an error function was expressed as follows:
This error function is the sum of different contributions from loaded nodes estimated at different load levels. , are, respectively, the nodal displacements from the Finite Element simulation and from the experiments. The non-linear least squares minimization problems Equation (50) is solved via the Levenberg–Marquardt algorithm. The FE model uses a four-node quadrilateral shell element proposed by Dammak et al. [60].
The material properties for the matrix, relative to the Yeoh model, are obtained in Ref. [8] as , , and .
With , , and obtained, the experimental results of uniaxial tensile tests of PA66GFs along the longitudinal direction are used to obtain the material parameter . The predicted composite responses are plotted in Figure 2. A good agreement with the experimental data is observed under moderate deformation.
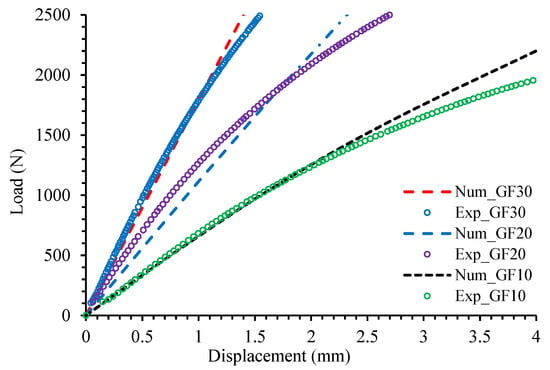
Figure 2.
Load-displacement curves of tensile tests on PA66GFs: longitudinal direction.
Finally, the material parameter for the studied material was obtained by fitting the transverse uniaxial tensile test data as plotted in Figure 3. The experimental data are in good agreement with predicted results within the applicable domain of the presented model.
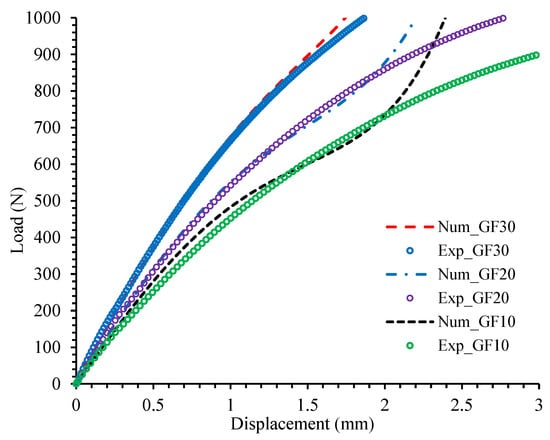
Figure 3.
Load-displacement curves of tensile tests on PA66GFs: transverse direction.
The other two material parameters, and , in the anisotropic hyperelastic model cannot be determined without additional experimental tests, such as shear tests. As these tests have not yet been conducted, the material parameters are currently considered to be valueless.
The material properties for the longitudinal and transverse directions, and , were determined via a nonlinear least squares method and are summarized in Table 1 for three different volume fractions.

Table 1.
Identification of the material parameter and .
The evolution of and can be calculated by second-order polynomial functions with a good correlation factor.
The values of the material properties and identified for the three different materials are plotted as a function of the fiber volume fraction, , in Figure 4. It is worthwhile to notice the difference between the longitudinal and transverse directions.
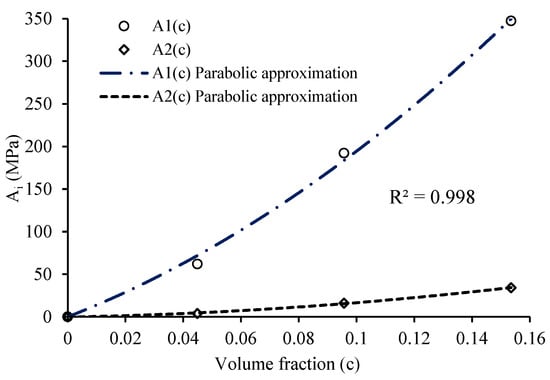
Figure 4.
Function and as function of the volume fraction c.
The final whole model parameters are summarized in Table 2.

Table 2.
Set of anisotropic model parameters.
Young modulus in longitudinal and transverse directions can be expressed as follows:
These moduli are given in Table 3 for PA66, PA66GF10, PA66GF 20, and PA66GF 30. The results obtained are in good agreement with those obtained through experimental characterization [8]. It is interesting to note the difference between Young’s modulus in the longitudinal and transverse directions. This difference is induced by the orientation of the fibers in these directions.

Table 3.
Young’s modulus in longitudinal and transverse directions.
5. Fatigue Damage Model
5.1. Numerical Implementation
The flowchart in Figure 5 outlines the looping scheme used for the fatigue damage model implemented in the in-house finite element code. The cycle jump procedure is used to integrate the damage growth rate equation (Equation (41)) by extrapolation, which allows for a computationally efficient simulation. The incremental method is used to calculate the increment of the cyclic internal variables at all Gauss points. The evolutionary variables are then extrapolated and used to calculate the next cycle jump. After a certain number of increments ( cycles), the total damage is estimated via the fourth-order Runge–Kutta integration method (Equation (54)) [61]. This damage estimate can be used to predict new material properties, and the simulation is repeated iteratively until total failure ().
where
where is the discretization step size, and .
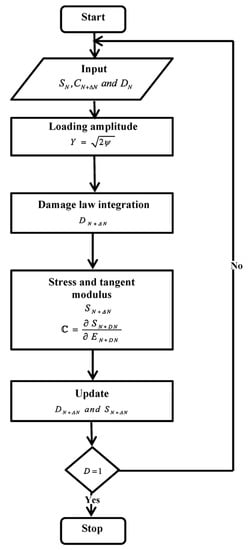
Figure 5.
Flowchart of the implementation.
5.2. Sensitivity Study
The following paragraph provides a sensitivity analysis of the damage fatigue model (Equation (48)) on its four parameters, namely, , , , and . This analysis aims to examine the impact of each parameter on the evolution and kinetics of damage, as well as the number of cycles until failure. Additionally, the study aims to optimize the process of identifying the damage model parameters. The structure being modeled is a rectangular plate with the dimensions of . The first edge of the structure is fixed, and a sinusoidal displacement is applied to the second edge, as illustrated in Figure 6. The simulation utilizes material properties acquired through quasi-static identification, as indicated in Table 2. The modeled structure is meshed using four-node shell elements.

Figure 6.
Finite element model and boundary conditions.
A numerical sensitivity analysis was carried out on the PA66GF20 sample with a prescribed displacement of 10 mm. In each test, one parameter was modified while the others remained constant. Table 4 shows the initial values of the damage model parameters. For the remainder of the study, the initial damage value, , (Equation (48)), was set to zero. The damage evolution curves at the outer layer fixed extremes of the specimen are illustrated in Figure 7, Figure 8, Figure 9 and Figure 10.

Table 4.
Initial values of damage fatigue model parameters.

Figure 7.
Influence of parameter on damage evolution.

Figure 8.
Influence of parameter on damage evolution.

Figure 9.
Influence of parameter on damage evolution.

Figure 10.
Influence of parameter “d” on the damage evolution.
As depicted in Figure 7, which shows fatigue damage evolution in relation to normalized fatigue life, the parameter does not affect the kinetics of damage. However, it significantly impacts the damage rate of the second stage. As a result, increasing the value of the parameter reduces the number of cycles required for failure to occur.
Figure 8 demonstrates that the parameter has a notable impact on the kinetics of damage. This parameter is responsible for initiating damage during the third stage. However, increasing its value decreases the number of cycles needed to reach failure.
Modifying the parameter alters the evolution and kinetics of fatigue damage, as depicted in Figure 9. Increasing this parameter causes a rapid evolution of damage during the first stage, resulting in a decrease in the fatigue life of the composite specimen.
Figure 10 displays the impact of the parameter on the evolution and kinetics of damage. This parameter has a significant impact on the damage slope of the second stage and the onset of the third stage. As the value of the parameter increases, the rate of damage evolution accelerates, leading to a considerable decrease in the fatigue life of the structure. This may result in rapid degradation of the material. However, the parameter has no impact on the first stage of damage evolution.
5.3. Validation of the Fatigue Damage Model
The fatigue model proposed in this paper was used to investigate the fatigue behavior of PA66GF20 and PA66GF30 specimens under bending tests. First, the materials parameters were identified via a nonlinear least squares method. An objective function representing the difference between the values of the numerical and experimental results was determined and minimized using the Levenberg–Marquart algorithm [62]. For each material, four constants are obtained, and the results are summarized in Table 5. Experimentally measured force-cycle history for PA66GF20 and PA66GF0 specimens are presented in Figure 11 and Figure 12, respectively. The higher the applied displacement, the higher the initial force acting in the composite specimen. The curves show three stages. The first stage is characterized by a rapid decrease in material stiffness. In the second stage, the force acting in the composite specimen decreases in a relatively steady manner. The last stage corresponds to the propagation and the coalescence of cracks until the brutal rupture. In addition, increasing the amplitude of the applied displacement reduces the fatigue life without changing the damage kinetics. Numerical results for the force degradation are presented in Figure 13 and Figure 14, respectively. The three stages of damage evolution are well established. It is interesting to note the good agreement between the experimental and the numerical results, which proves the accuracy of the damage model used in these simulations and its efficiency in reproducing the fatigue behavior of the studied composites. Furthermore, simulated the number of cycles until failure is in good agreement with experimental ones, as shown in Table 6 and Table 7.

Table 5.
Material parameters of the fatigue damage model for PA66GF20 and PA66GF2030.
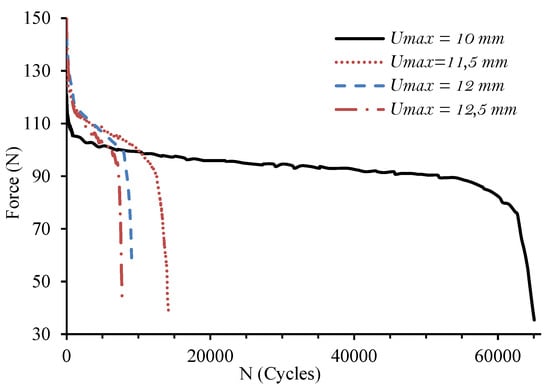
Figure 11.
Experimentally measured force-cycle history for PA66GF20 specimens.
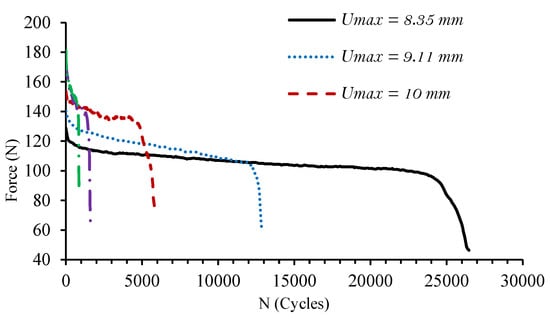
Figure 12.
Experimentally measured force-cycle history for PA66GF30 specimens.
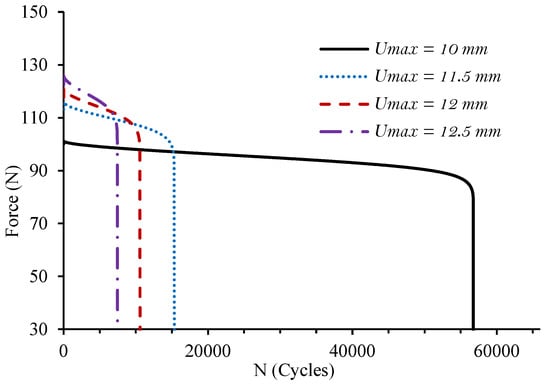
Figure 13.
Simulated force-cycle history for PA66GF20 specimens.
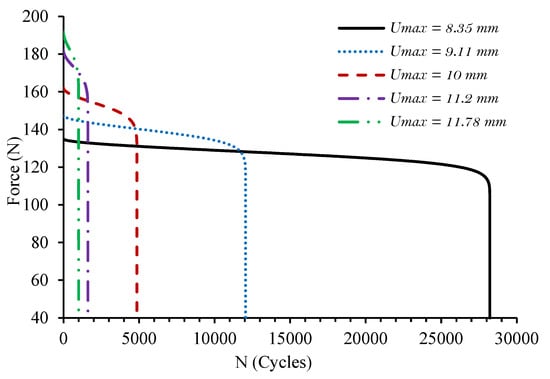
Figure 14.
Simulated force-cycle history for PA66GF30 specimens.

Table 6.
Experiment and numerical number of cycles to failure of PA66GF20.

Table 7.
Experimental and numerical number of cycle to failure of PA66GF30.
Figure 15 and Figure 16 depict the damage evolution as a function of the number of cycles at the extreme fixed outer layer of the PA66GF20 and PA66GF30 specimens, respectively. The simulated curves exhibit the three stages of damage evolution that are typical of these materials. The numerical results demonstrate the model’s capability to accurately replicate the behavior of the composites under investigation.
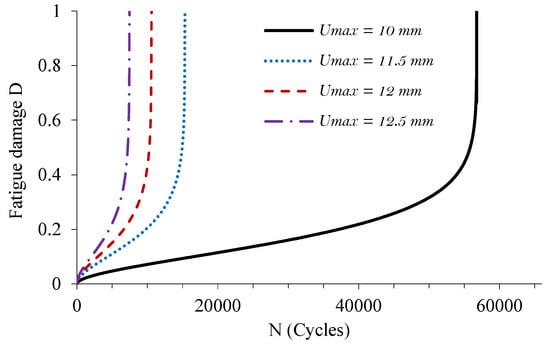
Figure 15.
Simulated damage evolution at the extreme fixed outer layer of PA66GF20 specimens.
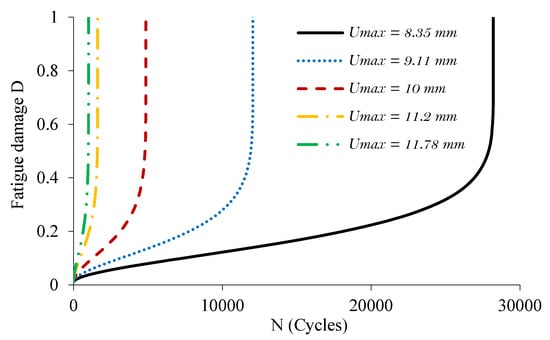
Figure 16.
Simulated damage evolution at the extreme fixed outer layer of PA66GF30 specimens.
In Figure 17, the damage contours in the deformed configuration are illustrated for the PA66GF30 specimen under a bending test with an imposed displacement of 8.35 mm. It is evident that the maximum value of damage is concentrated at the clamped cross-section. However, it is also important to note a substantial level of damage at the moving section where the imposed displacement was applied. These findings were verified through experimental observations, where most of the tested specimens were found to have failed at the fixed section.
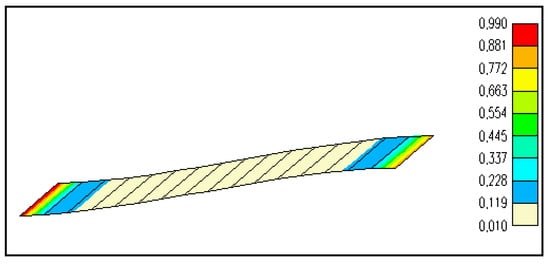
Figure 17.
Damage contour plot in the deformed configuration of the PA66GF30 specimen.
6. Conclusions
The present paper introduced a new 3D anisotropic fatigue damage model that is based on phenomenological principles. The model is used to predict the mechanical behavior of short glass fiber-reinforced polyamide 66 when subjected to fatigue tests. The model merges both the hyperelastic approach and continuum damage mechanics in the same framework. This model allows taking into account the orientation of the fibers by considering the different fiber contents. To determine the hyperelastic constitutive model, tensile tests were conducted in both the longitudinal and transverse directions. The fatigue damage model was incorporated into an in-house finite element code, and a parametric study was conducted to examine how the model’s evolution and kinetics were affected by the model parameters. This sensitivity analysis enabled us to enhance the procedure for determining the parameters of the fatigue damage model. The accuracy of the proposed model was tested against experimental results, which demonstrated its effectiveness. The simulated results accurately predicted the evolution of damage and captured the specific damage kinetics related to PA66GFs. Furthermore, it was revealed that the developed model’s performance was satisfactory compared to the experimental findings.
Author Contributions
E.C.: Conceptualization, methodology, experimental investigation, writing—original draft preparation, review, and editing. L.B.S.: software, visualization, data curation, investigation. B.A.: visualization, writing—review and editing, investigation. F.D.: supervision, conceptualization, methodology, writing—review and editing. All authors have read and agreed to the published version of the manuscript.
Funding
This research has been funded by Deputy for Research & Innovation, Ministry of Education, through Initiative of Institutional Funding at University of Ha’il—Saudi Arabia, through project number IFP-22 165.
Institutional Review Board Statement
Not applicable.
Informed Consent Statement
Not applicable.
Data Availability Statement
Not applicable.
Conflicts of Interest
The authors declare no conflict of interest.
References
- Hriberšek, M.; Kulovec, S. Study of the glass fibres and internal lubricants influence in a polyamide 66 matrix on the wear evolution of polyacetal and polyamide 66 based gears in a meshing process. Eng. Fail. Anal. 2022, 134, 106071. [Google Scholar] [CrossRef]
- Han, W.; Zhou, J.; Shi, Q. Research progress on enhancement mechanism and mechanical properties of FRP composites reinforced with graphene and carbon nanotubes. Alex. Eng. J. 2022, 64, 541–579. [Google Scholar] [CrossRef]
- Khan, Z.I.; Habib, U.; Mohamad, Z.B.; Rahmat, A.R.; Abdullah, N.A. Mechanical and thermal properties of sepiolite strengthened thermoplastic polymer nanocomposites: A comprehensive review. Alex. Eng. J. 2022, 61, 975–990. [Google Scholar] [CrossRef]
- Güllü, A.; Özdemir, A.; Özdemir, E. Experimental investigation of the effect of glass fibres on the mechanical properties of polypropylene (PP) and polyamide 6 (PA6) plastics. Mater. Des. 2006, 27, 316–323. [Google Scholar] [CrossRef]
- Mouhmid, B.; Imad, A.; Benseddiq, N.; Benmedakhène, S.; Maazouz, A. A study of the mechanical behaviour of a glass fibre reinforced polyamide 6,6: Experimental investigation. Polym. Test. 2006, 25, 544–552. [Google Scholar] [CrossRef]
- Benaceur, I.; Othman, R.; Guegan, P.; Dhieb, A.; Damek, F. Sensitivity of the flow stress of nylon 6 and nylon 66 to strain-rate. Int. J. Mod. Phys. B 2008, 22, 1249–1254. [Google Scholar] [CrossRef]
- Ghorbel, A.; Saintier, N.; Dhiab, A.; Dammak, F. Étude du comportement mécanique d’un polyamide 66 chargé de fibres de verre courtes. Mécanique Ind. 2011, 12, 333–342. [Google Scholar]
- Chebbi, E.; Wali, M.; Dammak, F. An anisotropic hyperelastic constitutive model for short glass fiber reinforced polyamide. Int. J. Eng. Sci. 2016, 106, 262–272. [Google Scholar] [CrossRef]
- Chebbi, E.; Mars, J.; Wali, M.; Dammak, F. Fatigue behavior of short glass fiber reinforced polyamide 66: Experimental study and fatigue damage modeling. Period. Polytech. Mech. Eng. 2016, 60, 247–255. [Google Scholar] [CrossRef]
- Ramazani, S.; Morshed, M.; Ghane, M. Effect of service temperature on structure and mechanical properties of polyamide 6 & 66 tyre cords. J. Polym. Res. 2011, 18, 781–792. [Google Scholar]
- Arif, M.F.; Saintier, N.; Meraghni, F.; Fitoussi, J.; Chemisky, Y.; Robert, G. Multiscale fatigue damage characterization in short glass fiber reinforced polyamide-66. Compos. Part B 2014, 61, 55–65. [Google Scholar] [CrossRef]
- Ibáñez-Gutiérrez, F.T.; Cicero, S.; Carrascal, I.A. On the influence of moisture content on the fracture behaviour of notched short glass fibre reinforced polyamide 6. Compos. Part B 2019, 159, 62–71. [Google Scholar] [CrossRef]
- Zhou, Y.; Mallick, P.K. Fatigue performance of an injection-molded short E-glass fiber-reinforced polyamide 6,6. I. Effects of orientation, holes, and weld line. Polym. Compos. 2006, 27, 230–237. [Google Scholar] [CrossRef]
- Bernasconi, A.; Davoli, P.; Basile, A.; Filippi, A. Effect of fibre orientation on the fatigue behaviour of a short glass fibre reinforced polyamide-6. Int. J. Fatigue 2007, 29, 199–208. [Google Scholar] [CrossRef]
- Brunbauer, J.; Mösenbacher, A.; Guster, C.; Pinter, G. Fundamental influences on quasistatic and cyclic material behavior of short glass fiber reinforced polyamide illustrated on microscopic scale. J. Appl. Polym. Sci. 2014, 131, 40842. [Google Scholar] [CrossRef]
- Benaarbia, A.; Chrysochoos, A.; Robert, G. Thermomechanical behavior of PA6.6 composites subjected to low cycle fatigue. Compos. Part B 2015, 76, 52–64. [Google Scholar] [CrossRef]
- Li, X.P.; Zhao, G.Q.; Yang, C. Effect of mold temperature on motion behavior of short glass fibers in injection molding process. Int. J. Adv. Manuf. Technol. 2014, 73, 639–645. [Google Scholar] [CrossRef]
- Stadlera, G.; Primetzhoferc, A.; Pinterb, G.; Grüna, F. Investigation of fibre orientation and notch support of short glass fibre reinforced thermoplastics. Int. J. Fatigue 2020, 131, 105284. [Google Scholar] [CrossRef]
- Reifsnider, K.L.; Henneke, E.G.; Stinchcomb, W.W.; Duke, J.C. Damage mechanics and NDE of composite laminates. In Mechanics of Composite Materials-Recent Advances; Hashin, Z., Herakovich, C.T., Eds.; Pergamon Press: New York, NY, USA, 1983; pp. 399–420. [Google Scholar]
- Mao, H.; Mahadevan, S. Fatigue damage modelling of composite materials. Compos. Struct. 2002, 58, 405–410. [Google Scholar] [CrossRef]
- Toubal, L.; Karama, M.; Lorrain, B. Damage evolution and infrared thermography in woven composite laminates under fatigue loading. Int. J. Fatigue 2006, 28, 1867–1872. [Google Scholar] [CrossRef]
- Belmonte, E.; De Monte, M.; Hoffmann, C.J.; Quaresimin, M. Damage mechanisms in a short glass fiber reinforced polyamide under fatigue loading. Int. J. Fatigue 2017, 94, 145–157. [Google Scholar] [CrossRef]
- Mejri, M.; Toubal, L.; Cuilliere, J.C.; François, V. Fatigue life and residual strength of a short- natural-fiber-reinforced plastic vs Nylon. Compos. Part B 2017, 110, 429–441. [Google Scholar] [CrossRef]
- Mortazavian, S.; Fatemi, A. Fatigue behavior and modeling of short fiber reinforced polymer composites: A literature review. Int. J. Fatigue 2015, 70, 297–321. [Google Scholar] [CrossRef]
- Amjadi, M.; Fatemi, A. A Fatigue damage model for Life prediction of Injection-Molded short glass fiber-reinforced Thermoplastic composites. Polymers 2021, 13, 2250. [Google Scholar] [CrossRef]
- Chebbi, E.; Mars, J.; Hentati, H.; Wali, M.; Dammak, F. A New Cumulative Fatigue Damage Model for Short Glass Fiber-Reinforced Polyamide 66. In Design and Modeling of Mechanical Systems—III; Haddar, M., Chaari, F., Benamara, A., Chouchane, M., Karra, C., Aifaoui, N., Eds.; Lecture Notes in Mechanical Engineering; Springer: Berlin/Heidelberg, Germany, 2018; pp. 227–234. [Google Scholar]
- Chaboche, J.L. Une loi differentielle d’endommagement de fatigue avec cumulation non linéaire. Rev. Française Mécanique 1974, 51, 71–82. [Google Scholar]
- Poursartip, A.; Ashby, M.F.; Beaumont, P.W.R. The fatigue damage mechanics of a carbon fiber composite laminate: I--Development of the model. Compos. Sci. Technol. 1986, 25, 193–218. [Google Scholar] [CrossRef]
- Chen, Q.; Chatzigeorgiou, G.; Robert, G.; Meraghni, F. Viscoelastic-viscoplastic homogenization of short glass-fiber reinforced polyamide composites (PA66/GF) with progressive interphase and matrix damage: New developments and experimental validation. Mech. Mater. 2022, 164, 104081. [Google Scholar] [CrossRef]
- Liu, B.; Lessard, L.B. Fatigue and damage tolerance analysis of composite laminates: Stiffness loss damage modeling and life prediction. Compos. Sci. Technol. 1994, 51, 43–51. [Google Scholar] [CrossRef]
- Kawai, M. A phenomenological model for off-axis fatigue behavior of unidirectional polymer matrix composites under different stress ratios. Compos. Part A 2004, 35, 955–963. [Google Scholar] [CrossRef]
- Van Paepegem, W.; Degrieck, J.; De Baets, P. Finite Element Approach for Modelling Fatigue Damage in Fibre-reinforced Composite Materials. Compos. Part B 2001, 32, 575–588. [Google Scholar] [CrossRef]
- Taheri-Behrooz, F.; Shokrieh, M.M.; Lessard, L.B. Residual Stiffness in Cross-ply Laminates Subjected to Cyclic Loading. Compos. Struct. 2008, 85, 205–212. [Google Scholar] [CrossRef]
- Kachanov, M.L. Time of the rupture process under creep conditions, Izy Akad. Nauk. SSR Otd. Tech. Nauk. 1958, 8, 26–31. [Google Scholar]
- Ladevèze, P.; Le Dantec, E. Damage modelling of the elementary ply for laminated composites. Compos. Sci. Technol. 1992, 43, 257–267. [Google Scholar] [CrossRef]
- Sedrakian, A.; Ben Zineb, T.; Billoet, J.L. Contribution of industrial composite parts to fatigue behaviour simulation. Int. J. Fatigue 2002, 24, 307–318. [Google Scholar] [CrossRef]
- Nouri, H.; Meraghni, F.; Lory, P. Fatigue damage model for injection-molded short glass fibre reinforced thermoplastics. Int. J. Fatigue 2009, 31, 934–942. [Google Scholar] [CrossRef]
- Avanzini, A.; Donzella, G.; Gallina, D. Fatigue damage modelling of PEEK short fibre composites. Procedia Eng. 2011, 10, 2052–2057. [Google Scholar] [CrossRef]
- Avanzini, A.; Donzella, G.; Gallina, D.; Pandini, S.; Petrogalli, C. Fatigue behavior and cyclic damage of peek short fiber reinforced composites. Compos. Part B 2013, 45, 397–406. [Google Scholar] [CrossRef]
- Payan, J.; Hochard, C. Damage modelling of laminated carbon/epoxy composites under static and fatigue loads. Int. J. Fatigue 2002, 24, 299–306. [Google Scholar] [CrossRef]
- Hochard, C.; Payan, J.; Bordreuil, C. A progressive first ply failure model for woven ply CFRP laminates under static and fatigue loads. Int. J. Fatigue 2006, 28, 1270–1276. [Google Scholar] [CrossRef]
- Wang, B.; Lu, H.; Kim, G.H. A damage model for the fatigue life of elastomeric materials. Mech. Mater. 2002, 34, 475–483. [Google Scholar] [CrossRef]
- Ogden, R.W. Non-Linear Elastic Deformation; Ellis Horwood Limited: New York, NY, USA, 1984. [Google Scholar]
- Ayoub, G.; Naït-Abdelaziz, M.; Zaïri, F.; Gloaguen, J.M. Multiaxial fatigue life prediction of rubber-like materials using the continuum damage mechanics approach. Proc. Eng. 2011, 2, 985–993. [Google Scholar] [CrossRef]
- Ayoub, G.; Nait-Abdelaziz, M.; Zairi, F.; Gloaguen, J.M.; Charrier, P. A continuum damage model for the high-cycle fatigue life prediction of styrene-butadiene rubber under multiaxial loading. Int. J. Solids Struct. 2011, 48, 2458–2466. [Google Scholar] [CrossRef]
- Calvo, B.; Pena, E.; Martinez, M.A.; Doblaré, M. An uncoupled directional damage model for fibred biological soft tissues. Formulation and computational aspects. Int. J. Numer. Meth Eng. 2007, 69, 2036–2057. [Google Scholar] [CrossRef]
- Ben Said, L.; Wali, M. Accuracy of Variational Formulation to Model the Thermomechanical Problem and to Predict Failure in Metallic Materials. Mathematics 2022, 10, 3555. [Google Scholar] [CrossRef]
- Ben Said, L.; Allouch, M.; Wali, M.; Dammak, F. Numerical Formulation of Anisotropic Elastoplastic Behavior Coupled with Damage Model in Forming Processes. Mathematics 2023, 11, 204. [Google Scholar] [CrossRef]
- Long, X.; Guo, Y.; Su, Y.; Siow, K.S.; Chen, C. Unveiling the damage evolution of SAC305 during fatigue by entropy generation. Int. J. Mech. Sci. 2023, 244, 108087. [Google Scholar] [CrossRef]
- Niu, X.; Zhu, S.P.; He, J.C.; Liao, D.; Correia, J.A.; Berto, F.; Wang, Q. Defect tolerant fatigue assessment of AM materials: Size effect and probabilistic prospects. Int. J. Fatigue 2022, 160, 106884. [Google Scholar] [CrossRef]
- Spencer, A.J.M. Continuum Theory of the Mechanics of Fibre-Reinforced Composites; Springer: New York, NY, USA, 1984. [Google Scholar]
- Yeoh, O.H. Characterization of elastic properties of carbon black filled rubber vulcanizates. Rubber Chem. Technol. 1990, 63, 792–805. [Google Scholar] [CrossRef]
- Dammak, F.; Regaieg, A.; Kallel, I.K.; Dhieb, A. Modeling the law of transversely isotropic hyperelastic behavior of elastomers. Eur. J. Comput. Mech. 2007, 16, 103–126. [Google Scholar] [CrossRef]
- Abdessalem, J.; Kallel, I.K.; Fakhreddine, D. Theory and finite element implementation of orthotropic and transversely isotropic incompressible hyperelastic membrane. Multidiscip. Model. Mater. Struct. 2011, 7, 424–439. [Google Scholar] [CrossRef]
- Simo, J.C. On a fully three-dimensional finite-strain viscoelastic damage model: Formulation and computational aspects. Comput. Methods Appl. Mech. 1987, 60, 153–173. [Google Scholar] [CrossRef]
- Naghdi, P.M.; Trapp, J.A. The significance of formulating plasticity theory with reference to loading surfaces in strain space. Int. J. Eng. Sci. 1975, 13, 785–797. [Google Scholar] [CrossRef]
- Simo, J.C.; Hughes, T.J.R. Computational Inelasticity; Springer: New York, NY, USA, 1998. [Google Scholar]
- Holzapfel, G.A. Nonlinear Solid Mechanics; Wiley: New York, NY, USA, 2000. [Google Scholar]
- Handa, K.; Kato, A.; Narisawa, I. Fatigue characteristics of a glass-fiber-reinforced polyamide. J. Appl. Polym. Sci. 1999, 72, 1783–1793. [Google Scholar] [CrossRef]
- Dammak, F.; Abid, S.; Gakwaya, A.; Dhatt, G. A formulation of the non linear discrete Kirchhoff quadrilateral shell element with finite rotations and enhanced strains. Rev. Eur. Des Eléments 2005, 14, 7–31. [Google Scholar] [CrossRef]
- Chebbi El Jarraya, A.; Dammak, F. A comparative study for two-damage modelling models using composite material. Int. J. Comput. Mater. Sci. Eng. 2012, 1, 1250014. [Google Scholar]
- Meraghni, F.; Nouri, H.; Bourgeois, N.; Czarnota, C.; Lory, P. Parameters identification of fatigue damage model for short glass fiber reinforced polyamide (PA6-GF30) using digital image correlation. Procedia Eng. 2011, 10, 2110–2116. [Google Scholar] [CrossRef]
Disclaimer/Publisher’s Note: The statements, opinions and data contained in all publications are solely those of the individual author(s) and contributor(s) and not of MDPI and/or the editor(s). MDPI and/or the editor(s) disclaim responsibility for any injury to people or property resulting from any ideas, methods, instructions or products referred to in the content. |
© 2023 by the authors. Licensee MDPI, Basel, Switzerland. This article is an open access article distributed under the terms and conditions of the Creative Commons Attribution (CC BY) license (https://creativecommons.org/licenses/by/4.0/).