Abstract
This paper deals with the effects of partial differential equations on the development of spatiotemporal patterns in reaction–diffusion systems. These systems describe how the concentration of a certain substance is distributed in space or time under the effect of two phenomena: the chemical reactions of different substances into some other product and the diffusion which results in the dispersion of a certain substance over a surface in space. Mathematical representation of these types of models are named the Gray–Scott model, which exhibits the formation of patterns and morphogenesis in living organisms, e.g., the initial formation of patterns that occur in cell development, etc. To explore the nonhomogeneous steady-state solutions of the model, we use a novel high-order numerical approach based on the Chebyshev spectral method. It is shown that the system is either in uniform stabilized steady states in the case of spatiotemporal chaos or lead to bistability between a trivial steady state and a propagating traveling wave. When the diffusion constant of each morphogen is different in any two species of the reaction–diffusion equation, diffusion-driven instability will occur. For the confirmation of theoretical results, some numerical simulations of pattern formation in the Gray–Scott model are performed using the proposed numerical scheme.
Keywords:
spatiotemporal dynamics; reaction–diffusion system; stability analysis; Turing patterns; Gray–Scott model; Chebyshev spectral method MSC:
65M70; 35K57; 35B35; 35B36
1. Introduction
Partial differential equations (PDEs) are used for mathematical formulation of many real-world problems in many fields of science and engineering. Their most common types are hyperbolic, parabolic and elliptic. These types of PDEs are used to model some physical phenomena, such as flow, mass and heat transfer, free body falling, level of microscopic motion of electron, finance and economics and many more. Many natural situations, such as biological or human, mechanical, chemical or financial systems, may be described by a system of PDEs. Most recently, researchers have investigated some methods to discover the system of PDEs and describe their spatiotemporal dynamics [1,2,3,4]. According to Turing, the basis of morphogenesis lies in the chemical capabilities of forming patterns that could be found in early embryos, which were later named morphogens. Morphogens have chemical patterns present in the tissue which create a chemical and physical interaction. These patterns of chemical reactions affect genes and their physical diffusion and chemical reactions. Then, the pattern formation of these morphogens can be modeled mathematically with the help of chemical and physical laws. Moreover, these can be modeled in the form of partial differential equations, later named reaction–diffusion equations [5]. Despite diffusion being a steady mechanism, Turing proposed that it can also behave as a competitor for some of the other chemical reactions that are auto catalytic. Turing also observed that because of some fast chemical reactions that cannot be easily observed, specific pattern types can be seen.
Structures and patterns that evolve in nature are studied in the branch of mathematics known as mathematical biology in which pattern formations are focused [6]. Patterns that appear in nature seem to have complex structures, such as the structure of snow flakes and the patterns in animal skin coats. However, as these patterns appear in large quantities in nature, scientists began to think that they might all follow the same formation principle which could also be simple. After Turing patterns formation gained great interest from biologists and mathematicians, D’Arcy published a book, On Growth and Form, in 1992 in which he emphasized the place of laws and physical principles that activate the formation of patterns [7]. The work of D’Arcy was interesting, but he was unable to provide the experimental data for his work which was completely theoretical. Asai and Kondo studied the patterns in Pomacanthus, a marine angel fish. Pomacanthus, unlike mammals, has a unique characteristic of dynamic pattern change [8]. It was noted that whenever a new strip was inserted, the pattern on the fish changed. So, it was considered a good example in biological growth systems of a conserving mechanism of wavelength. This vigorous regulation of pattern accounts for reaction–diffusion models. Later, Painter et al. in 1999 extended the work by Kondo and Asai by confirming that the pattern sequences reproduced on the fish are the result of reaction–diffusion [9]. Many researchers have studied biological patterns that are self-organizing in gelatinous solution and Petri dishes [10,11,12,13,14,15]. Turing modeled the morphogenesis in a simple ring of cells and showed that a nonhomogeneous solution existed for these reaction–diffusion equations. Since then, significant interest has developed towards these types of reaction–diffusion equations.
To solve parabolic equations with curved surfaces, Calhoun and Helzel [16] introduced a technique in which the Turing model on different surfaces was studied, and the formation of patterns was observed. By avoiding the unstructured meshes or multi-blocked structures, these patterns solve the reaction–diffusion equation on several grids by single Cartesian grid mapping in computational space. Despite their strong scheme and the fact that they have good results in hemispheres, their method fails for disks and spheres. A new type of method for solving the reaction–diffusion model by obtaining an expression that is analytical in time and that reduces the differential dimension in space was introduced by Hongexiao Peng and Gendai Gu in 2015 [17]. This method was based on the homotopy method. An irregular yet surprising variety of spatiotemporal patterns was exposed by the numerical simulation of reaction–diffusion models. These patterns might consist of growing spots, growing until division and, if they become overfilled, even decaying. Turing patterns were formed by the loss of the stability of the system under certain conditions, and so the patterns were evolved by the numerical simulations and mathematical analysis. Hence, analysis was presented on controlling the pattern formation in the presence of Turing instability, where the dominance of cancer cells occurs [18].
The mutual interaction in spatial patterns forms through development. These types of systems are used widely in biology, chemistry, ecology, physics, geology and many more branches of science. These reaction–diffusion equations not only model morphogens but are also used in modeling of host and parasite model population densities, chemical waves and electric reactions in the nerve cells [19,20]. Turing suggested that because of diffusion, homogeneous regions could result in nonhomogeneous solutions. This theory gained the interest of many biologists [21]. Because nonlinear terms in these systems are coupled with diffusion terms, it is difficult to obtain the exact solution of reaction–diffusion models. So, most scientists turn towards approximate solutions.
Spectral methods are well-known for their rapidly converging quality at a very high accuracy for the approximate solution of partial differential equations. Given few collocation points, they provide an exponential convergence order if the data in the given equation are smooth. The main objective of our work is to develop a very efficient and accurate numerical scheme for a reaction–diffusion equation in the form of a Gray–Scott model. These models give rise to the solution, such as shockwave behavior, with very excitable spatiotemporal dynamics of Turing pattern formation. For this reason, it is essential to use a high-order scheme based on the Chebyshev spectral method for the nonhomogeneous steady-state solutions of the Gray–Scott model which is used in the spatial aspect, while the temporal aspect is discretized using RK-4. Spectral collocation methods were most recently used for some real-world problems in [22,23,24,25,26,27].
The rest of this paper is structured as follows. We include a brief overview of a reaction–diffusion equation in Section 2. Section 3 consists of the model equation and a detailed methodology for its solution, followed by the stability analysis results in Section 4. The numerical results are provided in Section 5, and Section 6 provides the concluding remarks.
2. Reaction–Diffusion System
A parabolic system of a partial differential equation that acquires the following forms is generally known as a reaction–diffusion system.
where are matrices that are diagonal, having positive constants diffusion coefficients. The functions f and g depend on the reactant concentrations, so they have great importance. Reaction–diffusion systems, which Turing initiated, follow one of two types: continuous or discrete. Reaction–diffusion systems that are discrete systems typically have cells and lattice coupling through their membranes via mass transfer. Hence, when compared to the continuous ones, they can be considered closer to biological systems [28]. Discrete systems are less popular than the continuous systems. Turing noted that if one chemical is stronger than the other and both work in opposition, then the homogeneous state of solution would shift to the nonhomogeneous state. He suggested the name diffusion-driven instability for that unstable state of solution as it was derived from diffusion, and so the pattern concentration causes [29]. The general form of the Turing mathematical model is
where D is a matrix that is typically diagonal of the form , U is modeling the chemical concentration in space at time t, and models chemical reactions. The diffusion kinetics under the absence of a reaction do not display instability.
Common Turing Models
Diffusion-driven instability is known as the basis of morphogensis as it leads to the pattern formation of stripes and spots, and scientists began to think that there could be some link between the patterns formed. Therefore, several mathematical models were introduced which are known as reaction–diffusion models. The Schnakenberg model was one of the models that became widely popular for the development of patterns [30]. This model has the following form
Barrio et al. introduced the model in 1999 that is well-known as the BVAM model [31,32] and typically modeled as
The Gray–Scott model is also one of the important models with the form
This is the model that we have taken into account in this paper. Many scientist have numerically studied this model using different approaches.
3. Gray–Scott Model and Solution Methodology
The system that the Gray–Scott model represents is the autocatalytic Selkov model of glycolysis variant due to Gray and Scott [33,34]. The model is of the form
where u and v represent the concentration of the chemicals U and V. The concentration rate with respect to time is determined by chemical reaction rates depending on other chemical concentrations and by diffusion which is a modeled Laplacian concentration with respect to space. and are coefficients of diffusion for concentration, F is the feed rate, and K is the rate constant that is dimensionless.
To solve the Gray–Scott model, we first choose the basis function of the form:
For the Chebyshev method, we have
which implies that
also
By the property of weak characterization. set the inner product with the basis function as zero
Simplifying the term
By keeping only N terms instead of infinite sums, we obtain only unknowns and equations.
For convenience, we rewrite the sums as
Our final two equations will be
These two equations are then solved numerically in time derivative using the Runga–Kutta method.
4. Stability Analysis
4.1. Equilibrium Points
To find the homogeneous equilibria of the the Gray–Scott equation, we have to take the diffusion representing the Laplacian term as zero. This is because at the homogeneous state, the concentration will remain constant, and so no diffusion takes place. Here, we use the same procedure as described in [35].
We will have
As for spectral methods, we will be approximating u as
For , we will have
As the Laplacian term is zero, therefore
The coordinate functions in the above equation and are time-dependent only. Subscripts can be removed as
Equilibrium points have the property that they will not change over time; hence the left-hand side of the above equation must be zero.
From the first equation, we can have
putting it in second gives
hence we are facing two conditions here, either or . By the first case, we have and obtaining the equilibrium point as . By the second case, we obtain the equation quadratic in b as
Applying the simple quadratic formula, we obtain
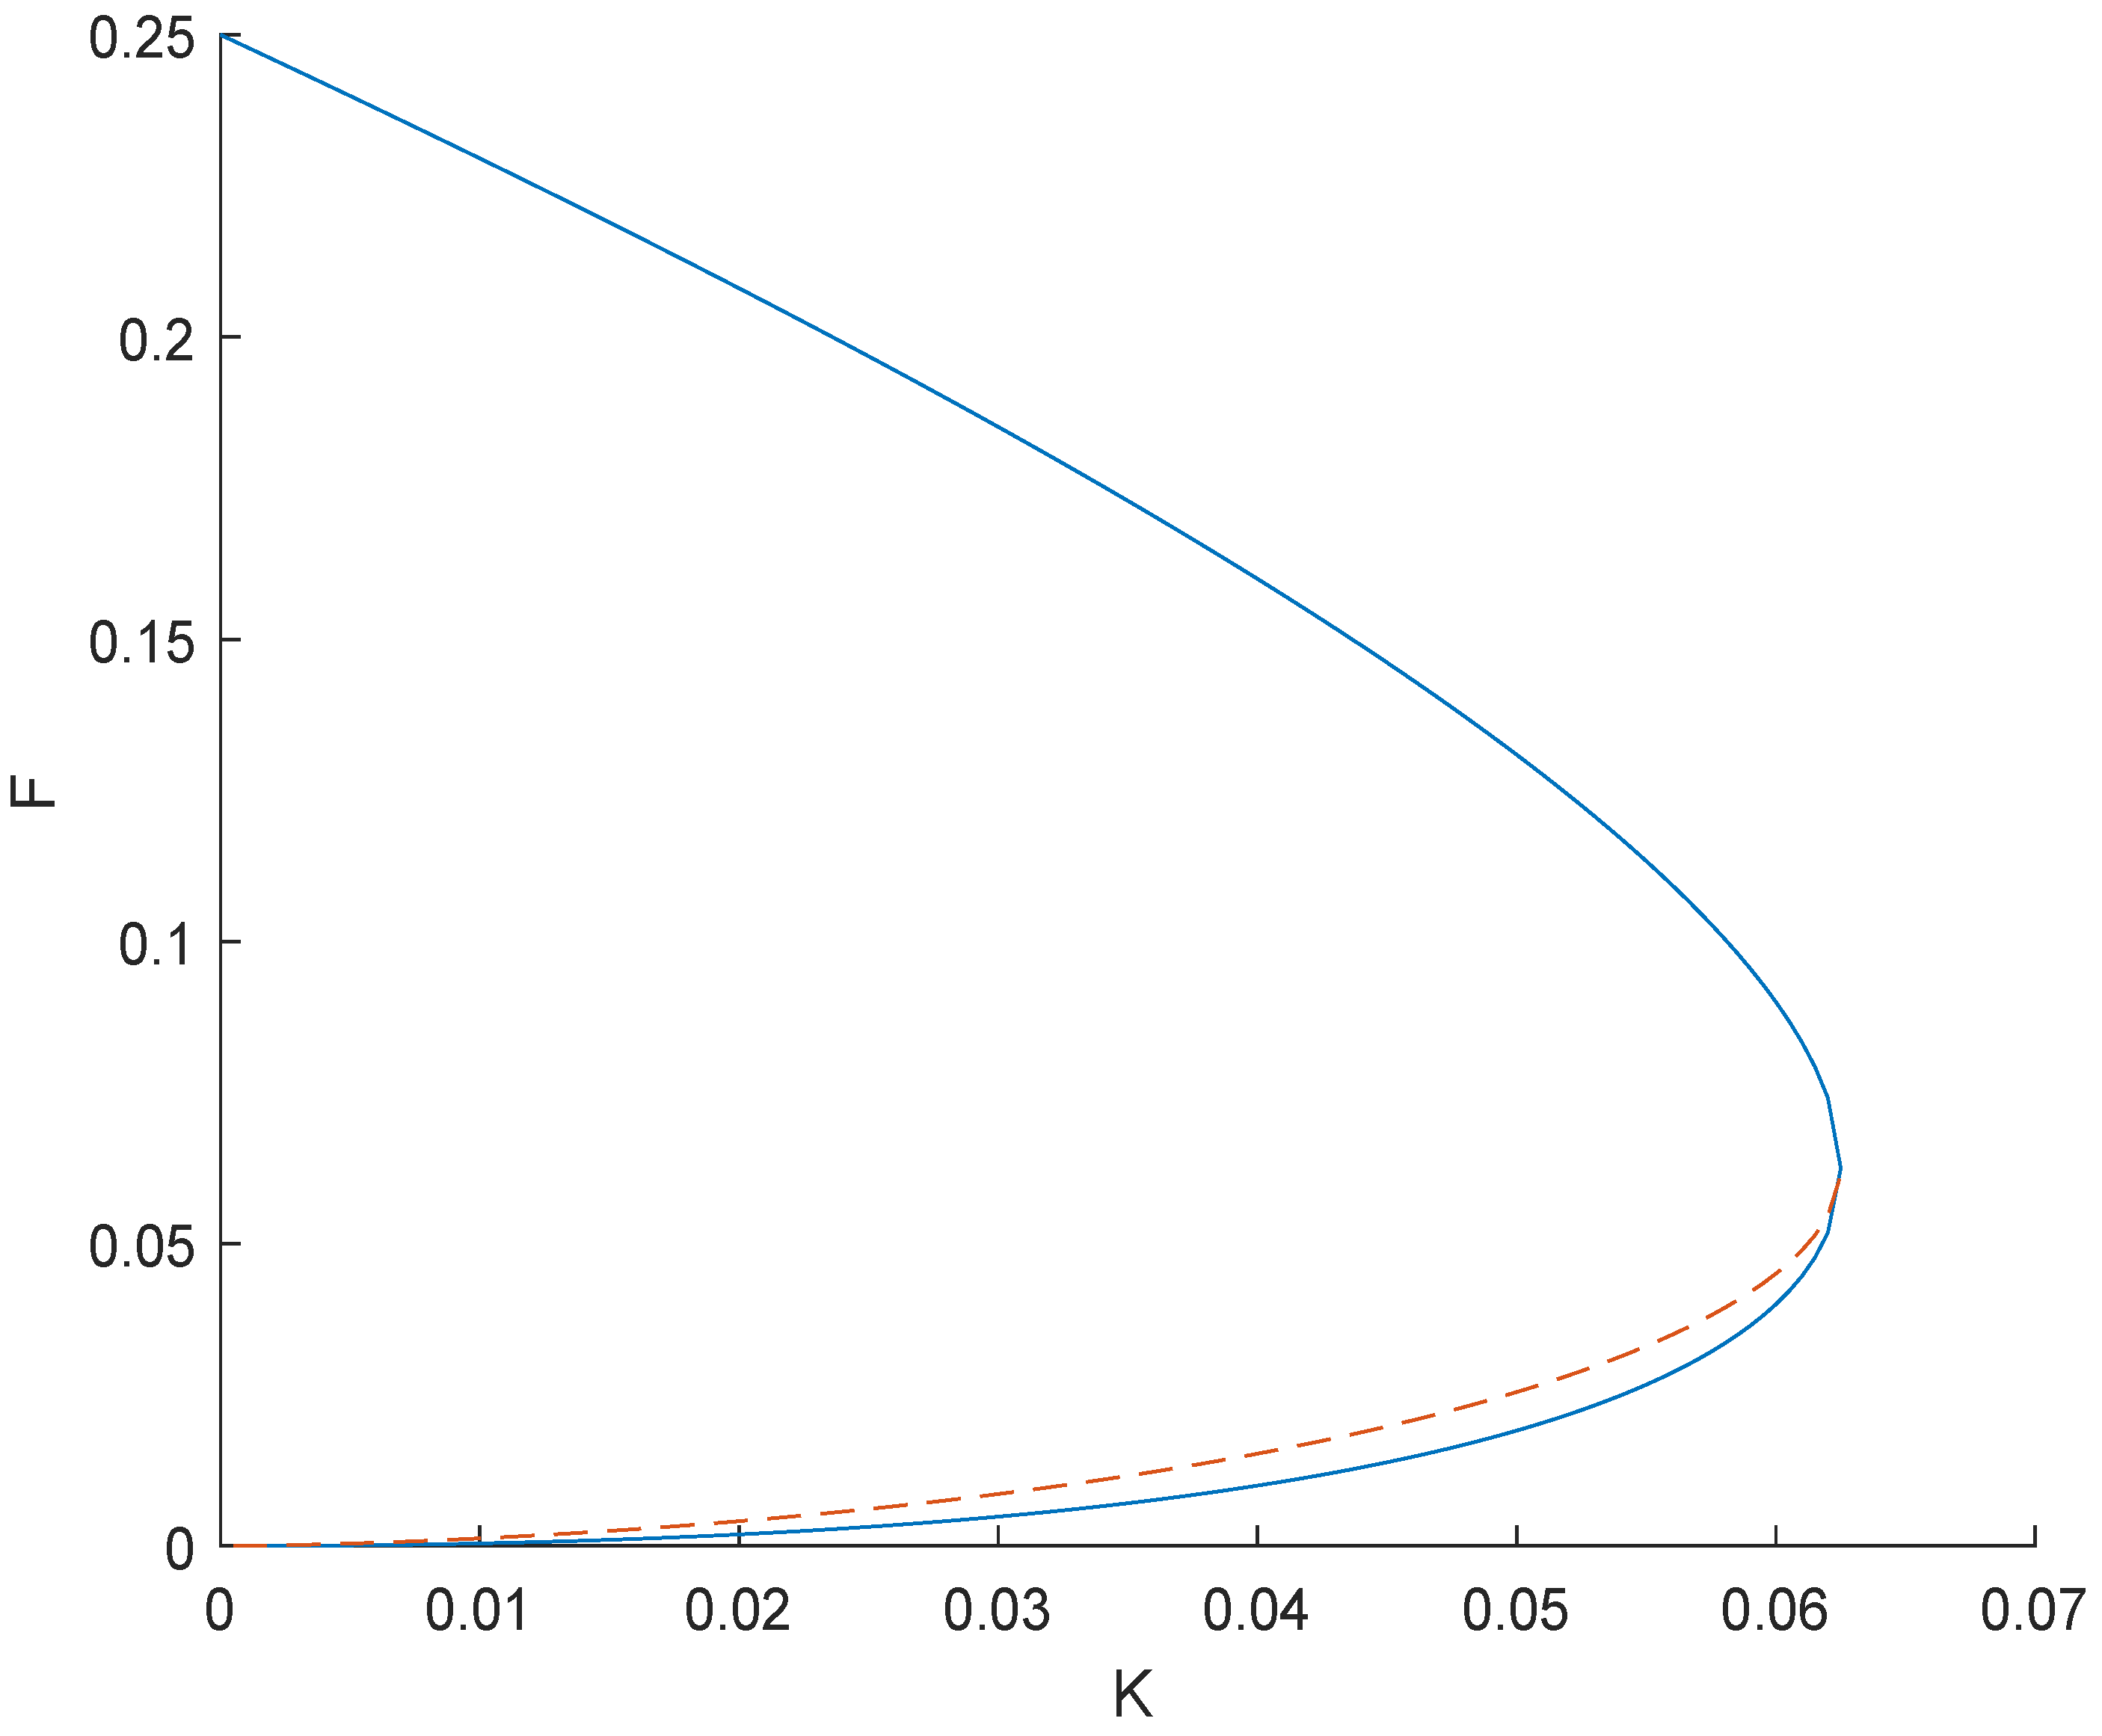
Hence, we have three equilibrium points at , and at Equation (31) , as does Equation (32) . Let be independent points of equilibrium and the other two be dependent as they depending F and K. Dependent points of equilibrium exist when , and by simple calculations of calculus we can find the maxima of K giving exactly two points of equilibrium. The critical point is at as shown in Figure 1.
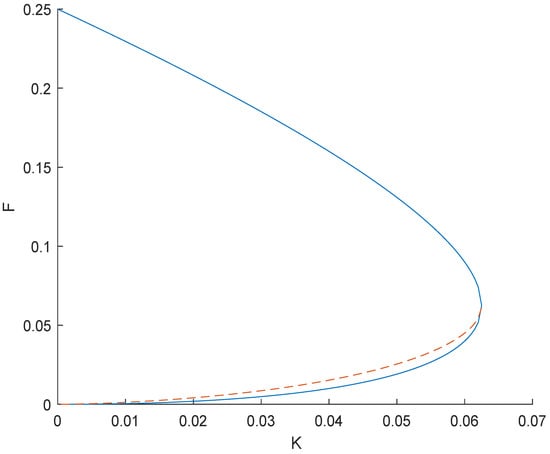
Figure 1.
Comparison of F and K with two equilibrium points.
F has the maximum value at which the existence of equilibrium points is possible for gives , and we obtain the value and . We can now say that the region for the existence of equilibrium points is bounded as
Values of and depend on the parameters F and K.
To show that there are exactly two equilibrium points, consider
Dealing with exactly two equilibrium points results in the disappearance of the fundamental term of the above equation, resulting in only. From Equation (34) we obtain, , and so replacing the value of b into a gives
We also have , so we obtain
which means that now it is not wrong to say that when we have exactly two equilibrium points, then we obtain the value of a as . When we decrease K instead of increasing it, we apply limit that have . Let us look at the limit on both a and b. First, since we know that , applying the limit gives
Similarly, in the case of a, we have . Applying the limit, we obtain
Rationalizing results into
The stability of a system that is nonlinear can be determined from the matrix of eigenvalues obtained by linearizing the system about the point of equilibrium. Let and be the equilibrium points and satisfying the condition for the steady state and uniformity, that is,
Consider small and and replace and .
Linearizing the system by taking the Taylor expansion about and
Replacing and from Equation (43) in Equation (44) and ignoring the higher order gives
One can easily obtain the eigenvalue matrix known as the stability matrix as
The solution has the terms that have J’s eigenvalues in the exponent, so if any eigenvalue of J has a positive part, then the system will become unstable because of the gradual increase in the perturb values of and . Hence, we must have negative real parts of eigenvalues of J. For the system of Gray–Scott, we have the matrix of stability as
The eigenvalues would depend on the values of F and K because the points of equilibrium also depend on F and K.
4.2. Stability of Independent Equilibrium Points
As at point , we have an equilibrium point at , and by putting the values, we obtain
We now have the diagonal matrix and eigenvalues equal to its diagonal entities. Hence, and are the eigenvalues. As F and K will always be positive constants, the eigenvalues will be negative, leaving the independent equilibrium point always stable.
4.3. Stability of Dependent Equilibrium Points
For the stability analysis of the equilibrium point , let the value of a be in the Jacobin matrix as
taking the determinant gives
as we have always positive but what about second term , as we have the value of b for as
Since the term of the radical must be
In addition, we know the condition that , . Hence, we have , which can rewritten as
Rearranging results in
We know that the left-hand side of the above equation is the value of ; hence, we can also write it as
4.4. Stability with Diffusion
So far, we have been dealing with the system having zero diffusion. From now on, we will be considering diffusion as well. We have the general reaction–diffusion system as
First, we analyze the solution’s behavior in a neighborhood that is small , so we need to make the substitution as
also
and
Substituting in Equation (57), we obtain
Following the same procedure as conducted before for applying the Taylor expansion for the f and g function about
and obtaining the stability matrix as
using Equation (61) gives
As are assumed to be stable, meaning the eigenvalues are negative, now let and as eigenvalues of J give us
Let be the eigenfunction and be the scalar depending on the basis function partially used. The solution we are seeking should be of the form
Substituting in Equation (57) and dividing by results in
Let be the matrix on which the eigenvalues are depending for stability, so by using trace and determinant, we have
which are the sufficient and necessary conditions for stability.
4.5. Diffusion Instability
First, let the diffusion constants be equal to one another s.t , so the conditions for stability become
As in the first equation, is a negative number and is also, so the inequality in negative term holds. Similarly, in the second condition, it can be seen that the first term will always be positive, as are the second and third, hence holding the inequality. Thus, since the system satisfies the conditions of stability by equal diffusion constants, it can be said that instability occurs with the unequal diffusion constants.
4.6. Stability of Equilibrium Point for Feasible Constants
We have the eigenvalue matrix as
Putting those values results as
Now, it is also known that is a homogeneous solution for our equation; hence
Again analyzing the stability conditions, we have
Both conditions for stability are satisfied, showing that the point is stable for parametric values that are diffusion and reactions. Turing suggests that the patterns were formed because of diffusion terms and not reaction. Murray, Ouyang and others searched for Turing models and examined the diffusion-driven instabilities [36,37]. For more details about these models, we refer the reader to [38,39].
5. Results and Discussions
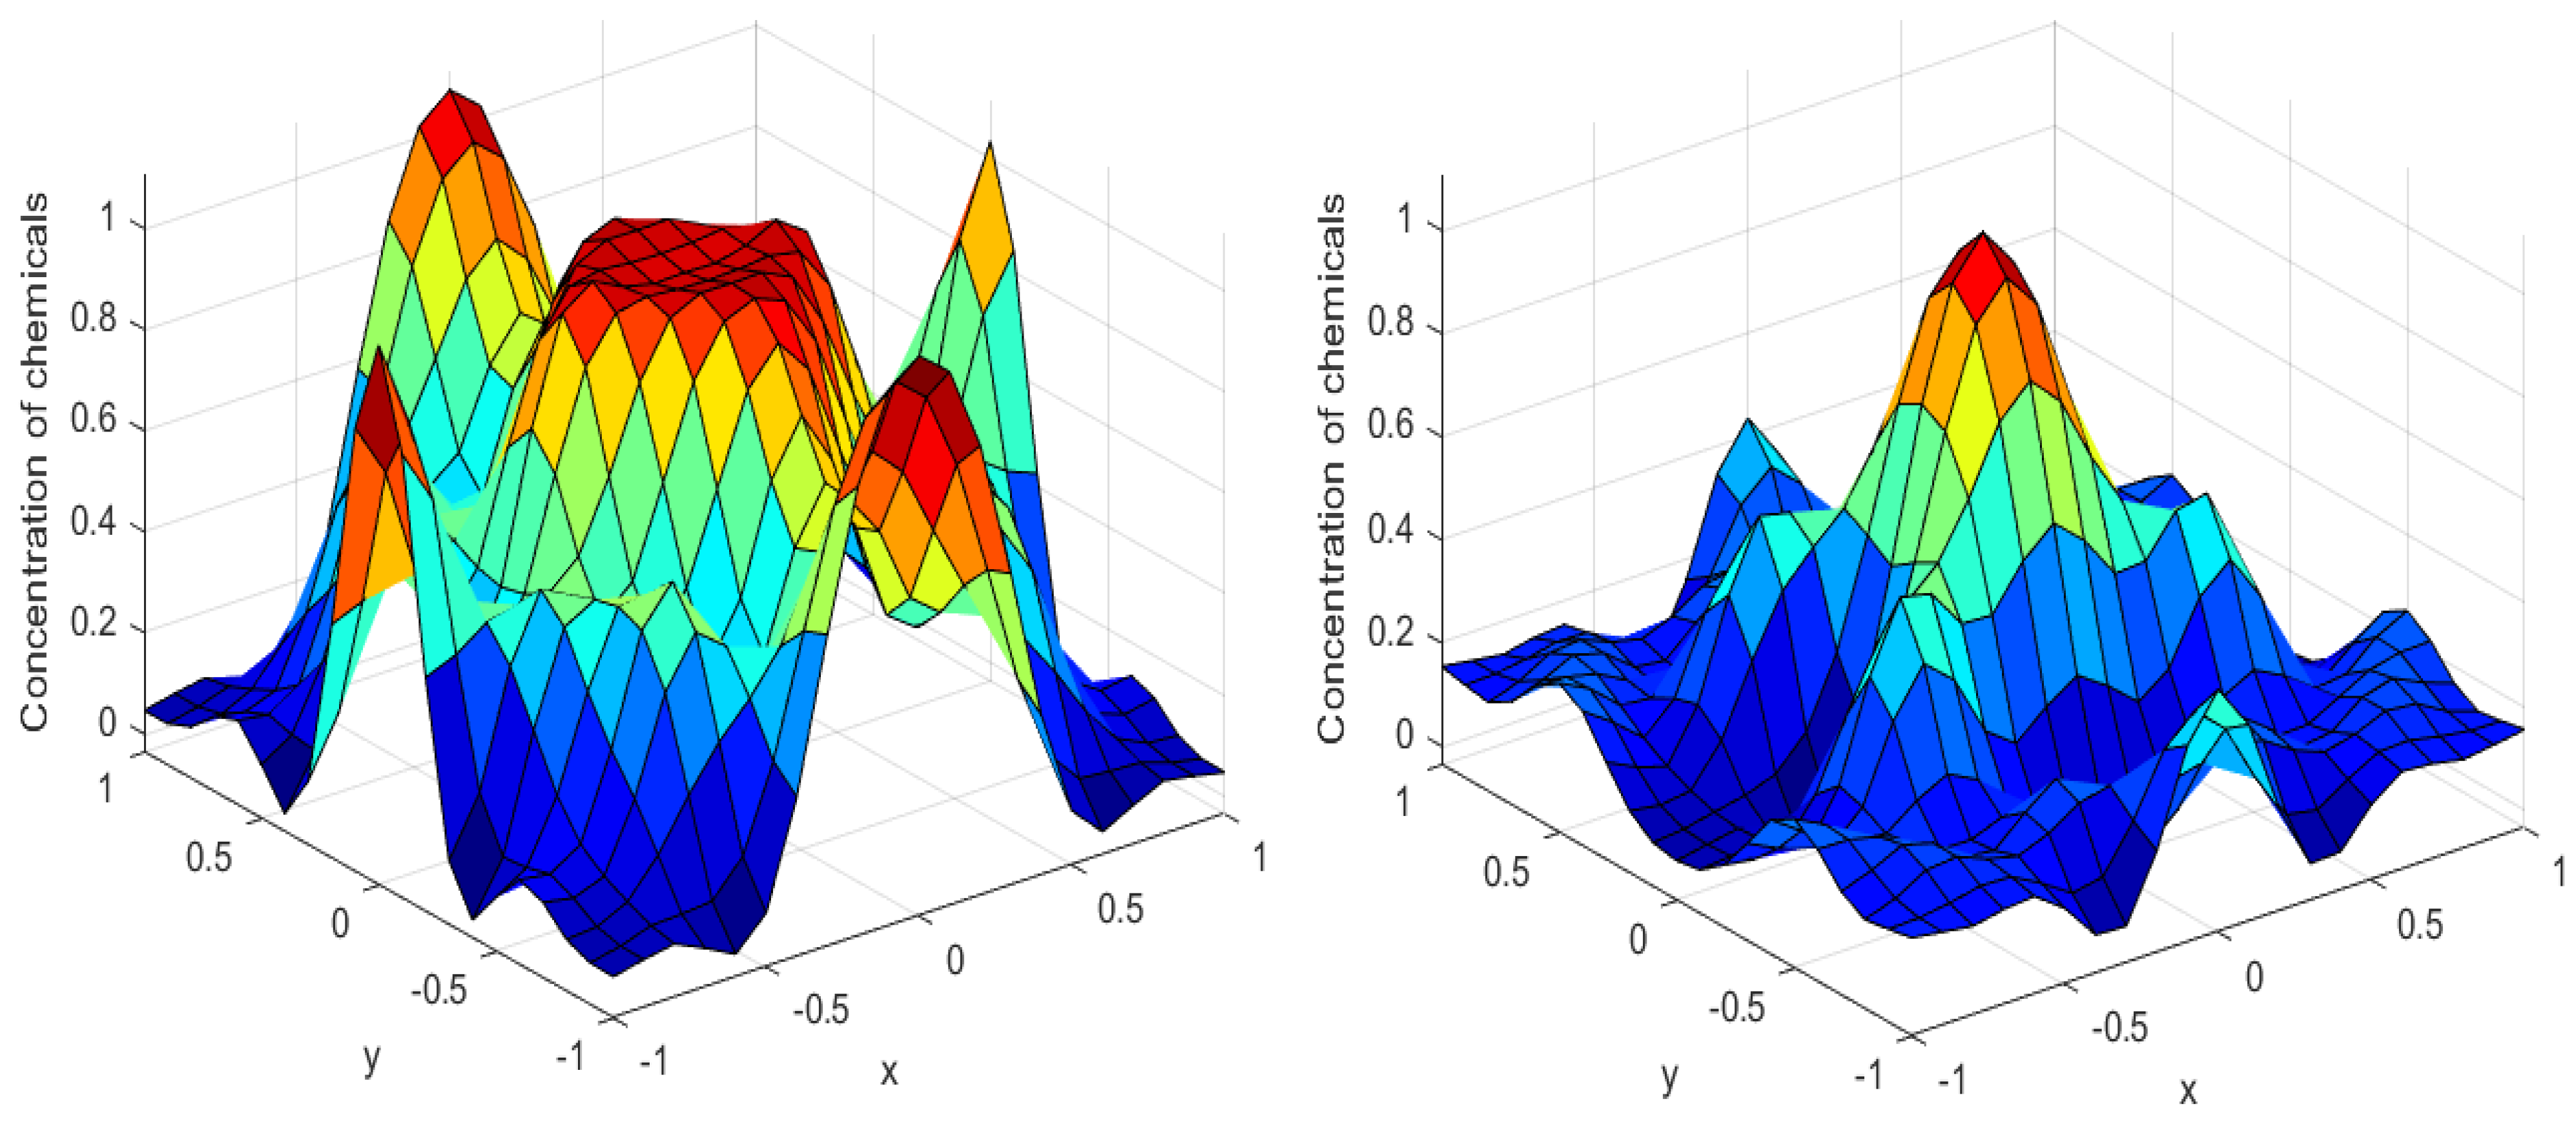
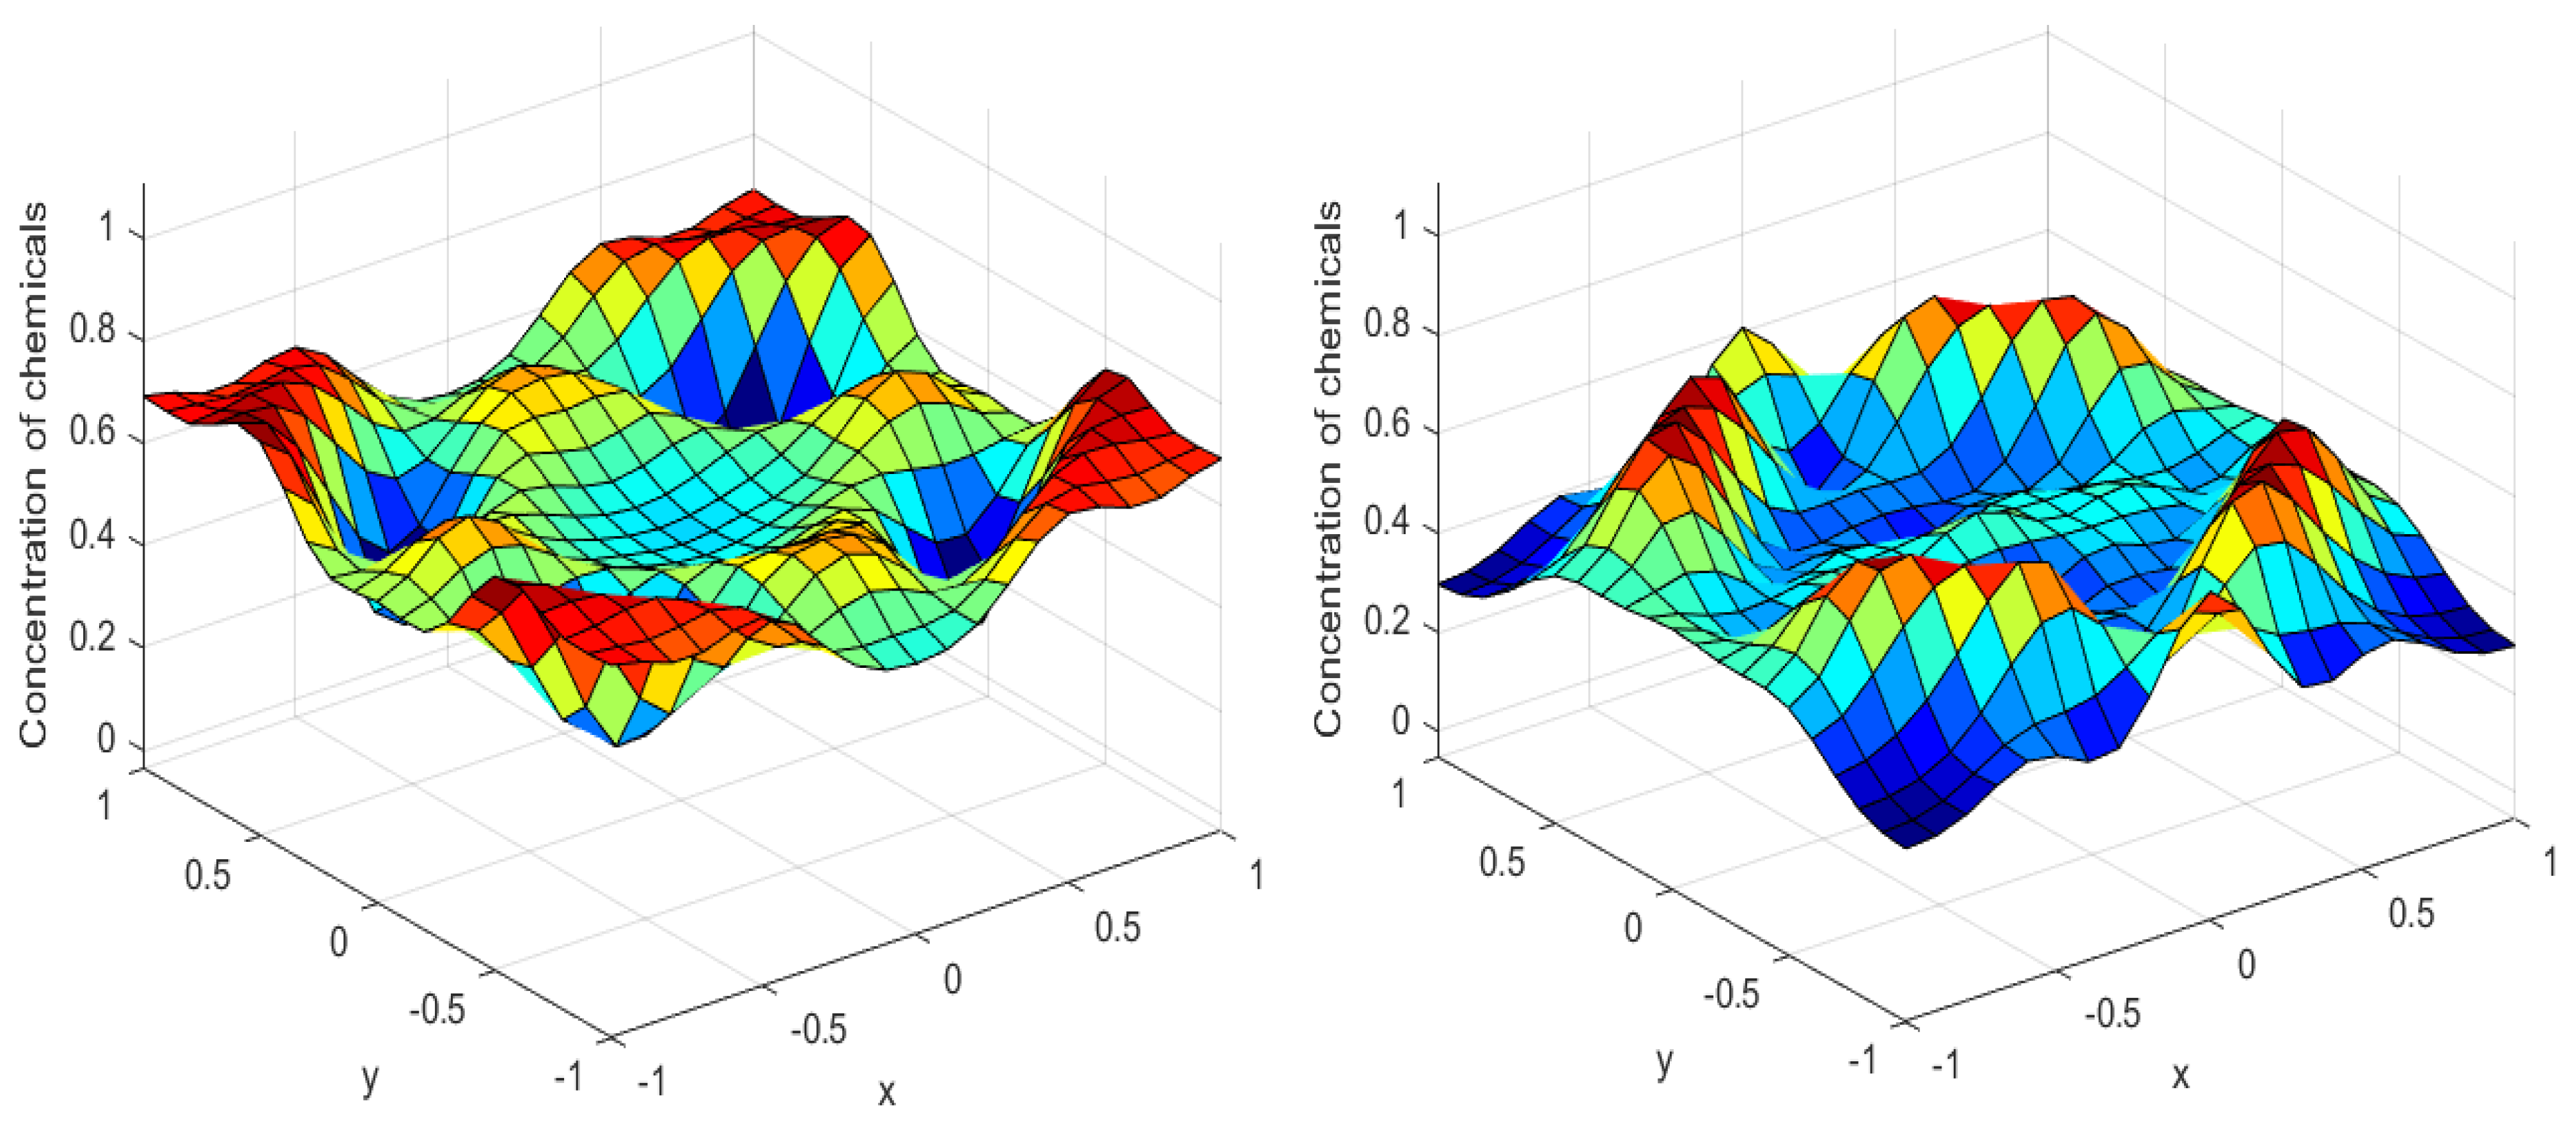
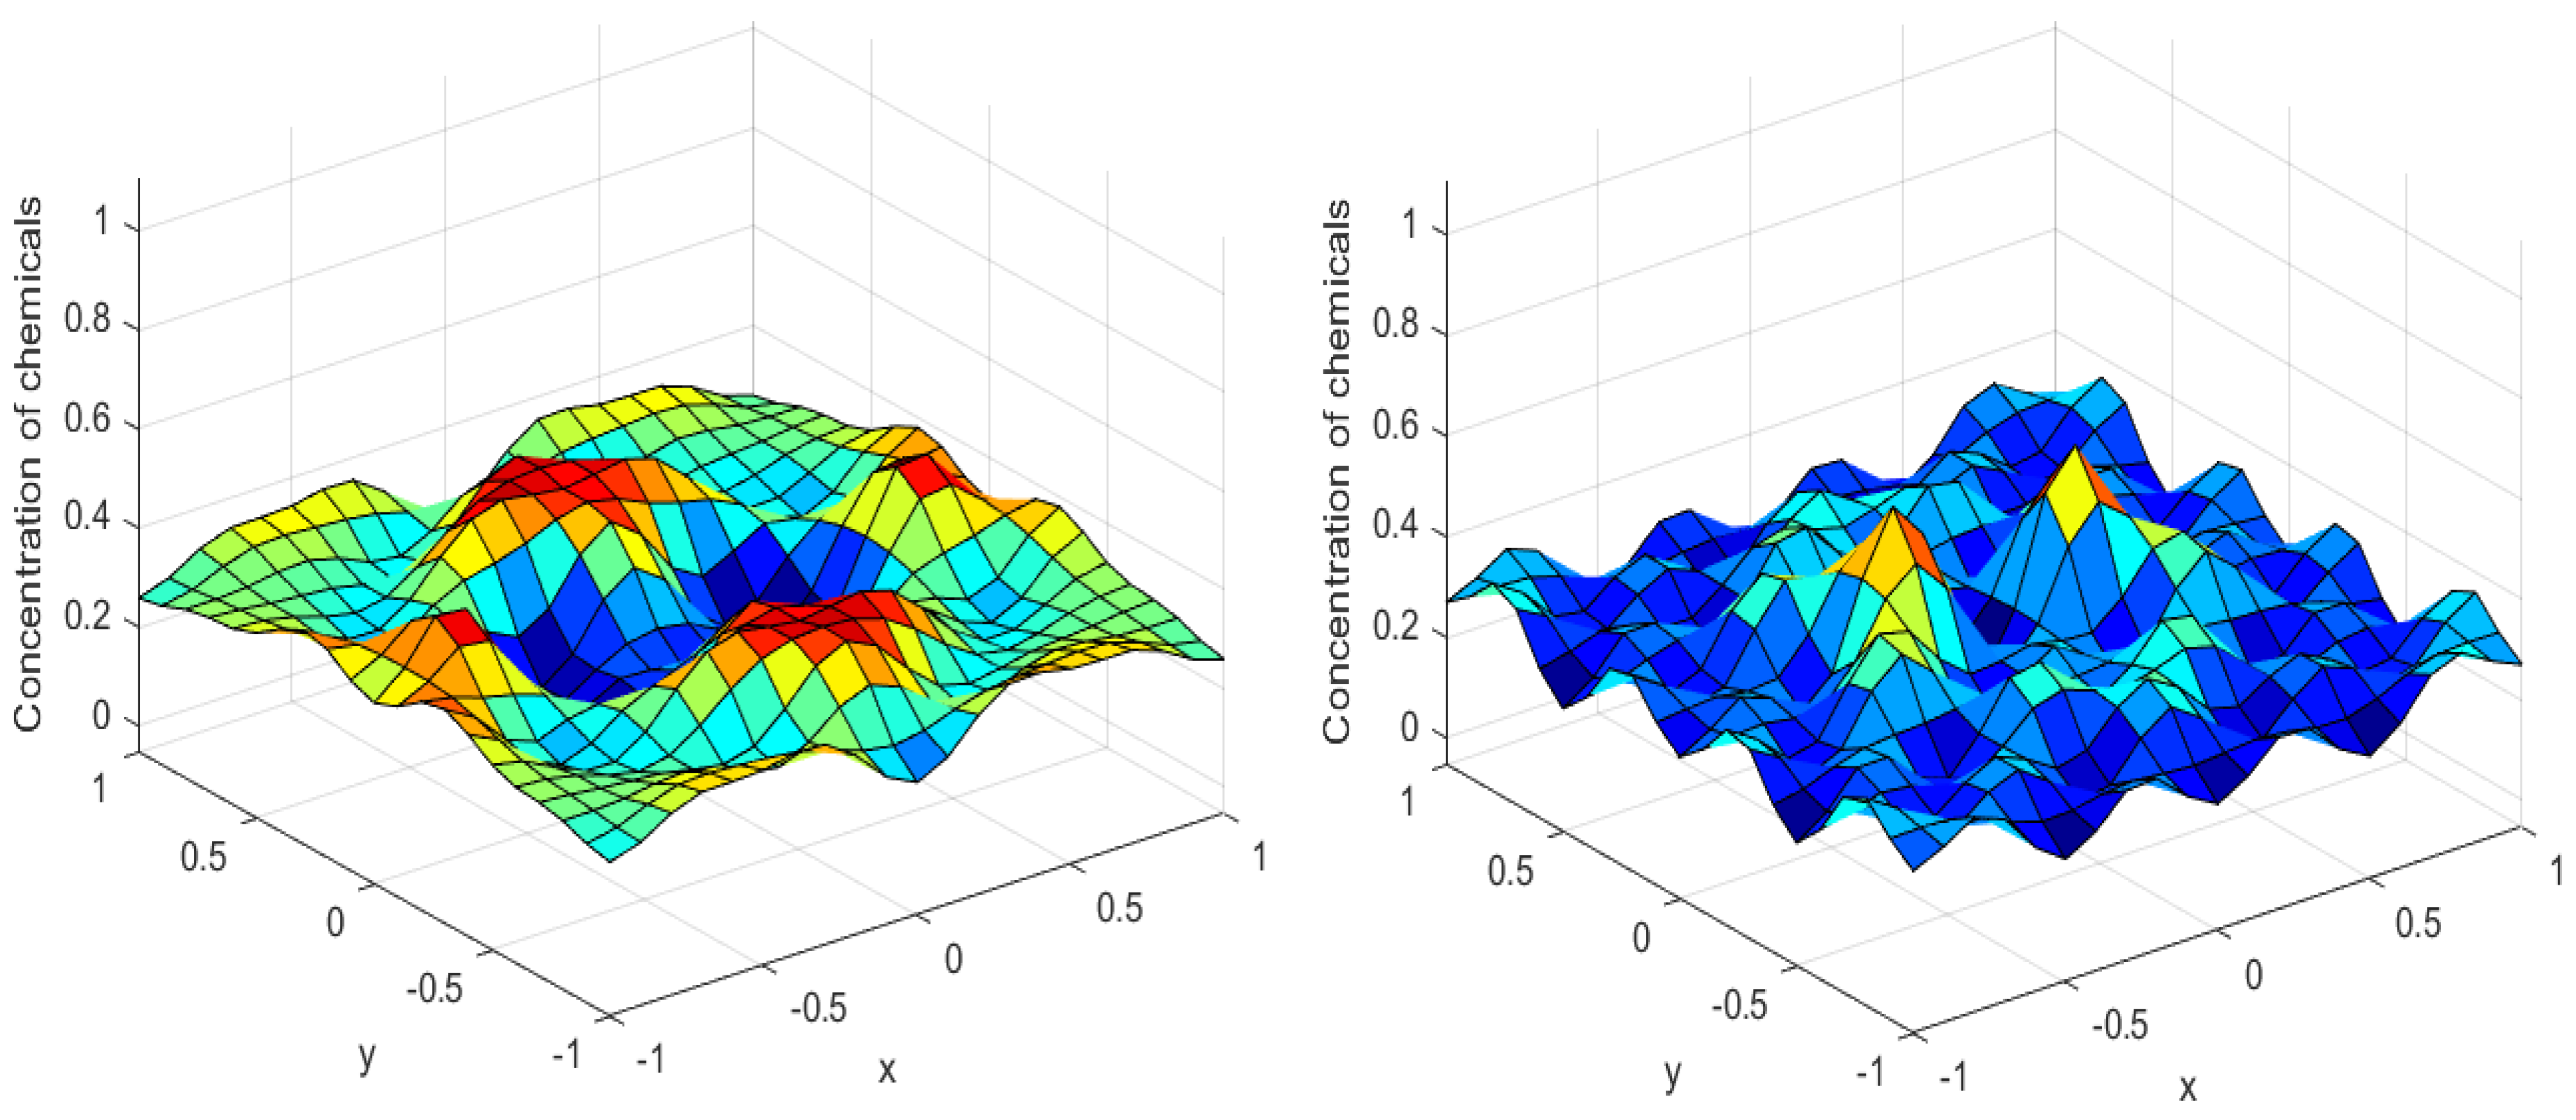
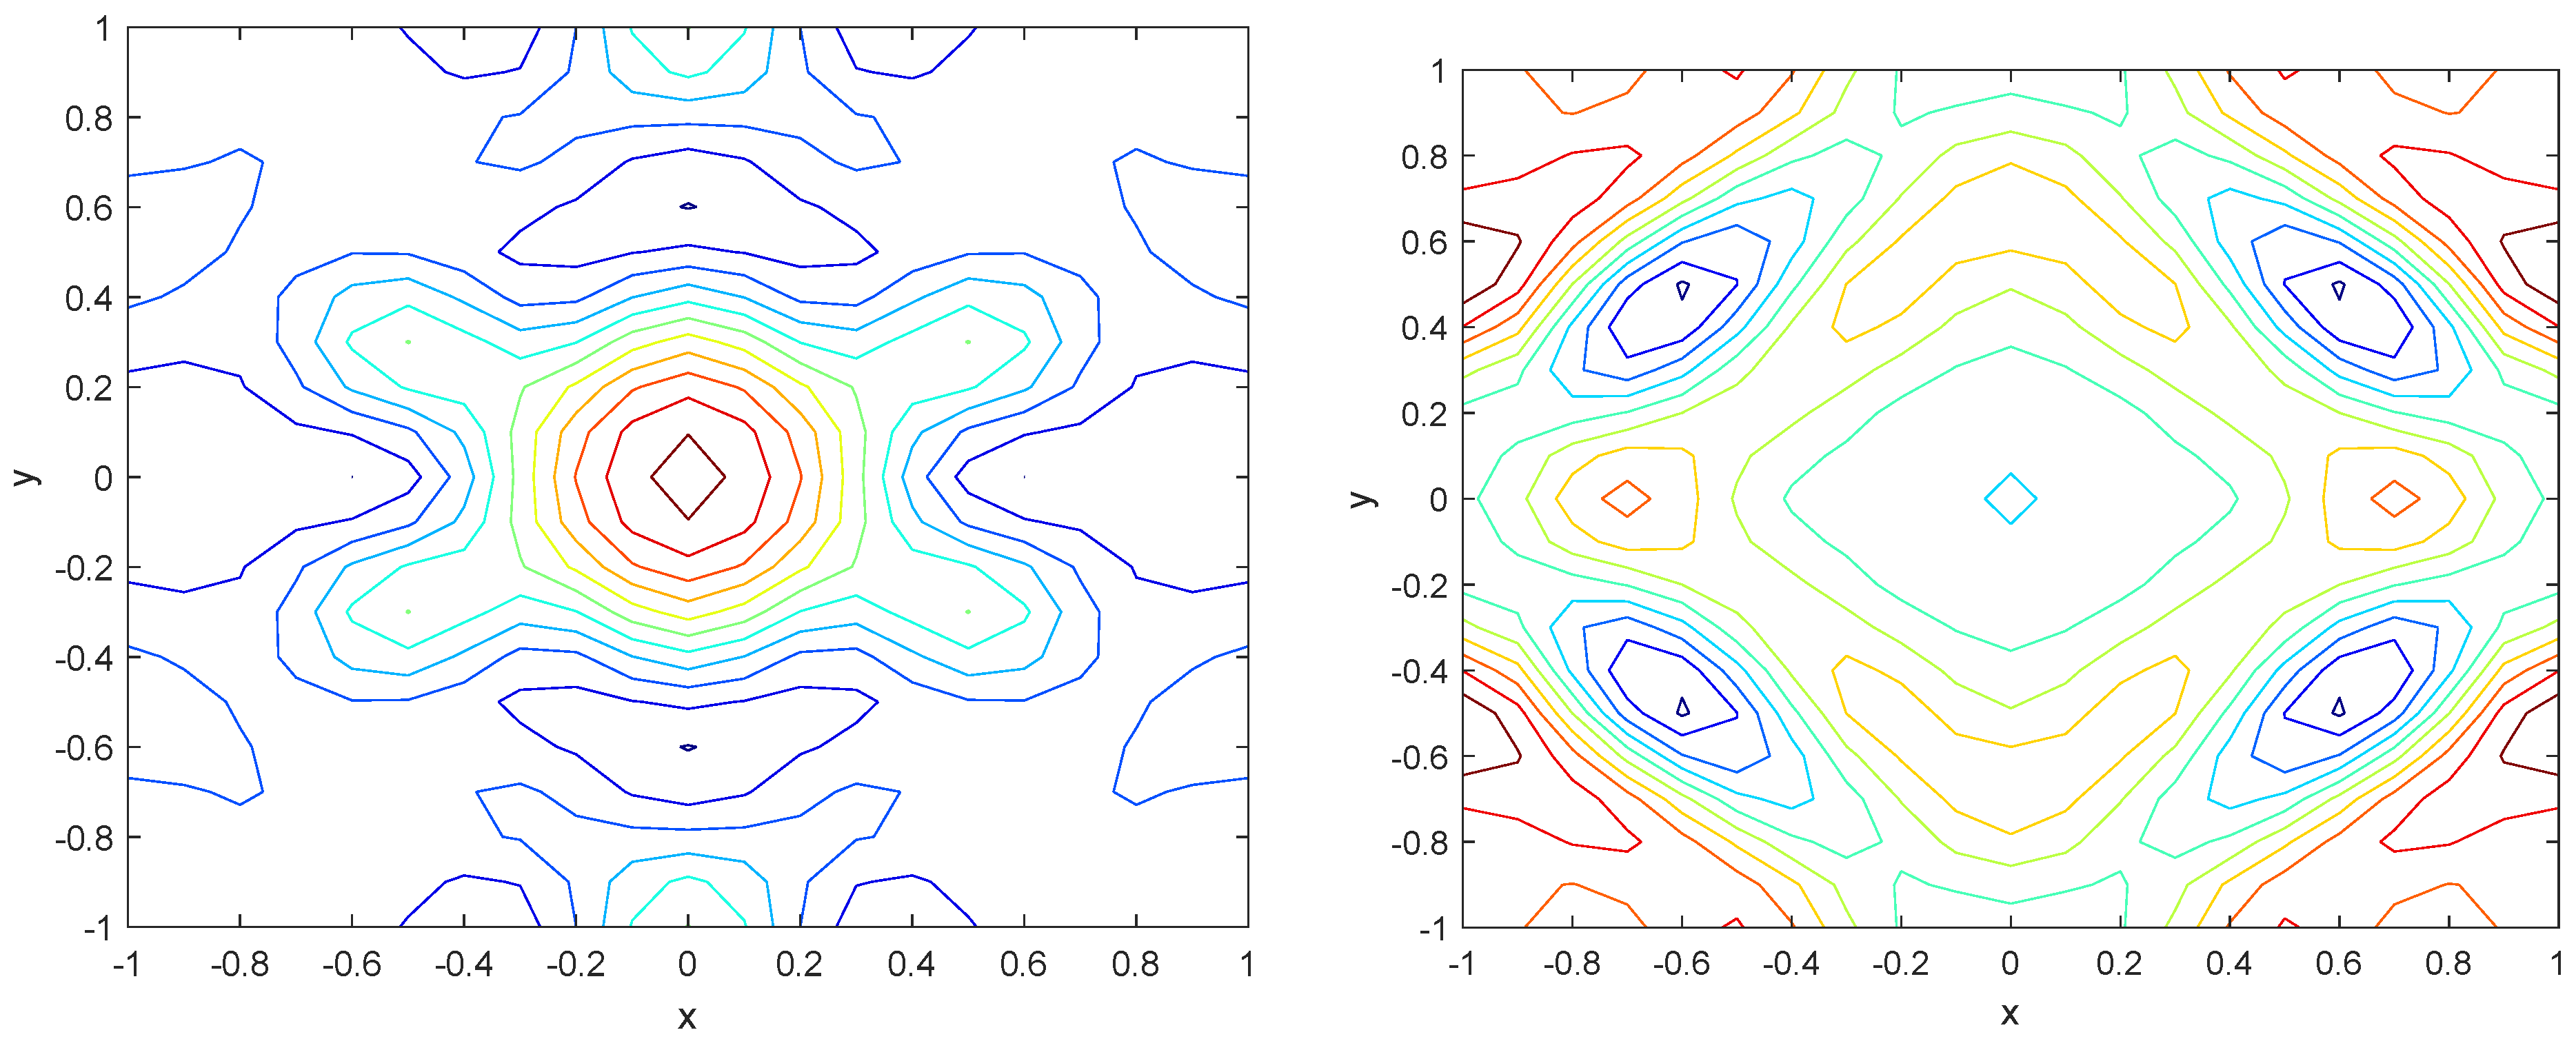
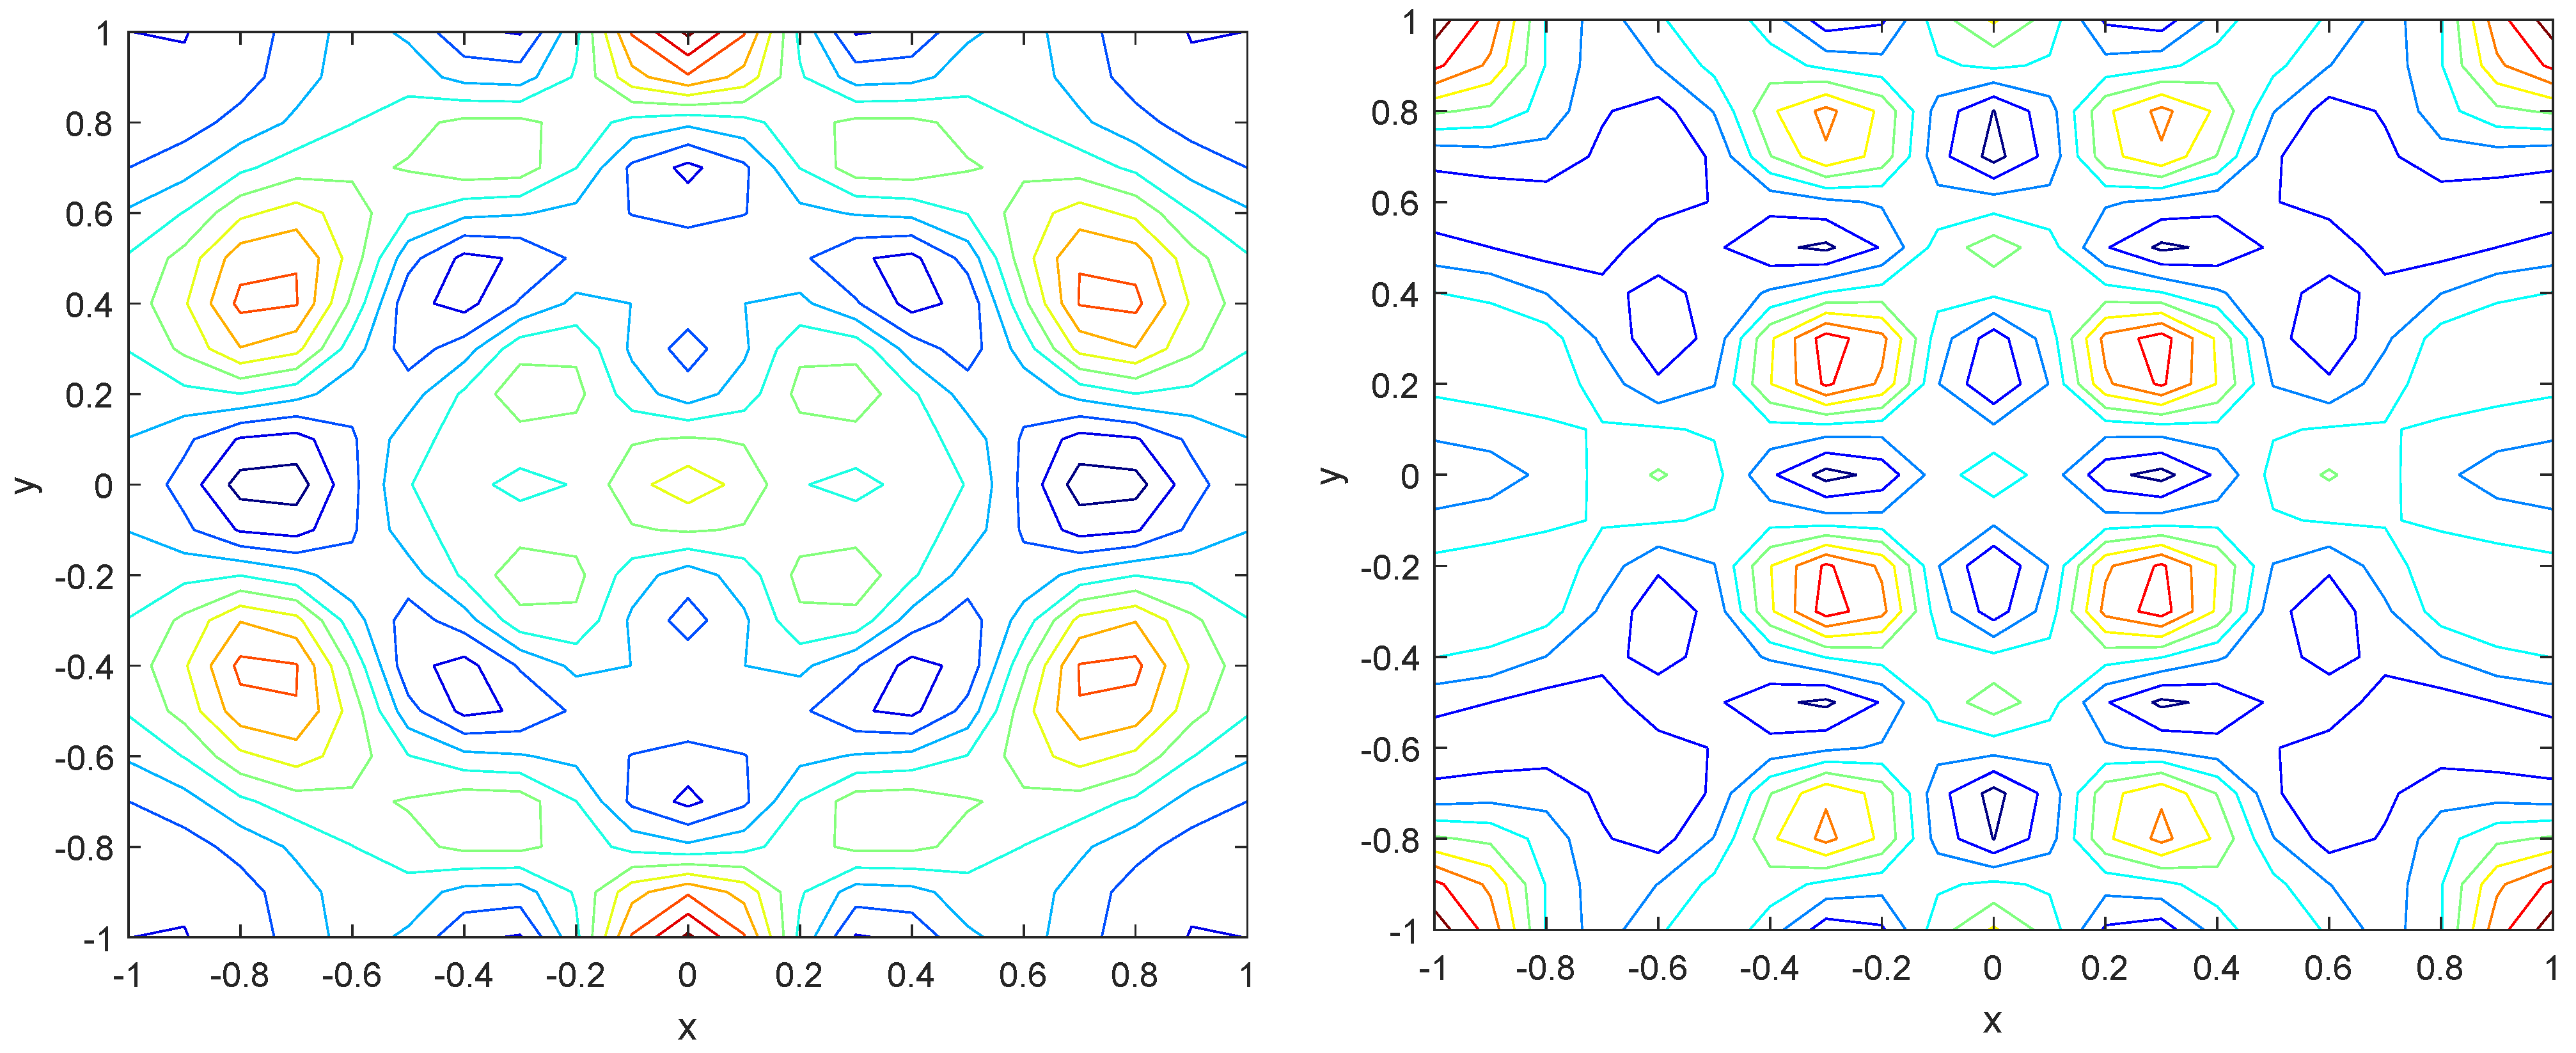
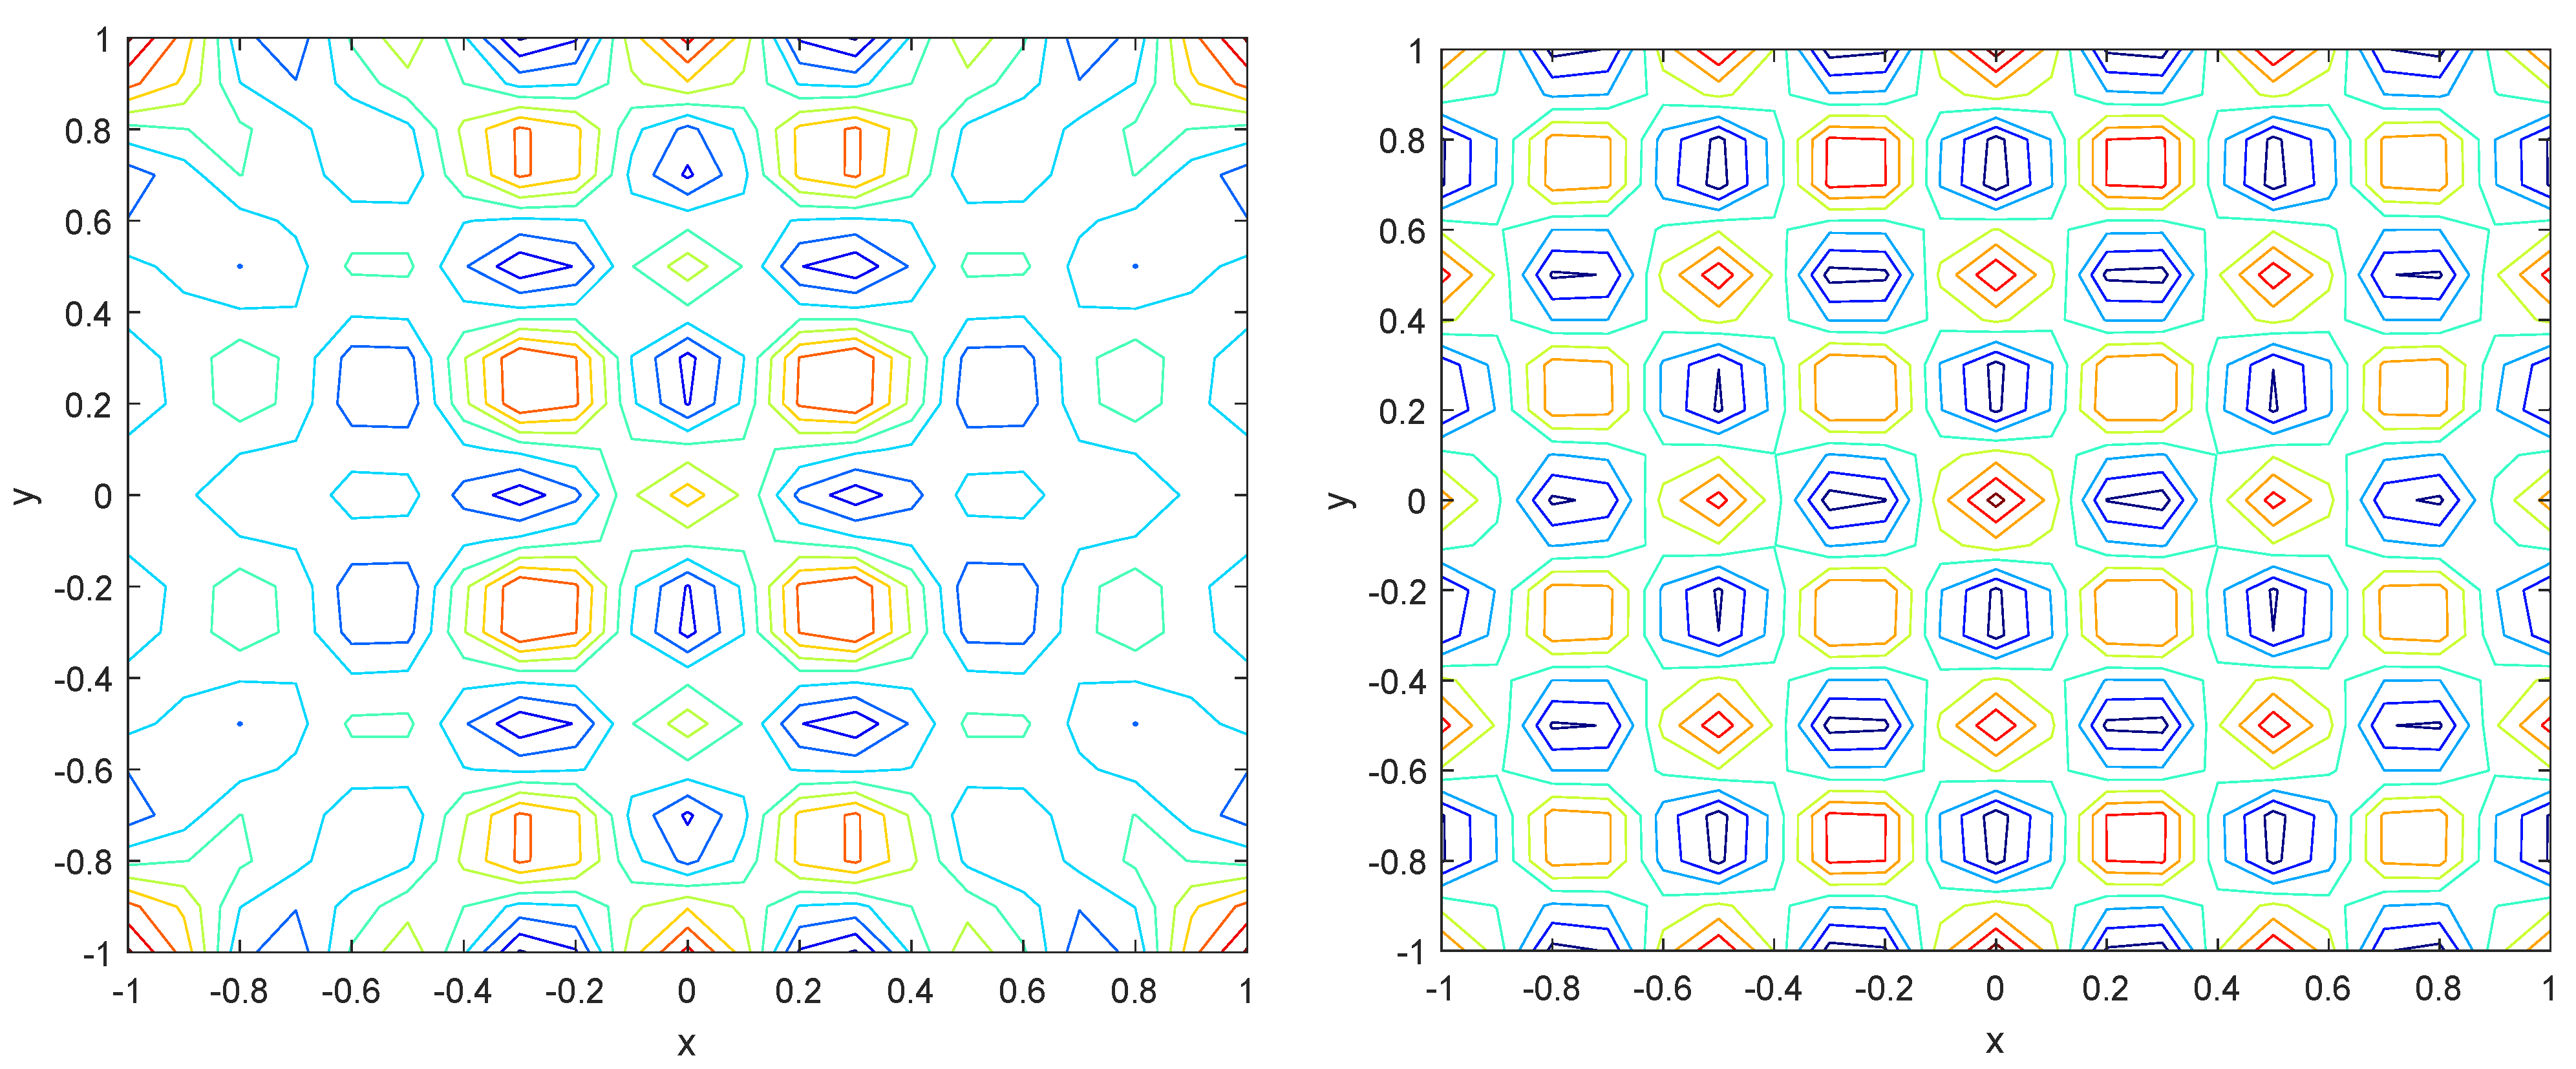
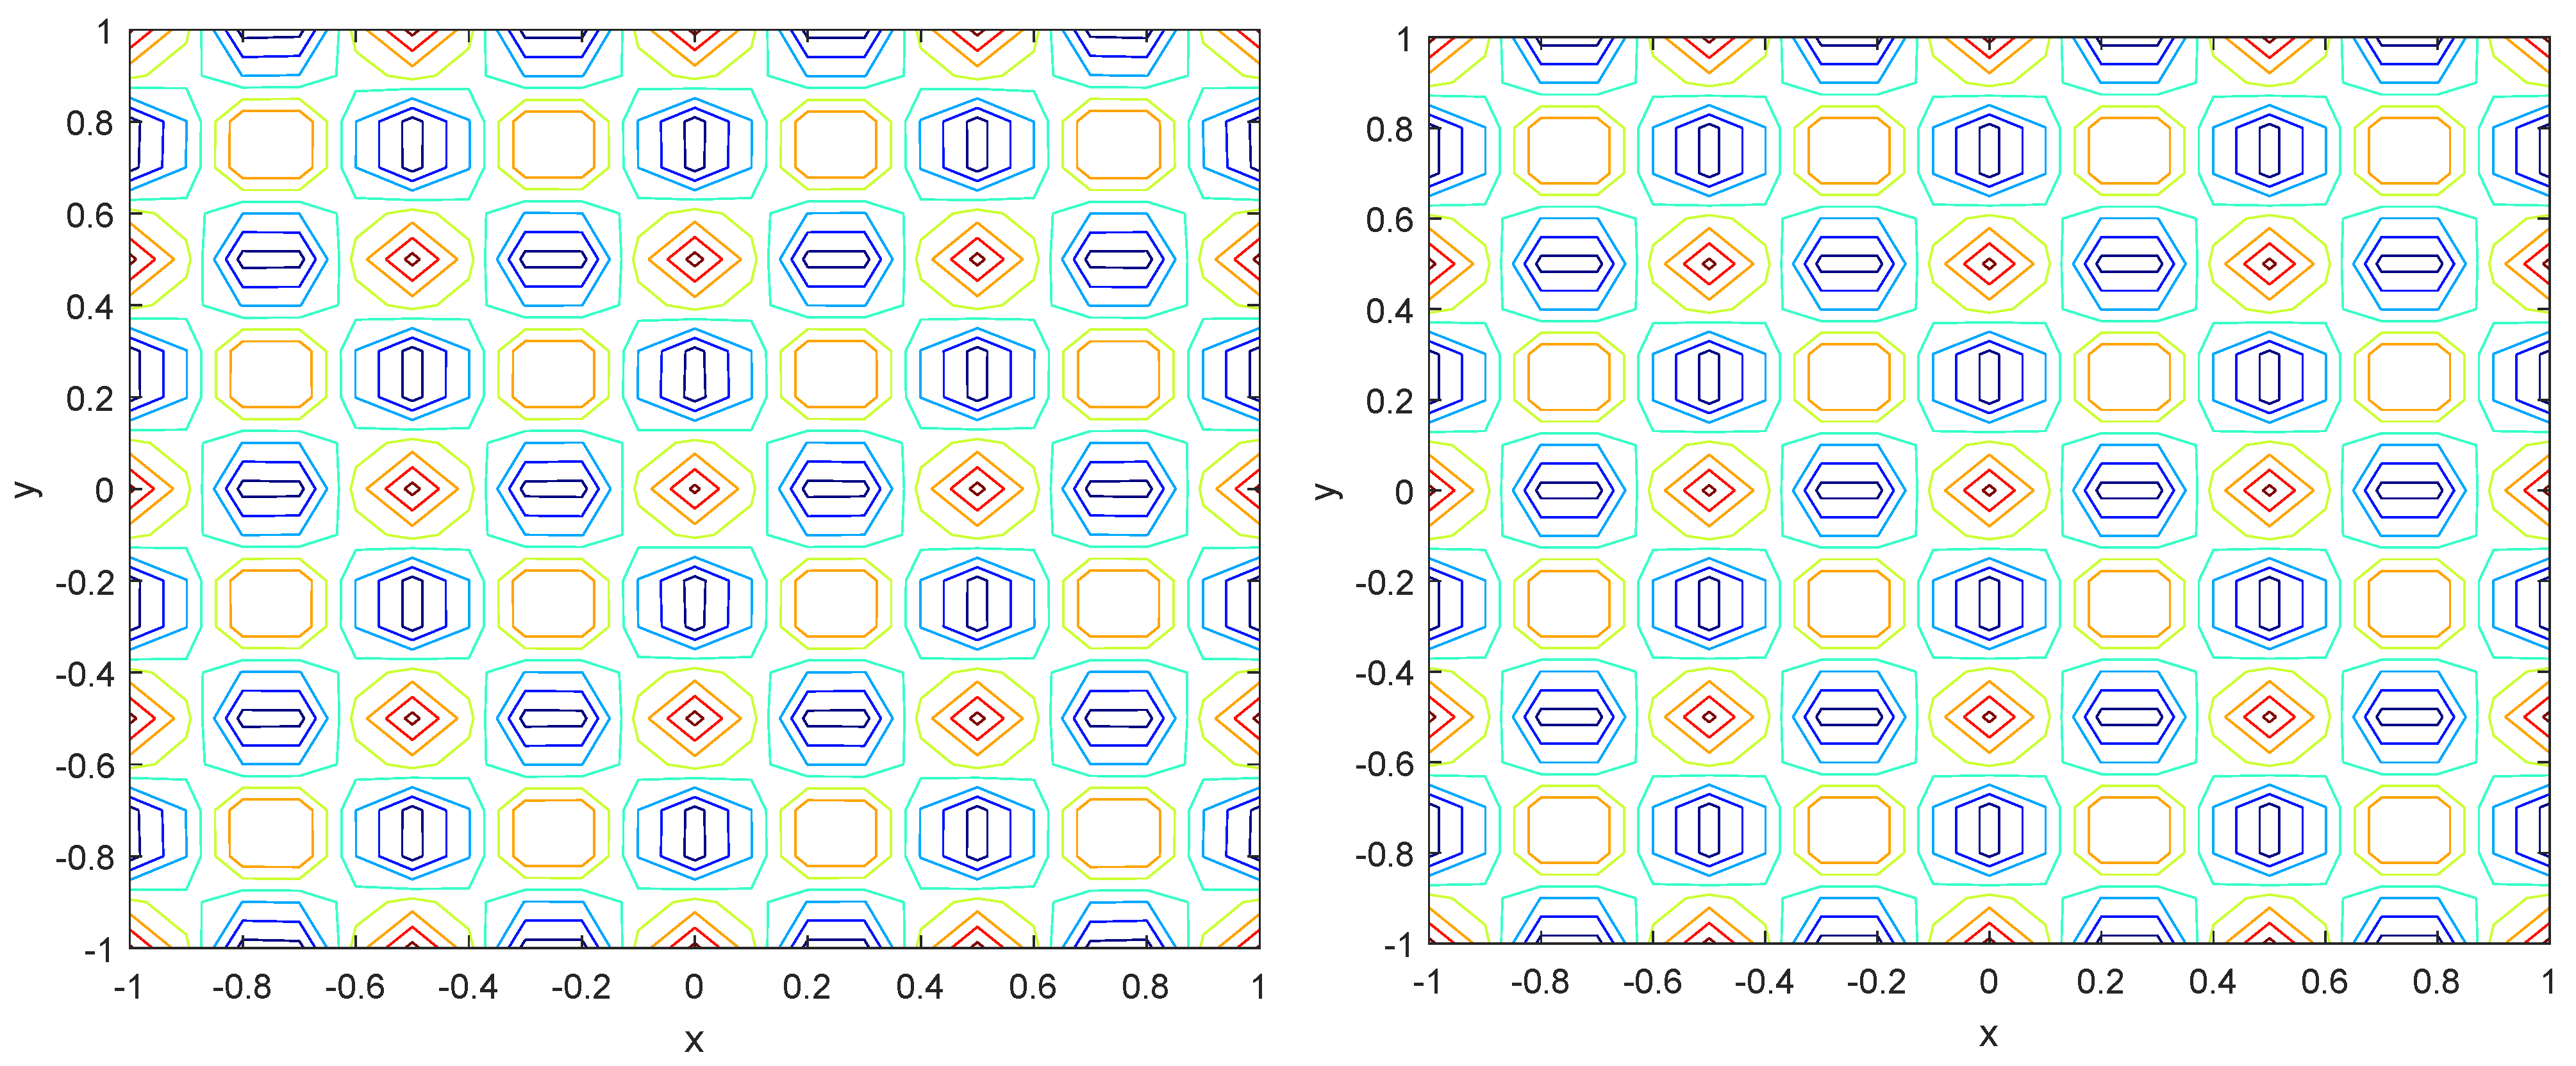
Numerical simulations were performed to obtain different pattern formations from simulating a reaction–diffusion system based on the Gray–Scott model. We adopted a Chebyshev spectral method having the exponential rate of convergence to discretize the Gray–Scott model in spatial coordinates. The resulting system of ordinary equations was then solved using the RK-4 method, which is one of the most stable methods for time stepping. For our numerical simulations, we kept the diffusion as and , while the parameters of reaction were set as and . The contour maps of simulations are shown in the figures below at different levels of time. Red shows the most concentration and blue the least. First, it can be seen that the concentration is high at the center as shown in Figure 2. As the simulations continue, it seems that the output shows the four regions of chemical concentration splitting into increased concentration towards the boundaries which can be observed in Figure 3 and Figure 4. The wave-like propagation can be observed having approximately a constant velocity with a perturbed leading edge as shown in Figure 2, Figure 3 and Figure 4. After the initial spread of perturbation, the asymptotic state which is subject to some values of parameters involved in the system, which may depend on time, was obtained. We then observed that with the increasing of time, the circular waves produced and took the motion of a transverse wave. For the development of surface plot we obtained the results until time reached 1000. Keeping the perturbation at the center, one can observe that the perturbation spread towards the boundaries as shown in Figure 2, Figure 3 and Figure 4. The contour plots shown in Figure 5, Figure 6, Figure 7 and Figure 8 shows that after the initial perturbation in the presence of a gradient, the spots will exist and get larger in size having blue regions. These regions then convert to red ones, and the number increases till the system is filled. These spots grows radially when they divide into two or more spots. It can be observed that the patterns oscillate periodically, showing the instability driven by diffusion. When we change the diffusion constant from and to and , while keeping the perturbation at the center, we can observe that the concentration of u is initially more in the middle as shown in Figure 3, and some sort of wave originates in Figure 6 (left). Then, by splitting into regions, the concentration moves, towards the boundaries as shown in Figure 6 (right). This process keeps on repeating until the fine pattern of a checkerboard is obtained. It can be observed that the pattern has high and low concentrations of chemical u alternating, as shown in Figure 7 and Figure 8.
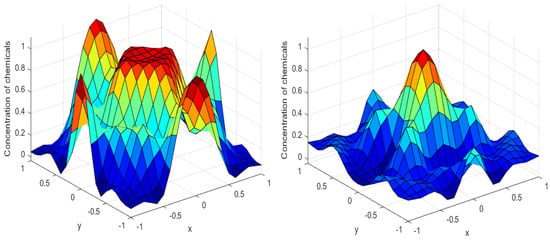
Figure 2.
Surface plots at time (left) and at time (right).
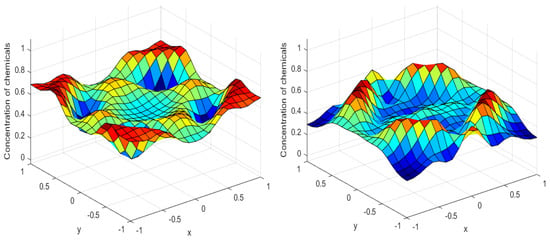
Figure 3.
Surface plots at time (left) and at time (right).
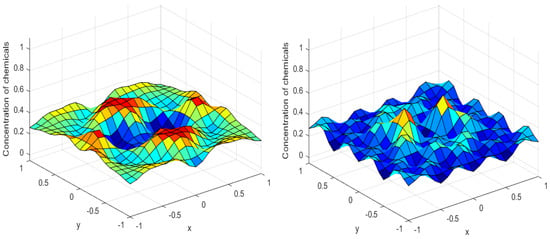
Figure 4.
Surface plots at time (left) and at time (right).
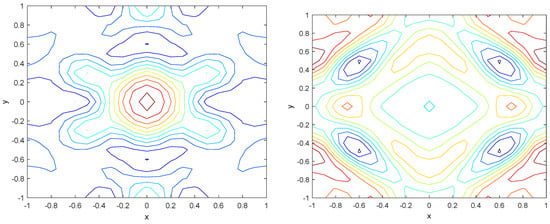
Figure 5.
Contour plots at time (left) and at time (right).
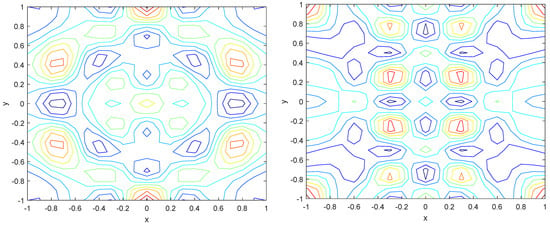
Figure 6.
Contour plots at time (left) and at time (right).
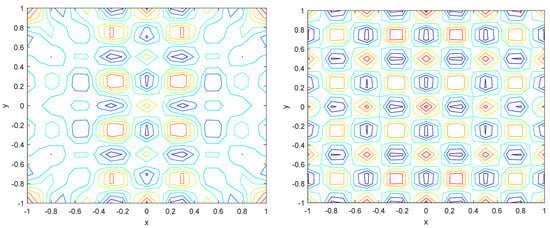
Figure 7.
Contour plots at time (left) and at time (right).
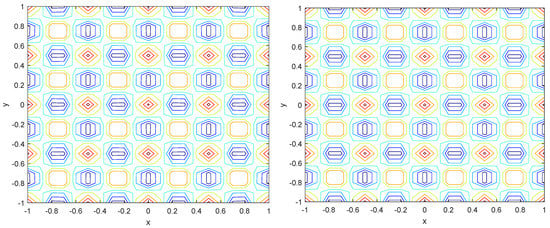
Figure 8.
Contour plots at time (left) and at time (right).
6. Conclusions
A novel numerical scheme based on spectral method is used to solve the Gray–Scott model, which is a special case of a reaction–diffusion equation. First, the reaction–diffusion system is transformed into an algebraic system with the help of a numerical scheme in both space and time coordinates. The matrix form of the resultant equation after discretization contains some non-zero elements in every row, which are then solved by a standard numerical technique available for the algebraic system. It was observed numerically that spatial patterns are formed by the trajectories of the dependent variables. Turing instability is caused by nonlinear reaction cross-diffusion, which also caused the pattern formation. The theoretical justification was confirmed by a number of simulation results. It is shown that our algorithm is stable and convergent even for a large time step opposite other numerical schemes in which the time step is kept at a minimum to keep the algorithm stable and convergent.
Author Contributions
Conceptualization, I.A. and M.T.S.; methodology, I.A. and M.T.S.; software, M.T.S.; validation, I.A. and M.T.S.; formal analysis, I.A.; investigation, M.T.S.; resources, I.A.; writing—original draft preparation, I.A. and M.T.S.; writing—review and editing, I.A. and M.T.S.; supervision, I.A.; project administration, I.A.; funding acquisition, I.A. All authors have read and agreed to the published version of the manuscript.
Funding
This work was supported by the Deanship of Scientific Research, Vice Presidency for Graduate Studies and Scientific Research, King Faisal University, Saudi Arabia [GRANT No. 2314].
Data Availability Statement
Not applicable.
Acknowledgments
This work was supported by the Deanship of Scientific Research, Vice Presidency for Graduate Studies and Scientific Research, King Faisal University, Saudi Arabia [GRANT No. 2314].
Conflicts of Interest
The authors declare no conflict of interest.
References
- Liu, B.; Wu, R. Bifurcation and Patterns Analysis for a Spatiotemporal Discrete Gierer-Meinhardt System. Mathematics 2022, 10, 243. [Google Scholar] [CrossRef]
- Weide Rodrigues, V.; Cristina Mistro, D.; Díaz Rodrigues, L.A. Pattern Formation and Bistability in a Generalist Predator-Prey Model. Mathematics 2020, 8, 20. [Google Scholar] [CrossRef]
- Shao, Y.; Meng, Y.; Xu, X. Turing Instability and Spatiotemporal Pattern Formation Induced by Nonlinear Reaction Cross-Diffusion in a Predator–Prey System with Allee Effect. Mathematics 2022, 10, 1500. [Google Scholar] [CrossRef]
- Saleem, M.T.; Ali, I. Numerical Simulations of Turing Patterns in a Reaction- diffusion Model with the Chebyshev Spectral Method. Eur. Phys. J. Plus 2018, 133, 399. [Google Scholar] [CrossRef]
- Turing, A.M. The chemical basis of Morphogenesis. Philos. Trans. R. Soc. Lond. B 1952, 237, 37–72. [Google Scholar]
- Murray, J.D. Mathematical Biology, 2nd ed.; Springer: Berlin, Germany, 1993. [Google Scholar]
- Thompson, D.A. On Growth and Form; Dover: New York, NY, USA, 1992. [Google Scholar]
- Kondo, S.; Asai, R. A reaction–diffusion wave on the skin of the marine angelfish Pomacanthus. Nature 1995, 376, 765–768. [Google Scholar] [CrossRef] [PubMed]
- Painter, K.J.; Maini, P.K.; Othmer, H.G. Stripe formation in juvenile Pomacanthus explained by a generalized turing mechanism with chemotaxis. Proc. Natl. Acad. Sci. USA 1999, 96, 5549–5554. [Google Scholar] [CrossRef]
- Wolpert, L. The Triumph of the Embryo; Oxford University Press: Oxford, UK, 1991. [Google Scholar]
- Ouyang, Q.; Swinney, H.L. Transition from a uniform state to hexagonal and striped Turing patterns. Nature 1997, 352, 610–612. [Google Scholar] [CrossRef]
- Valery, P.; Ouyang, Q.; Swinney, H.L. Resonant Pattern Formation in a Chemical System. Nature 1997, 388, 655–657. [Google Scholar]
- Koch, A.J.; Meinhardt, H. Biological Pattern Formation: From basic mechanisms to complex structures. Rev. Mod. Phys. 1994, 66, 1481–1507. [Google Scholar] [CrossRef]
- Meinhardt, H. Beyond Spots and Stripes: Generation of More Complex Patterns by Modifications and Additions of the Basic Reaction. In Mathematical Models for Biological Pattern Formation; The IMA Volumes in Mathematics and Its Applications; Maini, P.K., Othmer, H.G., Eds.; Springer: New York, NY, USA, 2001; Volume 121. [Google Scholar]
- Pearson, J.E. Complex Patterns in a Simple System. Science 1993, 261, 189–194. [Google Scholar] [CrossRef] [PubMed]
- Calhoun, D.; Helzel, C. A finite-volume method for solving parabolic equations on logically Cartesian curved surface meshes. SIAM J. Sci. Comp. 2009, 31, 4066–4099. [Google Scholar] [CrossRef]
- Gu, G.; Peng, H. Numerical Simulation of Reaction-Diffusion Systems of Turing Pattern Formation. Int. J. Mod. Nonlinear Theory Appl. 2015, 4, 215–225. [Google Scholar] [CrossRef]
- Qianqian, Z.; Shen, J.; Wang, Z. Pattern dynamics of the reaction–diffusion immune system. PLoS ONE 2018, 13, e0190176. [Google Scholar]
- Kopell, N. Networks of neurons as dynamical systems: From Geometry to Biophysics. Q. Appl. Math. 1998, 55, 707–718. [Google Scholar] [CrossRef]
- Peter, S.; Chaplain, M.; Hubbard, S. Mathematical Modelling of Host-Parisitoid Systems: Effects of Chemically Mediated Parasitoid Foraging Strategies on Within- and Between-generation Spatio-temporal Dynamics. J. Theor. Biol. 2002, 212, 31–47. [Google Scholar]
- Maini, P.K.; Painter, K.J.; Chau, H.N.P. Spatial pattern formation in chemical and biological systems. Faraday Trans. 1997, 93, 3601–3610. [Google Scholar] [CrossRef]
- Ali, I.; Khan, S.U. Threshold of stochastic SIRS epidemic model from infectious to susceptible class with saturated incidence rate using spectral method. Symmetry 2022, 14, 1838. [Google Scholar] [CrossRef]
- Ali, I.; Khan, S.U. Asymptotic Behavior of Three Connected Stochastic Delay Neoclassical Growth Systems Using Spectral Technique. Mathematics 2022, 10, 3639. [Google Scholar] [CrossRef]
- Ali, I.; Saleem, M.T. Applications of Orthogonal Polynomials in Simulations of Mass Transfer Diffusion Equation Arising in Food Engineering. Symmetry 2023, 15, 527. [Google Scholar] [CrossRef]
- Ali, A.; Khan, S.U.; Ali, I.; Khan, F.U. On dynamics of stochastic avian influenza model with asymptomatic carrier using spectral method. Math. Methods Appl. Sci. 2022, 45, 8230–8246. [Google Scholar] [CrossRef]
- Ali, I.; Khan, S.U. Dynamics and simulations of stochastic COVID-19 epidemic model using Legendre spectral collocation method. AIMS Math. 2023, 8, 4220–4236. [Google Scholar] [CrossRef]
- Ali, I.; Khan, S.U. A Dynamic Competition Analysis of Stochastic Fractional Differential Equation Arising in Finance via Pseudospectral Method. Mathematics 2023, 11, 1328. [Google Scholar] [CrossRef]
- Lee, I.; Cho, U.-I. Pattern formations with Turing and Hopf oscillating pattern in a discrete reaction–diffusion system. Bull.-Korean Chem. Soc. 2000, 21, 1213–1216. [Google Scholar]
- Aragon, J.; Torres, M.; Gil, D.; Barrio, R.A.; Maini, K.P. Turing patterns with pentagonal symmetry. Phys. Rev. E 2002, 65, 051913. [Google Scholar] [CrossRef] [PubMed]
- Chaplain, M.A.J.; Ganesh, M.; Graham, I.G. Spatio-temporal pattern formation on spherical surfaces: Numerical simulation and application to solid tumour growth. J. Math. Biol. 2001, 42, 387–423. [Google Scholar] [CrossRef]
- Barrio, R.; Varea, C.; Aragon, J.; Maini, P. A two-dimensional numerical study of spatial pattern formation in interacting Turing systems. Bull. Math. Biol. 1999, 61, 483–505. [Google Scholar] [CrossRef]
- Leppanen, T. Computational Studies of Pattern Formation in Turing Systems. Ph.D. Thesis, Helsinki University of Technology, Helsinki, Finland, 2004. [Google Scholar]
- Gray, P.; Scott, S.K. Autocatalytic reactions in the isothermal, continuous stirred tank reactor: Isolas and other forms of multistability. Chem. Eng. Sci. 1983, 38, 29–43. [Google Scholar] [CrossRef]
- Selkov, E.E. A Simple Kinetic Model. Eur. J. Biochem. 1968, 4, 79. [Google Scholar] [CrossRef]
- Heineike, B.M. Modeling Morphogenesis with Reaction-Diffusion Equations Using Galerkin Spectral Methods; Naval Academy: Annapolis, MD, USA, 2002. [Google Scholar]
- Mazin, W.; Rasmussen, K.E.; Mosekilde, E.; Borckmans, P.; Dewel, G. Pattern formation in the bistable Gray–Scott model. Math. Comput. Simul. 1996, 40, 371–396. [Google Scholar] [CrossRef]
- Kaur, N.; Joshi, V. Numerical Solution of Gray Scott Reaction-Diffusion Equation using Lagrange Polynomial. J. Phys. Conf. Ser 2020, 1531, 012058. [Google Scholar] [CrossRef]
- Alzahrani, T. Spatio-Temporal Modeling of Immune Response to SARS-CoV-2 Infection. Mathematics 2021, 9, 3274. [Google Scholar] [CrossRef]
- Yang, R.; Song, Q.; An, Y. Spatiotemporal Dynamics in a Predator–Prey Model with Functional Response Increasing in Both Predator and Prey Densities. Mathematics 2022, 10, 17. [Google Scholar] [CrossRef]
Disclaimer/Publisher’s Note: The statements, opinions and data contained in all publications are solely those of the individual author(s) and contributor(s) and not of MDPI and/or the editor(s). MDPI and/or the editor(s) disclaim responsibility for any injury to people or property resulting from any ideas, methods, instructions or products referred to in the content. |
© 2023 by the authors. Licensee MDPI, Basel, Switzerland. This article is an open access article distributed under the terms and conditions of the Creative Commons Attribution (CC BY) license (https://creativecommons.org/licenses/by/4.0/).

