
Impact of Sequential Model Predictive Control on Induction Motor Performance: Comparison of Converter Topologies
 ,
,  ,
,  and
and 
Abstract
1. Introduction
- Study of the selection of the control parameter for the application of the SMPC strategy in electric motor control. The domain of the control parameter is established, and a selection criterion based on the THD is defined.
- The study addresses the VSI and 3L-NPC converters, which are common in low and medium-power motor drives. The objective is to highlight that as the power of the motor drive increases, the complexity of the converter increases, as well as the difficulty in adjusting the controller.
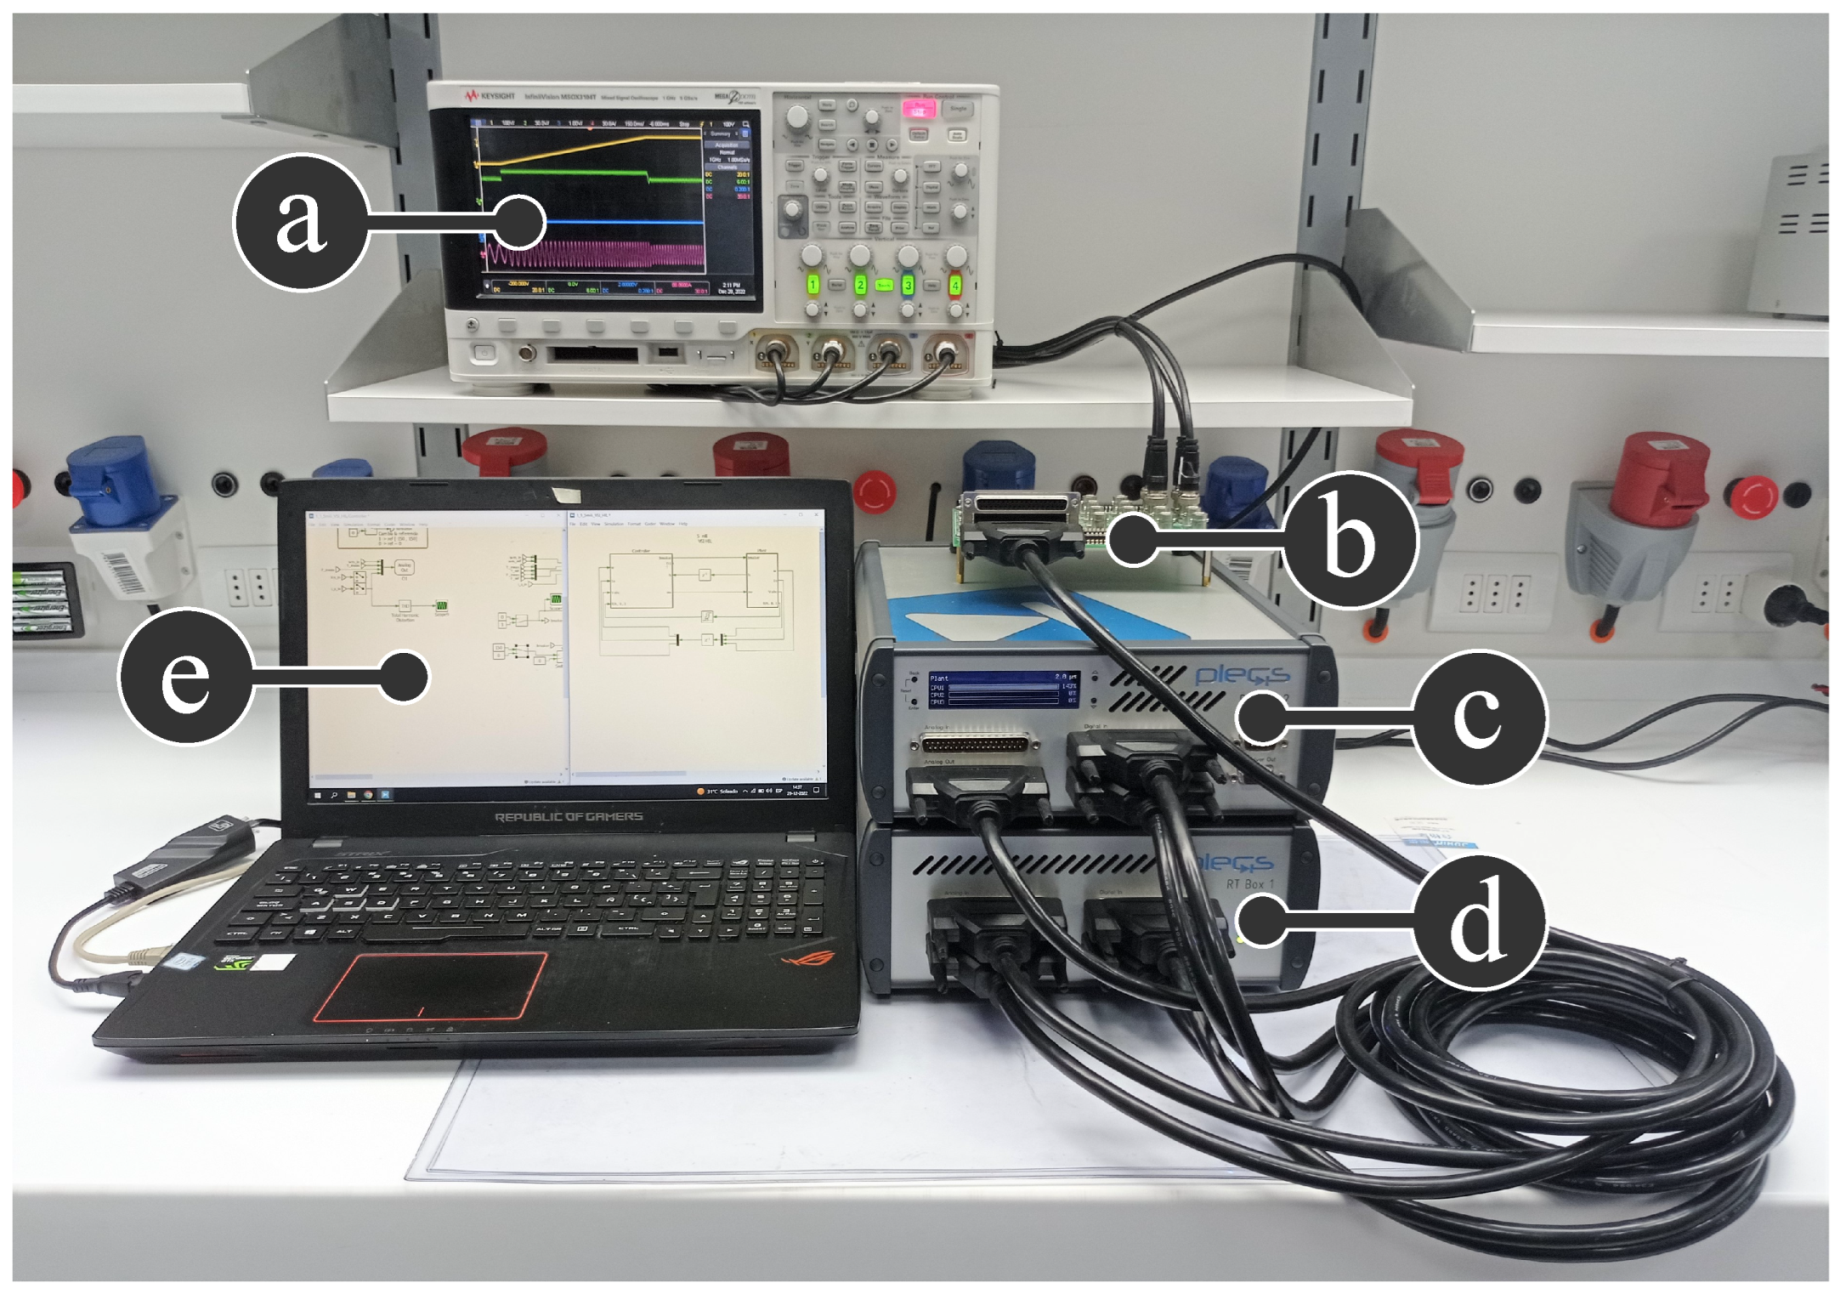
- The SMPC strategy is validated not only through simulation but also through HIL using two PLEXIM’s RT Boxes, one as a controller and the other one as a plant.
2. Methodological Approach
2.1. Modeling
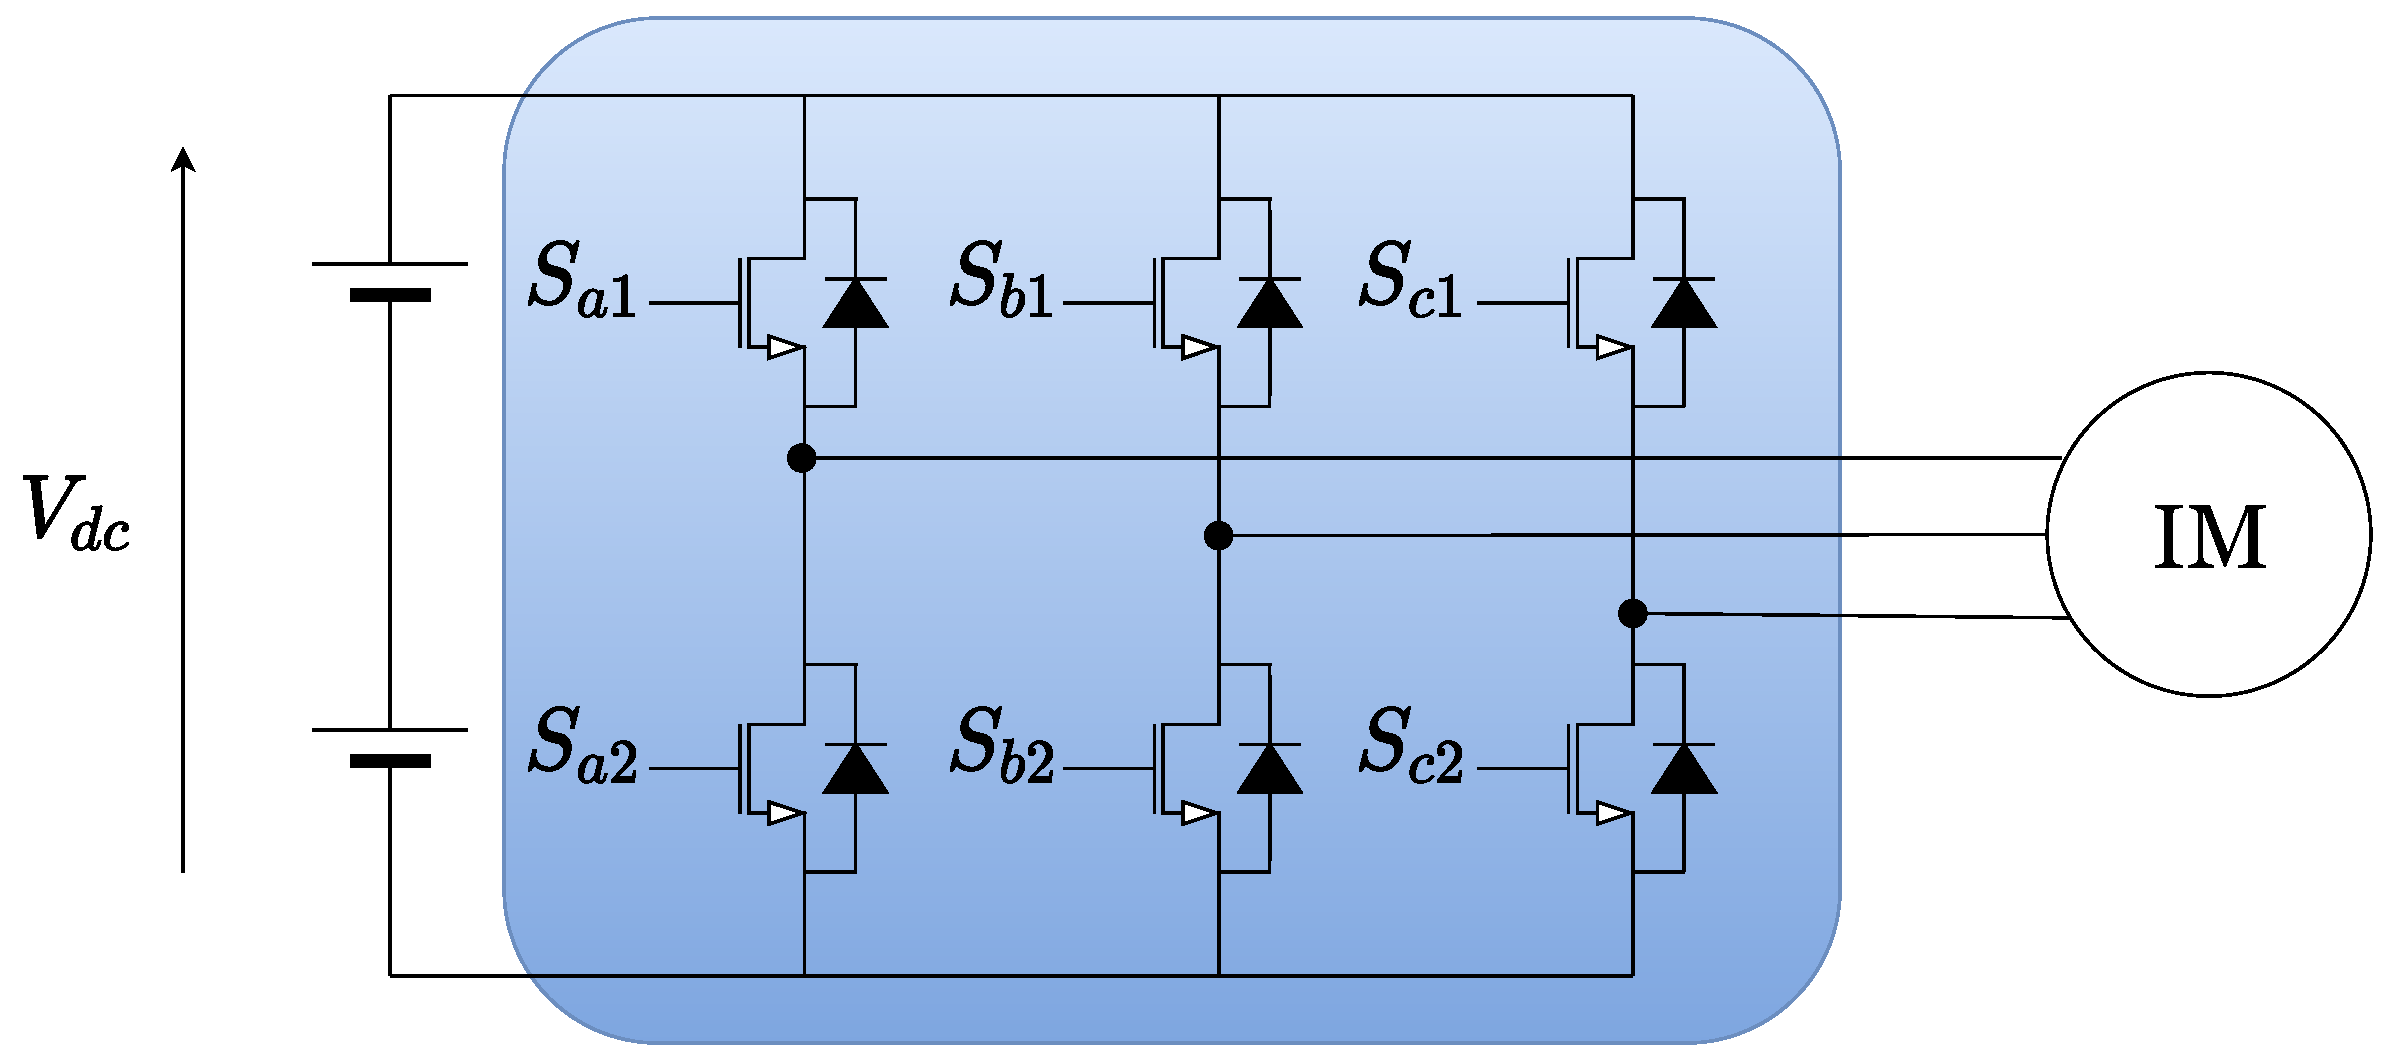
2.1.1. VSI Converter
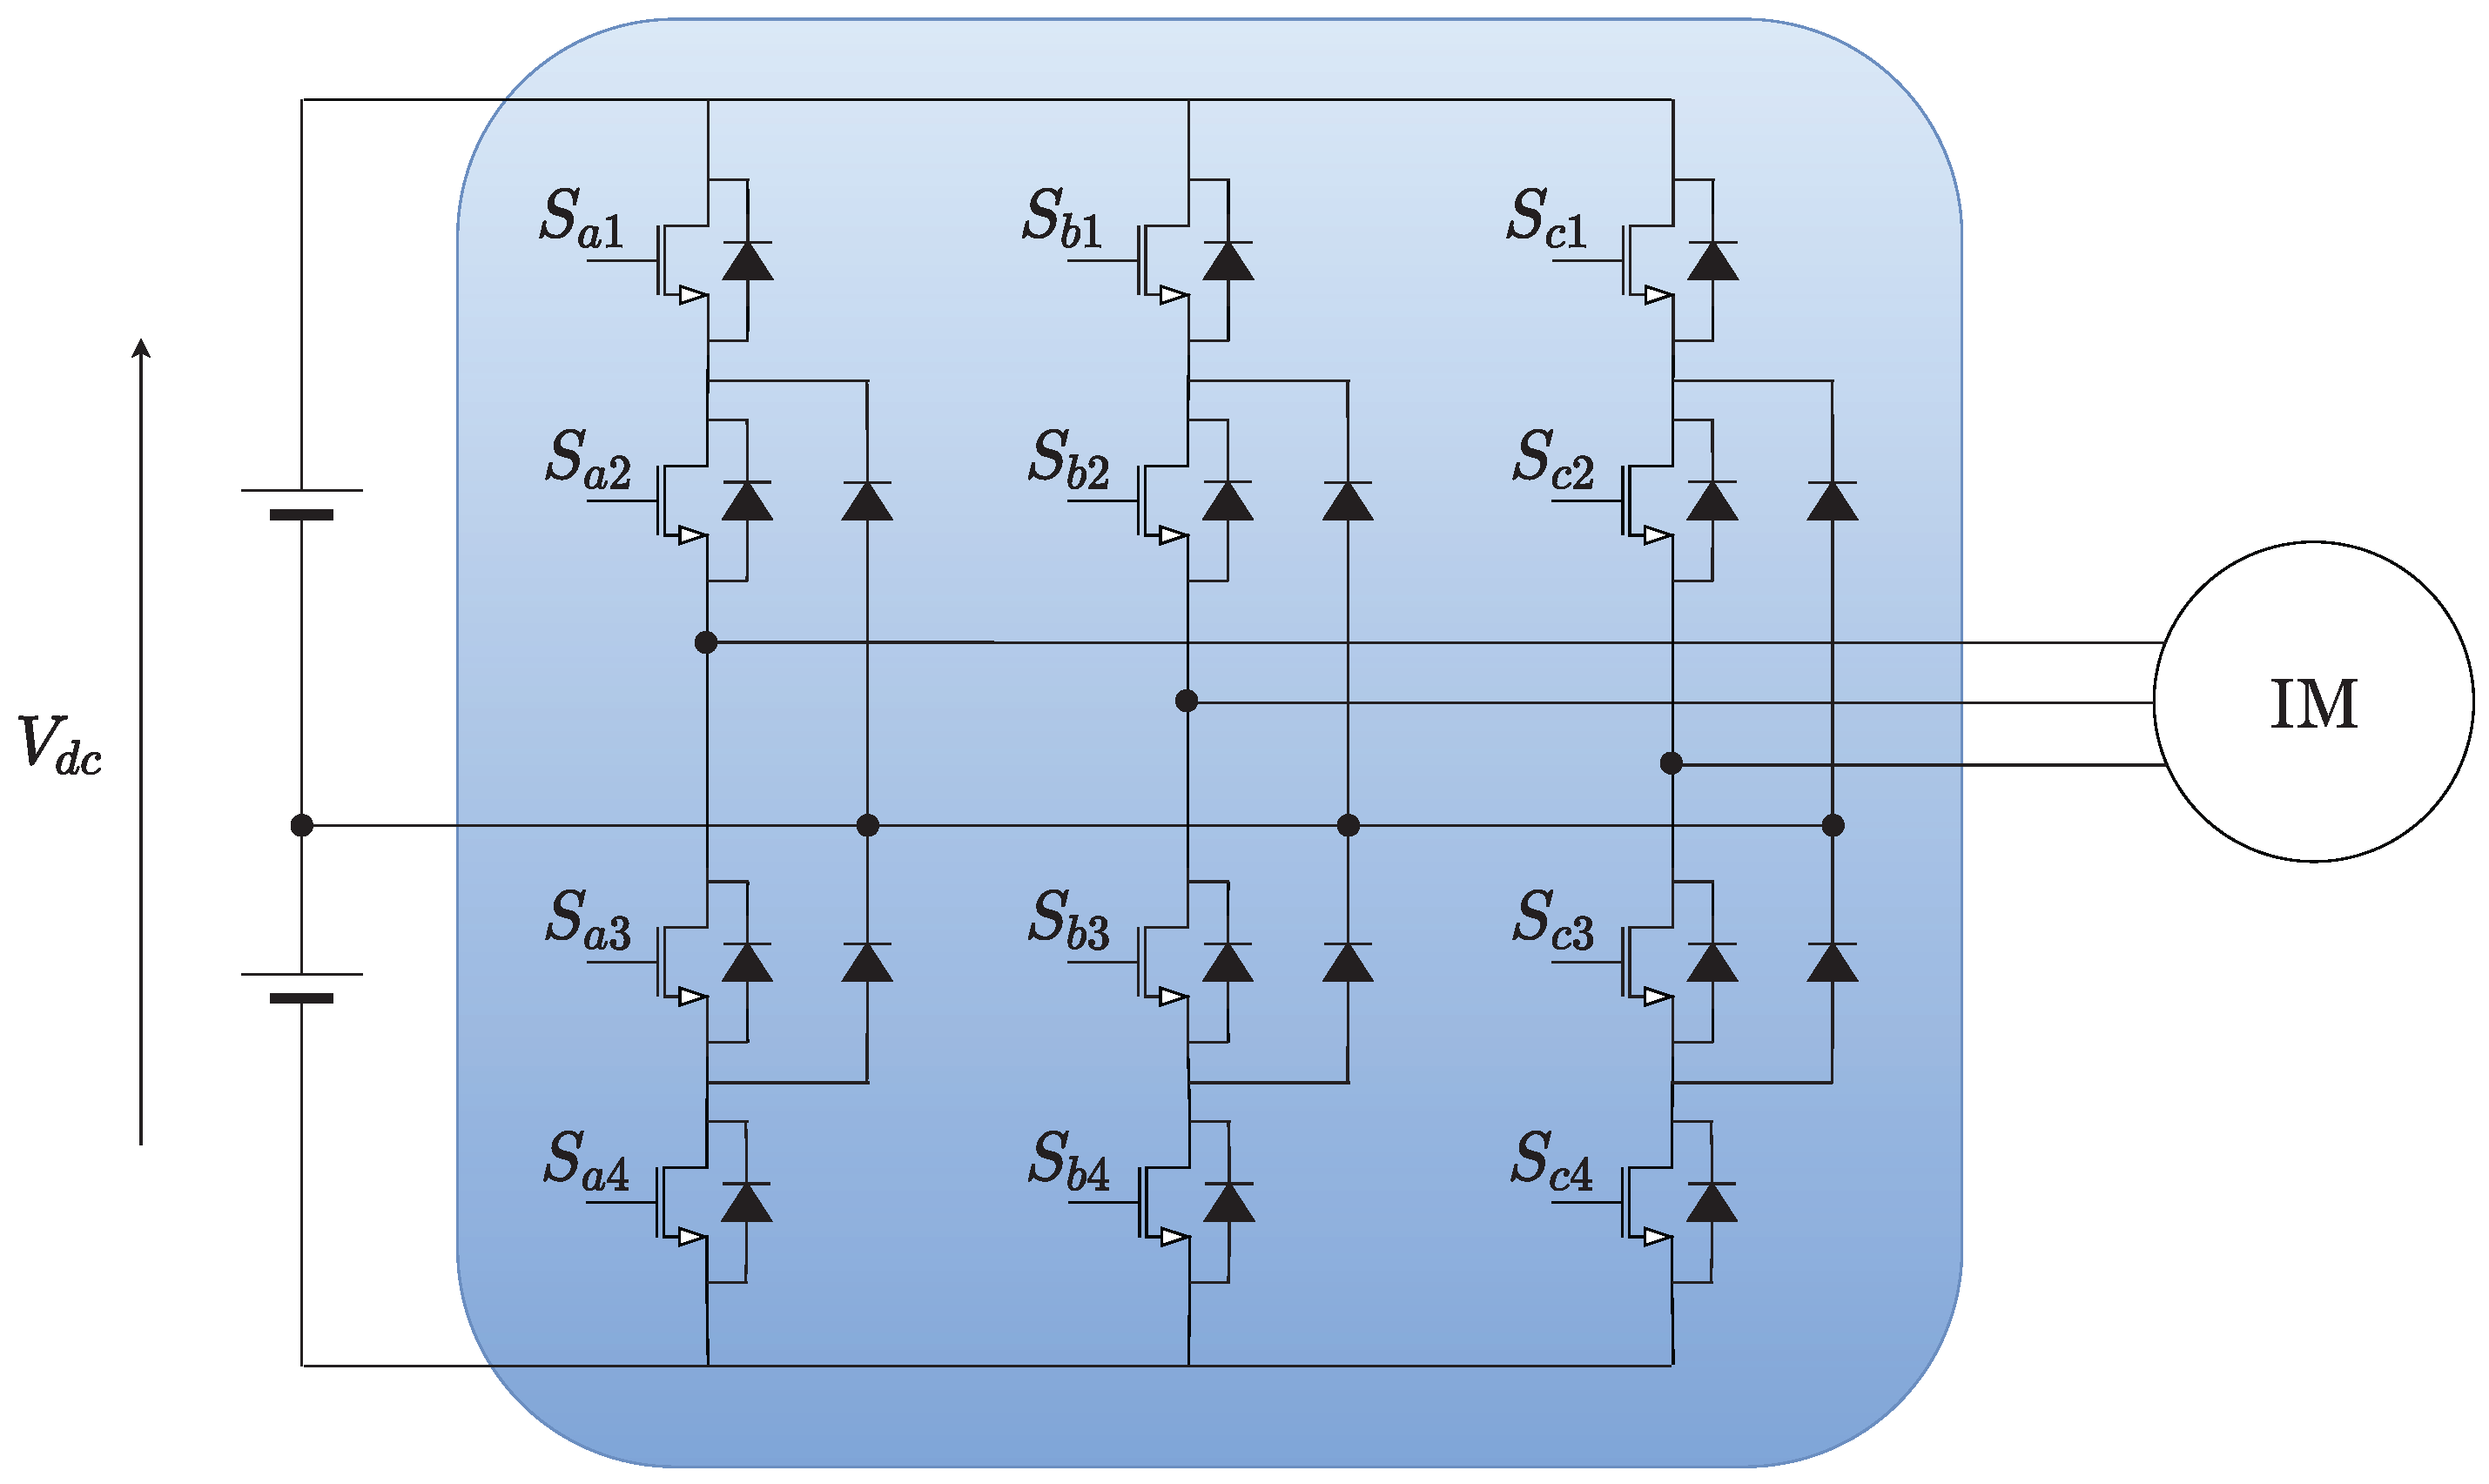
2.1.2. 3L-NPC Converter
2.1.3. Induction Motor
2.2. Prediction Equations
2.3. Cost Functions
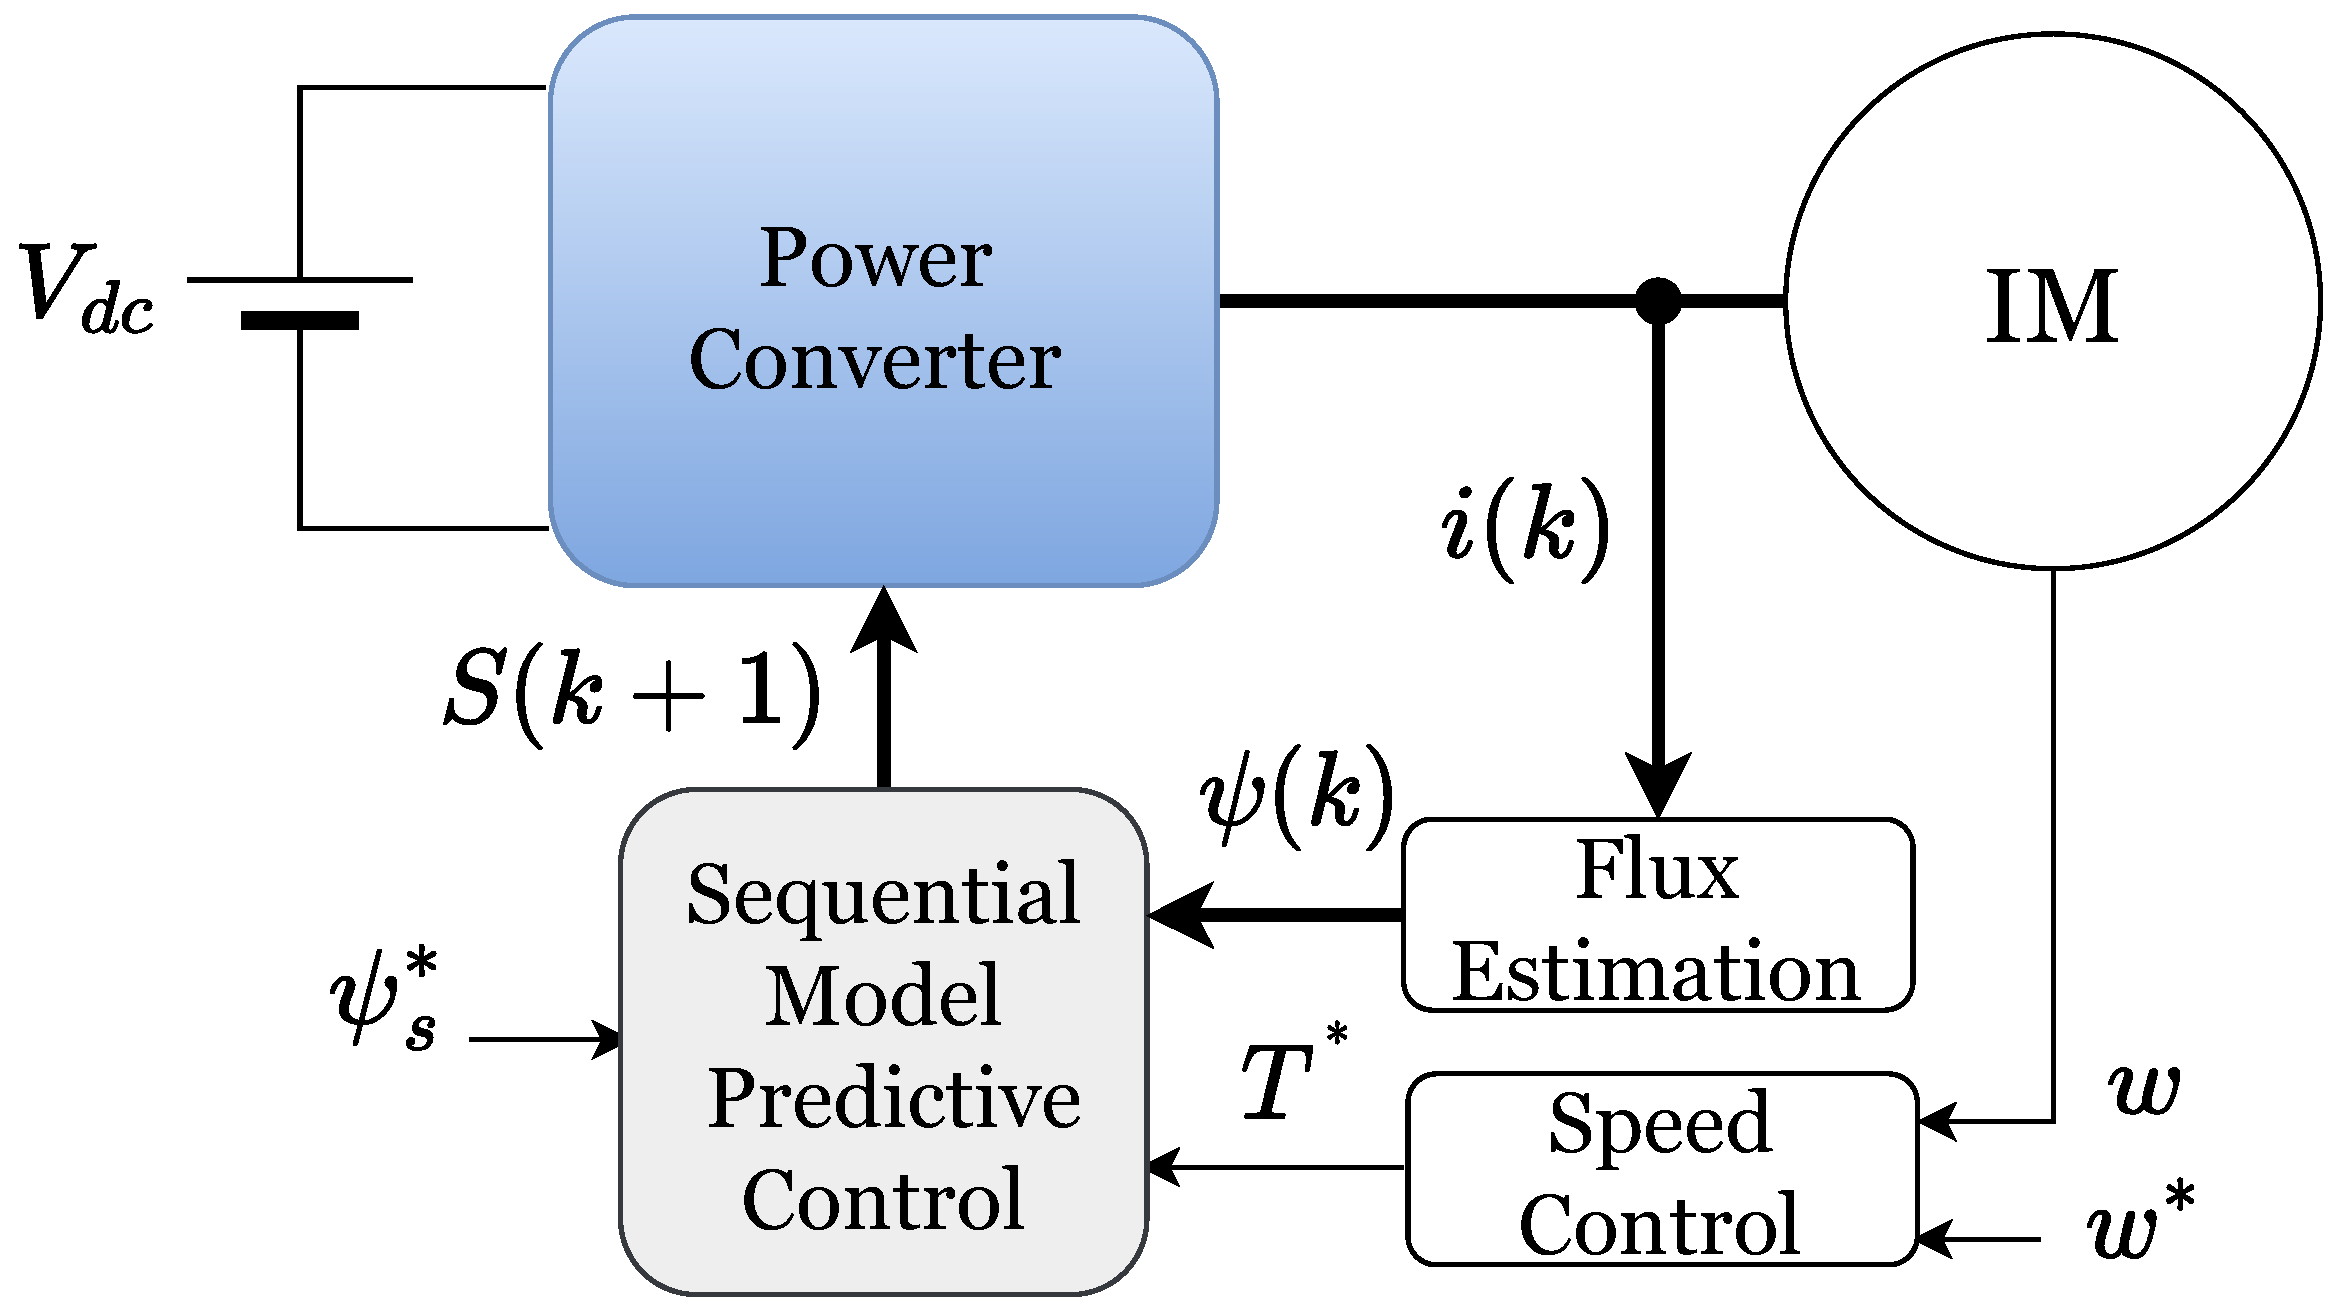
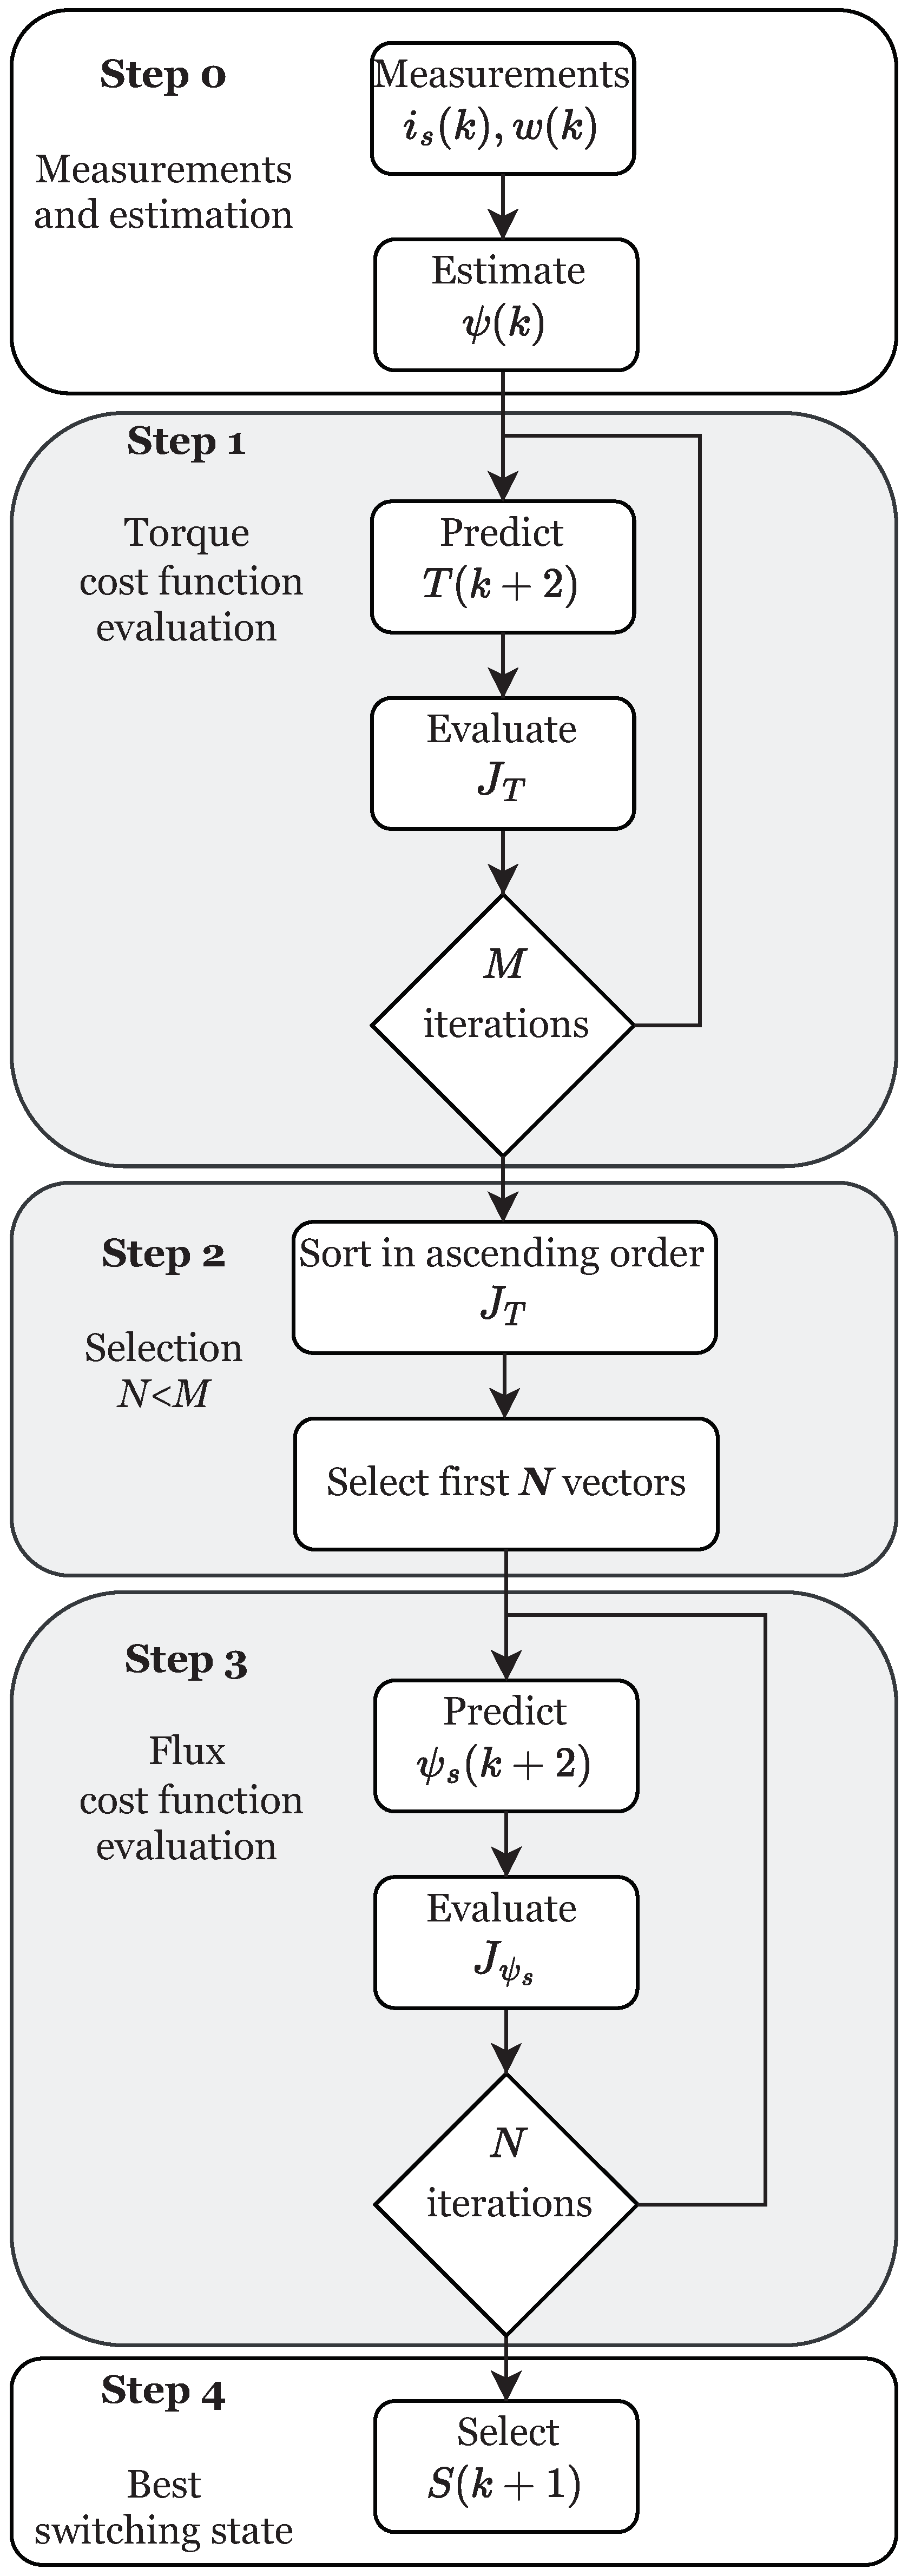
2.4. Sequential Model Predictive Control
- Step 0: Measure motor variables and estimate flux.
- Step 1: Evaluate the first cost function for all possible switching states (M). M value depends on the converter topology. M value is 8 in the VSI or 27 in the 3L-NPC converter.
- Step 2: Order the results of the first cost function evaluation in ascending order, and select the top N states. It is important to note that must be satisfied.
- Step 3: Evaluate the second cost function for the N states selected in the previous step.
- Step 4: Select the switching state that best minimizes the flux cost function, which will be applied to the converter in the next sampling period.

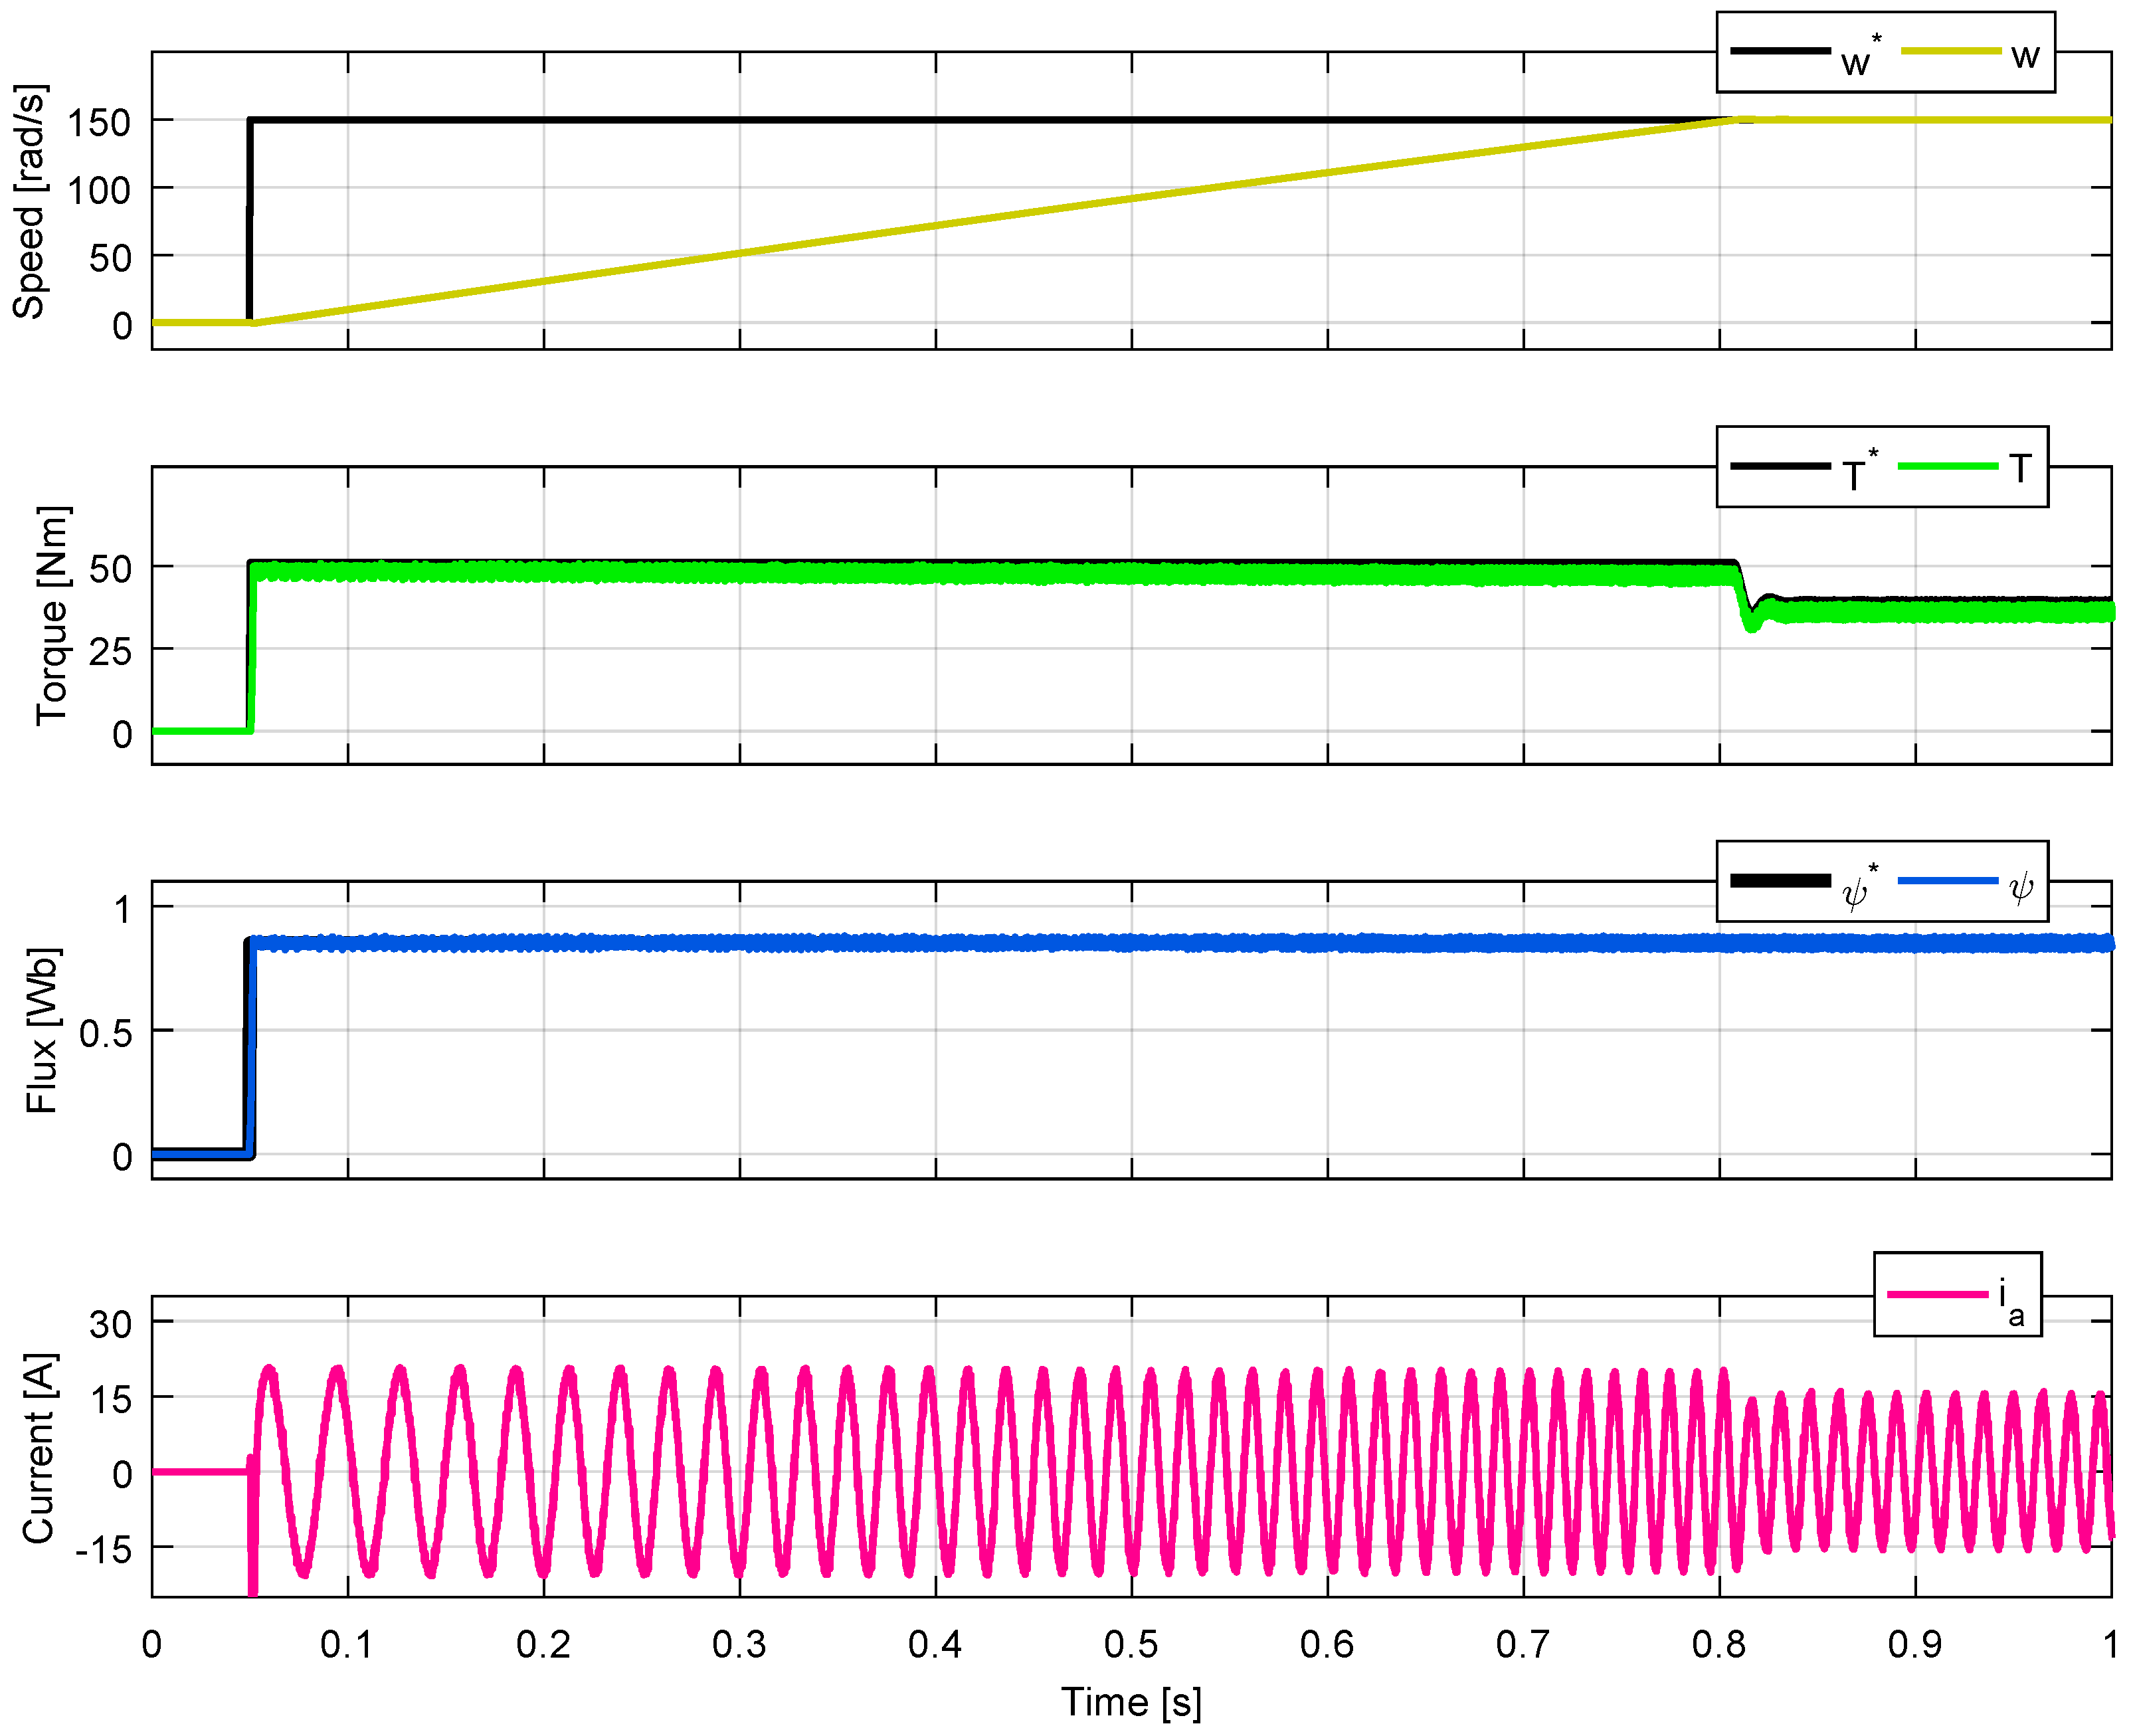
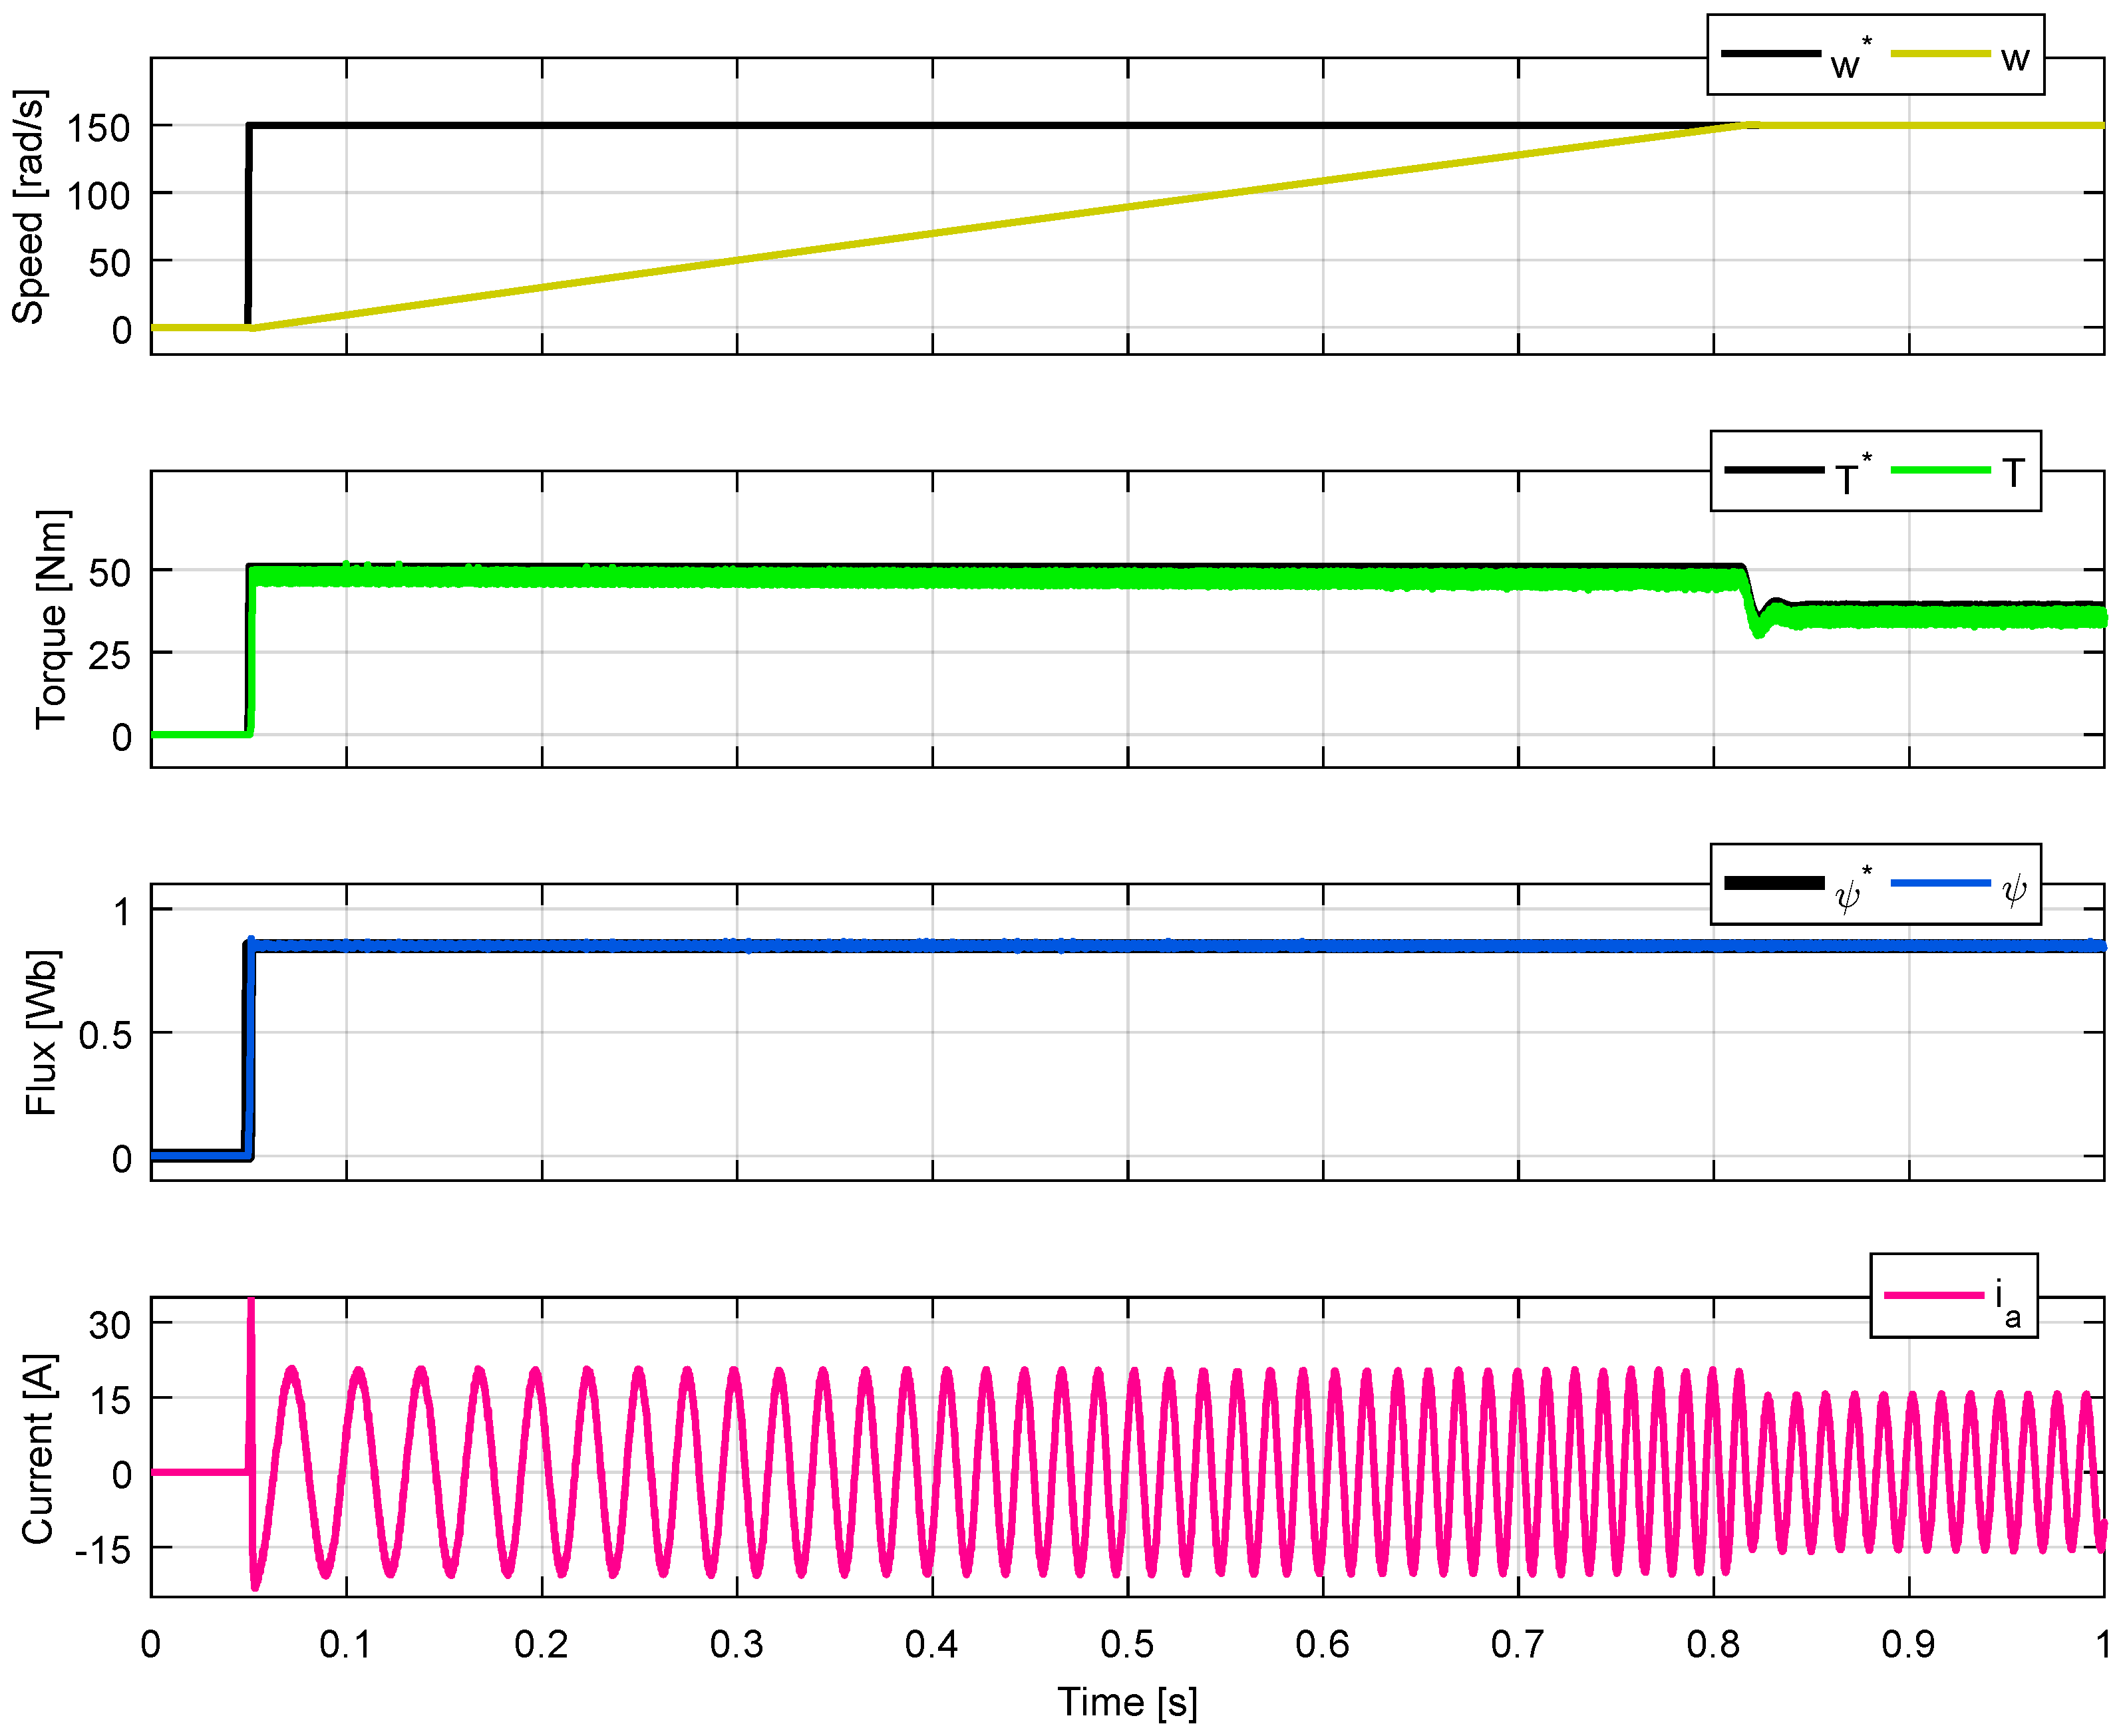
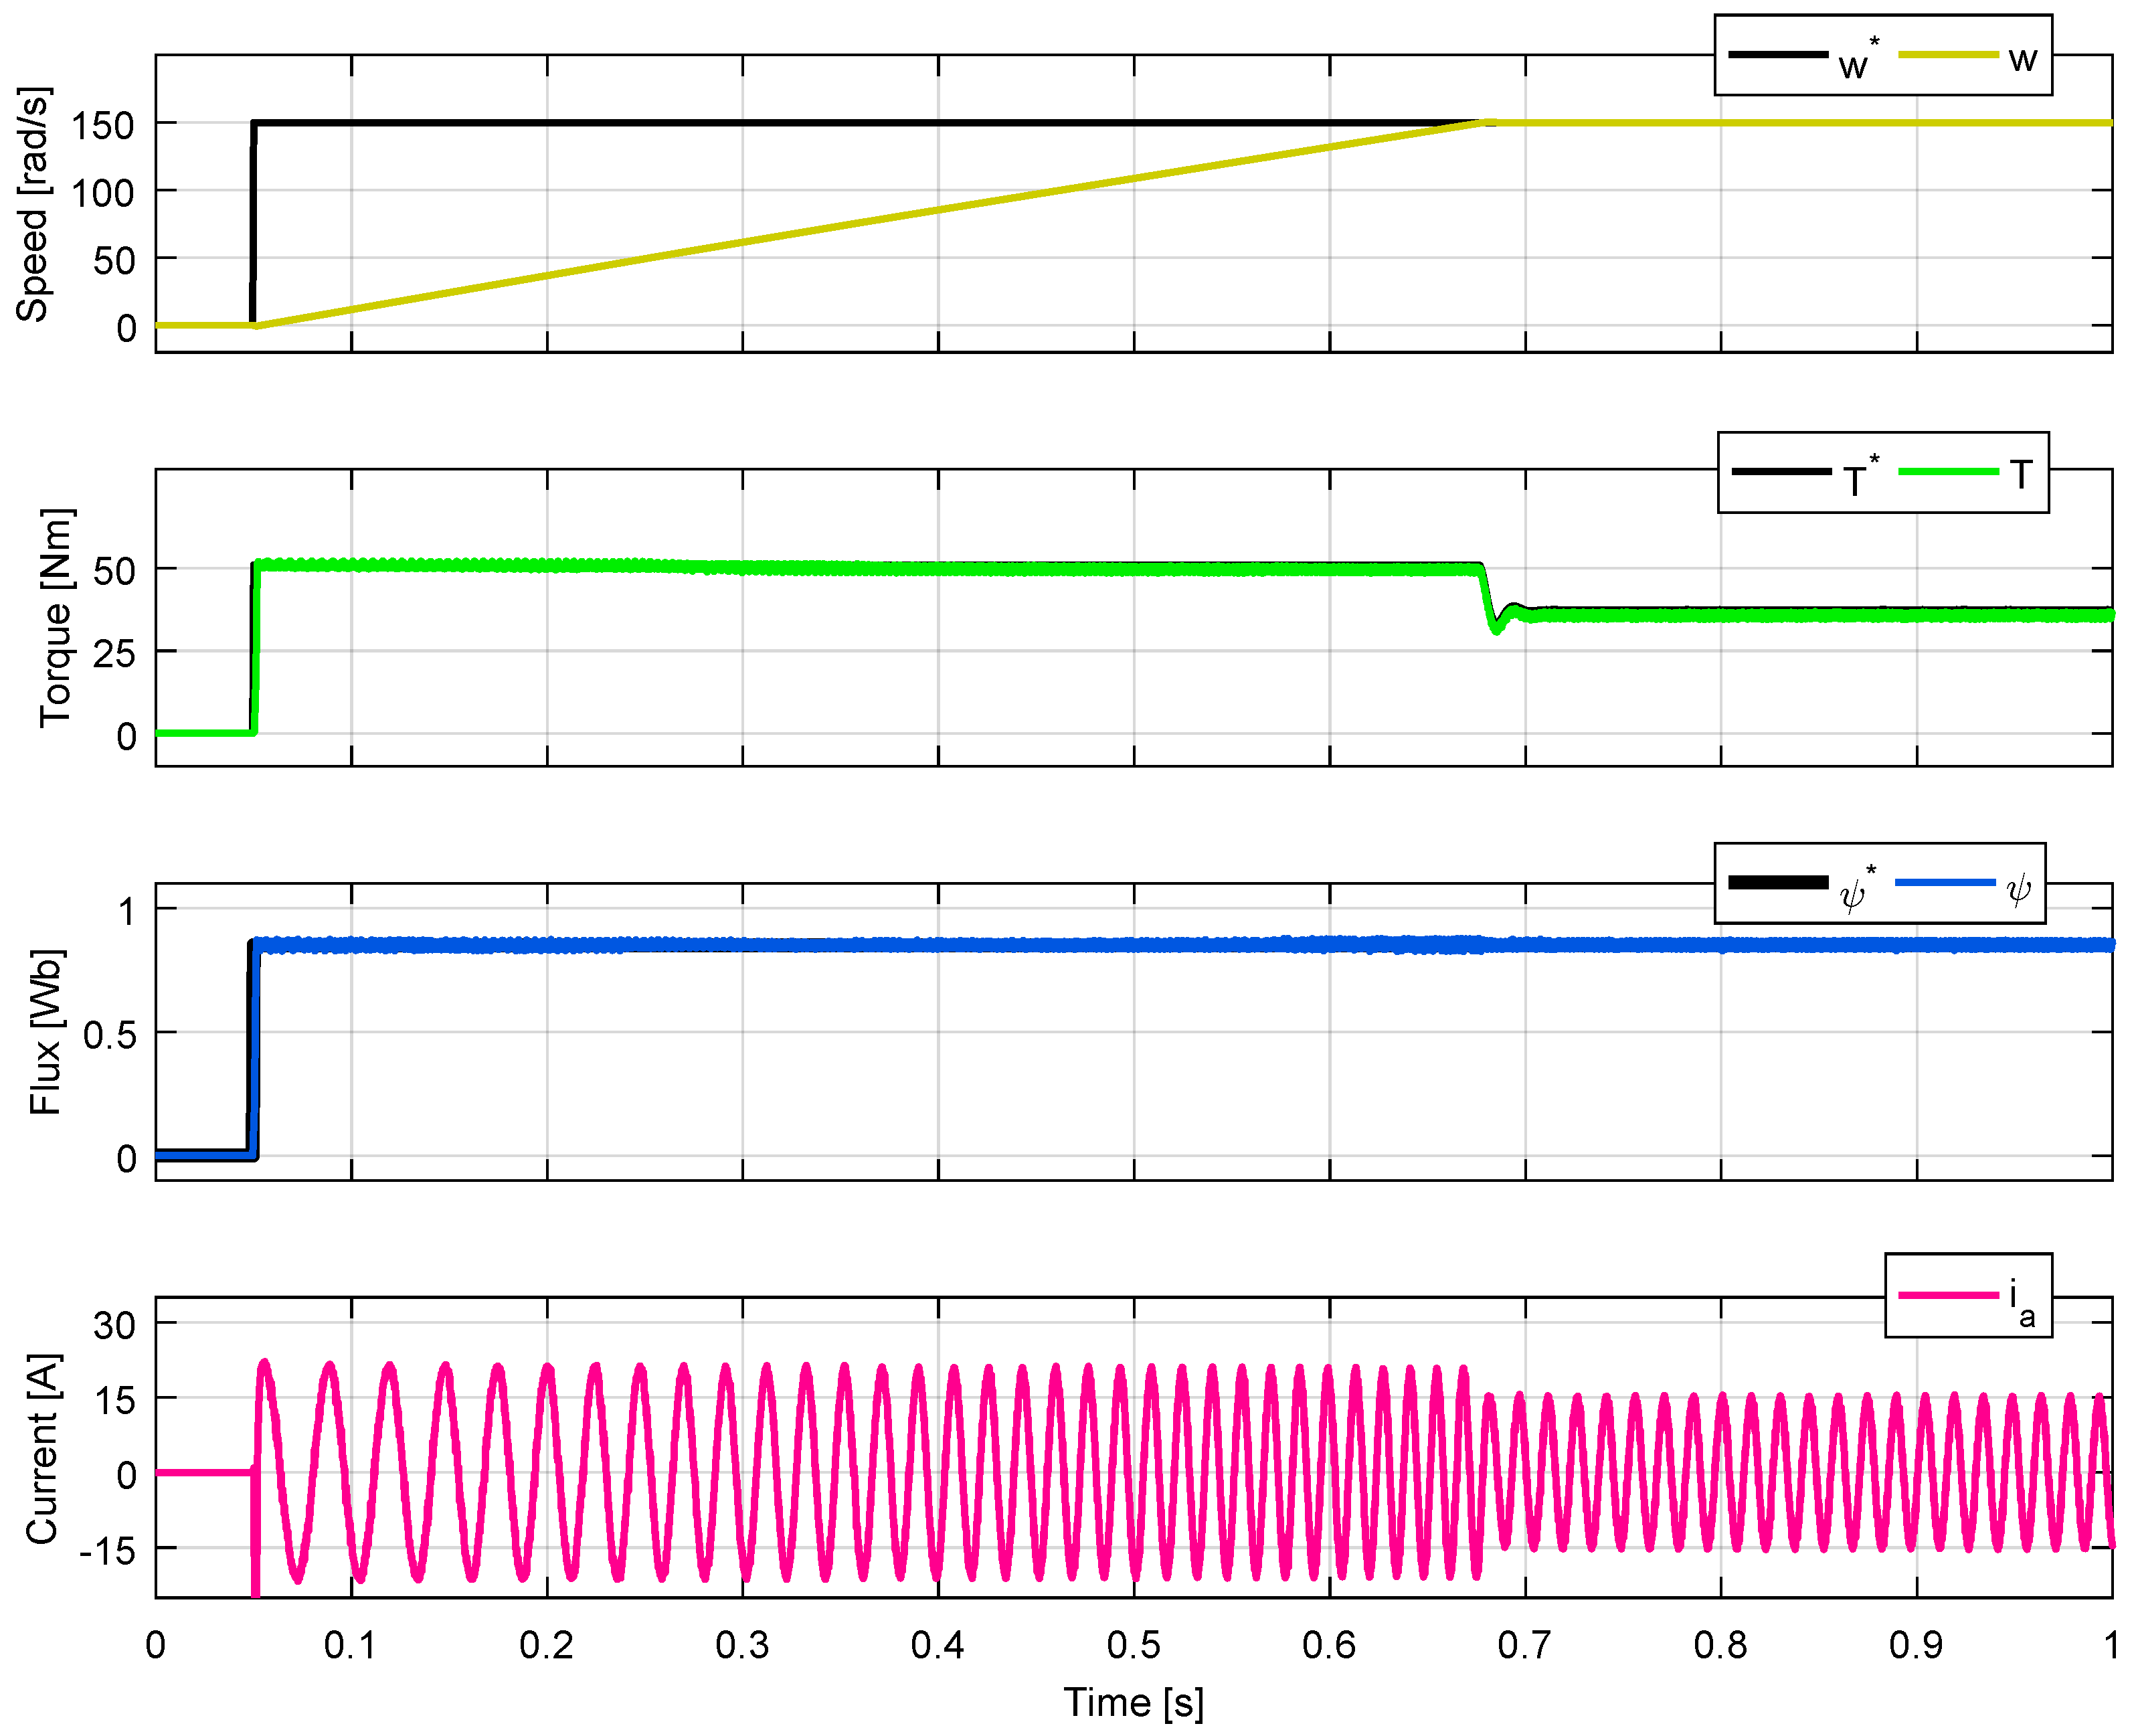
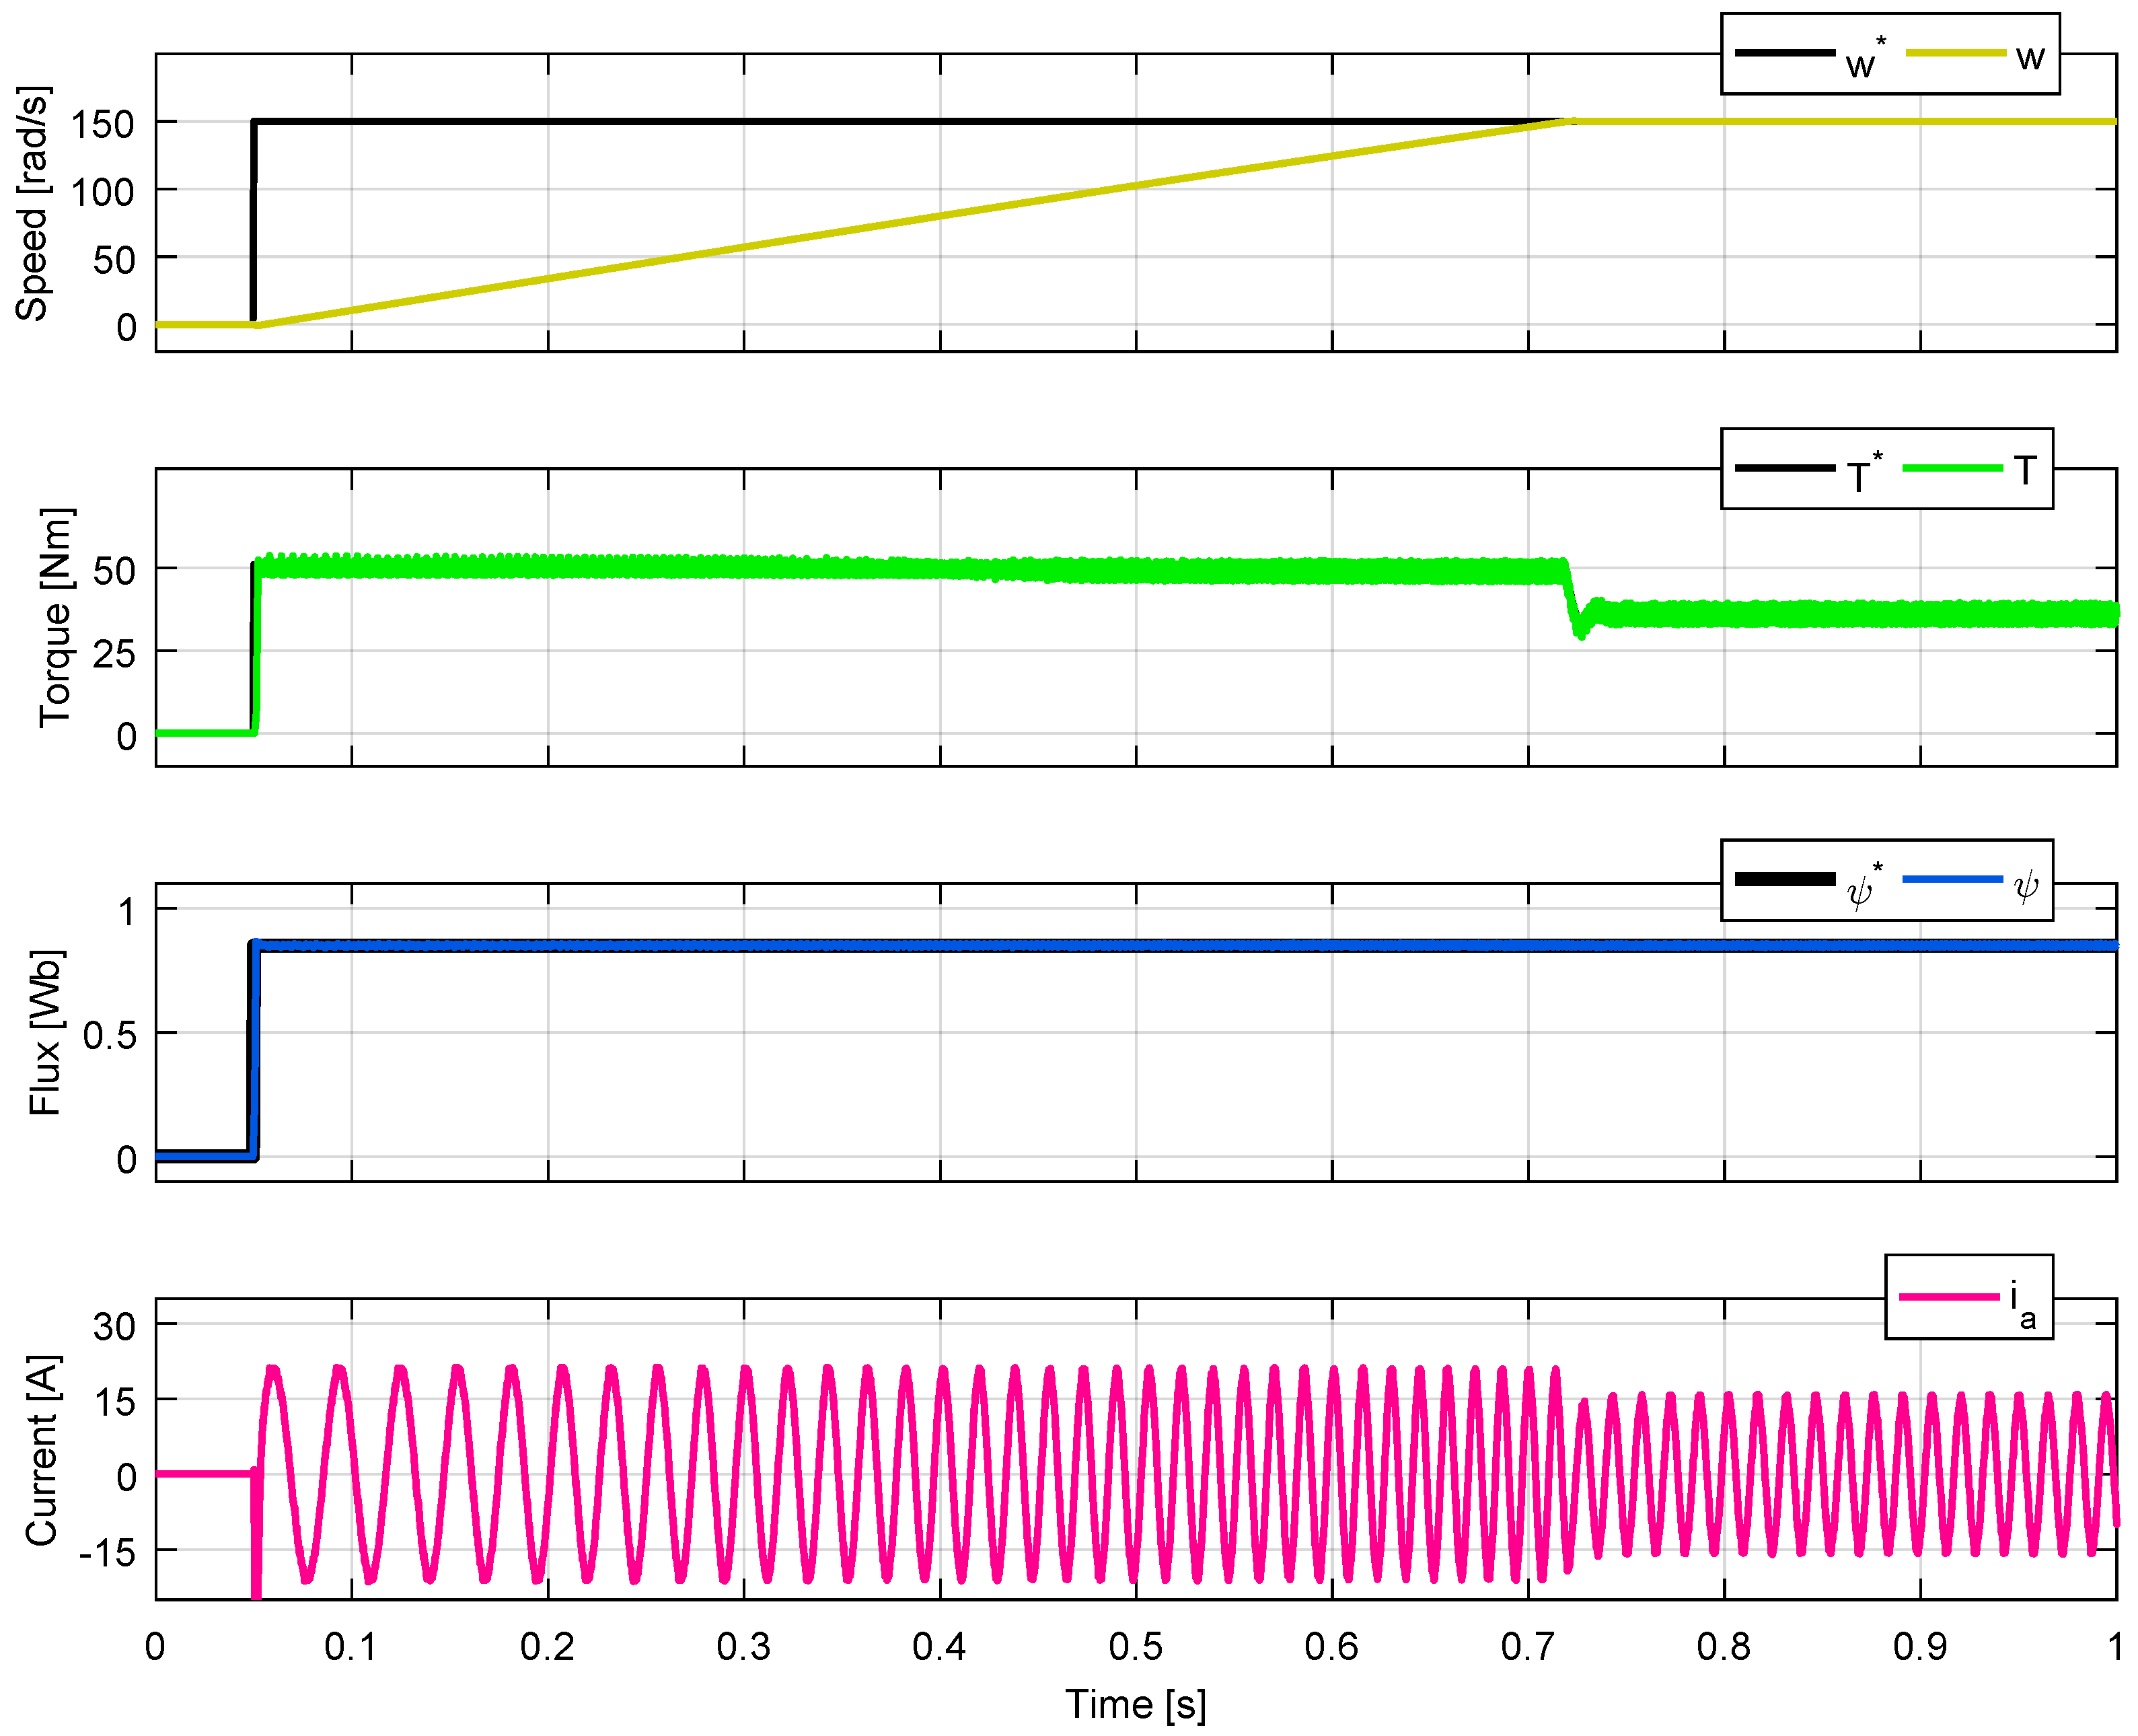
3. Results
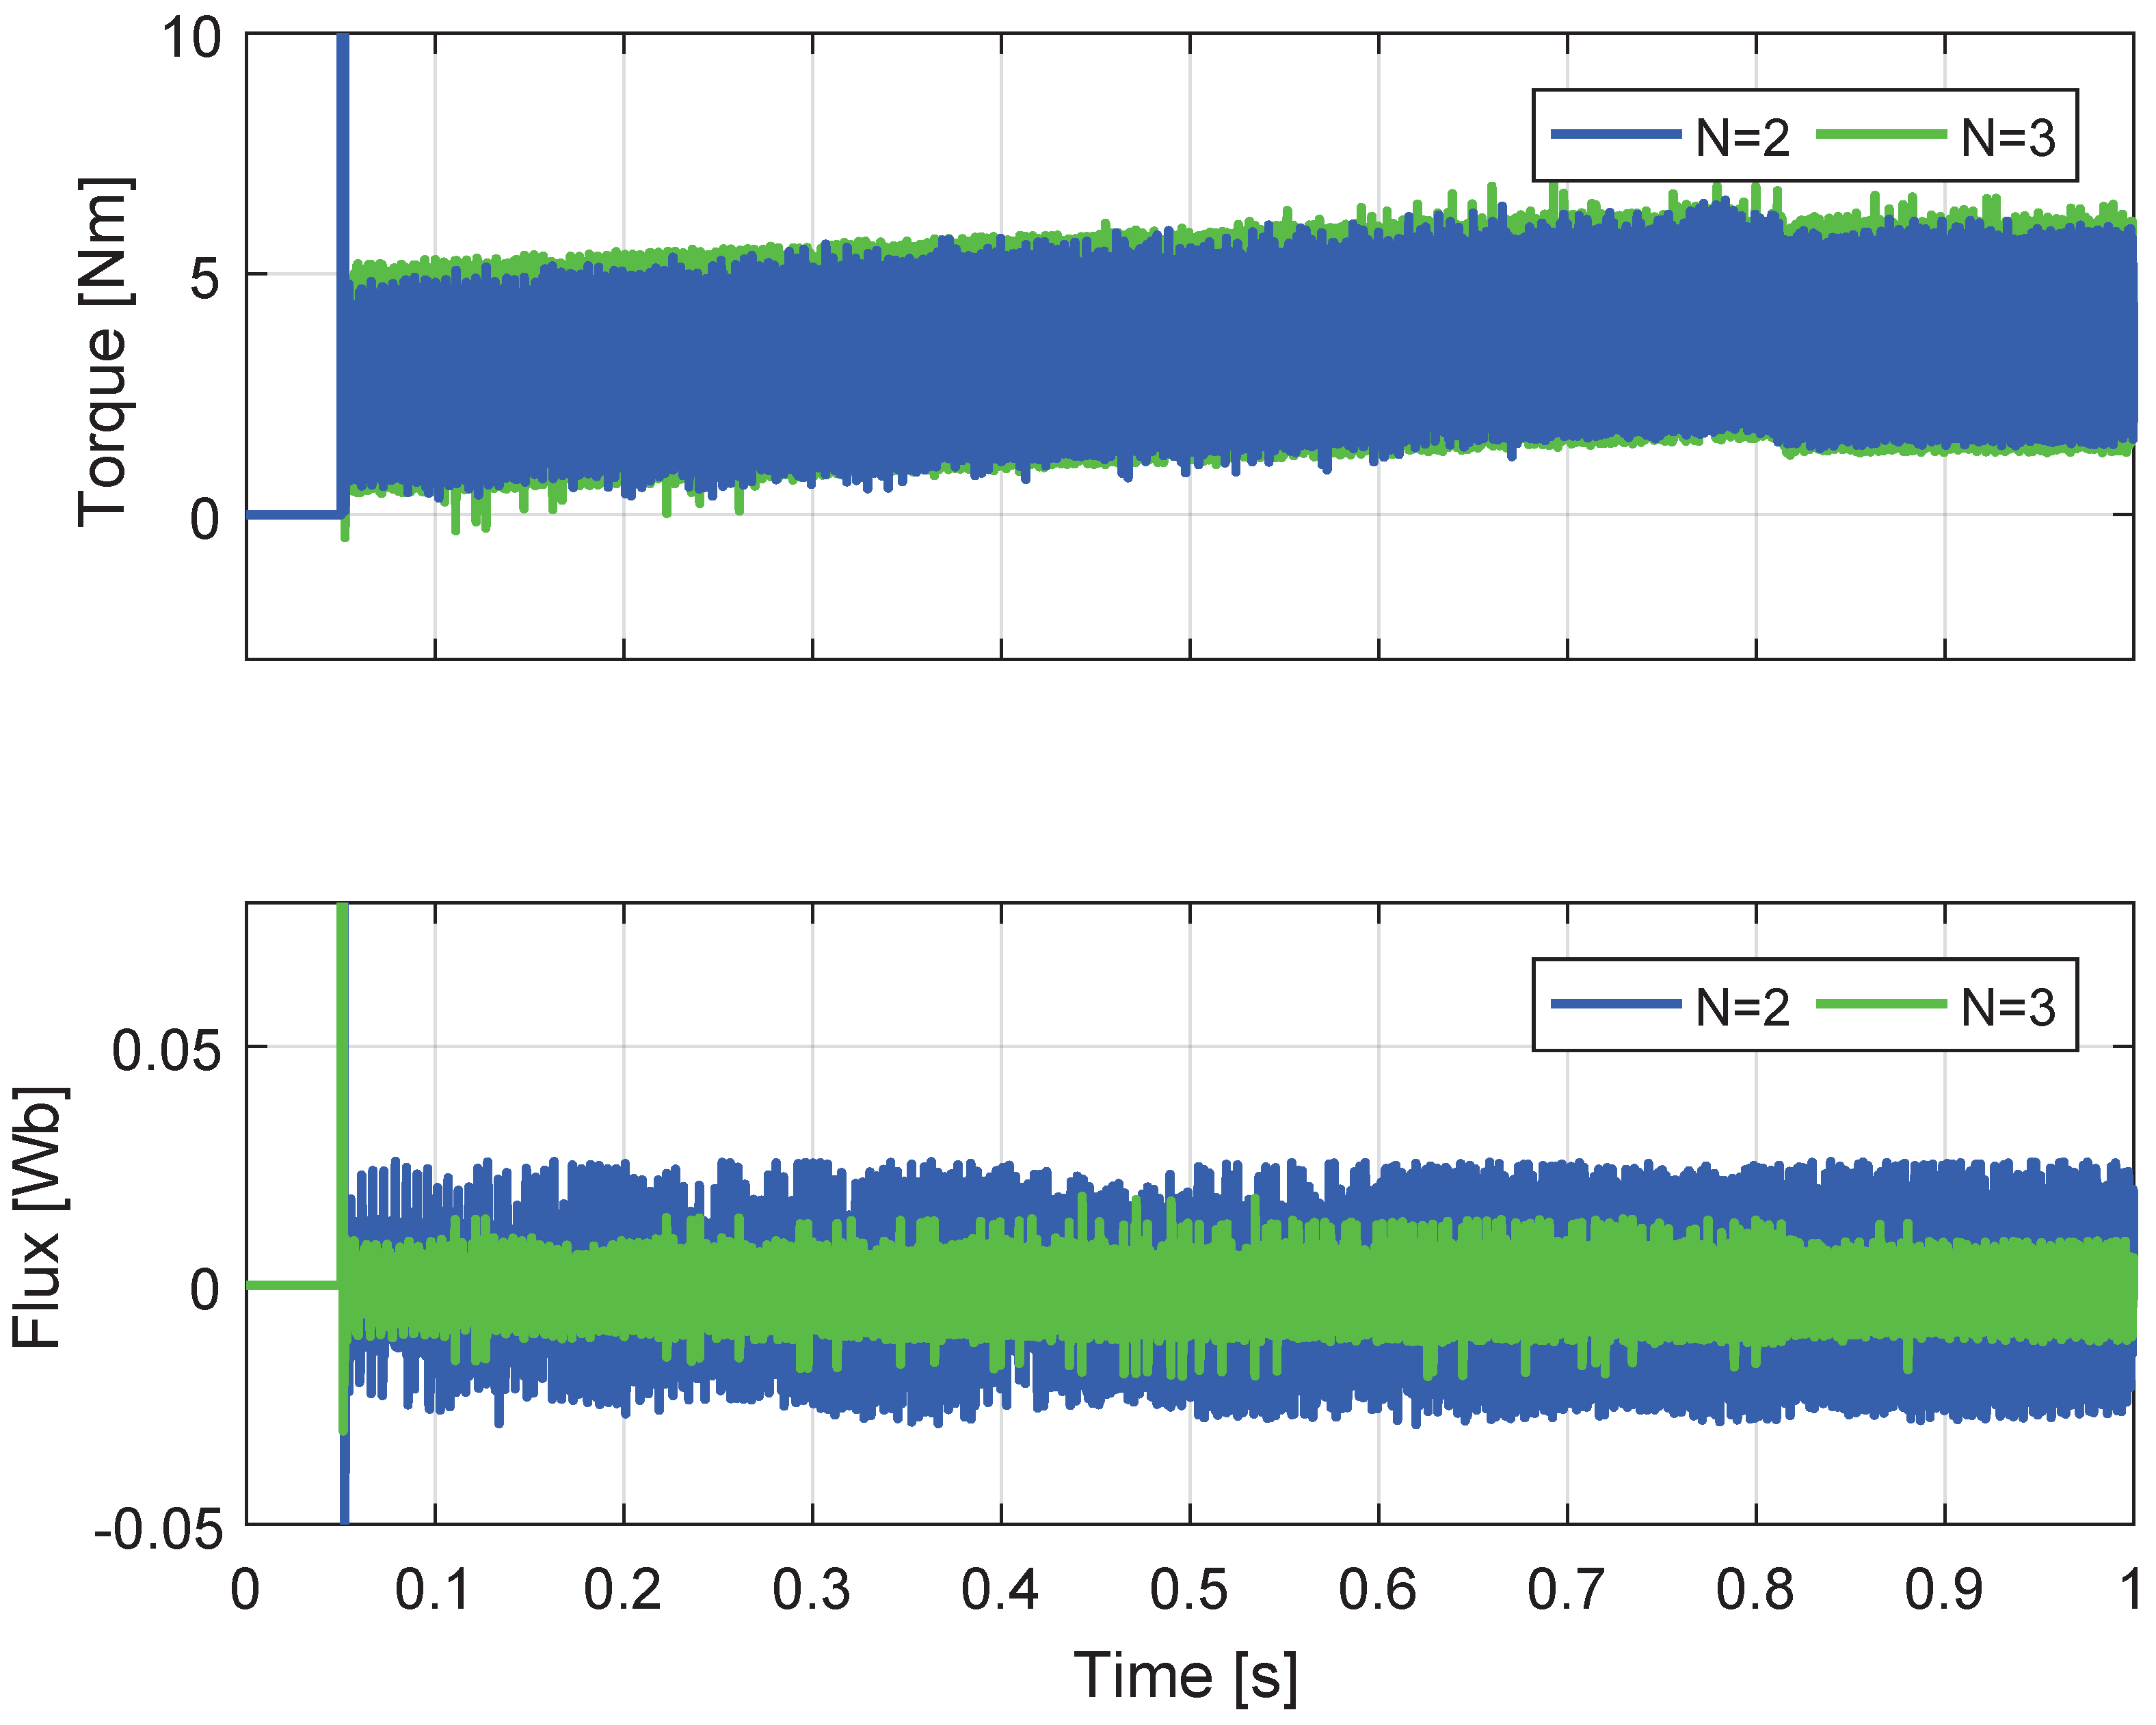
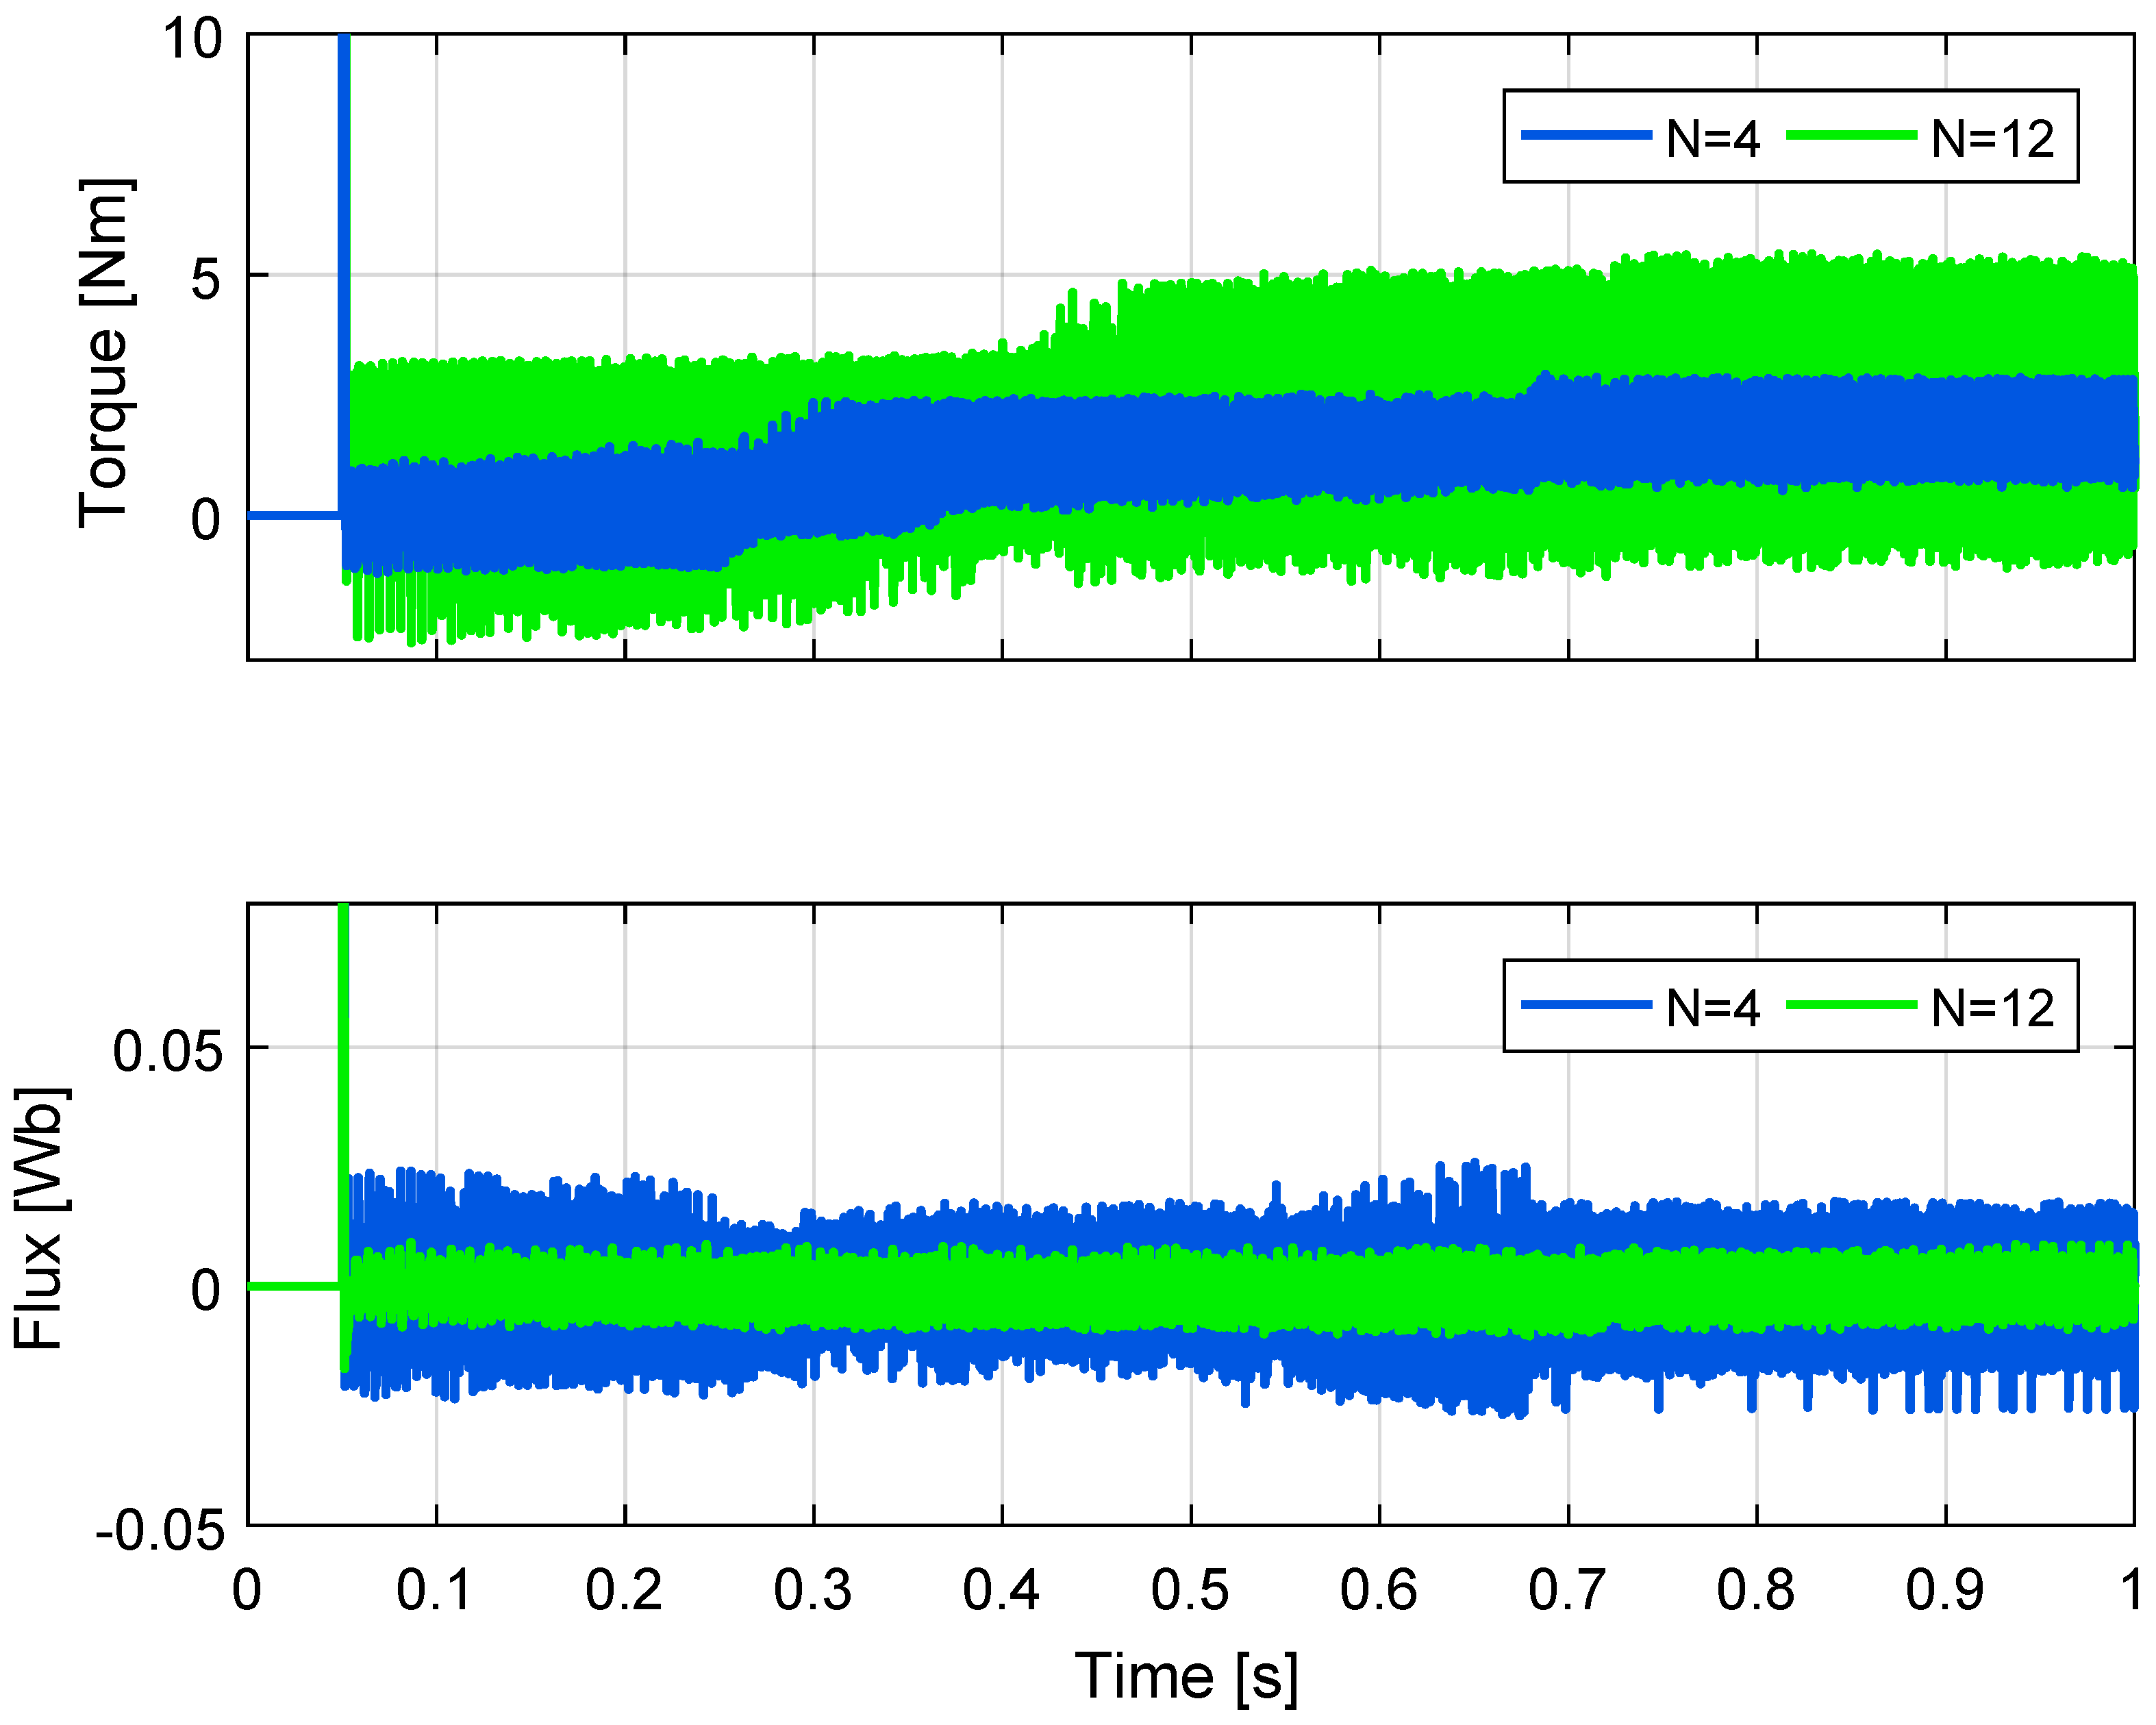
3.1. Simulations
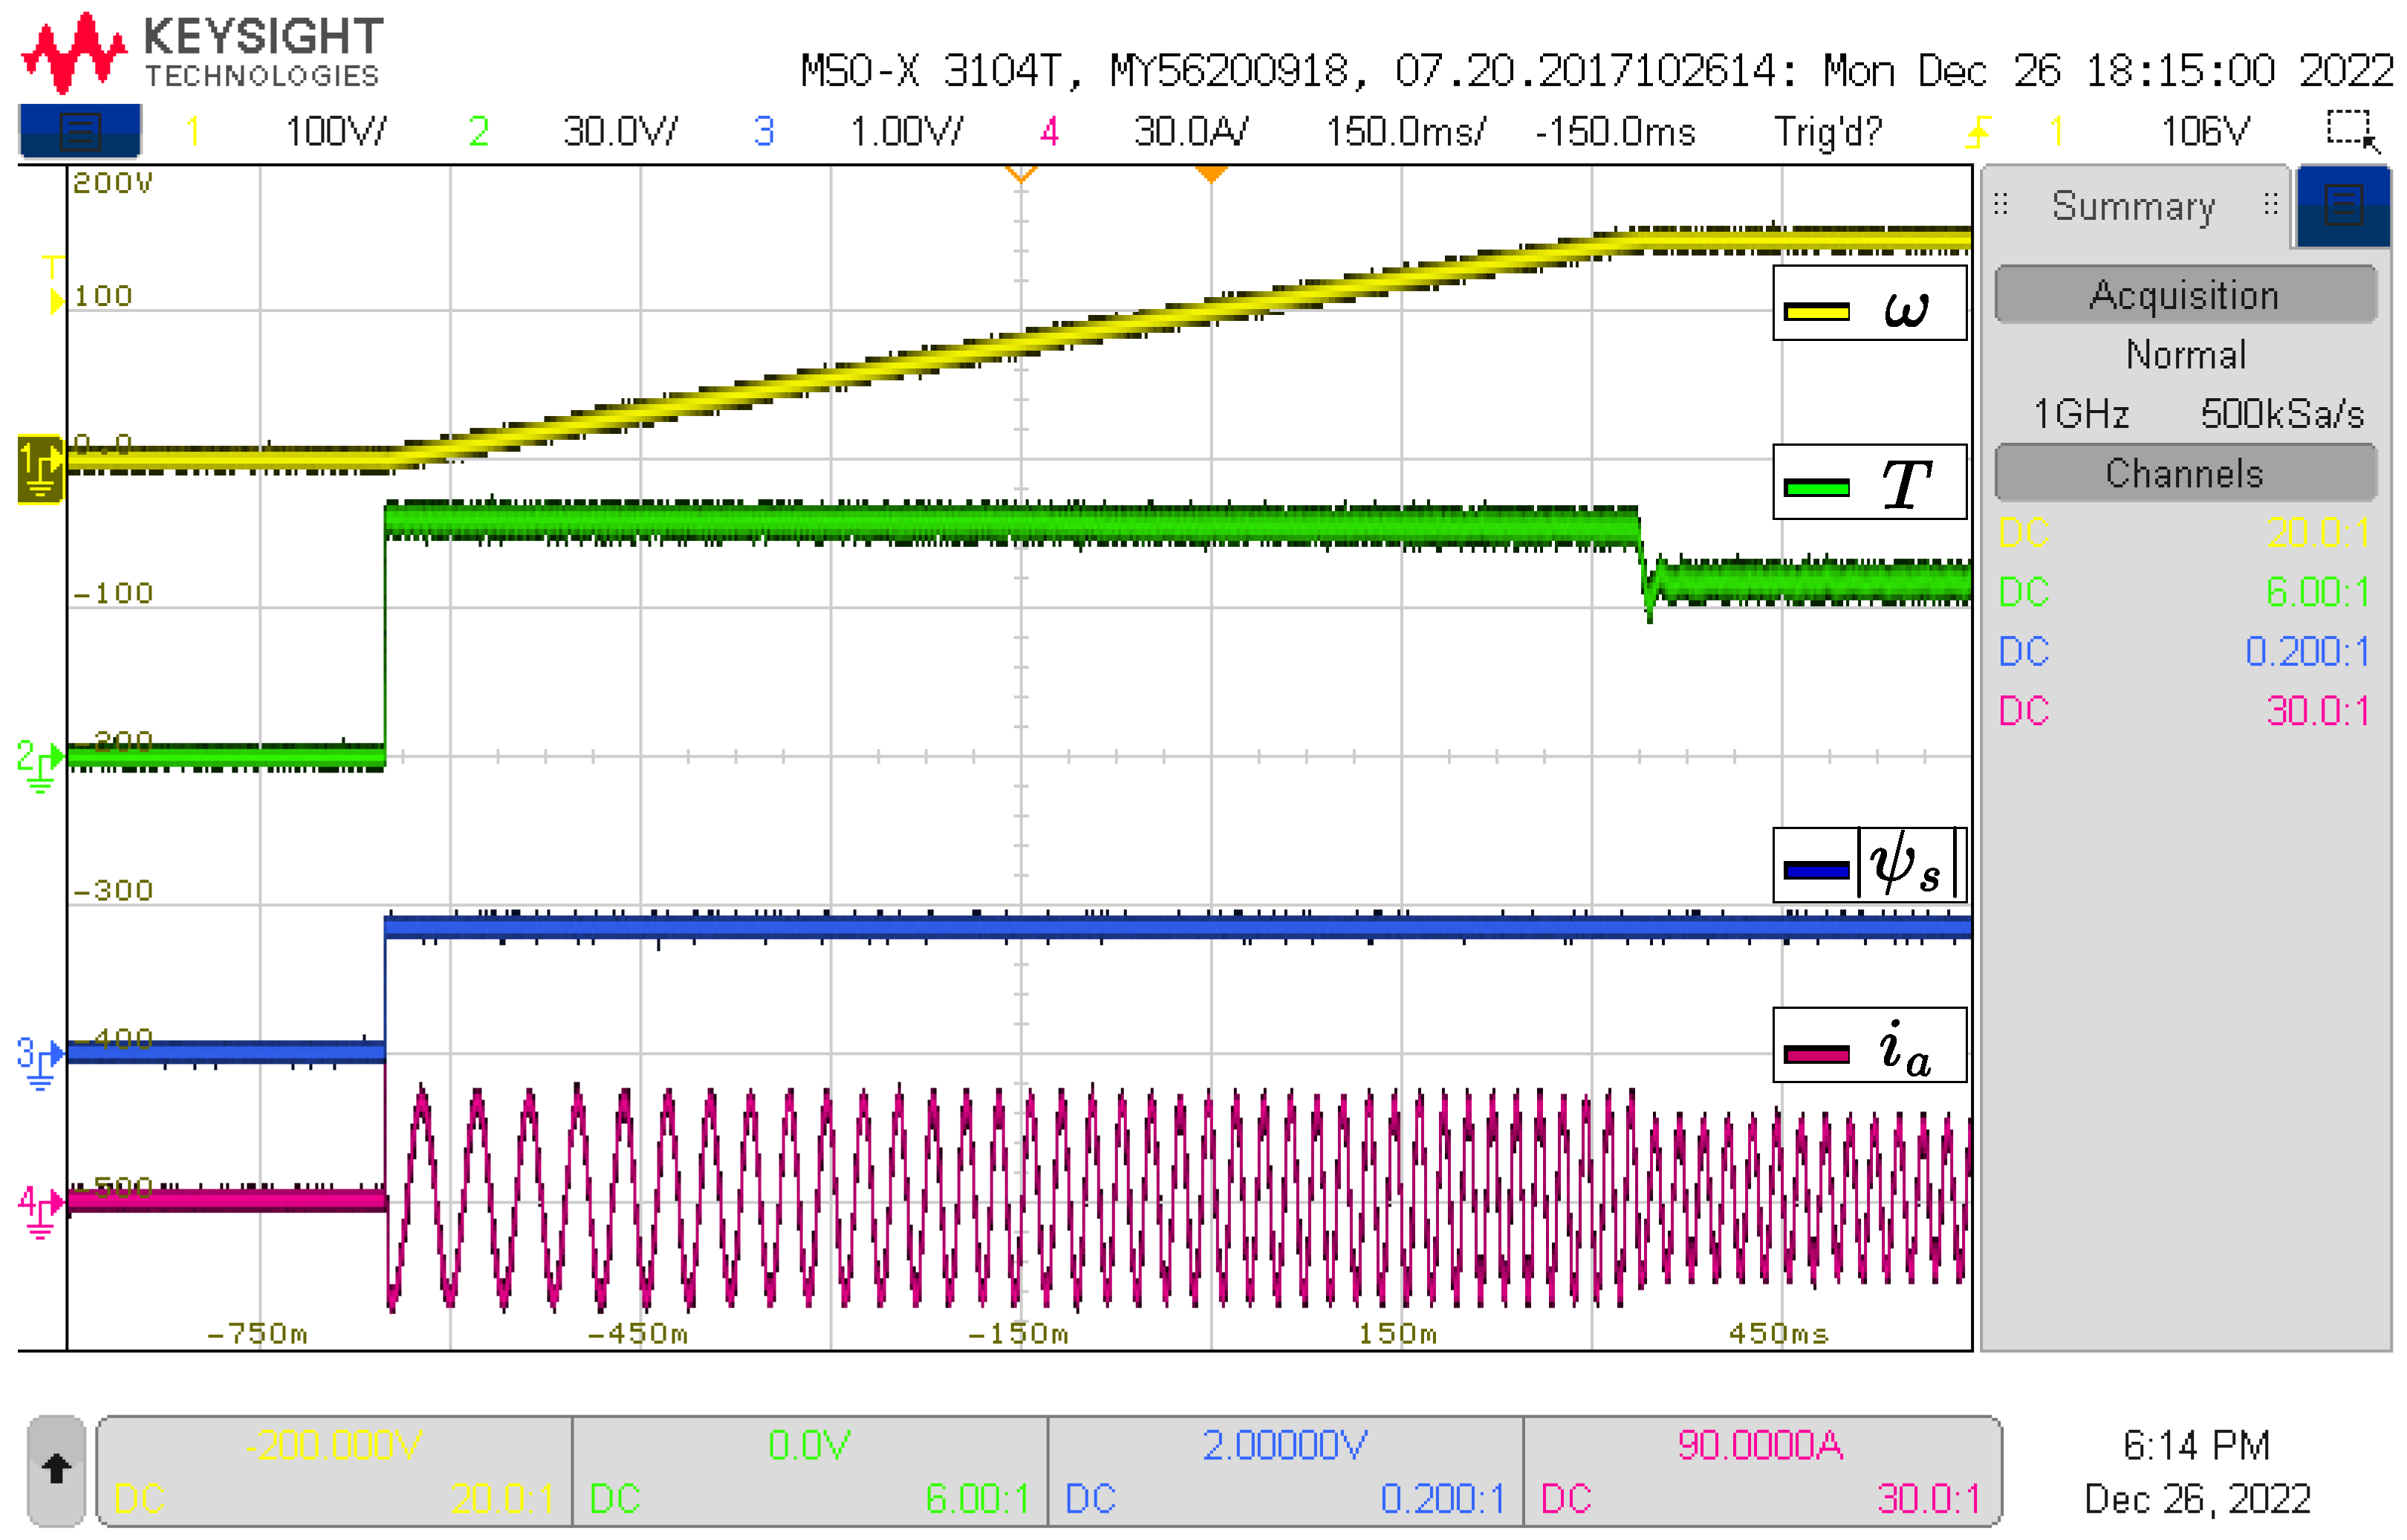
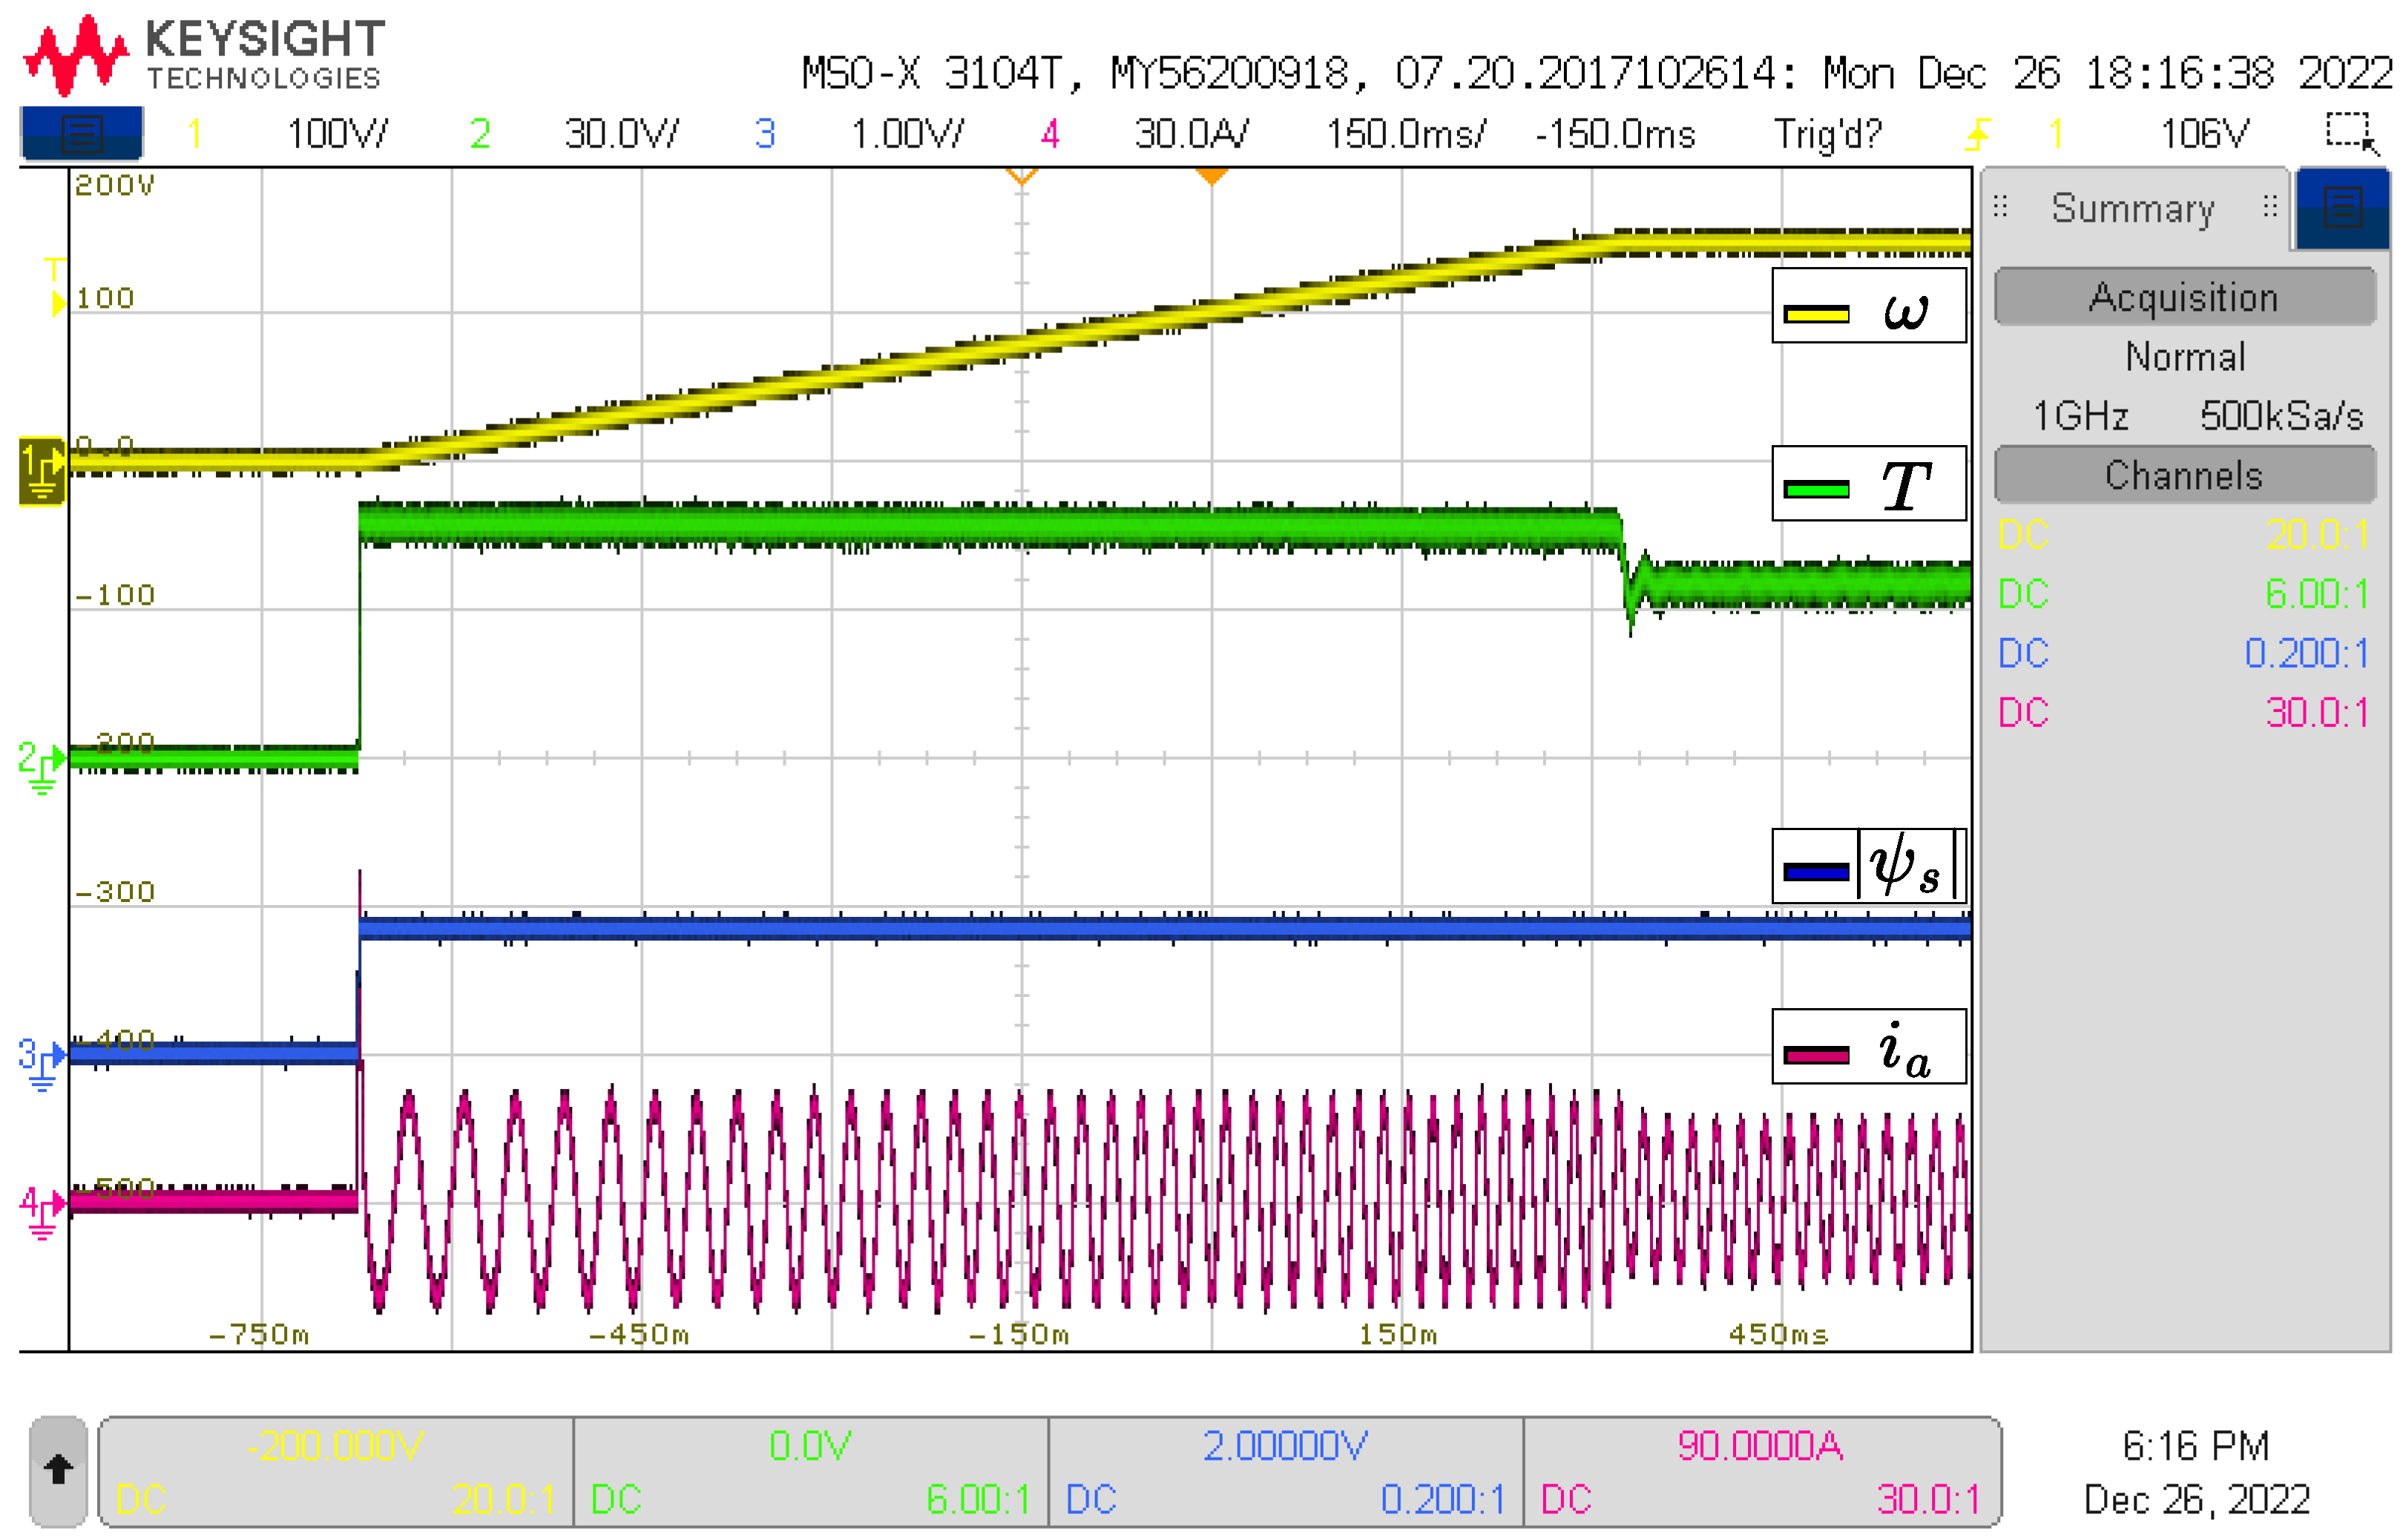
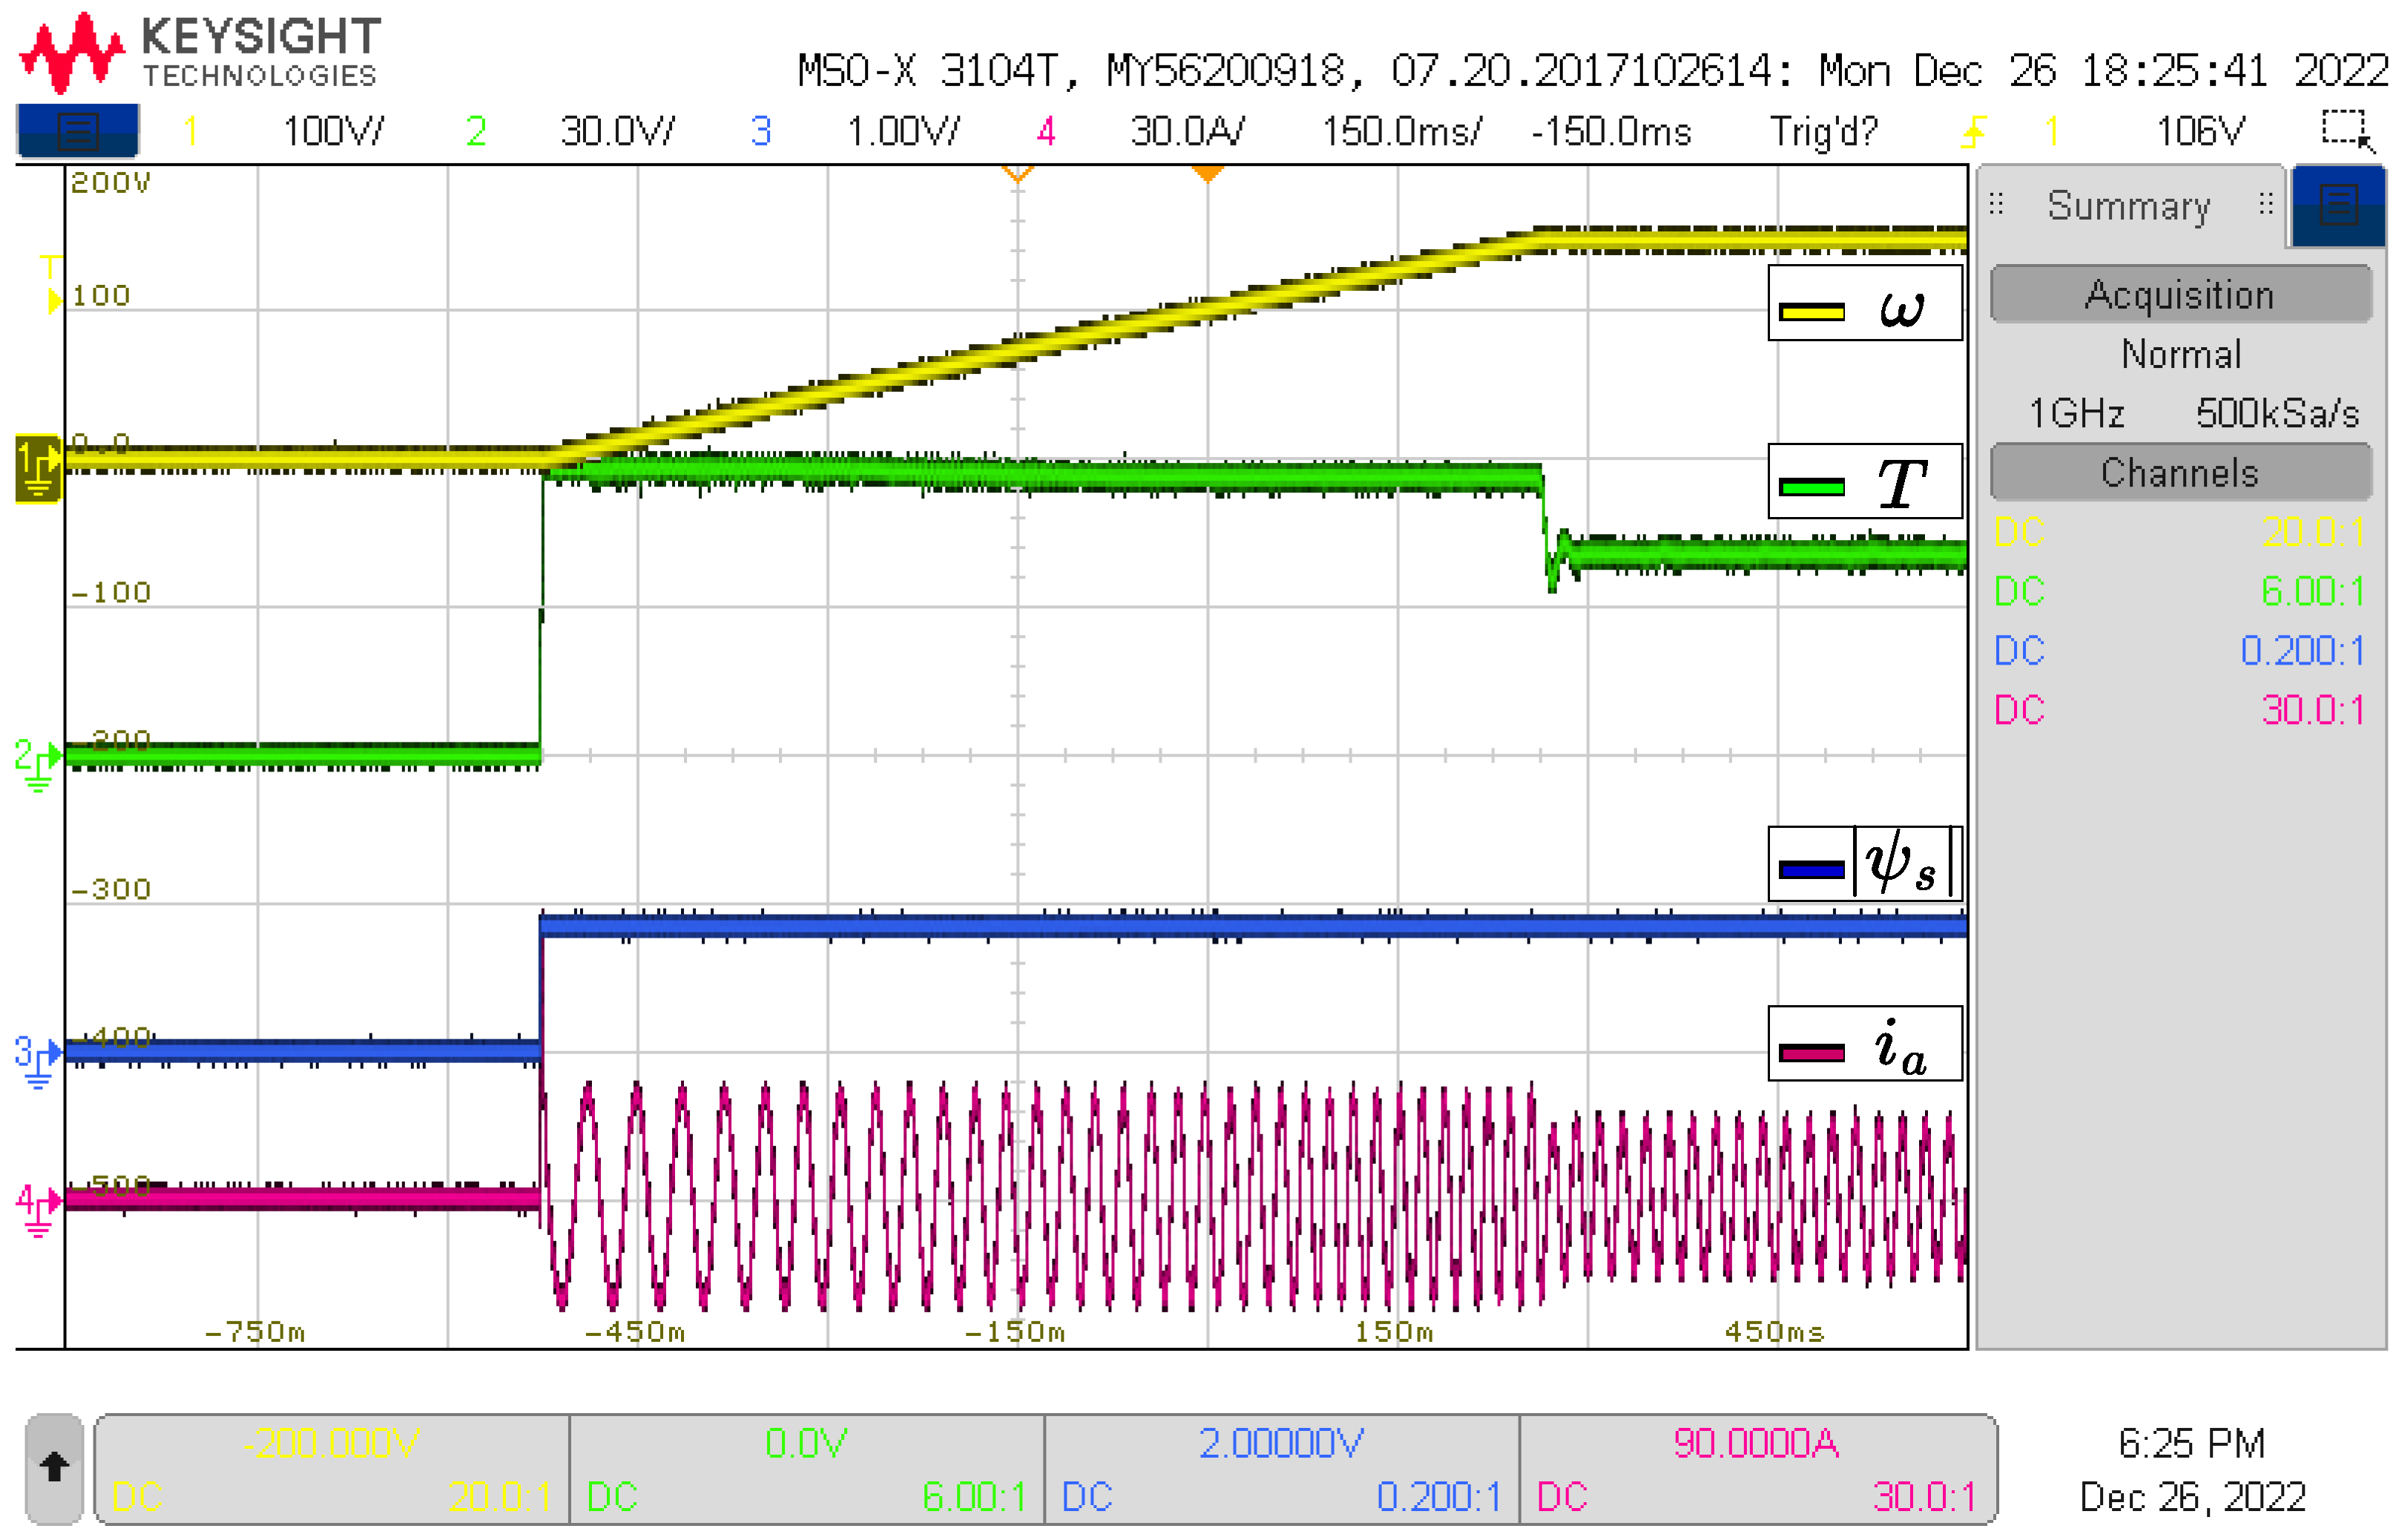
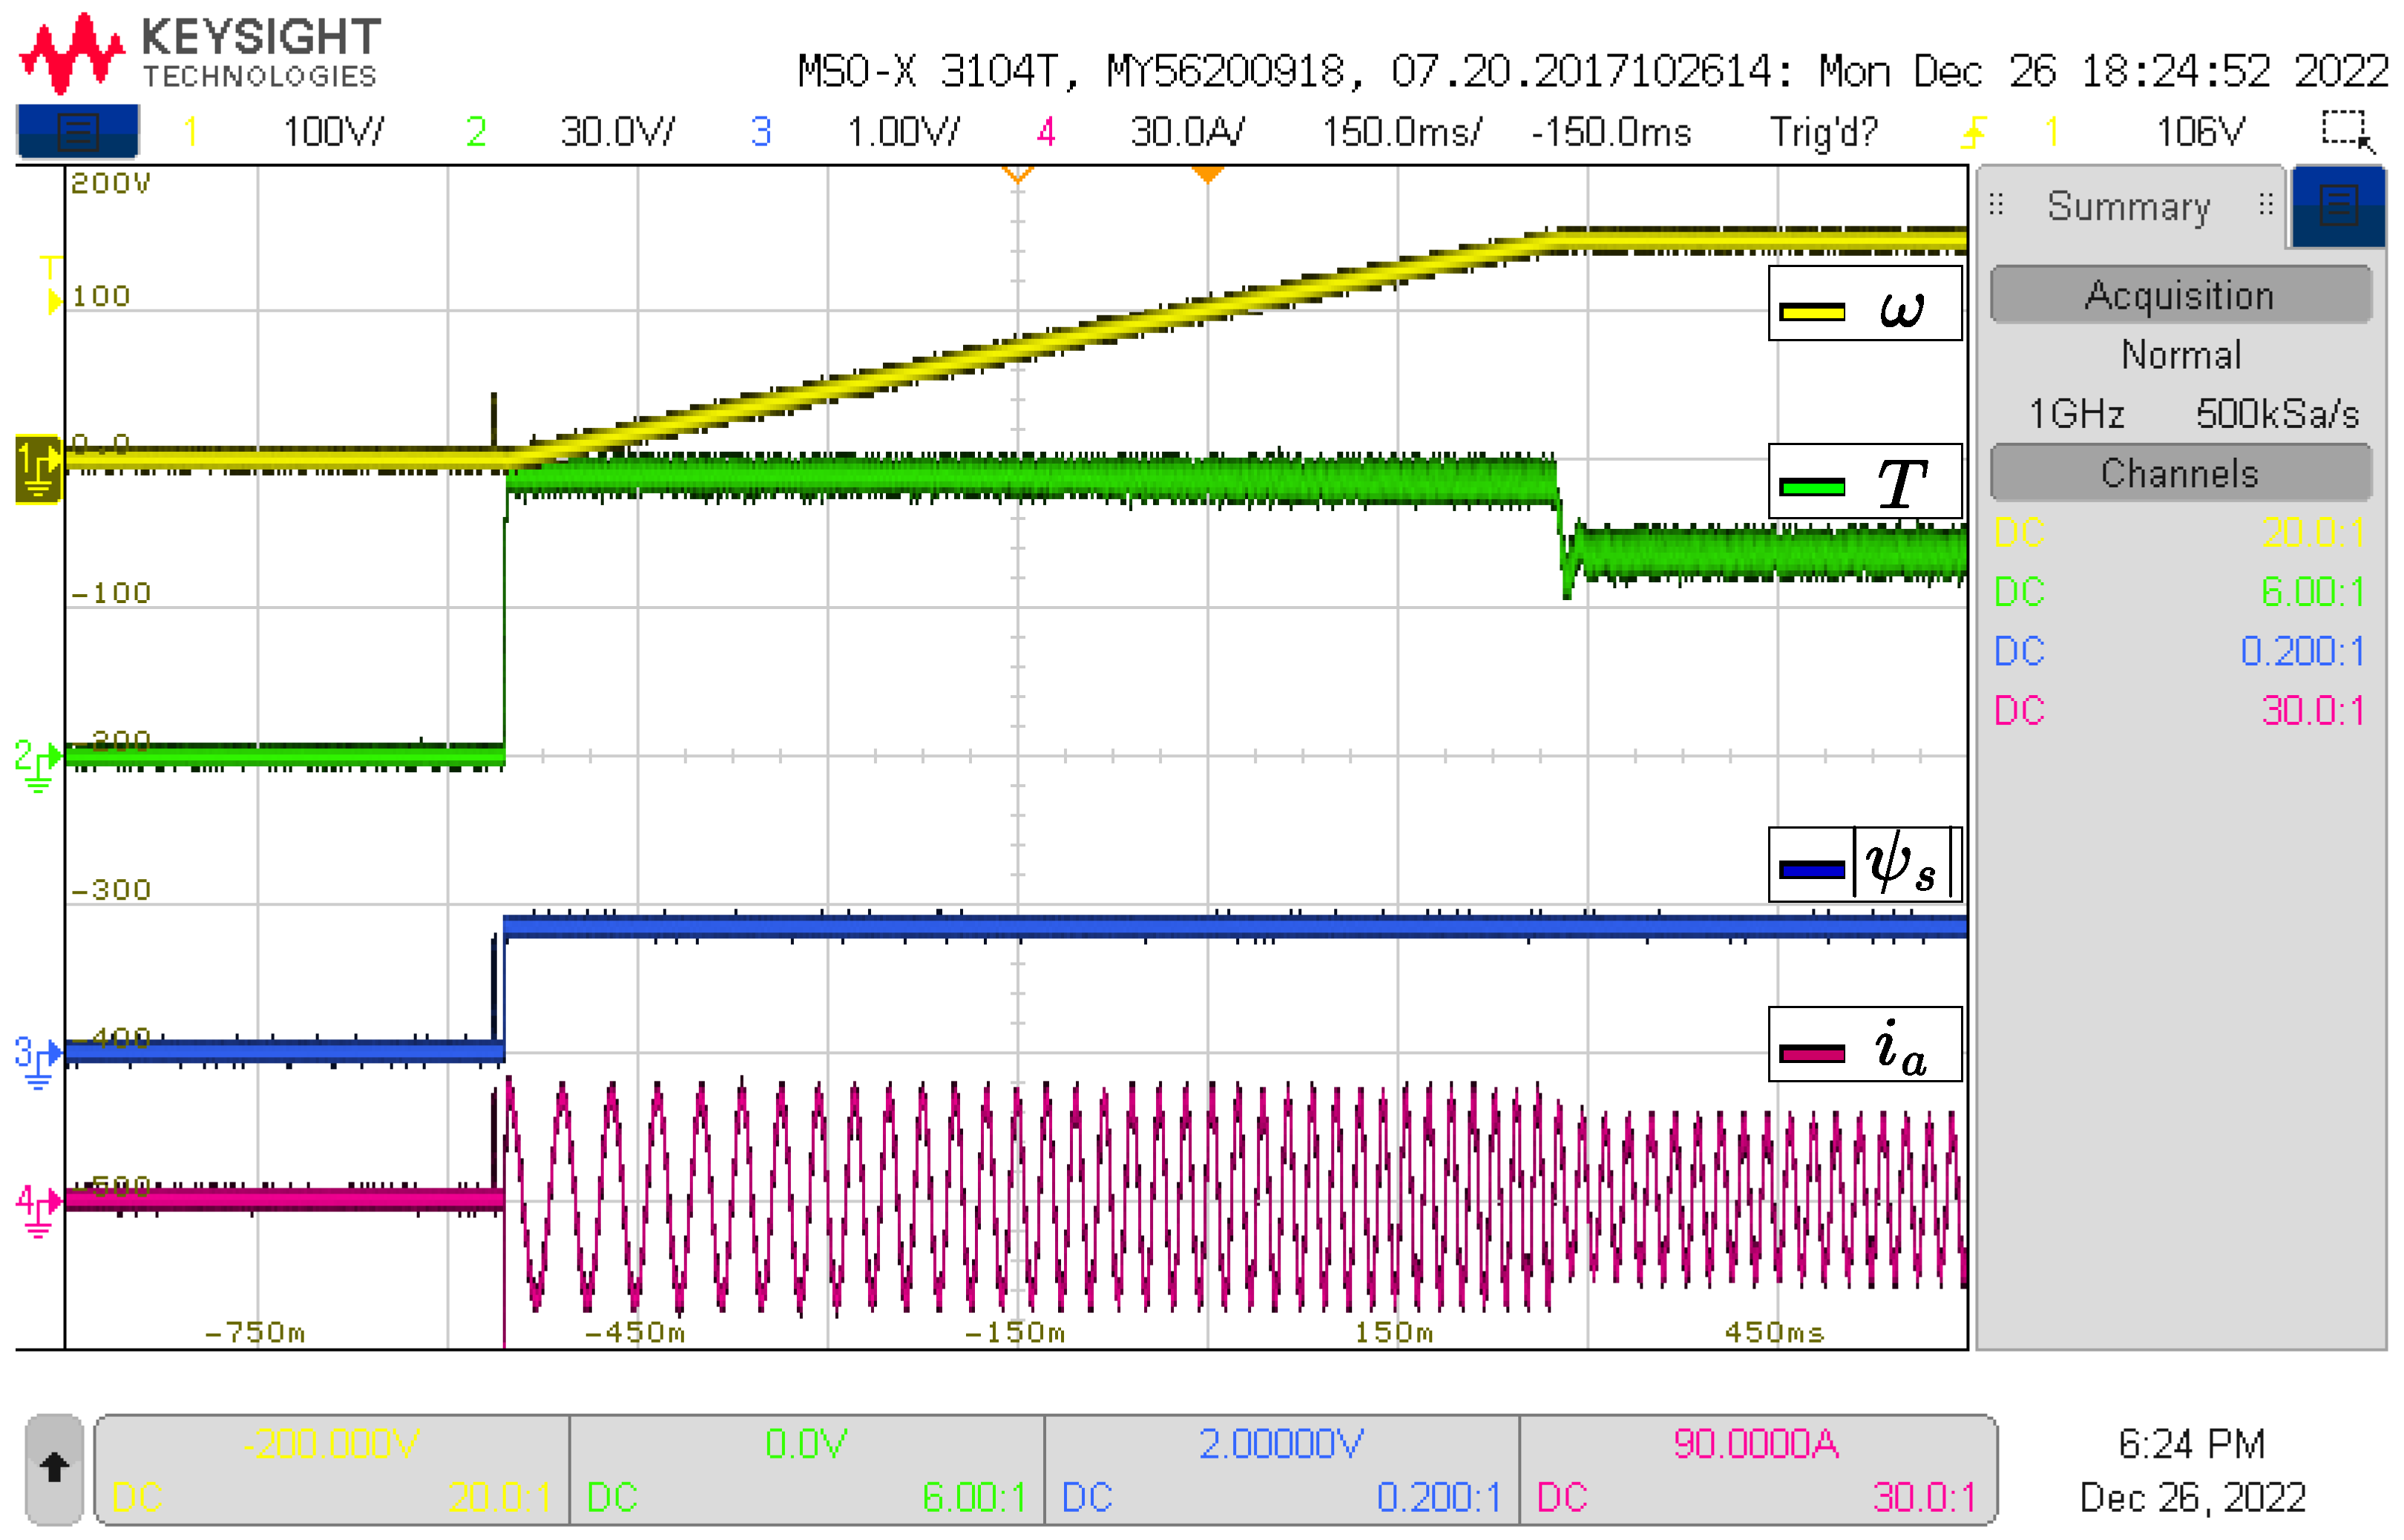
3.2. Experimental Results
4. Discussion
4.1. Simulation
4.1.1. Cost Functions Evaluation Order
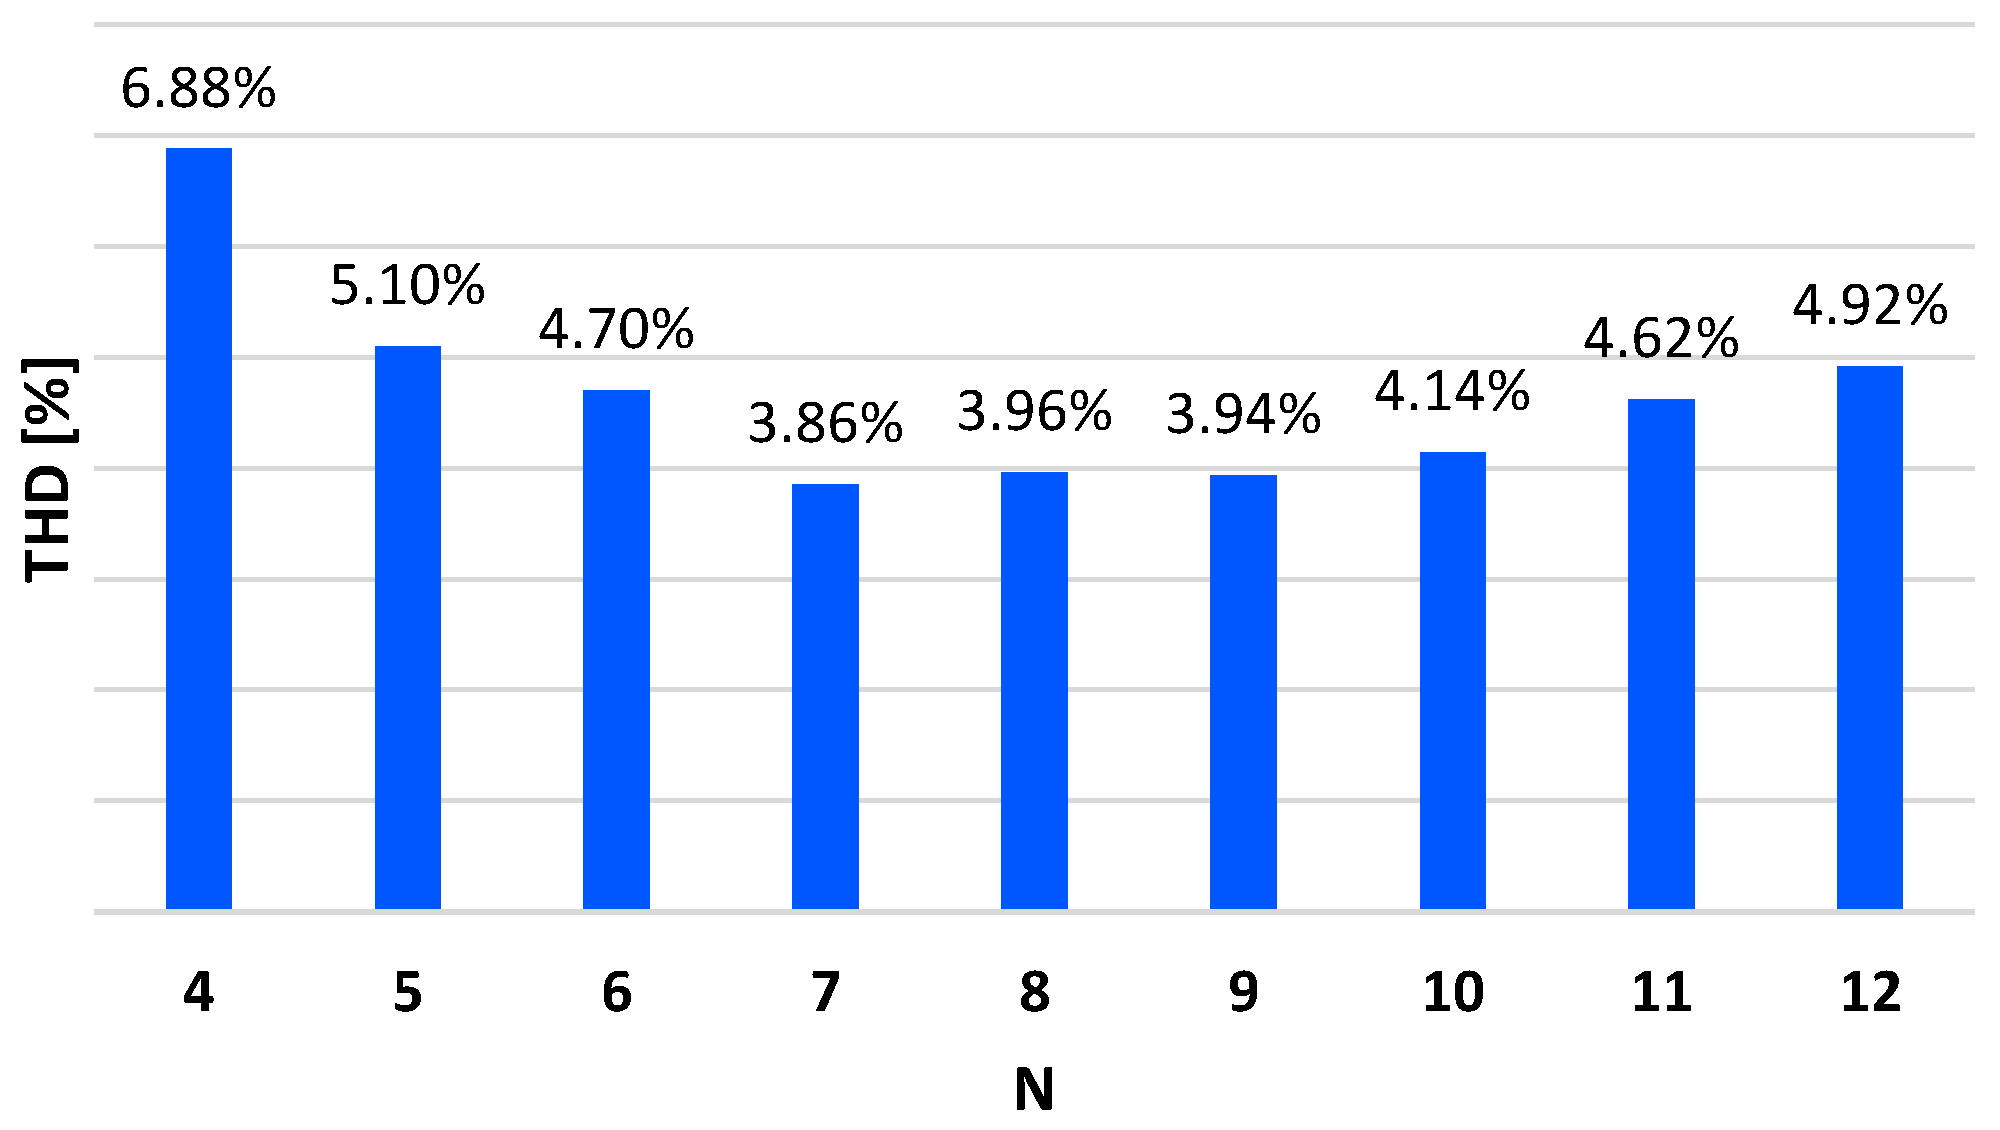
4.1.2. Control Parameter Domain
- VSI converters, .
- 3L-NPC converters, .
4.1.3. SMPC Performance According to Selected Parameter
4.2. Experimental Results
4.3. Limitation of the Proposed Approach
5. Conclusions
Author Contributions
Funding
Institutional Review Board Statement
Informed Consent Statement
Data Availability Statement
Conflicts of Interest
Abbreviations
| EH-SMPC | Even Handed Sequential Model Predictive Control. |
| EEH-SMPC | Enhanced Even Handed Sequential Model Predictive Control. |
| FS-MPC | Finite Set Model Predictive Control. |
| G-SMPC | Generalized Sequential Model Predictive Control. |
| HIL | Hardware-in-the-Loop. |
| IM | Induction Motor. |
| MPC | Model Predictive Control. |
| MVSCs | Multilevel Voltage Source Converters. |
| SMPC | Sequential Model Predictive Control. |
| VSI | Voltage Source Inverter. |
| 3L-NPC | Neutral Point Clamped converter of three levels. |
Nomenclature
| stator voltage. | |
| stator flux. | |
| rotor flux. | |
| stator current. | |
| rotor current. | |
| stator resistance. | |
| rotor resistance. | |
| stator inductance. | |
| rotor inductance. | |
| mutual inductance. | |
| w | electrical speed. |
| T | electromagnetic torque. |
| p | number of pole pairs. |
References
- Vazquez, S.; Leon, J.I.; Franquelo, L.G.; Rodriguez, J.; Young, H.A.; Marquez, A.; Zanchetta, P. Model Predictive Control: A Review of Its Applications in Power Electronics. IEEE Ind. Electron. Mag. 2014, 8, 16–31. [Google Scholar] [CrossRef]
- Rodriguez, J.; Garcia, C.; Mora, A.; Davari, S.A.; Rodas, J.; Valencia, D.F.; Elmorshedy, M.; Wang, F.; Zuo, K.; Tarisciotti, L.; et al. Latest Advances of Model Predictive Control in Electrical Drives-Part II: Applications and Benchmarking With Classical Control Methods. IEEE Trans. Power Electron. 2022, 37, 5047–5061. [Google Scholar] [CrossRef]
- Vazquez, S.; Rodriguez, J.; Rivera, M.; Franquelo, L.G.; Norambuena, M. Model Predictive Control for Power Converters and Drives: Advances and Trends. IEEE Trans. Ind. Electron. 2017, 64, 935–947. [Google Scholar] [CrossRef]
- Cortes, P.; Kouro, S.; La Rocca, B.; Vargas, R.; Rodriguez, J.; Leon, J.I.; Vazquez, S.; Franquelo, L.G. Guidelines for weighting factors design in Model Predictive Control of power converters and drives. In Proceedings of the 2009 IEEE International Conference on Industrial Technology, Churchill, VIC, Australia, 10–13 February 2009; pp. 1–7. [Google Scholar] [CrossRef]
- Zhang, K.; Fan, M.; Yang, Y.; He, L.; Li, X. Load Angle Limitation for PMSMs with Sequential Model Predictive Direct Torque Control. In Proceedings of the 2019 IEEE International Symposium on Predictive Control of Electrical Drives and Power Electronics (PRECEDE), Quanzhou, China, 31 May–2 June 2019; pp. 1–6. [Google Scholar] [CrossRef]
- Liu, Y.; Yang, Z.; Liu, X.; Dan, H.; Xiong, W.; Ling, T.; Su, M. Weighting factor design based on SVR–MOPSO for finite set MPC operated power electronic converters. J. Power Electron. 2022, 22, 1085–1099. [Google Scholar] [CrossRef]
- Vargas, R.; Cortes, P.; Ammann, U.; Rodriguez, J.; Pontt, J. Predictive Control of a Three-Phase Neutral-Point-Clamped Inverter. IEEE Trans. Ind. Electron. 2007, 54, 2697–2705. [Google Scholar] [CrossRef]
- Vodola, V.; Odhano, S.; Norambuena, M.; Garcia, C.; Vaschetto, S.; Zanchetta, P.; Rodriguez, J.; Bojoi, R. Sequential MPC Strategy for High Performance Induction Motor Drives: A detailed analysis. In Proceedings of the 2019 IEEE Energy Conversion Congress and Exposition (ECCE), Baltimore, MD, USA, 29 September–3 October 2019; pp. 6595–6600. [Google Scholar] [CrossRef]
- Osman, I.; Xiao, D.; Rahman, M.F. Two-Stage optimization based finite state predictive torque control for 3L-NPC inverter Fed IM drives. IET Electr. Power Appl. 2019, 13, 64–72. [Google Scholar] [CrossRef]
- Zhang, J.; Norambuena, M.; Li, L.; Dorrell, D.; Rodriguez, J. Sequential Model Predictive Control of Three-Phase Direct Matrix Converter. Energies 2019, 12, 214. [Google Scholar] [CrossRef]
- Norambuena, M.; Rodriguez, J.; Zhang, Z.; Wang, F.; Garcia, C.; Kennel, R. A Very Simple Strategy for High-Quality Performance of AC Machines Using Model Predictive Control. IEEE Trans. Power Electron. 2019, 34, 794–800. [Google Scholar] [CrossRef]
- Li, Y.; Zhang, Z.; Kamierkowski, M.P. Cascaded Predictive Control for Three-Level NPC Power Converter Fed Induction Machine Drives Without Weighting Factors. In Proceedings of the 2018 IEEE International Power Electronics and Application Conference and Exposition (PEAC), Shenzhen, China, 4–7 November 2018; pp. 1–5. [Google Scholar] [CrossRef]
- Acuña, P.; Morán, L.; Rivera, M.; Aguilera, R.; Burgos, R.; Agelidis, V.G. A Single-Objective Predictive Control Method for a Multivariable Single-Phase Three-Level NPC Converter-Based Active Power Filter. IEEE Trans. Ind. Electron. 2015, 62, 4598–4607. [Google Scholar] [CrossRef]
- Xiao, D.; Akter, M.P.; Alam, K.; Dutta, R.; Mekhilef, S.; Rahman, M.F. Cascaded Predictive Flux Control for a 3-L Active NPC Fed IM Drives Without Weighting Factor. IEEE Trans. Energy Convers. 2021, 36, 1797–1807. [Google Scholar] [CrossRef]
- Zhang, K.; Fan, M.; Yang, Y.; Chen, R.; Zhu, Z.; Garcia, C.; Rodriguez, J. Tolerant Sequential Model Predictive Direct Torque Control of Permanent Magnet Synchronous Machine Drives. IEEE Trans. Transp. Electrif. 2020, 6, 1167–1176. [Google Scholar] [CrossRef]
- Zhang, Y.; Zhang, B.; Yang, H.; Norambuena, M.; Rodriguez, J. Generalized Sequential Model Predictive Control of IM Drives With Field-Weakening Ability. IEEE Trans. Power Electron. 2019, 34, 8944–8955. [Google Scholar] [CrossRef]
- Davari, S.A.; Norambuena, M.; Nekoukar, V.; Garcia, C.; Rodriguez, J. Even-Handed Sequential Predictive Torque and Flux Control. IEEE Trans. Ind. Electron. 2020, 67, 7334–7342. [Google Scholar] [CrossRef]
- Wang, Z.; Guo, H.; Ping, Z.; Wang, Y.; Zhang, Z. Revised Sequential Predictive Torque Control with Adaptability under Multiple Operating Conditions for Induction Motors Drives. In Proceedings of the 2021 IEEE International Conference on Predictive Control of Electrical Drives and Power Electronics (PRECEDE), Jinan, China, 20–22 November 2021; pp. 502–506. [Google Scholar] [CrossRef]
- Wu, W.; Wang, D.; Liu, L. A Multi-Layer Sequential Model Predictive Control of Three-Phase Two-Leg Seven-Level T-Type Nested Neutral Point Clamped Converter Without Weighting Factors. IEEE Access 2019, 7, 162735–162746. [Google Scholar] [CrossRef]
- Aouichak, I.; Jacques, S.; Bissey, S.; Reymond, C.; Besson, T.; Le Bunetel, J.C. A Bidirectional Grid-Connected DC-AC Converter for Autonomous and Intelligent Electricity Storage in the Residential Sector. Energies 2022, 15, 1194. [Google Scholar] [CrossRef]
- Dekka, A.; Wu, B.; Fuentes, R.L.; Perez, M.; Zargari, N.R. Evolution of Topologies, Modeling, Control Schemes, and Applications of Modular Multilevel Converters. IEEE J. Emerg. Sel. Top. Power Electron. 2017, 5, 1631–1656. [Google Scholar] [CrossRef]
- Wang, Y.; Zhang, Z.; Huang, W.; Kennel, R.; Xie, W.; Wang, F. Encoderless Sequential Predictive Torque Control with SMO of 3L-NPC Converter-fed Induction Motor Drives for Electrical Car Applications. In Proceedings of the 2019 IEEE International Symposium on Predictive Control of Electrical Drives and Power Electronics (PRECEDE), Quanzhou, China, 31 May–2 June 2019; pp. 1–6. [Google Scholar] [CrossRef]
- Liu, X.; Zhang, Z.; Gao, F.; Norambuena, M.; Rodríguez, J.; Yavas, O.; Kennel, R. Sequential direct model predictive control for gird-tied three-level NPC power converters. In Proceedings of the 2018 IEEE International Power Electronics and Application Conference and Exposition (PEAC), Shenzhen, China, 4–7 November 2018; pp. 1–5. [Google Scholar]
- Cui, Z.; Zhang, Z.; Yang, Q.; Kennel, R. Cascaded model predictive control of three-level NPC back-to-back power converter PMSG wind turbine systems. In Proceedings of the 2018 IEEE International Power Electronics and Application Conference and Exposition (PEAC), Shenzhen, China, 4–7 November 2018; pp. 1–6. [Google Scholar]
- Zhang, J.; Li, L.; Norambuena, M.; Rodriguez, J.; Dorrell, D.G. Sequential model predictive control of direct matrix converter without weighting factors. In Proceedings of the IECON 2018—44th Annual Conference of the IEEE Industrial Electronics Society, Washington, DC, USA, 21–23 October 2018; pp. 1477–1482. [Google Scholar]
- Donoso, F.; Mora, A.; Cárdenas, R.; Angulo, A.; Sáez, D.; Rivera, M. Finite-Set Model-Predictive Control Strategies for a 3L-NPC Inverter Operating With Fixed Switching Frequency. IEEE Trans. Ind. Electron. 2018, 65, 3954–3965. [Google Scholar] [CrossRef]
- Fitzgerald, A.E.; Kingsley, C.; Umans, S.D.; James, B. Electric Machinery; McGraw-Hill: New York, NY, USA, 2003; Volume 5. [Google Scholar]
- Rodriguez, J.; Cortes, P. Predictive Control of Power Converters and Electrical Drives; John Wiley & Sons: Hoboken, NJ, USA, 2012; Volume 40. [Google Scholar]


| Parameters | Value |
|---|---|
| 1500 V | |
| 1.35 | |
| 7.2 | |
| 0.2861 H | |
| 0.2861 H | |
| 0.2822 H |
| Power Converter | VSI | 3L-NPC | ||
|---|---|---|---|---|
| Parameter | ||||
| Peak current [Ap] | 15.49 | 15.67 | 15.49 | 15.89 |
| THD [%] | 9.52 | 5.48 | 6.88 | 4.92 |
| Fundamental frequency [Hz] | 67.15 | 66.83 | 67.89 | 66.57 |
| Fundamental component [Ap] | 14.76 | 14.69 | 14.83 | 14.75 |
| Main harmonics | 470.0 Hz 0.29 Ap | 133.7 Hz 0.19 Ap | 539.4 Hz 0.22 Ap | 466.0 Hz 0.32 Ap |
| 872.9 Hz 0.14 Ap | 468.0 Hz 0.18 Ap | 746.7 Hz 0.22 Ap | 133.1 Hz 0.30 Ap | |
| 335.7 Hz 0.13 Ap | 334.3 Hz 0.17 Ap | 882.5 Hz 0.17 Ap | 732.3 Hz 0.30 Ap | |
| VSI | 3L-NPC | |||
|---|---|---|---|---|
| Approach | ||||
| Simulation | 0.80 | 0.81 | 0.66 | 0.72 |
| HIL | 0.96 | 0.97 | 0.77 | 0.80 |
Disclaimer/Publisher’s Note: The statements, opinions and data contained in all publications are solely those of the individual author(s) and contributor(s) and not of MDPI and/or the editor(s). MDPI and/or the editor(s) disclaim responsibility for any injury to people or property resulting from any ideas, methods, instructions or products referred to in the content. |
© 2023 by the authors. Licensee MDPI, Basel, Switzerland. This article is an open access article distributed under the terms and conditions of the Creative Commons Attribution (CC BY) license (https://creativecommons.org/licenses/by/4.0/).
Share and Cite
Murillo-Yarce, D.; Araya, B.; Restrepo, C.; Rivera, M.; Wheeler, P. Impact of Sequential Model Predictive Control on Induction Motor Performance: Comparison of Converter Topologies. Mathematics 2023, 11, 972. https://doi.org/10.3390/math11040972
Murillo-Yarce D, Araya B, Restrepo C, Rivera M, Wheeler P. Impact of Sequential Model Predictive Control on Induction Motor Performance: Comparison of Converter Topologies. Mathematics. 2023; 11(4):972. https://doi.org/10.3390/math11040972
Chicago/Turabian StyleMurillo-Yarce, Duberney, Baldomero Araya, Carlos Restrepo, Marco Rivera, and Patrick Wheeler. 2023. "Impact of Sequential Model Predictive Control on Induction Motor Performance: Comparison of Converter Topologies" Mathematics 11, no. 4: 972. https://doi.org/10.3390/math11040972
APA StyleMurillo-Yarce, D., Araya, B., Restrepo, C., Rivera, M., & Wheeler, P. (2023). Impact of Sequential Model Predictive Control on Induction Motor Performance: Comparison of Converter Topologies. Mathematics, 11(4), 972. https://doi.org/10.3390/math11040972